HIV AIDS Chartbook India 2007

HIV AIDS Chartbook India 2007


1 Pages 1-10

▲back to top


1.1 Page 1

▲back to top


HIV/AIDS
in
INDIA
Population Foundation of India
¬Êڬȋ‡ÊŸ »§Ê©¢U«U‡ÊŸ •ÊÚ»§ ßÁá«UÿÊ
Joint United Nations Programme on HIV/AIDS (UNAIDS)
∞ø •Ê߸U flË/∞«˜U‚ ¬⁄U ‚¢ÿÈÄà ⁄UÊc≈˛U ∑§Êÿ¸∑˝§◊ (ÿÍ∞Ÿ∞«˜U‚)
Population Reference Bureau
¬Êڬȋ‡ÊŸ ⁄U»§⁄Uã‚ éÿÍ⁄UÊ
Second Edition 2007
ŒÍ‚⁄UÊ ‚¢S∑§⁄UáÊ 2007
June 2007
¡ÍŸ wÆÆ|

1.2 Page 2

▲back to top


1.3 Page 3

▲back to top


Second Edition 2007
ŒÍ‚⁄UÊ ‚¢S∑§⁄UáÊ 2007
June 2007
¡ÍŸ wÆÆ|

1.4 Page 4

▲back to top


TABLE OF CONTENTS
Foreword ............................................................................................... 3
HIV/AIDS in India ................................................................................. 5
HIV/AIDS: A Global Overview ............................................................. 6
India’s Sentinel Sites ............................................................................ 8
Reported AIDS Cases .......................................................................11
HIV/AIDS Spreads across India ........................................................ 12
Awareness of HIV/AIDS ..................................................................... 16
Knowledge and Use of the Condom .................................................18
Sexual Behaviour ...............................................................................20
The Role of Sexually-transmitted Disease ........................................ 22
Commercial Sex Work ....................................................................... 24
Testing for Infection ............................................................................ 26
Exposure to and Beliefs on HIV/AIDS Issues .................................. 27
India Responds to HIV/AIDS ............................................................. 32
UNAIDS Activities in India ................................................................. 37
Glossary .............................................................................................. 38
Statistical Appendix ............................................................................ 39
2
Áfl·ÿ ‚ÍøË
¬˝ÊÄ∑§ÕŸ ................................................................................................... 3
÷Ê⁄Uà ◊¥ ∞ø •Ê߸U flË/∞«˜U‚ .............................................................................. 5
∞ø •Ê߸U flË/∞«˜U‚ — Áfl‡fl ∑§Ê ¬Á⁄UŒÎ‡ÿ ................................................................ 6
÷Ê⁄Uà ◊¥ ⁄UˇÊÊ ∑§ãº˝ (¡Ê°ø ∑§ãº˝) ..................................................................... 8
∞«˜U‚ ∑§ Œ¡¸ ∑§‚ ....................................................................................... 11
÷Ê⁄Uà ◊¥ ∞ø •Ê߸U flË/∞«˜U‚ ∑§Ê »Ò§‹Êfl ..............................................................12
∞ø •Ê߸U flË/∞«˜U‚ ◊¥ ¡ÊªM§∑§ÃÊ .....................................................................16
∑§á«UÙ◊ ∑§Ë ¡ÊŸ∑§Ê⁄UË •ı⁄U ¬˝ÿÊª .....................................................................18
ÿÊÒŸ √ÿfl„UÊ⁄U ............................................................................................. 20
ÿıŸ ‚¢øÊÁ⁄Uà ⁄U٪٥ ∑§Ë ÷ÍÁ◊∑§Ê ........................................................................ 22
√ÿÊfl‚ÊÁÿ∑§ ÿıŸ ∑§Êÿ¸ ................................................................................. 24
‚¢∑˝§◊áÊ ∑§Ë ¡Ê°ø ........................................................................................ 26
∞ø •Ê߸U flË/∞«˜U‚ ‚¢’¢Áœ ◊ÈŒ˜ŒÙ¥ ¬⁄U ¡ÊŸ∑§Ê⁄UË •ı⁄U Áfl‡flÊ‚ ......................................27
∞ø •Ê߸U flË/∞«˜U‚ ∑§ ¬˝Áà ÷Ê⁄Uà ∑§Ê ¡flÊ’ ......................................................... 32
÷Ê⁄Uà ◊ ÿÍ ∞Ÿ ∞«˜U‚ ∑§ ∑§Êÿ¸∑˝§◊ ......................................................................... 37
‡ÊéŒ∑§Ê· ........................................................................................................ 38
‚Ê¢Å∑§Ëÿ ¬Á⁄UÁ‡Êc≈U ............................................................................................ 39

1.5 Page 5

▲back to top


FOREWORD
¬˝ÊÄ∑§ÕŸ
HIV/AIDS has come to India and India has taken up the fight against
it. India recognized the dangers of this incurable disease early on.
It is true that India is considered a low HIV prevalence country.
That presents us with both an opportunity and a danger. We have
the opportunity to turn back HIV before it becomes a true epidemic.
The danger is that low prevalence can lead to complacency, one of
HIV’s most powerful allies.
The fight against HIV has and will have many aspects. Information
about the existence of the disease and how it is contracted must be
universal. Factual information can end the terrible stigma associated
with HIV, as ignorance breeds fear. With treatment, HIV-positive
people can live satisfying, useful lives in their village or city. The fight
against stigma, must, however, be fought at all levels of society and
by all in a position to educate and inform.
The task is a large one. Bringing HIV knowledge as well as care and
support to a vast, largely rural, population is a true challenge. But, led
by the National AIDS Control Organisation and the State AIDS
Control Societies, the battle has been fully joined.
We hope that this second edition of the chartbook, brought out by
the Population Foundation of India, New Delhi and the Population
Reference Bureau, Washington, D.C., will play a role in disseminating
the facts that underlie HIV in India. This project was funded through
the generosity of the Joint United Nations Programme on HIV/AIDS
(UNAIDS), India office.
∞ø •Ê߸ flË/∞«˜U‚ ÷Ê⁄Uà Ã∑§ •Ê ¬„È¢UøÊ „ÒU •ı⁄U ÷Ê⁄Uà ߂∑§ ÁflL§h ‹«∏UÊ߸ ¿U«∏U øÈ∑§Ê „ÒU–
÷Ê⁄Uà Ÿ ‚◊ÿ ⁄U„UÃ „UË ß‚ •‚Êäÿ ⁄UÙª ‚ ¬ÒŒÊ „UÙŸ flÊ‹ πÃ⁄UÙ¥ ∑§Ù ¬„UøÊŸ Á‹ÿÊ „ÒU– ÿ„U
÷Ë ‚ø „UÒ Á∑§ ÷Ê⁄Uà ߂ ⁄UÙª ∑§ ÁŸêŸ ‚ê÷ÊÁflà ˇÊòÊÙ¥ ◊¥ •ÊÃÊ „ÒU– ÿ„U ÉÊ≈UŸÊ „U◊¥ •fl‚⁄U
•ı⁄U ¡ÙÁπ◊ ŒÙŸÙ¥ ¬Á⁄UÁSÕÁÃÿÙ¥ ‚ •flªÃ ∑§⁄UÊÃË „ÒU– „U◊Ê⁄U ¬Ê‚ •÷Ë ∞∑§ •fl‚⁄U „ÒU Á∑§
∞ø •Ê߸ flË ∑§ ◊„UÊ◊Ê⁄UË ’ŸŸ ‚ ¬„U‹ ß‚‚ ’øÊfl ∑§⁄U ‚∑¥§– πÃ⁄UÊ ÿ „ÒU Á∑§ ÁŸ◊A SÃ⁄UËÿ
√ÿʬ∑§ÃÊ flÊ‹ ˇÊò ÊÙ¥ ◊¥ ‹Ùª ‚â ÁÈ CUÔ ‚ ’∆Ò U ¡ÊÃ „U¥Ò, ¡Ù Á∑§ ∞ø •ÊßU¸ flË ∑§ Á‹∞ ∞∑§ πÃ⁄UŸÊ∑§
ÁSÕÁÃ „UÒ–
∞ø •Ê߸ flË ∑§ ÁflL§h ‹«∏UÊ߸ ∑§ •Ÿ∑§ ¬„U‹Í „Ò¥U– •ı⁄U ÿ„U ÷Ë „UÙ ‚∑§ÃÊ „ÒU Á∑§ ß‚ ⁄UÙª ∑§
Áfl·ÿ ◊¢ •ı⁄U ß‚∑§ »Ò§‹Ÿ ∑§ Ã⁄UË∑§Ù¥ ‚ ¡È«∏UË ¡ÊŸ∑§Ê⁄UË ∑§Ê ôÊÊŸ ‚fl¸√ÿʬ∑§ „UÙŸÊ øÊÁ„U∞–
ß‚‚ ¡È«∏UË ‚„UË ¡ÊŸ∑§Ê⁄UË ‚ê’ÁãœÃ ∑§‹¢∑§ ∑§Ù πà◊ ∑§⁄UŸ ◊¥ ‚„UÊÿ∑§ „UÙªË, ÄÿÙ¥Á∑§ Á∑§‚Ë ÷Ë
øË Ê ∑§Ù Ÿ Ê⁄U•ãŒÊ Ê ∑§⁄UŸ ‚ ©U‚‚ ¡È«∏UÊ «U⁄U ’…∏U ‚∑§ÃÊ „ÒU– ß‚∑§ ©U¬øÊ⁄U ‚ ∞ø •Ê߸ flË-
¬ÊÚÁ ÊÁ≈Ufl ‹Ùª ‚¢ÃÈc≈U, ©U¬ÿÙªË ¡ËflŸ •¬Ÿ „UË ªÊ¢fl •ı⁄U ‡Ê„U⁄U ◊¥ Á’ÃÊ ‚∑§Ã „Ò¥U– „UÊ‹Ê¢Á∑§
ß‚‚ ¡È«∏U ∑§‹¢∑§ ∑§ Áπ‹Ê»§ ‚◊Ê¡ ∑§ „U⁄U ∞∑§ SÃ⁄U ¬⁄U ‹«∏UÊ߸ ‹«∏UË ¡ÊŸË øÊÁ„U∞ •ı⁄U ‚÷Ë
‹ÙªÙ¥ ∑§Ù ß‚‚ ¡È«∏UË ¡ÊŸ∑§Ê⁄UË fl Á‡ÊˇÊÊ ∑§Ë ÁŒ‡ÊÊ ◊¥ ∑§Ê◊ ∑§⁄UŸÊ øÊÁ„U∞–
ÿ„U ’„ÈUà ∑§Á∆UŸ ∑§Ê◊ „ÒU– ÁflSÃÎà ª˝Ê◊ËáÊ ¡Ÿ‚¢ÅÿÊ Ã∑§ ∞ø •Ê߸ flË ‚ ¡È«∏UË ¡ÊŸ∑§Ê⁄UË ¬„È¢UøÊŸÊ
∞∑§ øÈŸıÃˬÍáʸ ∑§Ê◊ „ÒU– ⁄UÊc≈˛UËÿ ∞«˜U‚ ÁŸÿãòÊáÊ ‚¢ª∆UŸ •ı⁄U ⁄UÊÖÿ ∞«˜U‚ ÁŸÿãòÊáÊ ‚Ù‚ÊßÁ≈UÿÙ¥
∑§ ‚ÊÕ Á◊‹∑§⁄U ∞∑§ ‚Ê¢¤ÊÊ ‹«∏UÊ߸ •Ê⁄Uê÷ „UÙ øÈ∑§Ë „Ò–
„U◊ ©Uê◊ËŒ ∑§⁄UÃ „Ò¥U Á∑§ ¬Êڬȋ‡ÊŸ »§Ê©Uá«U‡ÊŸ •ÊÚ»§ ßÁá«UÿÊ, Ÿß¸U ÁŒÀ‹Ë •ı⁄U ¬Êڬȋ‡ÊŸ
⁄ÒU»§⁄Uã‚ éÿÍ⁄UÙ, flÊÚÁ‡Ê¢ª≈UŸ-«UË ‚Ë ∑§ mÊ⁄UÊ ¬˝∑§ÊÁ‡Êà øÊ≈¸U’È∑§ ∑§Ê ÿ„U ¬˝∑§Ê‡ÊŸ ÷Ê⁄Uà ◊¥
∞ø •Ê߸ flË ‚ ¡È«∏U ÃâÿÙ¥ ∑§ ¬˝øÊ⁄U-¬˝‚Ê⁄U ◊¥ ◊„Uàfl¬Íáʸ ÷ÍÁ◊∑§Ê ÁŸ÷Ê∞ªË– ß‚ ¬Á⁄UÿÙ¡ŸÊ
∑§ Á‹∞ ∞ø •Ê߸ flË/∞«˜U‚ ¬⁄U ‚¢ÿÈÄà ⁄UÊc≈˛U ∑§Êÿ¸∑˝§◊ (ÿÍ ∞Ÿ ∞«˜U‚) ÷Ê⁄Uà ∑§Êÿʸ‹ÿ ‚ ¬˝øÈ⁄U
◊ÊòÊÊ ◊¥ •ŸÈŒÊŸ ¬˝Êåà „ÈU•Ê–
New Delhi
June 2007
A. R. Nanda
Executive Director
Population Foundation of India
Ÿß¸U ÁŒÀ‹Ë
¡ÍŸ wÆÆ|
∞. •Ê⁄U. ŸãŒ
•Áœ‡ÊÊ‚Ë ÁŸŒ‡Ê∑§
¬Êڬȋ‡ÊŸ »§Ê©Uá«U‡ÊŸ •ÊÚ»§ ßÁá«UÿÊ
3

1.6 Page 6

▲back to top


4

1.7 Page 7

▲back to top


HIV/AIDS IN INDIA
÷Ê⁄Uà ◊¥ ∞ø •Ê߸U flË/∞«˜U‚
In 2005, India remained a country
with low prevalence of HIV
infection – an ideal opportunity to
address the scourge of HIV and to
turn it back. All countries with very
high levels of HIV infection today
began with a low level of
prevalence. If unchecked, HIV has
shown time and time again that
it can spread quickly throughout
all levels of society. The first two
cases of HIV in India were
observed in Chennai and Mumbai
in 1986, possibly arriving in India
through those two port cities.
That number is now over five
million. HIV spread to the degree
that a number of states reached
a high level of prevalence:
Andhra Pradesh, Karnataka,
Maharashtra, Manipur, Nagaland
and Tamil Nadu. There is evidence
that India’s campaign against
HIV has retarded its spread in
some areas and in one state,
Tamil Nadu. Anti-HIV programmes
do work but must be intensified
and extended to areas where
its invasion has only begun.
Otherwise, it is HIV that will win.
Estimated Number of People Living with HIV/AIDS in India, 1986 - 2005
÷Ê⁄Uà ◊¥ ∞ø •Ê߸U flË / ∞«˜U‚ ª˝Á‚à ‹ÙªÙ¥ ∑§Ë •ŸÈ◊ÊÁŸÃ ‚¢ÅÿÊ, v~}{-wÆÆz
5,106,000 5,134,000 5,210,000
4,580,000
3,860,000 3,970,000
3,700,000
3,500,000
1,750,000
2
1986
NACO
ŸÊ∑§Ù
200,000
1990
1994 1998
1999
2000
2001
2002
2003
2004
2005
In 2005, the National AIDS Control Organisation (NACO)
estimated that 5.2 million adults were living with HIV/AIDS
in India. By actively addressing HIV infection, India has
slowed the spread of this dreaded and currently incurable
disease. This is why continued, sustained, efforts against
HIV in all states, is not only essential but can prevent
HIV from becoming a large-scale national tragedy.
‚Ÿ˜ wÆÆz ◊¥ ⁄UÊCÔ˛UËÿ ∞«˜U‚ ÁŸÿ¢òÊáÊ ‚¢ª∆UŸ (ŸÊ∑§Ê) Ÿ •ŸÈ◊ÊŸ ‹ªÊÿÊ Á∑§ ÷Ê⁄UÃ
◊¥ zw ‹Êπ flÿS∑§ ∞ø •Ê߸ flË/∞«˜U‚ ‚¢∑˝§Á◊à ⁄U„U ⁄U„U Õ– ∞ø •Ê߸ flË ‚¢∑˝§◊áÊ
‚ ‚¢∑˝§Á◊à M§¬ ‚ øøʸ ∑§ mÊ⁄UÊ ÷Ê⁄Uà Ÿ ß‚ ŒÈS‚Ê„U‚Ë •ÊÒ⁄U flø◊ÊŸ ◊¥ ‹Êß‹Ê¡
’Ë◊Ê⁄UË ∑§ »Ò§‹Êfl ∑§Ê œË◊Ê Á∑§ÿÊ „ÒU– ß‚Á‹∞ ‚÷Ë ⁄UÊÖÿÊ¥ ◊¥ ∞ø •Ê߸ flË ∑§
ÁflL§h ÁŸ⁄¢UÃ⁄U, ÁSÕ⁄U ¬˝ÿÊ‚ Ÿ ∑§fl‹ •Êfl‡ÿ∑§ „Ò¥U •Á¬ÃÈ ∞ø •Ê߸ flË ∑§Ê ’«∏U
SÃ⁄U ¬⁄U ⁄UÊCÔ˛UËÿ ◊„UÊ◊Ê⁄UË ’ŸŸ ‚ ⁄UÊ∑§ ‚∑§ÃÊ „ÒU–
‚Ÿ˜ wÆÆz Ã∑§ èÊÊ⁄Uà ∞ø •Ê߸ flË ‚¢∑˝§◊áÊ ∑§Ë
ÁŸ◊A √ÿʬ∑§ÃÊ flÊ‹Ê Œ‡Ê ÕÊó∞ø •Ê߸ flË ∑§
©Uà¬Ë«∏UŸ ¬⁄U äÿÊŸ ŒŸ ∑§Ê •ÊÒ⁄U flÊÁ¬‚ ◊Ê«∏UŸ
∑§Ê ∞∑§ •ŸÈ∑ͧ‹ •fl‚⁄U– ‚÷Ë Œ‡Ê Á¡Ÿ◊¥
•Ê¡ ∞ø •Ê߸ flË ‚¢∑˝§◊áÊ ©UìÊ SÃ⁄UËÿ „ÒU ©UŸ
‚÷Ë ◊¥ •Ê⁄Uê÷ ◊¥ ß‚∑§Ë √ÿʬ∑§ÃÊ ∑§◊ ÕË–
∞ø •Ê߸ flË Ÿ ‚◊ÿ-‚◊ÿ ¬⁄U ÿ„U ÁŒπÊÿÊ „ÒU
Á∑§ ÿÁŒ ß‚ •ŸŒπÊ ∑§⁄U ÁŒÿÊ ÃÊ ÿ„U ‚◊Ê¡
∑§ ‚÷Ë flªÙZ ◊¥ Ã¡Ë ‚ »Ò§‹ ‚∑§ÃÊ „ÒU– ÷Ê⁄UÃ
◊¥ ∞ø •Ê߸ flË ∑§ ¬„U‹ ŒÊ ∑§‚ ‚Ÿ˜ v~}{ ◊¥
øÛÊ߸ •ÊÒ⁄U ◊Èê’߸ ◊¥ Œπ ª∞, ‚¢÷flÃÿÊ ÿ„U
÷Ê⁄Uà ◊¥ ©UŸ ŒÊ ’¢Œ⁄UªÊ„U ‡Ê„U⁄UÊ¥ ∑§ ◊Êäÿ◊ ‚
•Ê ⁄U„UÊ „ÒU– fl„U ‚¢ÅÿÊ •’ zÆ ‹Êπ ‚ ÷Ë
•Áœ∑§ „ÒU– ∞ø •Ê߸ flË ß‚ ªÁà ‚ »Ò§‹Ê „ÒU
Á∑§ ∑ȧ¿U ⁄UÊÖÿ ©Uëø SÃ⁄U ∑§Ë √ÿʬ∑§ÃÊ Ã∑§
¬„È¢Uø ª∞ „Ò¥U— •Êãœ˝ ¬˝Œ‡Ê, ∑§ŸÊ¸≈U∑§, ◊„UÊ⁄UÊCÔ˛U,
◊ÁáʬÈ⁄U, ŸÊªÊ‹Òá«U •ÊÒ⁄U ÃÁ◊‹ŸÊ«ÍU– ß‚ ’ÊÃ
∑§ ¬˝◊ÊáÊ „Ò¥U Á∑§ ∞ø •Ê߸ flË ∑§ ÁflM§h ÷Ê⁄UÃ
∑§ •Á÷ÿÊŸ Ÿ ∑ȧ¿U ˇÊòÊÊ¥ ◊¥ ß‚∑§Ê »Ò§‹Êfl ∑§◊
∑§⁄U ÁŒÿÊ „ÒU ¡Ò‚ ÃÁ◊‹ŸÊ«ÍU– ’„ÈUà ‚ ∞ã≈UË
∞ø •Ê߸ flË ∑§Êÿ¸∑˝§◊ ø‹Ê∞ ¡Ê ⁄U„U „Ò¥U Á∑§ãÃÈ
ߟ∑§Ë ªÁà ∑§Ê ÃËfl˝ ∑§⁄UŸ ∑§Ë •Êfl‡ÿ∑§ÃÊ „ÒU
•ÊÒ⁄U ߟ ∑§Êÿ¸∑˝§◊Ê¥ ∑§Ê ©Ÿ ˇÊòÊÊ¥ ◊¥ ’…∏UÊŸÊ
øÊÁ„U∞ ¡„UÊ¢ ß‚∑§ •Ê∑˝§◊áÊ ∑§Ë ∑§fl‹ •÷Ë
‡ÊÈM§•Êà „UË „ÒU– •ãÿÕÊ ¡Ëà ∞ø •Ê߸ flË
∑§Ë „U٪˖
5

1.8 Page 8

▲back to top


HIV/AIDS: A GLOBAL OVERVIEW
∞ø •Ê߸U flË/∞«˜U‚ — Áfl‡fl ∑§Ê ¬Á⁄UŒÎ‡ÿ
The HIV epidemic is truly global
and no region is immune. From
2004 to 2006, the number of people
who are HIV-positive increased in
every world region. It is not simply
regions which have high HIV
prevalence that must be concerned
about HIV since, once HIV gains a
foothold, only a concerted effort
can stop its spread.
From 2004 to 2006, UNAIDS
estimates that the number of people
living with HIV/AIDS rose from
36.9 to 39.5 million. The number
of new HIV infections of adults
and children also increased from
3.9 to 4.3 million from 2004 to 2006
as did the number of adults and
children who died from AIDS, from
2.7 to 2.9 million. Still, in many
countries, the rise of HIV has been
turned back, particularly where its
presence was recognized early on.
HIV has no assurance of winning
provided that the fight against it is
vigorous and sustained.
The Global HIV/AIDS Epidemic, December 2004 and 2006
Áfl‡fl ∑§Ê ∞ø •Ê߸ flË/∞«˜U‚ ¬Á⁄UŒÎ‡ÿ, ÁŒ‚¢’⁄U wÆÆy •ı⁄U wÆÆ{
Adults
and children
living with HIV
∞ø •Ê߸ flË ∞«˜U‚
‚ ª˝Á‚à √ÊÿS∑§
ÃÕÊ ’ëø
Adults
15-49 living
with HIV (%)
∞ø •Ê߸ flË ∞«˜U‚
‚ ª˝Á‚à flÿS∑§Ê¥
(15-49) ∑§Ê ¬˝ÁÇÊÃ
2004
2006
2004 2006
World
Áfl‡fl
36,900,000 39,500,000 1.0 1.0
Sub-Saharan Africa
©U¬-‚„UÊ⁄UŸ •»˝§Ë∑§Ê
23,600,000 24,700,000 6.0 5.9
Middle East and North Africa 400,000
Á◊Á«U‹ ߸S≈U ÃÕÊ ©UûÊ⁄UË •»˝§Ë∑§Ê
460,000 0.2 0.2
South and Southeast Asia 7,200,000 7,800,000 0.6 0.6
ŒÁˇÊáÊ ÃÕÊ ŒÁˇÊáÊ ¬Ífl¸ ∞Á‡ÊÿÊ
East Asia
¬Ífl¸ ∞Á‡ÊÿÊ
620,000 750,000 0.1 0.1
Oceania
•ÊÁ‡ÊÿÊŸÊ
72,000
81,000 0.3 0.4
Latin America
‹ÒÁ≈UŸ •◊⁄ËU∑§Ê
1,500,000 1,700,000 0.5 0.5
Caribbean
∑Ò§⁄UÁ’ÿŸ
240,000
250,000 1.1 1.2
Eastern Europe and
Central Asia
¬Ífl¸ ÿÍ⁄UÊ¬ ÃÕÊ ◊äÿ ∞Á‡ÊÿÊ
1,400,000 1,700,000 0.7 0.9
Western Europe and
Central Europe
¬Á‡ø◊Ë ÿÍ⁄UÊ¬ ÃÕÊ ◊äÿ ÿÍ⁄UÊ¬
700,000 740,000 0.3 0.3
North America
©UûÊ⁄UË •◊⁄UË∑§Ê
1,200,000 1,400,000 0.7 0.8
∞ø •Ê߸ flË ◊„UÊ◊Ê⁄UË ∑§Ë √ÿʬ∑§ÃÊ flÊSÃfl ◊¥
‚Êfl¸÷ıÁ◊∑§ „ÒU •ı⁄U ∑§Ù߸ ÷Ë ˇÊòÊ ß‚‚ •‚¢∑˝§Á◊Ã
Ÿ„UË¥ „ÒU– ‚Ÿ˜ wÆÆy ‚ wÆÆ{ Ã∑§ ∞ø •Ê߸ flË
¬ÊÚÁ ÊÁ≈Ufl √ÿÁÄÃÿÙ¥ ∑§Ë ‚¢ÅÿÊ ‚¢‚Ê⁄U ∑§ ¬˝àÿ∑§
÷ʪ ◊¥ ’…∏UË „ÒU– ∑§fl‹ fl ¬˝Êãà „UË äÿÊŸ ŒŸ ÿÙÇÿ
Ÿ„UË¥ „ÒU Á¡Ÿ◊¥ ∞ø •Ê߸ flË ∑§Ë √ÿʬ∑§ÃÊ •Áœ∑§
„ÒU, ’ÁÀ∑§ ¡„UÊ¢ ∑§„UË¥ ¬⁄U ÷Ë ∞ø •Ê߸ flË •¬Ÿ ¬Ò⁄U
¡◊Ê ŒÃÊ „ÒU, fl„UÊ¢ ∑§fl‹ ∞∑ ¡È≈U „UÙ∑§⁄U Á∑§∞ ª∞
¬˝ÿÊ‚ „UË ©U‚∑§Ê »Ò§‹Ÿ ‚ ⁄UÙ∑§ ‚∑§Ã „Ò¥U–
ÿÍ ∞Ÿ ∞«˜U‚ ∑§Ê •ŸÈ◊ÊŸ „ÒU Á∑§ ∞ø •Ê߸ flË/∞«˜U‚
∑§ ‹ÙªÙ¥ ∑§Ë ‚¢ÅÿÊ ‚Ÿ˜ wÆÆy ‚ wÆÆ{ ∑§ Œı⁄UÊŸ
x.{~ ‚ x.~z ∑§⁄UÙ«∏U Ã∑§ ’…∏UË „ÒU– ©U‚Ë Œı⁄UÊŸ
•ÕʸØ ‚Ÿ˜ wÆÆy ‚ wÆÆ{ Ã∑§ flÿS∑§Ù¥ •ı⁄U
’ìÊÙ¥ ◊¥ Ÿ∞ ∞ø •Ê߸ flË ‚¢∑˝§Á◊ÃÙ¥ ∑§Ë ‚¢ÅÿÊ
÷Ë x~ ‚ yx ‹Êπ Ã∑§ ’…∏UË ©U‚Ë ¬˝∑§Ê⁄U
∞ø •Ê߸ flË ‚ ◊⁄UŸ flÊ‹ flÿS∑§Ù¥ •ı⁄U ’ìÊÙ¥ ∑§Ë
‚¢ÅÿÊ ÷Ë w| ‚ w~ ‹Êπ Ã∑§ ’…∏UË– Á»§⁄U ÷Ë
’„ÈUà ‚ Œ‡ÊÙ¥ ◊¥ ∞ø •Ê߸ flË ∑§Ë ’…∏UÙûÊ⁄UË ◊¥ ∑§◊Ë
•Ê߸ „ÒU, Áfl‡Ê·Ãı⁄U ¬⁄U fl„UÊ¢, ¡„UÊ¢ ß‚∑§Ë ©U¬ÁSÕÁÃ
∑§Ê ¬ÃÊ ¡ÀŒË ø‹ ªÿÊ– ∞ø •Ê߸ flË ∑§ ™§¬⁄U
Áfl¡ÿ ¬ÊŸ ∑§Ë ∑§Ù߸ ÁŸÁ‡ø¢ÃÃÊ Ÿ„UË¥ „ÒU ¡’
Ã∑§ Á∑§ ß‚∑§ ÁflL§h ¡¢ª ¬˝÷Êfl‡ÊÊ‹Ë •ı⁄U
ÁSÕ⁄U Ÿ „UÙ–
UNAIDS
ÿÍ∞Ÿ∞«˜U‚
6

1.9 Page 9

▲back to top


HIV/AIDS: A GLOBAL OVERVIEW
∞ø •Ê߸U flË/∞«˜U‚ — Áfl‡fl ∑§Ê ¬Á⁄UŒÎ‡ÿ
The prevalence of HIV/AIDS in India,
estimated at 0.9 percent of the adult
population ages 15-49, is the highest
in South Asia and is slightly under
the global average of 1.0 percent.
India’s prevalence is also higher
than that of other world regions, such
as Latin America and Europe.
India is currently considered a low
prevalence country overall. But the
prevalence level today cannot be
assured to be that of tomorrow.
Throughout the country, prevalence
in some states and many districts
is considered high. This is an
unmistakable sign that the potential
for HIV to spread and for its
prevalence to increase is already
present. HIV infection always begins
with low levels of prevalence so that
low levels today are no assurance
for the future.
Percent of Adults, Ages 15 - 49, Living with HIV/AIDS, Selected World
Regions and Countries, ca. 2005
Áfl‡fl ∑§ øÈÁŸ¢ŒÊ ˇÊòÊ fl Œ‡ÊÙ¥ ◊¥ ∞ø •Ê߸U flË/∞«˜U‚ ‚ ª˝Á‚à flÿS∑§Ù¥
(vz-y~) ∑§Ê ¬˝ÁÇÊÃ, wÆÆz
Asia
∞Á‡ÊÿÊ
South Asia
0.7
ŒÁˇÊáÊ ∞Á‡ÊÿÊ
Bangladesh
<0.1
’¢ª‹ÊŒ‡Ê
India
0.9
÷Ê⁄UÃ
Pakistan
0.1
¬ÊÁ∑§SÃÊŸ
Sri Lanka
<0.1
üÊË ‹¢∑§Ê
sub-Saharan Africa
©U¬-‚„UÊ⁄UŸ •»˝§Ë∑§Ê
Swaziland
33.4
SflÊU ÊËU‹Ò¥«U
Botswana
24.1
’Ùà‚flÊŸÊ
Nigeria
3.9
ŸÊß¡ËÁ⁄UÿÊ
Uganda
6.7
ÿȪʢ«UÊ
Latin America & the Caribbean
0.5
‹ÒÁ≈UŸ •◊⁄UË∑§Ê •ı⁄U ∑Ò§Á⁄UÁ’ÿŸ
North America
0.6
©UûÊ⁄UË •◊⁄UË∑§Ê
Europe
0.5
ÿÍ⁄UÙ¬
NACO, UNAIDS, Demographic and Health Surveys
and Population Reference Bureau
ŸÊ∑§Ù, ÿÍ∞Ÿ∞«˜U‚, ¡Ÿ‚¢ÅÿÊ •ı⁄U SflÊSâÿ ‚¢’¢Áœ ‚fl¸ˇÊáÊ
•ı⁄U ¬Êڬȋ‡ÊŸ ⁄U»£⁄Uã‚ éÿÍ⁄UÊ
÷Ê⁄Uà ∑§Ë vz-y~ fl·¸ •ÊÿÈ flª¸ ∑§Ë
¡Ÿ‚¢ÅÿÊ ◊¥ ∞ø •Ê߸ flË/∞«˜U‚ ∑§ ◊Ê◊‹
‹ª÷ª Æ.~ ¬˝ÁÇÊà „Ò¥U, ÿ„U ŒÁˇÊáÊ ∞Á‡ÊÿÊ
◊¥ •Áœ∑§Ã◊ „ÒU •ÊÒ⁄U ‚Êfl¸÷ıÁ◊∑§ •ÊÒ‚Ã
v.Æ ¬˝ÁÇÊà ∑§ •Ê¢∑§«∏U ‚ ∑ȧ¿U „UË ∑§◊ „ÒU–
èÊÊ⁄Uà ◊¥ ÿ„U •Ê¢∑§«∏UÊ ‹ÒÁ≈UŸ •◊⁄UË∑§Ê •ÊÒ⁄U
ÿÍ⁄UÊ¬ ¡Ò‚ ÁflE ∑§ •ãÿ Œ‡ÊÙ¥ ‚ ÷Ë
•Áœ∑§ „ÒU– ∑ȧ‹ Á◊‹Ê∑§⁄U •’ èÊË ÷Ê⁄UÃ
∑§Ê ÁŸ◊A √ÿʬ∑§ÃÊ flÊ‹Ê Œ‡Ê ◊ÊŸÊ ¡ÊÃÊ
„ÒU– ‹Á∑§Ÿ •Ê¡ ∑§Ë √ÿʬ∑§ÃÊ ∑§ SÃ⁄U ∑§Ù
∑§‹ ∑§ Á‹∞ Ÿ„UË¥ ◊ÊŸÊ ¡Ê ‚∑§ÃÊ „ÒU–
Œ‡Ê ÷⁄U ∑§ •Ÿ∑§ ⁄UÊÖÿÊ¥ •ÊÒ⁄U ’„ÈUà ‚
Á$¡‹Ê¥ ◊¥ ∞«˜U‚ ∑§Ë √ÿʬ∑§ÃÊ ’„ÈUà •Áœ∑§
„ÒU– ÿ„U ‚ÊøŸÊ ÷Ë ª‹Ã ‚¢∑§Ã Ÿ„UË¥ „UÊªÊ
Á∑§ ∞ø •Ê߸ flË ∑§Ë ‚¢÷ÊflŸÊ ÃÕÊ ß‚∑§
•ÊÒ⁄U »Ò§‹Ÿ ∑§ ‚ê÷ÊflŸÊ ’ŸË „ÈU߸ „ÒU–
∞ø •Ê߸ flË ‚¢∑˝§◊áÊ „U◊‡ÊÊ ÁŸ◊A SÃ⁄U ∑§Ë
√ÿʬ∑§ÃÊ ‚ „UË »Ò§‹ÃÊ „ÒU, ß‚ ¬˝∑§Ê⁄U •Ê¡
ÁŸêŸ SÃ⁄U ÷Áflcÿ ∑§ Á‹∞ ∑§Ê߸ •Ê‡flÊ‚Ÿ
Ÿ„UË¥ „ÒU–
7

1.10 Page 10

▲back to top


INDIAS SENTINEL SITES
÷Ê⁄Uà ∑§ ⁄UˇÊÊ ∑¥§ãº˝ (¡Ê°ø ∑§ãº˝)
Sentinel sites are used worldwide in
developing countries, such as India,
which lack completely reported data
on disease in order to determine
if HIV infection is actually present,
in which areas it might be more
prevalent and just how widespread
it may have become. In that way,
these testing sites truly are
“sentinels.” Since individual
groups tested, such as patients in
STD clinics, cannot be wholly
representative of the general
population, sentinel sites provide
some basis for estimating the total
number of HIV-positive people but
that is not their primary purpose.
And, since sentinel site testing is
conducted annually, it provides the
only tool to investigate yearly trends
upwards or downwards.
In 2005, 0.88 percent of pregnant
women at ANC clinics tested
positive for HIV as did 5.66 percent
of patients at STD clinics. Thus,
India as a whole is, in fact, near a
high prevalence level of HIV as
defined by National AIDS Control
Organisation (NACO).
8
Prevalence of HIV Infection among Different Population Groups at
Sentinel Sites, India, 2005
÷Ê⁄Uà ∑§ ⁄UˇÊÊ ∑¥§ãº˝Ù¥ ◊¥ ÁflÁ÷ÛÊ ¡Ÿ ‚◊Í„UÙ¥ ◊¥ ∞ø •Ê߸U flË ‚¢∑˝§◊áÊ ∑§Ë √ÿʬ∑§ÃÊ
÷Ê⁄UÃ, wÆÆz
Site type
ˇÊòÊ ∑§Ê ¬˝∑§Ê⁄U
Number
of sites
∑§ãº˝Ù¥ ∑§Ë
‚¢ÅÿÊ
Percent
HIV-positive
∞ø •Ê߸U flË
¬ÊÚÁ ÊÁ≈Ufl ∑§Ê ¬˝ÁÇÊÃ
Pregnant women at antenatal care 267
0.88
clinics (ANC) – urban areas
¬˝‚fl¬Ífl¸ ÁøÁ∑§à‚Ê ∑§ãº˝Ù¥ (∞ ∞Ÿ ‚Ë)
◊¥ ª÷¸flÃË ◊Á„U‹Ê∞¢ - ‡Ê„U⁄UË ˇÊòÊ
Pregnant women at antenatal care
clinics (ANC) – rural areas
124
0.93
¬˝‚fl¬Ífl¸ ÁøÁ∑§à‚Ê ∑§ãº˝Ù¥ (∞ ∞Ÿ ‚Ë)
◊¥ ª÷¸flÃË ◊Á„U‹Ê∞¢ - ª˝◊ËáÊ ˇÊòÊ
Patients at sexually transmitted
175
5.66
disease clinics (STD)
ÿıŸ ‚¢øÁ⁄Uà ⁄UÙª ÁøÁ∑§à‚Ê ∑§ãº˝Ù¥ (∞‚ ≈UË «UË)
¬⁄U ⁄UÙªË
Female sex workers (FSW)
83
8.44
◊Á„U‹Ê ÿıŸ ∑§Êÿ¸∑§Ãʸ (∞»§ ∞‚ «UéÀÿÍ)
Intravenous drug users (IVDU)
30
Ÿ‚Ù¥ ¬⁄U ‚È߸U ‹ªÊ∑§⁄U Ÿ‡ÊÊ ∑§⁄UŸ flÊ‹
(•Ê߸U flË «UË ÿÍ)
10.16
Men having sex with men (MSM)
18
8.74
¬ÈL§·, ¡Ê ¬ÈL§· ∑§ ‚ÊÕ ÿÊÒŸ ‚ê’ãœ
’ŸÊ∞ (∞◊ ∞‚ ∞◊)
Tuberculosis (TB) patients
ìÁŒ∑§ Ô(≈UË ’Ë) ⁄UÙªË
4
9.00
Migrant group
¬˝flÊ‚Ë ‚◊Í„U
1
0.00
Eunuchs
Á∑§ãŸ⁄U
1
43.90
Total
703
∑ȧ‹
NACO
ŸÊ∑§Ù
¬Í⁄U Áfl‡fl ∑§ Áfl∑§Ê‚‡ÊË‹ Œ‡ÊÊ¥ ◊¥ ⁄UˇÊÊ ∑§ãº˝Ù¥ ∑§Ê
ßSÃ◊Ê‹ „UÊÃÊ „ÒU. ¡Ò‚ ÷Ê⁄UÃ, Á¡‚∑§ ¬Ê‚ ß‚
⁄UÊª ∑§ •Ê°∑§«∏UÙ¥ ∑§Ë Á⁄U¬Ê≈¸U ¬Íáʸ M§¬ ◊¥ Ÿ„UË¥ „Ò
Á¡‚‚ Á∑§ ÿ„U ÁŸœÊ¸Á⁄Uà „UÊ ‚∑§ Á∑§ ÄÿÊ
∞ø •Ê߸ flË ‚¢∑˝§◊áÊ flÊSÃfl ◊¥ „ÒU, Á∑§‚ ˇÊòÊ ◊¥
ß‚∑§Ë •Áœ∑§ √ÿʬ∑§ÃÊ „UÊ ‚∑§ÃË „ÒU •ÊÒ⁄U ÿ„U
Á∑§ÃŸÊ »Ò§‹ øÈ∑§Ê „ÒU– ß‚ ¬˝∑§Ê⁄U ÿ„U ∞∑§ ‚ìÊÊ߸U
„ÒU Á∑§ ÿ ¡Ê¢ø ∑§ãº˝ ∞∑§ “⁄UˇÊ∑§” ∑§ M§¬ ◊¥ ∑§Êÿ¸
∑§⁄U ⁄U„U „Ò¥U– ¡’‚ √ÿÁQ§ªÃ ‚◊Í„UÊ¥ ∑§Ë ¡Ê¢ø ∑§Ë
ªß¸, ¡Ò‚ Á∑§ ∞‚ ≈UË «UË ÁøÁ∑§à‚Ê ∑§ãº˝Ê¥ ∑§ ⁄UÊªË,
•Ê◊ ¡ŸÃÊ ∑§ ¬˝ÁÃÁŸÁœ Ÿ„UË¥ „UÊ ‚∑§Ã, ⁄UˇÊÊ
∑§ãº˝ ∞ø •Ê߸ flË ¬ÊÚÁ$¡Á≈Ufl ‹ÊªÊ¥ ∑§Ë ‚¢ÅÿÊ ∑§Ê
•ŸÈ◊ÊŸ ‹ªÊŸ ∑§ Á‹∞ ∑ȧ¿U •ÊœÊ⁄U ©U¬‹éœ
∑§⁄UflÊ ‚∑§Ã „Ò¥U, Á∑§ãÃÈ ÿ„U ©UŸ∑§Ê ¬˝ÊÕÁ◊∑§
©Ug‡ÿ Ÿ„UË¥ „UÊÃÊ– •ÊÒ⁄U øÍ¢Á∑§ ⁄UˇÊÊ ∑§ãº˝ ◊¥ ¡Ê¢ø
∑§fl‹ flÊÁ·¸∑§ ÃÊÒ⁄U ¬⁄U „UÊÃË „ÒU, ß‚Á‹∞ ÿ„U
∑§fl‹ flÊÁ·¸∑§ ™§¬⁄U-ŸËø ≈˛ÒUã«U ∑§Ê ÁŸ⁄UˡÊáÊ ∑§⁄UŸ
∑§ Á‹∞ ‚ÊœŸ ©U¬‹éœ ∑§⁄UflÊÃÊ „ÒU–
‚Ÿ˜ wÆÆz ◊¥, ∞ ∞Ÿ ‚Ë ÁøÁ∑§à‚Ê ∑§ãº˝Ê¥ ◊¥
ª÷¸flÃË ◊Á„U‹Ê•Ê¥ ∑§Ë ∞ø •Ê߸ flË ¡Ê¢ø ∑§Ù
¬Á⁄UáÊÊ◊ Æ.}} ¬˝ÁÇÊà ¬ÊÚÁ$¡Á≈Ufl •Êÿ, ß‚Ë
¬˝∑§Ê⁄U ∞‚ ≈UË «UË ÁøÁ∑§à‚Ê ∑§ãº˝Ê¥ ◊¥ ⁄UÊÁÇÊÿÊ¥ ∑§Ê
¬˝ÁÇÊà z.{{ ÕÊ– ß‚ ¬˝∑§Ê⁄U ŸÊ∑§Ê mÊ⁄UÊ ÉÊÊ·áÊÊ
∑§Ë ªß¸ Á∑§ ¬Íáʸ M§¬ ‚ ÷Ê⁄Uà flÊSÃfl ◊¥
∞ø •Ê߸ flË ∑§ ©Uëø √ÿʬ∑§ÃÊ ∑§ Ÿ$¡ŒË∑§ „ÒU–

2 Pages 11-20

▲back to top


2.1 Page 11

▲back to top


INDIAS SENTINEL SITES
÷Ê⁄Uà ∑§ ⁄UˇÊÊ ∑¥§ãº˝ (¡Ê°ø ∑§ãº˝)
Percent of Various Risk Groups Testing Positive for HIV Infection at
Sentinel Sites, India, 2003 - 2005
Across India, testing at sentinel
sites suggests that there has been
a downward trend in HIV
prevalence among some high-risk
groups, such as FSWs and IVDUs.
Some caution in interpreting the
figures is required since the number
of sites rises from year to year as
⁄UˇÊÊ ∑¥§ãº˝Ù¥ ◊¥ ∞ø •Ê߸U flË ‚¢∑˝§◊áÊ ∑§ Á‹∞ ÁflÁ÷㟠¡ÙÁπ◊ ¬Íáʸ ‚◊Í„UÙ¥ ∑§Ë
¬ÊÚÁ ÊÁ≈Ufl ¡Ê¢ø ¬˝ÁÇÊÃ, ÷Ê⁄UÃ, wÆÆx-wÆÆz
13.3
12.1
2003
2004
2005
11.2
10.3
10.2
9.4
8.4
8.7
7.5
÷Ê⁄Uà ◊¥ ⁄UˇÊÊ ∑§ãº˝Ù¥ ◊¥ ∑§Ë ªß¸ ¡Ê¢ø ÿ„U
Œ‡ÊʸÃË „ÒU Á∑§ ∑ȧ¿U ©Uëø ¡ÊÁπ◊ ‚◊Í„UÊ¥ ◊¥
∑ȧ¿U ‚◊ÿ ‚ ∞ø •Ê߸ flË ∑§Ë √ÿʬ∑§ÃÊ ◊¥
Áª⁄UÊfl≈U •Ê߸ „ÒU, ¡Ò‚ Á∑§ ∞»§ ∞‚ «UéÀÿÍ
•ı⁄U •Ê߸ flË «UË ÿÍ– •Ê¢∑§«∏UÊ¥ ∑§Ë √ÿÊÅÿÊ
∑§⁄UŸ ∑§ Á‹∞ ∑ȧ¿U ‚ÊflœÊÁŸÿÊ¢, ’⁄Uß ∑§Ë
•Êfl‡ÿ∑§ÃÊ „ÒU, øÍ¢Á∑§ ŸÊ∑§Ê ÷Ê⁄Uà ∑§ ⁄UˇÊÊ
NACO increases sentinel site
5.6 5.6 5.7
∑§ãº˝Ù¥ ∑§Ê ∑§fl⁄U¡ ’…∏UÊÃÊ „ÒU ß‚Á‹∞ „U⁄U ‚Ê‹
coverage across India. Despite
progress, it is clear that levels of
infection remain dangerously high
and the fight against HIV will be a
long one, as it has been in other
countries. Among ANCs, the
0.9 0.9 0.9
ANC
∞∞Ÿ‚Ë
STD
∞‚≈UË«UË
FSW
∞»§∞‚«Ué‹ÿÍ
IVDU
•Ê߸flË«UËÿÍ
MSM
∞◊∞‚∞◊
ߟ ⁄UˇÊÊ ∑§ãº˝Ù¥ ∑§Ë ‚¢ÅÿÊ ◊¥ ’…∏UÙÃ⁄UË „UÙÃË
„ÒU– ¬˝ªÁà ∑§ ’Êfl¡ÍŒ, ÿ„U S¬CÔU „ÒU Á∑§
‚¢∑˝§◊áÊ ∑§Ê SÃ⁄U πÃ⁄UŸÊ∑§ M§¬ ‚ ©Uëø
⁄U„UÃÊ „ÒU •ı⁄U ∞ø •Ê߸U flË ∑§ ¬˝Áà ‹«∏UÊ߸U
’„ÈUà ‹ê’Ë „ÒU ¡Ò‚Ê Á∑§ ÿ„U •ãÿ Œ‡ÊÊ¥ ◊¥
low-risk group, the level of HIV
infection has remained relatively
constant at sentinel sites in
recent years.
NACO
ŸÊ∑§Ù
Percent of Pregnant Women Testing Positive for HIV Infection at Antenatal Clinics
Higher Prevalence States of India, 2003 - 2005
„UÊÃÊ „ÒU– ∞ ∞Ÿ ‚Ë ∑§ ’Ëø, ¡Ê Á∑§ ∞∑§
ÁãÊ◊A ¡ÊÁπ◊ ‚◊Í„U „ÒU, ⁄UˇÊÊ ∑§ãº˝Ù¥ ◊¥ Á¬¿U‹
∑ȧ¿U fl·ÊZ ◊¥ ∞ø •Ê߸ flË ‚¢∑˝§◊áÊ ∑§Ê SÃ⁄U
ÁSÕ⁄U ⁄U„UÊ „ÒU–
Six states, Andhra Pradesh,
Karnataka, Maharashtra, Manipur,
Nagaland and Tamil Nadu have
been considered high prevalence
by NACO due to the fact that HIV
prevalence among ANCs has been
one percent or more (and five
percent or more at STD sentinel
sites). Five of these states remain
above one percent ANC prevalence.
In one state, Tamil Nadu, ANC
prevalence has been below one
¬˝‚fl ¬Ífl¸ ÁøÁ∑§à‚Ê ∑§ãº˝Ù¥ ◊¥ ∞ø •Ê߸U flË ∑§ Á‹∞ ª÷¸flÃË ◊Á„U‹Ê•Ù¥ ∑§Ë ¬ÊÚÁ ÊÁ≈Ufl
¡Ê¢ø ¬˝ÁÇÊÃ, ÷Ê⁄Uà ∑§ •Áœ∑§Ã◊ ¬˝÷ÊÁflà ⁄UÊÖÿ, wÆÆx-wÆÆz
2.0
1.8
1.7 1.7
1.5
1.5 1.5
1.4
1.7
1.7
1.3
1.3
2003
2004
2005
1.1 1.1
1.0
0.8 0.8
0.5
{ ⁄UÊÖÿ, •ÊãäÊ˝ ¬˝Œ‡Ê, ∑§ŸÊ¸≈U∑§, ◊„UÊ⁄UÊCÔ˛U,
◊áÊˬÈ⁄U, ŸÊªÊ‹Òá«U •ÊÒ⁄U ÃÁ◊‹ŸÊ«ÍU ∑§
∞ ∞Ÿ ‚Ë ◊¥ ∞ø •Ê߸ flË ∑§Ë √ÿʬ∑§ÃÊ ∞∑§
¬˝ÁÇÊà ÿÊ ß‚‚ •Áœ∑§ ⁄U„UË „ÒU (•ÊÒ⁄U ⁄UˇÊÊ
∑§ãº˝Ù¥ ∑§ ∞‚ ≈UË «UË ◊¥ ¬Ê¢ø ¬˝ÁÇÊà ÿÊ
•Áœ∑§) Á¡‚ ∑§Ê⁄UáÊ ŸÊ∑§Ê ßã„¥U ©Uëø
√ÿʬ∑§ÃÊ flÊ‹ ˇÊòÊ ◊ÊŸÃÊ „ÒU– ߟ ⁄UÊÖÿÊ¥ ◊¥
‚ ¬Ê¢ø ⁄UÊÖÿ ∞ ∞Ÿ ‚Ë ∑§Ë √ÿʬ∑§ÃÊ ◊¥ ∞∑§
¬˝ÁÇÊà ‚ •Áœ∑§ ⁄U„U– ߟ◊¥ ‚ ∞∑§ ⁄UÊÖÿ
ÃÁ◊‹ŸÊ«ÍU ◊¥ ∞ ∞Ÿ ‚Ë ∑§Ë √ÿʬ∑§ÃÊ
percent consistently, suggesting
‹ªÊÃÊ⁄U ∞∑§ ¬˝ÁÇÊà ‚ ∑§◊ ⁄U„UË „ÒU, ¡Ê ÿ„U
that HIV has at least stabilized in
that state.
Andhra Pradesh
Karnataka
•Ê¢œ˝ ¬˝Œ‡Ê
∑§ŸÊ¸≈U∑§
Compiled from NACO data
ŸÊ∑§Ê ∑§ •Ê¢∑§«∏UÊ¥ ‚ ‚¢∑§Á‹Ã
Maharashtra
◊„UÊ⁄UÊc≈˛U
Manipur
◊ÁáʬÈ⁄U
Nagaland
ŸÊªÊ‹Ò¥«U
Tamil Nadu
ÃÁ◊‹ ŸÊ«ÈU
Note: Mean (Urban + Rural)
ŸÊ≈U— •ÊÒ‚Ã (‡Ê„U⁄UË + ª˝Ê◊ËáÊ)
Œ‡ÊʸÃÊ „ÒU Á∑§ ∑§◊ ‚ ∑§◊ ß‚ ⁄UÊÖÿ ◊¥
∞ø •Ê߸ flË ÁSÕ⁄U •flSÕÊ ◊¥ •Ê ªÿÊ „ÒU–
9

2.2 Page 12

▲back to top


INDIAS SENTINEL SITES
÷Ê⁄Uà ∑§ ⁄UˇÊÊ ∑¥§ãº˝ (¡Ê°ø ∑§ãº˝)
Since HIV infection often begins
and spreads more quickly through
high-risk groups, prevalence
among them may be taken as a
signal that a state or area is
exposed to the possibility that HIV
will spread into the general
population. The graph on this page
illustrates that prevalence among
STD patients in many states is at
a level that puts them at risk of
spreading HIV infection even if
they are not today considered high
prevalence. In countries of Africa,
where national prevalence levels
have reached tragic proportions,
as high as 15 and 25 percent of
the adult population, HIV began in
just this way. Although India
recognized the threat of HIV and
reacted to it, unlike many other
countries, current STD prevalence
shows that only a sustained effort
can hope to defeat it.
Percent of Patients at STD Clinics Testing Positive for HIV Infection
Selected States and Mumbai, 2005
øÈÁŸ¢ŒÊ ⁄UÊÖÿÙ¥ •ı⁄U ◊È¢’߸U ◊¥ ÿıŸ ‚¢øÊÁ⁄Uà ⁄UÙª flÊ‹ ¡Ê¢ø ∑§ãº˝Ù¥ ¬⁄U ∞ø •Ê߸U flË ‚¢∑˝§Á◊Ã
⁄UÙÁªÿÙ¥ ∑§Ê ¬ÙÁ ÊÁ≈Ufl ¬˝ÁÇÊÃ, wÆÆz
Mumbai
◊Èê’߸
22.1
Andhra Pradesh
•Ê¢œ˝ ¬˝Œ‡Ê
22.0
Karnataka
∑§ŸÊ¸≈U∑§
15.7
Goa
ªÙflÊ
14.0
Maharashtra*
◊„UÊ⁄UÊc≈˛U
13.4
Manipur
◊ÁáʬÈ⁄U
12.2
Tamil Nadu
ÃÁ◊‹ ŸÊ«ÈU
12.0
Delhi
ÁŒÀ‹Ë
7.7
Rajasthan
⁄UÊ¡SÕÊŸ
4.8
Pondicherry
¬Ê¢Á«Uø⁄UË
4.2
Orissa
©U«∏UË‚Ê
3.6
Gujarat
ªÈ¡⁄UÊÃ
3.2
Chhattisgarh
¿UûÊË‚ª…∏U
2.8
Kerala
∑§⁄U‹
2.6
West Bengal
¬Á‡ø◊Ë ’¢ªÊ‹
2.5
Haryana
„UÁ⁄UÿÊáÊÊ
1.3
Punjab
¬¢¡Ê’U
1.1
Uttarakhand
©UûÊ⁄UÊπ¢«U
0.6
Bihar
Á’„UÊ⁄
0.4
ÄÿÊ¥Á∑§ ∞ø •Ê߸ flË ∑§Ê ‚¢∑˝§◊áÊ ©Uëø
¡ÊÁπ◊ ‚◊Í„UÊ¥ ∑§ ◊Êäÿ◊ mÊ⁄UÊ ÖÿÊŒÊ ¡ÀŒË
‡ÊÈM§ „UÊÃÊ „ÒU •ÊÒ⁄U »Ò§‹ÃÊ „ÒU, ߟ◊¥ √ÿʬ∑§ÃÊ
∑§ SÃ⁄U ∑§Ê ß‚ ’Êà ∑§ ‚¢∑§Ã ∑§ M§¬ ◊¥ ‹
‚∑§Ã „Ò¥U Á∑§ ©U‚ ⁄UÊÖÿ ÿÊ ˇÊòÊ ∑§Ë •Ê◊ ¡ŸÃÊ
◊¥ ∞ø •Ê߸ flË »Ò§‹Ÿ ∑§Ë ‚¢÷ÊflŸÊ „ÒU– ß‚
¬ÎDÔU ∑§Ê ª˝Ê»§ ÿ„U Œ‡ÊʸÃÊ „ÒU Á∑§ ’„ÈUà ‚
⁄UÊÖÿÊ¥ ◊¥ ∞‚ ≈UË «UË ⁄UÊÁªÿÊ¥ ◊¥ √ÿʬ∑§ÃÊ ß‚
SÃ⁄U ∑§Ë „ÒU Á∑§ fl„U ∞ø •Ê߸ flË ‚¢∑˝§◊áÊ ∑§
»Ò§‹Êfl ∑§ ¡ÊÁπ◊ ¬⁄U „ÒU ¡’Á∑§ •Ê¡ flÙ
©Uëø √ÿʬ∑§ÃÊ flÊ‹ ˇÊòÊ Ÿ„UË¢ ◊ÊŸ ¡ÊÃ–
•»˝§Ë∑§Ê ∑§ Œ‡ÊÊ¥ ◊¥, ¡„UÊ¢ ⁄UÊCÔ˛UËÿ √ÿʬ∑§ÃÊ
SÃ⁄U ‡ÊÊ∑§¡Ÿ∑§ •ŸÈ¬ÊÃÊ¥ ◊¥ ¬„È¢Uø øÈ∑§Ê „ÒU–
¡ÊÁ∑§ flÿS∑§ ¡Ÿ‚¢ÅÿÊ ∑§Ê vz ¬˝ÁÇÊà ‚
‹∑§⁄U wz ¬˝ÁÇÊà Ã∑§ „ÒU– ∞ø •Ê߸ flË ∑§Ë
‡ÊÈM§•ÊÃ ß‚Ë Ã⁄UË∑§ ‚ „UÊÃË „ÒU– ÿlÁ¬ ÷Ê⁄UÃ
Ÿ ∞ø •Ê߸ flË ∑§Ë øÈŸÊÒÃË ∑§Ê ¬„UøÊŸÊ „ÒU •ÊÒ⁄U
•¬ŸË ¬˝ÁÃÁ∑˝§ÿÊ ¬˝∑§≈U ∑§Ë „ÒU, •ãÿ ∑§ß¸ Œ‡ÊÊ¥
∑§Ë Ã⁄U„U flø◊ÊŸ ∞‚ ≈UË «UË ∑§Ë √ÿʬ∑§ÃÊ ÿ„U
Œ‡ÊʸÃË „ÒU Á∑§ ∑§fl‹ ÁŸ⁄UãÃ⁄U ‚¢Á∑˝§ÿ ¬˝ÿÊ‚ ß‚
◊Êà ŒŸ ∑§Ë ©Uê◊ËŒ ÁŒ‹Ê ‚∑§Ã „Ò¥U–
Compiled from NACO data
ŸÊ∑§Ê ∑§ •Ê¢∑§«∏UÊ¥ ‚ ‚¢∑§Á‹Ã
Note: Mean Values
ŸÊ≈U— •ÊÒ‚Ã
* excluding Mumbai / ◊Èê’߸ ⁄UÁ„UÃ
10

2.3 Page 13

▲back to top


REPORTED AIDS CASES
∞«˜U‚ ∑§ Œ¡¸ ∑§‚
Although the reporting of cases of
AIDS is very incomplete, it is clear
that HIV predominately spreads
through India by sexual contact.
In some states of the Northeast,
it is likely that HIV is contracted
by drug users who share needles
before moving into the general
population. Nonetheless, other
avenues of transmission, such
as unsafe blood transfusion and
perinatal, or mother-to-child
transmission, can play a
significant role.
Thus far, reported AIDS cases
have primarily been among males.
This pattern has often been
observed globally but, as the
epidemic progresses, the
proportion of infected females
typically rises. The current pattern
of reported cases by sex suggests
that India is in an early stage
of an epidemic, offering a real
opportunity to keep HIV in check.
Reported AIDS Cases through August 2006 by Method of Transmission, India
÷Ê⁄Uà ◊¥ •ªSà wÆÆ{ Ã∑§ ‚¢øÊ⁄UáÊ ÁflÁœ mÊ⁄UÊ Œ¡¸ Á∑§∞ ª∞ ∞«˜U‚ ∑§ ∑§‚Ù¥ ∑§Ê Áflfl⁄UáÊ
Others (not specified)
•ãÿ (fláʸŸ Ÿ„UË¥ „ÒU)
6%
Injecting Drug users
‚È߸U mÊ⁄UÊ Ÿ‡ÊÊ ∑§⁄UŸ flÊ‹
2%
Blood and blood products
⁄UÄà •ı⁄U ⁄UÄà ©Uà¬ÊŒ
2%
Perinatal transmission
•Á÷÷Êfl∑§ ‚¢øÊ⁄UáÊ
4%
NACO
ŸÊ∑§Ù
Sexual
ÿıŸ ‚¢ê’ãœ
86%
Reported AIDS Cases through August 2006 by Sex, India
÷Ê⁄Uà ◊¥ •ªSà wÆÆ{ Ã∑§ Á‹¢ªflÊ⁄U ∞«˜U‚ ∑§ ∑§‚Ù¥ ∑§Ê Áflfl⁄UáÊ
Males
¬ÈL§·
71%
NACO
ŸÊ∑§Ù
Females
◊Á„U‹Ê
29%
ÿlÁ¬ ∞«˜U‚ ∑§‚Ê¥ ∑§Ë Á⁄U¬Ê≈¸U ’„ÈUà •¬Íáʸ „ÒU,
ÿ„U S¬CÔU „ÒU Á∑§ ÷Ê⁄Uà ◊¥ ∞ø •Ê߸ flË ◊ÈÅÿ
M§¬ ‚ ÿÊÒŸ ‚¢¬∑¸§ mÊ⁄UÊ »Ò§‹ÃÊ „ÒU– ©UûÊ⁄U ¬Ífl¸
∑§ ∑ȧ¿U ⁄UÊÖÿÊ¥ ◊¥ ∞ø •Ê߸ flË ∑§Ê ⁄UÊª Ÿ‡ÊÊ
ßSÃ◊Ê‹ ∑§⁄UŸ flÊ‹Ê¥ ∑§ mÊ⁄UÊ »Ò§‹ÃÊ „ÒU ¡Ê Á∑§
•Ê◊ ‹ÙªÙ¥ ∑§ ’Ëø •ÊŸ ‚ ¬„U‹ ‚ÈßÿÊ¥ ∑§Ê
‚Ê¢¤ÊÊ ßSÃ◊Ê‹ ∑§⁄UÃ „Ò¥U– ß‚∑§ •ÁÃÁ⁄UQ§
‚¢øÊ⁄UáÊ ∑§Ë •ÊÒ⁄U ÷Ë ÁflÁœÿÊ¢ „Ò¥, ¡Ò‚ ∞∑§
•‚È⁄UÁˇÊà ⁄UÄà •Ê¬ÍÁø •ÊÒ⁄U ¬ÒÃÎ∑§ ÿÊ ◊ÊÃÊ ‚
Á‡Ê‡ÊÈ ◊¥ ‚¢øÊ⁄UáÊ, ◊„Uàfl¬Íáʸ ÷ÍÁ◊∑§Ê ÁŸ÷Ê
‚∑§Ã „Ò¥U–
ß‚ ¬˝∑§Ê⁄U •÷Ë Ã∑§ ∞«˜U‚ ∑§ Œ¡¸ ∑§‚Ê¥ ◊¥
¬ÈL ·Ê¥ ∑§Ë ¬˝œÊŸÃÊ „ÒU– ÿ„U …UÊ¢øÊ •Ä‚⁄U
÷ÊÒªÊÁ‹∑§ M§¬ ‚ ŒπÊ ªÿÊ „ÒU ¬⁄UãÃÈ
√ÿʬ∑§ M§¬ ◊¥ ¬˝ªÁà ¬⁄U, ‚¢∑˝§Á◊Ã
◊Á„U‹Ê•Ê¥ ∑§Ê •ŸÈ¬Êà •Ä‚⁄U ’…∏U ¡ÊÃÊ
„ÒU, ÿÊÒŸ mÊ⁄UÊ Œ¡¸ Á∑§∞ ª∞ ∑§‚Ê¥ ∑§Ê
flø◊ÊŸ …UÊ¢øÊ ÿ„U ’ÃÊÃÊ „ÒU Á∑§ ÷Ê⁄Uà ߂
◊Ê„UÊ◊Ê⁄UË ∑§Ë ‡ÊÈL§•ÊÃË Œı⁄U ◊¥ „ÒU Á¡‚◊¥
∞ø •Ê߸ flË ∑§Ë ¡Ê¢ø ∑§⁄UÃ ⁄U„UŸÊ •ÁÃ
•Êfl‡ÿ∑§ „ÒU–
11

2.4 Page 14

▲back to top


HIV/AIDS SPREADS ACROSS INDIA
÷Ê⁄Uà ◊¥ ∞ø •Ê߸U flË/∞«˜U‚ ∑§Ê »Ò§‹Êfl
Prevalence of HIV Infection among Patients
at Sexually Transmitted Disease Clinics,
by District, India, 2005
ÿıŸ ‚¢øÊÁ⁄Uà ⁄UÙª ÁøÁ∑§à‚Ê ∑§ãº˝Ù¥ ∑§ ⁄UÙÁªÿÙ¥ ◊¥ ∞ø •Ê߸U flË ∑§
‚¢∑˝§◊áÊ ∑§Ë √ÿʬ∑§ÃÊ, Á¡‹ flÊ⁄U, ÷Ê⁄UÃ, wÆÆz
NACO
ŸÊ∑§Ù
12
Percent infected with HIV
∞ø •Ê߸U flË ‚¢∑˝§Á◊à ¬˝ÁÇÊÃ
5.00 AND ABOVE / z.ÆÆ •ı⁄U •Áœ∑§
4.99 AND BELOW / y.~~ •ı⁄U ∑§◊
NIL / ∑ȧ¿U Ÿ„UË¥
NO STD SITE / ∞‚ ≈UË «UË ∑§ãº˝ Ÿ„UË¥ „Ò¥U
Note: Mean Values
ŸÊ≈U— •ÊÒ‚Ã
Map not to scale
◊ÊŸÁøòÊ ◊ʬ∑ ⁄Á„Ã

2.5 Page 15

▲back to top


HIV/AIDS SPREADS ACROSS INDIA
÷Ê⁄Uà ◊¥ ∞ø •Ê߸U flË/∞«˜U‚ ∑§Ê »Ò§‹Êfl
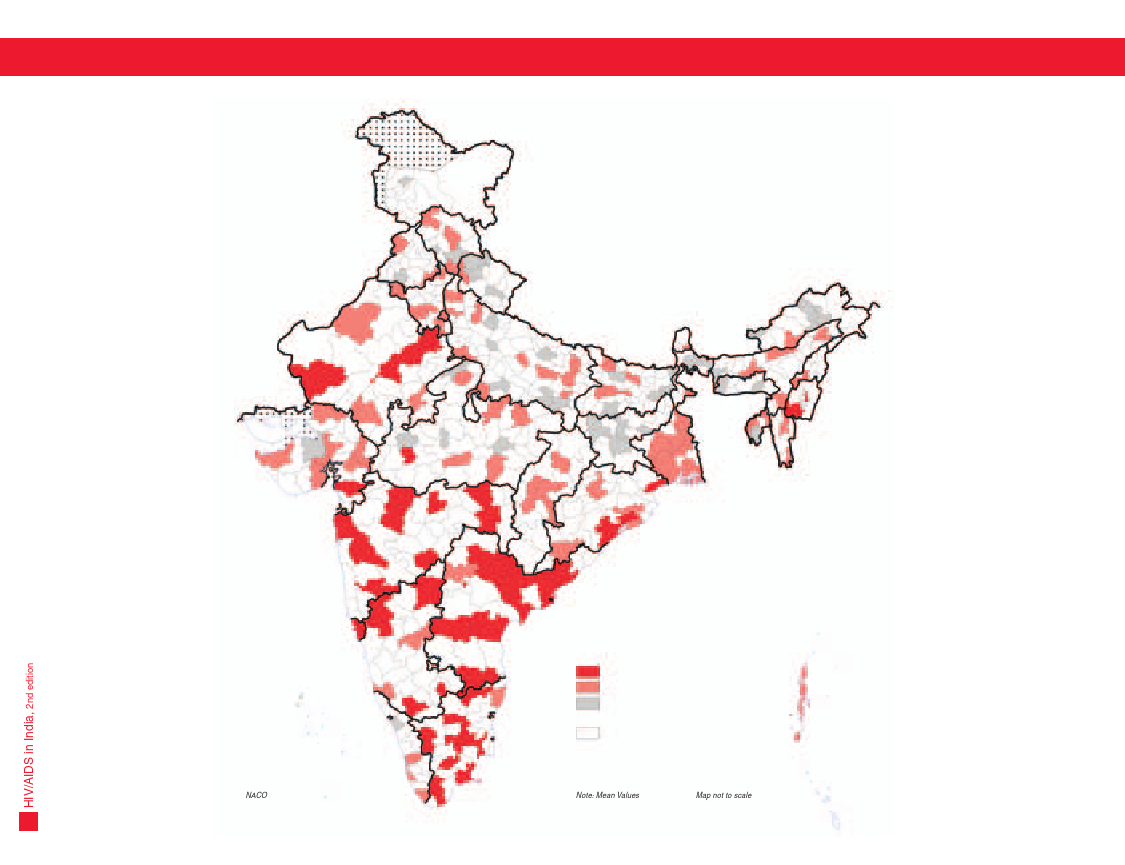
The map on the opposite page clearly illustrates the geographic pattern of HIV infection in India. Looking at HIV only at the state level often
conceals the true routes by which it spreads. While most states of India are still considered to be of low prevalence, district level “hotspots” show
that HIV has moved into all areas of the country and give a clear indication of how it could spread in the future.
The map shows the percentage of patients at sexually-transmitted disease (STD) clinics that tested positive for HIV infection throughout India.
HIV typically begins among high-risk groups such as patients in STD clinics, intravenous drug users (IVDUs) who share needles, commercial sex
workers and men having sex with men (MSMs). When five percent or more of STD patients test positive for HIV, the National AIDS Control
Organisation (NACO) considers an area to be of medium HIV prevalence. The map shows that all areas of India are vulnerable since none is free
from HIV infection among high-risk groups. This often signals the possible advance of HIV towards higher prevalence – moving quietly into the
population as a whole. The extent to which this has happened is shown on the following page.
‚Ê◊Ÿ flÊ‹ ¬ÎDÔU ¬⁄U ŸÄ‡ÊÊ ÷Ê⁄Uà ◊¥ ∞ø •Ê߸ flË ‚¢∑˝§◊áÊ ∑§ ÷ÊÒªÊÁ‹∑§ ¬˝ÁÃM§¬ ∑§Ê S¬CÔU ⁄UπÊ¢Á∑§Ã Áflfl⁄UáÊ ¬˝ŒÊŸ ∑§⁄UÃÊ „ÒU– ∞ø •Ê߸ flË ∑§Ê ∑§fl‹ ⁄UÊÖÿ SÃ⁄U ¬⁄U ŒπŸÊ •Ä‚⁄U ß‚∑§ »Ò§‹Ÿ ∑§ ‚„UË
◊ʪ¸ ∑§Ê Á¿U¬Ê ¡ÊÃÊ „ÒU– „UÊ‹Ê¢Á∑§ ÷Ê⁄Uà ◊¥ ’„ÈUà ‚ ⁄UÊÖÿ •÷Ë ÷Ë ∑§◊ √ÿʬ∑§ÃÊ flÊ‹ ˇÊòÊ ◊ÊŸ ¡ÊÃ „Ò¥U, Á¡‹Ê SÃ⁄UËÿ ““„UÊÚ≈US¬ÊÚ≈U”” ÁŒπÊÃ „Ò¥U Á∑§ ∞ø •Ê߸ flË ÷Ê⁄Uà ∑§ ‚÷Ë ˇÊòÊÊ¥ ◊¥ ¬˝fl‡Ê ¬Ê øÈ∑§Ê „ÒU
•ÊÒ⁄U ß‚ ’Êà ∑§Ê S¬CÔU M§¬ ‚ ¬˝∑§≈U ∑§⁄UÃ „Ò¥U Á∑§ ÷Áflcÿ ◊¥ ÿ„U ∑Ò§‚ »Ò§‹ ‚∑§ÃÊ „ÒU–
ŸÄ‡ÊÊ ¬Í⁄U ÷Ê⁄Uà ◊¥ ÿÊÒŸ ‚¢øÊÁ⁄Uà ⁄UÊª (∞‚ ≈UË «UË) ÁøÁ∑§à‚Ê ∑§ãº˝Ê¥ ¬⁄U ⁄UÊÁªÿÊ¥ ∑§ ¬˝ÁÇÊà ∑§Ê Œ‡ÊʸÃÊ „Ò ¡Ê ¡Ê¢ø ∑§⁄UŸ ¬⁄U ∞ø •Ê߸ flË ‚¢∑˝§◊áÊ ∑§ Á‹∞ ¬ÊÚÁ$¡Á≈Ufl ¬Ê∞ ª∞– ∞ø •Ê߸ flË ∑§Ë ‡ÊÈM§•ÊÃ
SflÊ÷ÊÁfl∑§ M§¬ ‚ ©Uëø ¡ÊÁπ◊¬Íáʸ ‚◊Í„UÊ¥ ◊¥ „UÊÃË „ÒU ¡Ò‚ ∞‚ ≈UË «UË ÁøÁ∑§à‚Ê ∑§ãº˝Ê¥ ◊¥ ⁄UÊªË, Ÿ‚ ◊¥ ‚Í߸ ‹ªÊ∑§⁄U Ÿ‡ÊÊ ∑§⁄UŸ flÊ‹ (•Ê߸ flË «UË ÿÍ) ¡Ê ‚ÈßÿÊ¥ ∑§Ê ‚Ê¢¤ÊÊ ©U¬ÿÊª ∑§⁄UÃ „Ò¥U, √ÿfl‚ÊÁÿ∑§
ÿÊÒŸ∑§Ãʸ •ÊÒ⁄U ¬ÈL · ∑§Ê ¬ÈL · ∑§ ‚ÊÕ ÿÊÒŸ ‚¢’¢œ (∞◊ ∞‚ ∞◊)– ¡’ ∞‚ ≈UË «UË ⁄UÊÁªÿÊ¥ ∑§Ë ∞ø •Ê߸ flË ¡Ê¢ø ∑§ Á‹∞ ¬ÊÚÁ$¡Á≈Ufl Á⁄U¬Ê≈¸U ¬Ê¢ø ¬˝ÁÇÊà ÿÊ ÖÿÊŒÊ „UÊ ÃÊ ⁄UÊCÔ˛UËÿ ∞«˜U‚ ÁŸÿ¢òÊáÊ ‚¢ª∆UŸ
(ŸÊ∑§Ù) ©U‚ ˇÊòÊ ◊¥ ∞ø •Ê߸ flË ∑§Ë √ÿʬ∑§ÃÊ ∑§Ê ◊äÿ◊ SÃ⁄U ∑§Ê ◊ÊŸÃÊ „ÒU– ŸÄ‡ÊÊ ÁŒπÊÃÊ „ÒU Á∑§ ÷Ê⁄Uà ∑§ ‚÷Ë ˇÊòÊ •Áà ‚¢flŒŸ‡ÊË‹ ÁSÕÁà ◊¥ „Ò¥U ÄÿÊ¥Á∑§ ∑§Ê߸ ÷Ë ˇÊòÊ ∞ø •Ê߸ flË ‚¢∑˝§◊áÊ ∑§
©Uëø ¡ÊÁπ◊¬Íáʸ ‚◊Í„UÊ¥ ‚ •¿ÍUÃÊ Ÿ„UË¥ „Ò¥U– ÿ„U •Ä‚⁄ ß‚ ’Êà ∑§Ë •Ê⁄U ‚¢∑§Ã ∑§⁄UÃÊ „ÒU Á∑§ ∞ø •Ê߸ flË ∑§Ë ©Uëø √ÿʬ∑§ÃÊ ∑§Ë •Ê⁄U ’…∏UŸ ∑§Ë ¬Í⁄UË ‚¢÷ÊflŸÊ „ÒU - •Ê’ÊŒË ◊¥ ÿ„U øȬøʬ ¬Í⁄UË Ã⁄U„U ‚
‚◊ÊÃÊ ¡Ê ⁄U„UÊ „ÒU– ß‚∑§Ê ÁflSÃÊ⁄U ∑§„UÊ¢ Ã∑§ „ÈU•Ê „ÒU ÿ„U •ª‹ ¬Îc∆U ¬⁄U ÁŒπÊÿÊ ªÿÊ „ÒU–
13

2.6 Page 16

▲back to top


HIV/AIDS SPREADS ACROSS INDIA
÷Ê⁄Uà ◊¥ ∞ø •Ê߸U flË/∞«˜U‚ ∑§Ê »Ò§‹Êfl
Prevalence of HIV Infection among Pregnant
Women at Antenatal Care Clinics,
by District, India, 2005
¬˝‚fl ¬Ífl¸ ÁøÁ∑§à‚Ê ∑§ãº˝Ù¥ ◊¥ ª÷¸flÃË ◊Á„U‹Ê•Ù¥ ◊¥ ∞ø •Ê߸ flË
‚¢∑˝§◊áÊ ∑§Ë √ÿʬ∑§ÃÊ, Á¡‹ flÊ⁄U, ÷Ê⁄UÃ, wÆÆz
NACO
ŸÊ∑§Ù
14
Percent infected with HIV
∞ø •Ê߸U flË ‚¢∑˝§Á◊à ¬˝ÁÇÊÃ
1.00 AND ABOVE / 1.ÆÆ •ı⁄U •Áœ∑§
0.99 AND BELOW / Æ.~~ •ı⁄U ∑§◊
NIL / ∑ȧ¿U Ÿ„UË¥
NO ANC SITE / ∞ ∞Ÿ ‚UË ∑§ãº˝ Ÿ„UË¥ „Ò¥U
Note: Mean (Urban + Rural)
ŸÊ≈U— •ÊÒ‚Ã (‡Ê„U⁄UË + ª˝Ê◊ËáÊ)
Map not to scale
◊ÊŸÁøòÊ ◊ʬ∑ ⁄Á„Ã

2.7 Page 17

▲back to top


HIV/AIDS SPREADS ACROSS INDIA
÷Ê⁄Uà ◊¥ ∞ø •Ê߸U flË/∞«˜U‚ ∑§Ê »Ò§‹Êfl
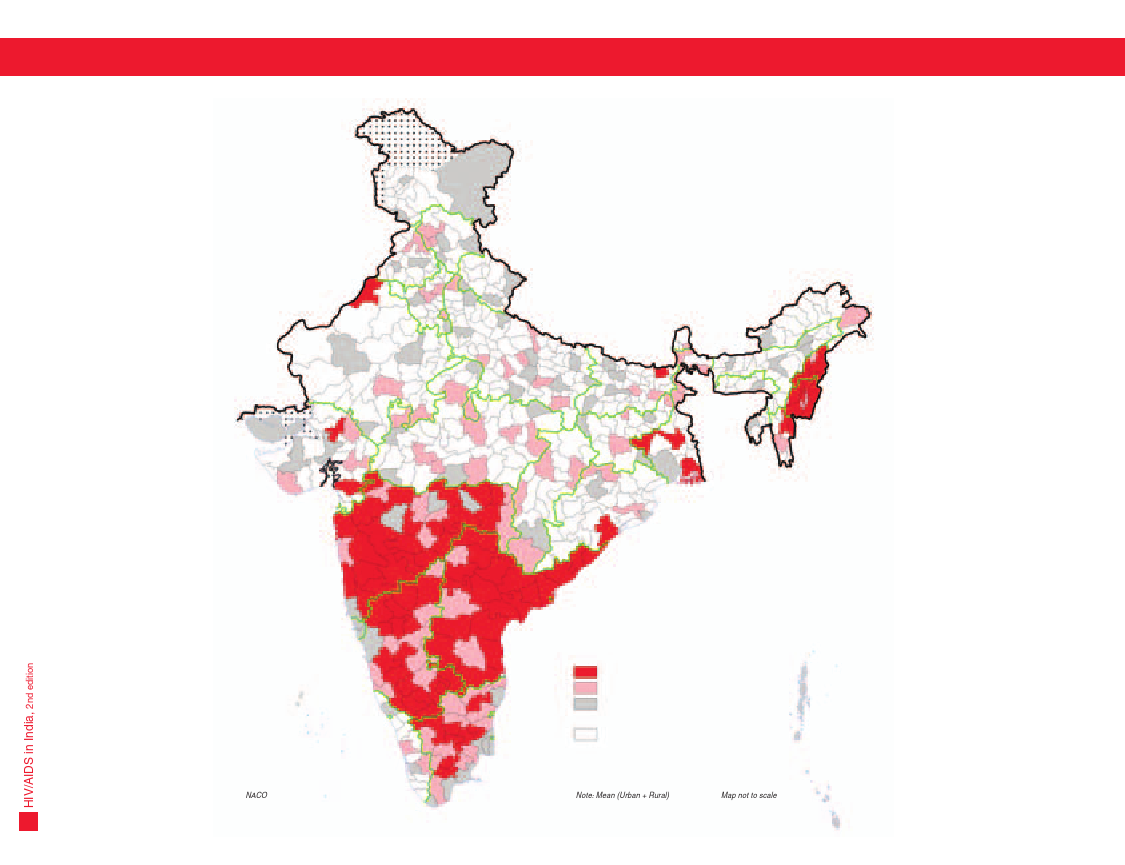
The map on the opposite page shows the percentage of pregnant women who tested positive for HIV infection at antenatal clinics (ANC) throughout
India. When one percent or more of the ANC women test positive for HIV and five percent or more of patients at sexually transmitted disease (STD)
clinics also test positive, NACO considers an area to be of high HIV prevalence. Women at ANC clinics are considered to be of low-risk of HIV since
they are assumed not to engage in high-risk sexual behaviour. As such, they provide an indication of the degree to which HIV has spread into the
population as a whole.
Women who have become HIV-positive are often infected by their husbands who act as a “bridge,” carrying HIV from sex workers they have
frequented to their wives. In addition, some women may themselves be involved in formal or informal sex work and subsequently infect their
husbands. Sadly, HIV can also be transmitted from a pregnant woman to her unborn child or during breastfeeding so that the child will begin life
with this deadly disease as well as the societal stigma that goes with it. The map shows that HIV has become well established among the general
population in the south, as indicated by prevalence at ANC sites and has begun to spread from high-risk to low-risk groups in the north.
‚Ê◊Ÿ flÊ‹ ¬ÎDÔU ¬⁄U ŸÄ‡ÊÊ ¬Í⁄U ÷Ê⁄Uà ◊¥ ¬˝‚fl¬Ífl¸ Œπ÷Ê‹ ÁøÁ∑§à‚Ê ∑§ãº˝Ê¥ (∞ ∞Ÿ ‚Ë) ¬⁄U ª÷¸flÃË ◊Á„U‹Ê•Ê¥ ∑§ ¬˝ÁÇÊà ∑§Ê Œ‡ÊʸÃÊ „ÒU ¡Ê ¡Ê¢ø ∑§⁄UŸ ¬⁄U ∞ø •Ê߸ flË ‚¢∑˝§◊áÊ ∑§ Á‹∞ ¬ÊÚÁ$¡Á≈Ufl ¬Ê∞
ª∞– ¡’ ∞∑§ ¬˝ÁÇÊà ÿÊ •Áœ∑§ ∞ ∞Ÿ ‚Ë ◊Á„U‹Ê•Ê¥ ∑§Ë ∞ø •Ê߸ flË ¡Ê¢ø ¬ÊÚÁ$¡Á≈Ufl ¬ÊÿË ªß¸U •ÊÒ⁄U ÿÊÒŸ ‚¢øÊÁ⁄Uà ⁄UÊª (∞‚ ≈UË «UË) ÁøÁ∑§à‚Ê ∑§ãº˝Ê¥ ¬⁄U ¡Ê¢ø ∑§Ë Á⁄U¬Ê≈¸U ¬Ê¢ø ¬˝ÁÇÊà ÿÊ •Áœ∑§ „UÊ
ÃÊ ©U‚ ˇÊòÊ ∑§Ê ŸÊ∑§Ù ©Uëø SÃ⁄UËÿ ∞ø •Ê߸ flË √ÿʬ∑§ÃÊ flÊ‹Ê ˇÊòÊ ◊ÊŸÃÊ „ÒU– ∞ ∞Ÿ ‚Ë ÁøÁ∑§à‚Ê ∑§ãº˝Ê¥ ◊¥ ◊Á„U‹Ê•Ê¥ ∑§Ê ∞ø •Ê߸ flË ∑§ ÁŸ◊A ¡ÊÁπ◊¬Íáʸ ◊¥ ◊ÊŸÊ ¡ÊÃÊ „ÒU ÄÿÊ¥Á∑§ ©UŸ∑§ ‚¢’¢œ ◊¥
ÿ„U ◊ÊŸÊ ¡ÊÃÊ „ÒU Á∑§ fl Á∑§‚Ë ©Uëø ¡ÊÁπ◊¬Íáʸ flÊ‹ ÿÊÒŸ √ÿfl„UÊ⁄U ◊¥ Ÿ„UË¥ ‹ªË „Ò¥U– fl ÿ„U ÷Ë ’ÃÊÃ „Ò¥U Á∑§ Á∑§‚ „UŒ Ã∑§ •Ê’ÊŒË ◊¥ ∞ø •Ê߸ flË ¬Í⁄UË Ã⁄U„U »Ò§‹ øÈ∑§Ê „ÒU–
¡Ê ◊Á„U‹Ê∞¢ ∞ø •Ê߸ flË ¬ÊÚÁ$¡Á≈Ufl ¬Ê߸ ¡ÊÃË „ÒU, ©Uã„¥U •Ä‚⁄U ÿ„U ’Ë◊Ê⁄UË •¬Ÿ ¬Áà ‚ Á◊‹ÃË „ÒU ¡Ê ∞ø •Ê߸ flË ∑§Ê ÿÊÒŸ∑§◊˸ ‚ •¬ŸË ¬%Ë Ã∑§ »Ò§‹ÊŸ ◊¥ ∞∑§ ““‚ÃÈ”” ∑§Ê ∑§Ê◊ ∑§⁄UÃ „Ò¥U– ß‚∑§
•‹ÊflÊ, ∑ȧ¿U ◊Á„U‹Ê∞¢ Sflÿ¢ ÷Ë •ÊÒ¬øÊÁ⁄U∑§ ÿÊ •ŸÊÒ¬øÊÁ⁄U∑§ M§¬ ‚ ÿÊÒŸ ∑§ÊÿÊZ ◊¥ Á‹# „UÊÃË „Ò¥U •ÊÒ⁄U ¬Á⁄UáÊÊ◊SflM§¬ •¬Ÿ ¬ÁÃÿÊ¥ ∑§Ê ‚¢∑˝§Á◊à ∑§⁄U ŒÃË „Ò¥U– ÿ„U ŒÈ—π ∑§Ë ’Êà „ÒU Á∑§ ∞ø •Ê߸ flË
ª÷¸flÃË ◊Á„U‹Ê ‚ ÿÊ S߬ʟ ∑§⁄UÊŸ ¬⁄U ’ëø ∑§Ê ÷Ë „UÊ ‚∑§ÃÊ „ÒU, •ÊÒ⁄U ’ëøÊ ß‚ ÉÊÊÃ∑§ ⁄UÊª ∑§ ‚ÊÕ •¬ŸÊ ¡ËflŸ ‡ÊÈM§ ∑§⁄UªÊ, ß‚∑§ ‚ÊÕ „UË ‚Ê◊ÊÁ¡∑§ ∑§‹¢∑§ ÷Ë ©U‚∑§ ‚ÊÕ Áø¬∑§Ê ⁄U„UÃÊ „ÒU–
ŸÄ‡ÊÊ ÁŒπÊÃÊ „ÒU Á∑§ ŒÁˇÊáÊ ∑§ ⁄UÊÖÿÊ¥ ◊¥ ∞ø •Ê߸ flË •Ê◊ ‹ÙªÙ¥ ∑§ ’Ëø »Ò§‹ øÈ∑§Ê „ÒU, ÿ„U ∞ ∞Ÿ ‚Ë ∑§ãº˝Ê¥ ∑§Ë ◊ÊÒ¡ÍŒªË ‚ ÷Ë S¬CÔU „ÒU •ÊÒ⁄U ŒÁˇÊáÊ ∑§ •Áœ∑§ ¡ÊÁπ◊¬Íáʸ flÊ‹ ˇÊòÊÊ¥ ‚ ©UûÊ⁄U ∑§ ∑§◊
¡ÊÁπ◊¬Íáʸ flÊ‹ ˇÊòÊÊ¥ ◊¥ »Ò§‹Ÿ ‹ªÊ „ÒU–
15

2.8 Page 18

▲back to top


AWARENESS OF HIV/AIDS
∞ø •Ê߸U flË/∞«˜U‚ ◊¥ ¡ÊªM§∑§ÃÊ
Before people can take steps to avoid
HIV infection, they clearly must be
aware of the disease and the nature
of its threat. NACO has conducted
two national Behavioural Surveillance
Surveys (BSS), one in 2001 and the
second in 2006, to investigate a wide
variety of issues related to HIV/AIDS.
The surveys show the significant
progress India has made in informing
the population of the threat of HIV.
From 2001 to 2006, the percentage
of survey respondents who said that
they had heard of HIV/AIDS rose
from 67 percent to 80 percent.
But both the level of knowledge and
the increase from 2001 to 2006
varied greatly from state to state.
In some states, the level of
awareness of HIV/AIDS varies
considerably between men and
women, particularly where the overall
level of knowledge is low. In every
state, HIV/AIDS knowledge is lower
among women than among men.
This lack of awareness increases the
risk of contracting the disease among
women, particularly if their husbands
act as a “bridge,” infecting them
with HIV. However, the surveys also
show that the national level of
awareness among women did
rise from 59 percent in the 2001
BSS to 73 percent in 2006, a larger
increase than among men (from
76 percent to 87 percent).
16
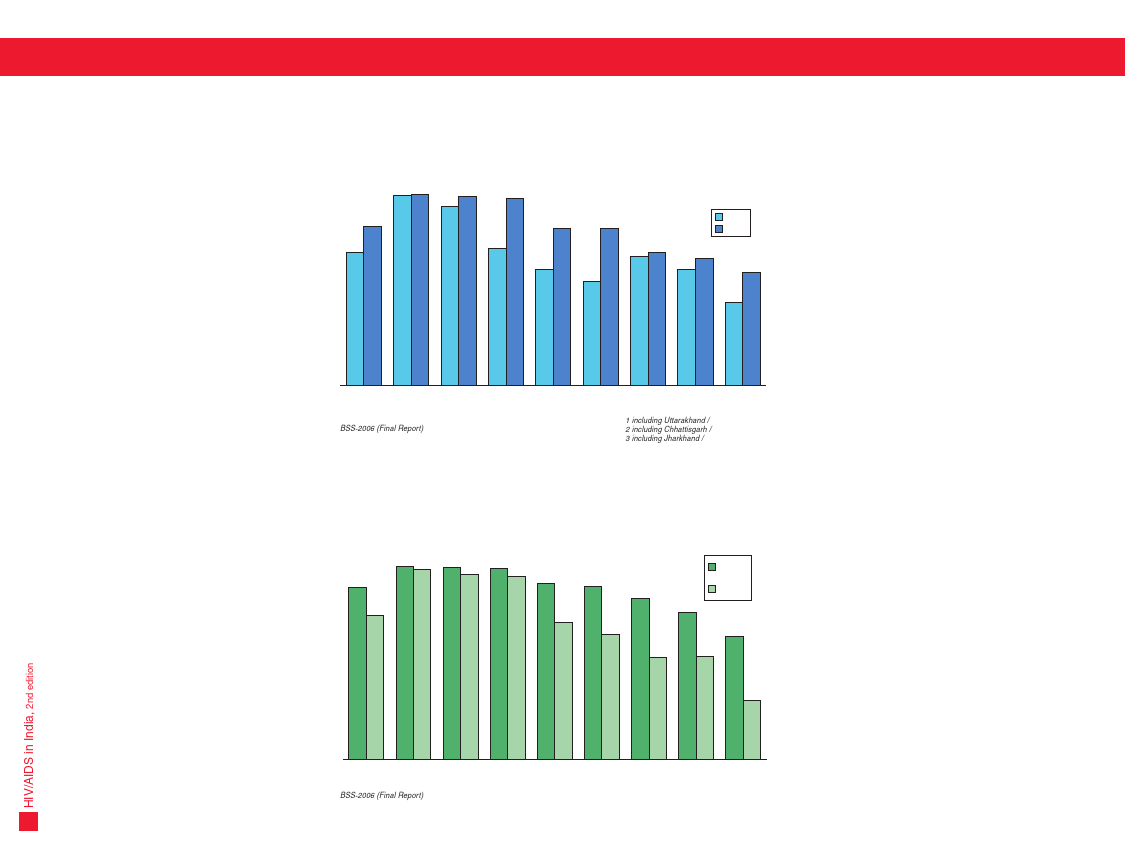
Percent of Respondents, Ages 15-49, Saying That They Have Heard of
HIV or AIDS or Both, Selected States and India, 2001 and 2006
÷Ê⁄Uà •ı⁄U øÈÁŸ¢ŒÊ ⁄UÊÖÿÙ¥ ◊¥ vz-y~ fl·¸ •ÊÿÈ flª¸ ∑§ ¬˝àÿÊÕ˸ÿÙ¥ ∑§Ê ¬˝ÁÇÊà Á¡ã„UÙ¥Ÿ
∞ø •Ê߸U flË ÿÊ ∞«˜U‚ ÿÊ ŒÙŸÙ¥ ∑§ Áfl·ÿ ◊¥ ‚ÈŸÊ „ÒU, wÆÆv •ı⁄U wÆÆ{
80
67
96 97
96
90
95
69
80
59
80
53
65 67
64
59
2001
2006
57
42
INDIA Andhra Pradesh Tamil Nadu
÷Ê⁄Uà •Êãœ˝ ¬˝Œ‡Ê ÃÁ◊‹ ŸÊ«È
BSS-2006 (Final Report)
’Ë∞‚∞‚-wÆÆ{ (»§Êߟ‹ Á⁄U¬Ù≈¸U)
Assam
•‚◊
Gujarat
ªÈ¡⁄UÊÃ
Uttar Pradesh1 Rajasthan Madhya Pradesh2 Bihar3
©UûÊ⁄U ¬˝Œ‡Ê1 ⁄UÊÖÿSÕÊŸ ◊äÿ ¬˝Œ‡Ê2 Á’„UÊ⁄ 3U
1 including Uttarakhand / ©UûÊ⁄UÊπá«U ‚Á„UÃ
2 including Chhattisgarh / ¿UûÊË‚ª…∏U ‚Á„UÃ
3 including Jharkhand / ¤ÊÊ⁄Uπá«U ‚Á„UÃ
Percent of Respondents, Ages 15-49, Saying That They Have Heard
of HIV or AIDS or Both, by Sex, Selected States and India, 2006
÷Ê⁄Uà •ı⁄U øÈÁŸ¢ŒÊ ⁄UÊÖÿÙ¥ ◊¥ vz-y~ fl·¸ •ÊÿÈ flª¸ ∑§ ¬˝àÿÊÕ˸ÿÙ¥ ∑§Ê ¬˝ÁÇÊà Á¡ã„UÙ¥Ÿ
∞ø •Ê߸U flË ÿÊ ∞«˜U‚ ÿÊ ŒÙŸÙ¥ ∑§ Áfl·ÿ ◊¥ ‚ÈŸÊ „ÒU, Á‹¢ªflÊ⁄U, wÆÆ{
87
73
97 96
97 94
97
93
89
69
88
64
81
51
Male
¬ÈL ·
Female
◊Á„U‹Ê
74
62
52
30
INDIA Andhra Pradesh Tamil Nadu
÷Ê⁄Uà •Êãœ˝ ¬˝Œ‡Ê ÃÁ◊‹ ŸÊ«È
BSS-2006 (Final Report)
’Ë∞‚∞‚-wÆÆ{ (»§Êߟ‹ Á⁄U¬Ù≈¸U)
Assam
•Ê‚Ê◊
Gujarat Uttar Pradesh Rajasthan Madhya Pradesh Bihar
ªÈ¡⁄UÊà ©UûÊ⁄U ¬˝Œ‡Ê ⁄UÊÖÿSÕÊŸ ◊äÿ ¬˝Œ‡Ê Á’„UÊ⁄U
ß‚‚ ¬„U‹ Á∑§ ‹Êª ∞ø •Ê߸ flË ‚¢∑˝§◊áÊ ‚
’øŸ ∑§ Á‹∞ ∑§Œ◊ ©U∆UÊ∞¢ ©UŸ∑§Ê ÿ„U ¡ÊŸŸÊ
S¬CÔU M§¬ ‚ •Êfl‡ÿ∑§ „ÒU Á∑§ ÿ„U ⁄UÊª ÄÿÊ „ÒU
•ÊÒ⁄U ß‚∑§ ÄÿÊ πÃ⁄U „Ò¥U– ŸÊ∑§Ê Ÿ ŒÊ ⁄UÊCÔ˛UËÿ
√ÿfl„UÊ⁄U ÁŸ⁄UˡÊáÊ ‚fl¸ˇÊáÊ ∑§⁄UflÊ∞, ¬„U‹Ê ‚Ÿ˜
wÆÆv ◊¥ •ÊÒ⁄ ŒÍ‚⁄UÊ ‚Ÿ˜ wÆÆ{ ◊¥, ÿ„U ¡ÊŸŸ
∑§ Á‹∞ Á∑§ ∞ø •Ê߸ flË/∞«˜U‚ ‚ ‚¢’¢ÁœÃ
◊Èg „Ò¥U– ß‚ ‚fl¸ˇÊáÊ ◊¥ ÁŒπÊÿÊ ªÿÊ „ÒU Á∑§
÷Ê⁄Uà ◊¥ ∞ø •Ê߸ flË ∑§Ë øÈŸÊÒÁÃÿÊ¥ ∑§Ê •Ê◊
¡ŸÃÊ Ã∑§ ¬„È¢UøÊÿÊ ªÿÊ ¡Ê Á∑§ ∞∑§
◊„Uàfl¬Íáʸ ¬˝ªÁà „ÒU– ‚Ÿ˜ wÆÆv ‚ ‹∑§⁄U
wÆÆ{ Ã∑§ ÿ„U ∑§„UŸ flÊ‹ Á∑§ ©Uã„UÊ¥Ÿ
∞ø •Ê߸ flË/∞«˜U‚ ∑§ ’Ê⁄U ◊¥ ‚ÈŸÊ „ÒU ∞‚
‹ÊªÊ¥ ∑§Ê ¬˝ÁÇÊà {| ‚ }Æ Ã∑§ ’…∏U ªÿÊ
¬⁄UãÃÈ ¡ÊŸ∑§Ê⁄UË ∑§ SÃ⁄U ◊¥ wÆÆv ‚ wÆÆ{
Ã∑§ ∑§Ë ’…∏Uà ∞∑§ ⁄UÊÖÿ ‚ ŒÍ‚⁄U ⁄UÊÖÿ ◊¥
Á÷ÛÊ-Á÷ÛÊ ⁄U„UË–
∑ȧ¿U ⁄UÊÖÿÊ¥ ◊¥ ∞ø •Ê߸ flË/∞«˜U‚ ∑§Ë
¡ÊªM§∑§ÃÊ ∑§Ê SÃ⁄U ¬ÈL · •ÊÒ⁄U ◊Á„U‹Ê•Ê¥ ∑§
’Ëø ’Œ‹ÃÊ „ÒU Áfl‡Ê·ÃÿÊ fl„UÊ¢ ¬⁄U ¡„UÊ¢
¬Í⁄UË Ã⁄U„U ¡ÊŸ∑§Ê⁄UË ∑§Ê SÃ⁄U ÁãÊêŸ „Ò–U ¬˝àÿ∑§
⁄UÊÖÿ ◊¥ ∞ø •Ê߸ flË/∞«˜U‚ ∑§Ë ¡ÊŸ∑§Ê⁄UË ¬ÈL
·Ê¥ ‚ ◊Á„U‹Ê•Ê¥ ◊¥ ∑§◊ „ÒU ß‚ ¬˝∑§Ê⁄U ∑§Ë
¡ÊªM§∑§ÃÊ ◊¥ ∑§◊Ë ◊Á„U‹Ê•Ê¥ ◊¥ ⁄UÊª œÊ⁄UáÊ
∑§⁄UŸ ∑§Ê ¡ÊÁπ◊ ’…∏UÊÃÊ „ÒU Áfl‡Ê·ÃÊÒ⁄U ¬⁄U
ÿÁŒ ߟ∑§ ¬Áà ““‚ÃÈ”” ∑§ M§¬ ◊¥ ©Uã„¥U ∞ø
•Ê߸ flË ‚ ‚¢∑˝§Á◊à ∑§⁄UÃ „Ò¥U– ◊Á„U‹Ê•Ê¥ ◊¥
¡ÊªM§∑§ÃÊ ∑§Ê ⁄UÊCÔ˛UËÿ SÃ⁄U ‚Ÿ˜ wÆÆv ’Ë ∞‚
∞‚ ◊¥ z~ ¬˝ÁÇÊà ‚ wÆÆ{ ◊¥ |x ¬˝ÁÇÊÃ
Ã∑§ ’…∏UÊ „ÒU, ¬ÈL ·Ê¥ ∑§ ◊È∑§Ê’‹ ◊¥ ÿ„U ’…∏UÃ
ÖÿÊŒÊ „ÒU (|{ ¬˝ÁÇÊà ‚
}| ¬˝ÁÇÊÃ)–

2.9 Page 19

▲back to top


AWARENESS OF HIV/AIDS
∞ø •Ê߸U flË/∞«˜U‚ ◊¥ ¡ÊªM§∑§ÃÊ
Simply having heard of the
existence of HIV is not sufficient.
One must also be aware of the
ways in which it can be
contracted. While the majority of
people in India did express
awareness of the principal means
by which HIV spreads and the
proportion has improved since
2001, large numbers of people are
not aware of the transmission
paths. In several states – Bihar,
Chhattisgarh, Jharkhand, Madhya
Pradesh and Rajasthan – less
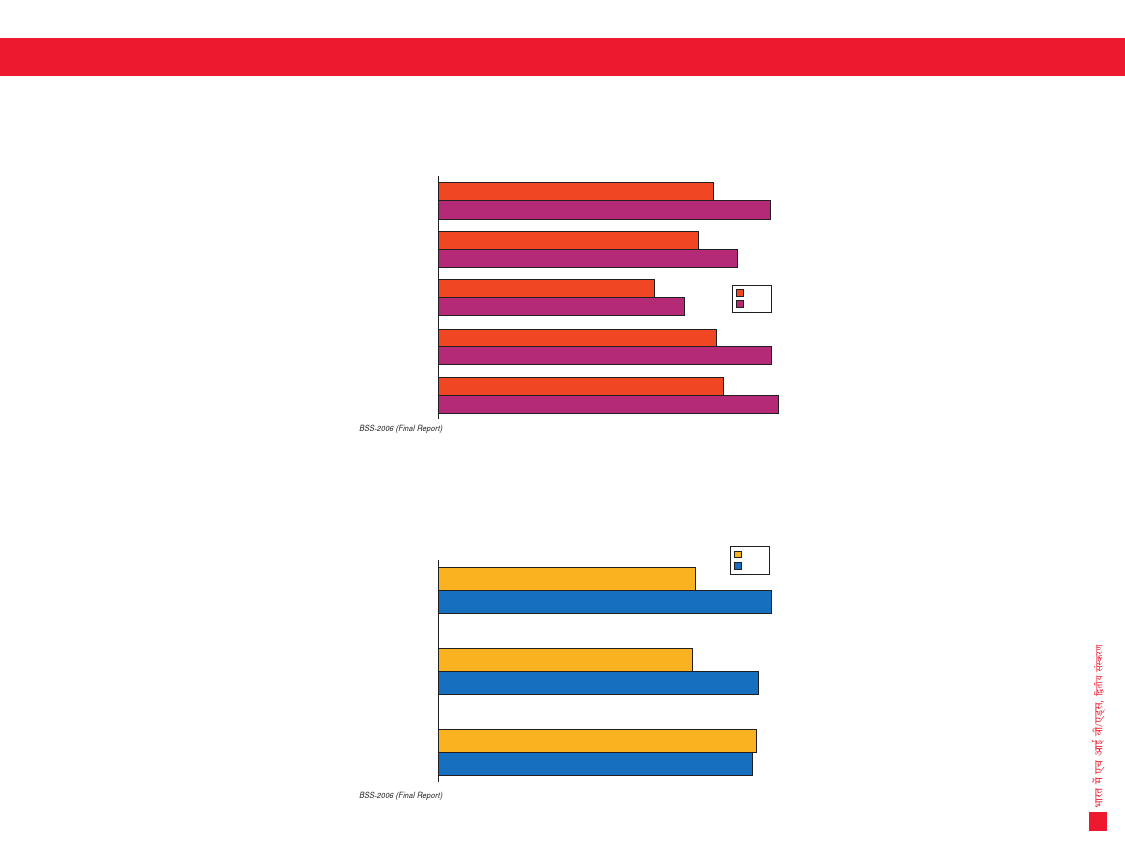
Percent of Respondents, Ages 15-49, Saying That They Have Heard of Various
Ways HIV Spreads, India, 2001 and 2006
÷Ê⁄Uà ◊¥ vz-y~ fl·¸ •ÊÿÈ flª¸ ∑§ ¬˝àÿÊÕ˸ÿÙ¥ ∑§Ê ¬˝ÁÇÊà Á¡ã„UÙ¥Ÿ ∞ø •Ê߸U flË »Ò§‹Ÿ
∑§ Á÷ãŸ-Á÷㟠Ã⁄UË∑§Ù¥ ∑§ Áfl·ÿ ◊¥ ‚ÈŸÊ „ÒU, wÆÆv •ı⁄U wÆÆ{
By sexual contact
ÿıŸ ‚¢’¢œ mÊ⁄UÊ
62
74
From mother to
unborn child
◊Ê° ‚ •¡ã◊¢ Á‡Ê‡ÊÈ ∑§Ù
58
67
Through breastfeeding
S߬ʟ mÊ⁄UÊ
49
55
2001
2006
By needle sharing
‚È߸ ∑§ ‚Ê¢¤Ê ßSÃ◊Ê‹ ‚
62
75
∑§fl‹ ∞ø •Ê߸ flË ∑§ •ÁSÃàfl ∑§ ’Ê⁄U ◊¥
‚ÈŸ ‹ŸÊ ¬ÿʸ# Ÿ„UË¥ „ÒU– ß‚∑§Ë ¡ÊŸ∑§Ê⁄UË
÷Ë „UÊŸÊ •Êfl‡ÿ∑§ „ÒU Á∑§ ÿ„U „UÊÃÊ ∑Ò§‚
„ÒU– ÷Ê⁄Uà ◊¥ •Áœ∑§Ã⁄U ‹ÊªÊ¥ Ÿ ÿ„U ¡ÃÊÿÊ
„ÒU Á∑§ ©Uã„¥U ∞ø •Ê߸ flË »Ò§‹Ÿ ∑§ ◊ÈÅÿ
∑§Ê⁄UáÊÙ¥ ∑§ Áfl·ÿ ◊¥ ¡ÊªM§∑§ÃÊ „ÒU •ÊÒ⁄U
‚Ÿ˜ wÆÆv ‚ ÿ„U •ŸÈ¬Êà ’…∏UÊ „ÒU, ∞∑§
’«∏UË ¡Ÿ‚¢ÅÿÊ ∑§Ê ‚¢øÊ⁄UáÊ ∑§ ¡Á⁄UÿÙ¥ ∑§Ê
ôÊÊŸ Ÿ„UË¥ „Ò– ∑§ß¸U ⁄UÊÖÿÙ¥ - Á’„UÊ⁄U,
¿UûÊË‚ª…∏U, ¤ÊÊ⁄Uπ¢«U, ◊äÿ ¬˝Œ‡Ê •ÊÒ⁄U
⁄UÊ¡SÕÊŸ - ◊¥ •Êœ ‚ ÷Ë ∑§◊ ◊Á„U‹Ê•Ê¥
∑§Ê ÿ„U ¡ÊªM§∑§ÃÊ ÕË Á∑§ ∞ø •Ê߸ flË
than half of women were aware
that HIV spreads through sexual
contact. Additionally, awareness
that HIV can be passed to a child
by breastfeeding was particularly
low, expressed by only about
half of the respondents in both
surveys. This is especially tragic
since that mode of transmission
can be easily avoided.
Beyond knowledge of the
existence of HIV and the ways in
which it spreads, knowledge of
the steps one can take to avoid
infection is clearly necessary.
While awareness on this vital
issue has been rising, the BSS
By blood transfusion
⁄UÄà ‚¢øÊ⁄UáÊ
BSS-2006 (Final Report)
’Ë∞‚∞‚-wÆÆ{ (»§Êߟ‹ Á⁄U¬Ù≈¸U)
64
76
Percent of Respondents, Ages 15-49, Knowing Various Ways to Prevent
HIV Infection, India, 2001 and 2006
÷Ê⁄Uà ◊¥ ∞ø •Ê߸U flË ‚¢∑˝§◊áÊ ∑§Ù ⁄UÙ∑§Ÿ ∑§ ÁflÁ÷㟠Ã⁄UË∑§Ù¥ ‚ ¬Á⁄UÁøà vz-y~ fl·¸
•ÊÿÈ flª¸ ∑§ ¬˝àÿÊÕ˸ÿÙ¥ ∑§Ê ¬˝ÁÇÊÃ, wÆÆv •ı⁄U wÆÆ{
Consistent condom use
∑§á«UÙ◊ ∑§Ê ÁŸ⁄¢UÃ⁄U ¬˝ÿÙª
2001
2006
50
65
One faithful
uninfected partner
∞∑§ fl»§ÊŒÊ⁄U
•‚¢∑˝§Á◊à ‚ÊÕË
50
63
ÿÊÒŸ ‚¢¬∑¸§ mÊ⁄UÊ »Ò§‹ÃÊ „ÒU– ß‚∑§ •ÁÃÁ⁄UQ§
S߬ʟ mÊ⁄UÊ ©UŸ∑§ Á‡Ê‡ÊÈ ◊¥ ∞ø •Ê߸ flË
»Ò§‹Ÿ ∑§Ë ¡ÊªM§∑§ÃÊ Áfl‡Ê·ÃÊÒ⁄U ¬⁄U ∑§◊
ÕË– ŒÊŸÊ¥ ‚fl¸ˇÊáÊÊ¥ ◊¥ ‚ ∑§fl‹ •Êœ ‹ÊªÊ¥
Ÿ •¬Ÿ ◊à ⁄Uπ– ÿ„U Áfl‡Ê· M§¬ ‚
‡ÊÊ∑§¬Íáʸ „ÒU ÄÿÊ¥Á∑§ ‚¢øÊ⁄UáÊ ∑§ ß‚ ◊Êäÿ◊
∑§Ù ‚⁄U‹ÃÊ ‚ ⁄UÙ∑§Ê ¡Ê ‚∑§ÃÊ „ÒU–
∞ø •Ê߸ flË ∑§ •ÁSÃàfl ∑§Ë ¡ÊŸ∑§Ê⁄UË
•ÊÒ⁄U fl ⁄UÊSÃ Á¡Ÿ‚ ÿ„U »Ò§‹ÃÊ „ÒU ß‚∑§
•ÁÃÁ⁄UQ§ ß‚∑§ ‚¢∑˝§◊áÊ ∑§Ê Ÿ$¡⁄U•¢ŒÊ$¡
∑§⁄UŸ ∑§Ë ¡ÊŸ∑§Ê⁄UË S¬c≈ M§¬ ‚ •Êfl‡ÿ∑§
„ÒU ß‚ ◊„Uàfl¬Íáʸ ◊Èg ¬⁄U ¡ÊªM§∑§ÃÊ
’…∏U ⁄U„UË „ÒU– √ÿfl„UÊ⁄U ÁŸÁ⁄UˇÊáÊ ‚fl¸
(’Ë ∞‚ ∞‚) ÿ„U ‚¢∑§Ã ŒÃÊ „ÒU Á∑§
÷Ê⁄Uà ∑§ ∞∑§ ÁÄUÊ߸ ‹Êª •÷Ë ÷Ë
indicates that one-third of people
in India are still unaware of
several fundamental ways to avoid
HIV. Further, the BSS also shows
that such knowledge remains
lower for women than for men.
By sexual abstinence
ÿıŸ ‚¢’¢œÙ¥ ◊¥ ‚¢ÿ◊
BSS-2006 (Final Report)
’Ë∞‚∞‚-wÆÆ{ (»§Êߟ‹ Á⁄U¬Ù≈¸U)
∞ø •Ê߸ flË ‚ ’øŸ ∑§ ’„ÈUà ‚
62
•ÊœÊ⁄U÷Íà ⁄UÊSÃÊ¥ ‚ •ŸÁ÷ôÊ „Ò¥U–
’Ë ∞‚ ∞‚ ÿ„U ÷Ë ÁŒπÊÃÊ „ÒU Á∑§
61
∞‚Ë ¡ÊŸ∑§Ê⁄UË ¬ÈL ·Ê¥¢ ∑§ ◊È∑§Ê’‹ ◊¥
◊Á„U‹Ê•Ê¥ ◊¥ ∑§◊ „UÊÃË „Ò–
17

2.10 Page 20

▲back to top


KNOWLEDGE AND USE OF THE CONDOM
∑§á«UÙ◊ ∑§Ë ¡ÊŸ∑§Ê⁄UË •ı⁄U ¬˝ÿÊª
Awareness of the condom and
its role in avoiding HIV has
become nearly universal in some
states of India although, in others,
there is much more work to be
done. Condom awareness has
shown a particularly sharp rise in
the northeastern states where HIV
often spreads through intravenous
drug users who share needles,
a group that may be more difficult
to reach.
Knowledge of HIV infection, its
routes of transmission and ways
to avoid it is more widespread
among those with higher levels of
education. Virtually all of those
who are graduate or with higher
education were aware of the
condom in the 2006 BSS while
only a little more than half of
illiterates were. While such a
disparity may not be unexpected,
it shows that public education
programmes must use a wide
variety of techniques to reach
a population with very diverse
educational and literacy levels.
18
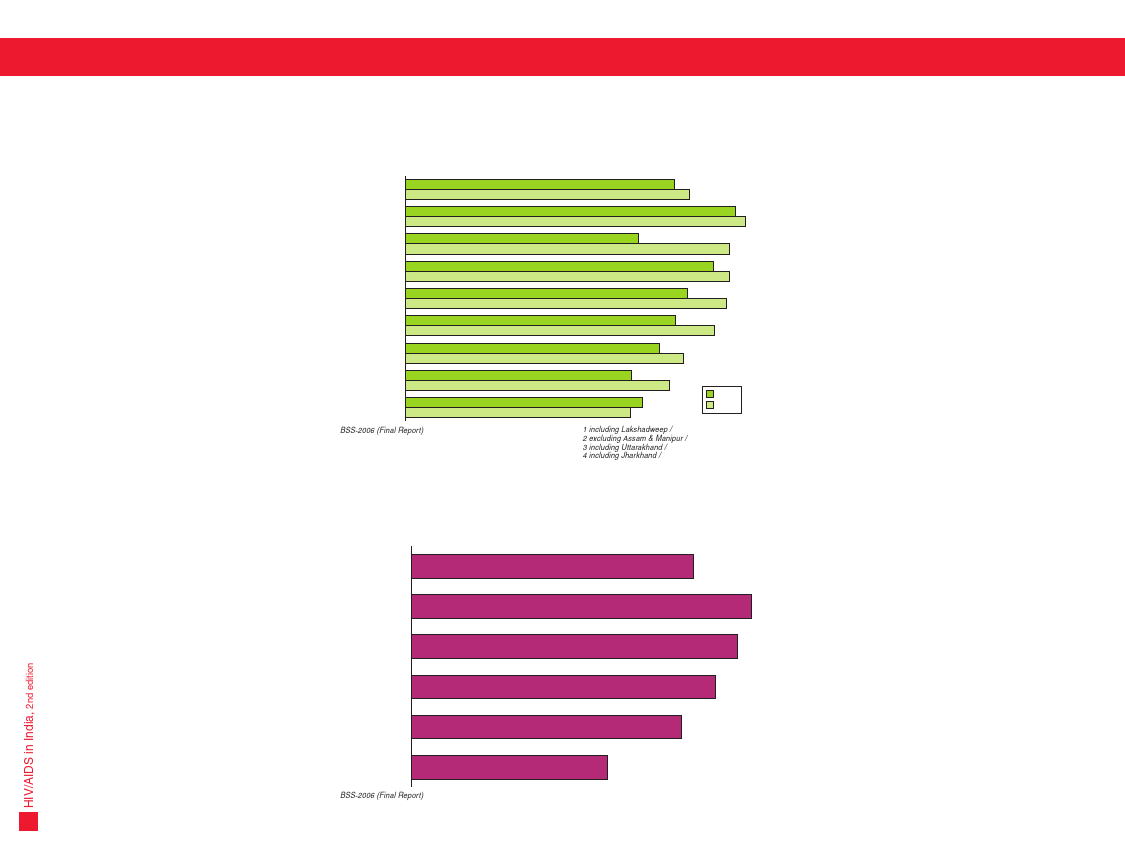
Percent of Respondents, Ages 15-49, Aware of the Condom, Selected States
and India, 2001 and 2006
÷Ê⁄Uà •ı⁄U øÈÁŸ¢ŒÊ ⁄UÊÖÿÙ¥ ◊¥ vz-y~ fl·¸ •ÊÿÈ flª¸ ∑§ ¬˝àÿÊÕ˸ÿÙ¥ ∑§Ê ¬˝ÁÇÊà Á¡ã„¥U
∑§á«UÙ◊ ∑§ ’Ê⁄U ◊¥ ¡ÊŸ∑§Ê⁄UË „ÒU, wÆÆv •ı⁄U wÆÆ{
INDIA
77
÷Ê⁄UÃ
82
Kerala1
95
∑§⁄U‹1
98
N. E. States2
©UûÊ⁄U ¬Ífl˸ ⁄UÊÖÿ2
67
93
Haryana
„UÁ⁄UÿÊáÊÊ
89
93
Uttar Pradesh3
©UûÊ⁄U ¬˝Œ‡Ê3
81
93
Maharashtra
◊„UÊ⁄UÊc≈U˛
Tamil Nadu
ÃÁ◊‹ ŸÊ«ÈU
78
89
73
80
Orissa
©U«∏UË‚Ê
Bihar4
Á’„UÊ⁄ 4
65
76
68
65
2001
2006
BSS-2006 (Final Report)
’Ë∞‚∞‚-wÆÆ{ (»§Êߟ‹ Á⁄U¬Ù≈¸U)
1 including Lakshadweep / ‹ˇÿmˬ ‚Á„UÃ
2 excluding Assam & Manipur / •Ê‚Ê◊ •ÊÒ⁄U ◊áÊˬÈ⁄U ⁄Á„UÃ
3 including Uttarakhand / ©UûÊ⁄UÊπá«U ‚Á„UÃ
4 including Jharkhand / ¤ÊÊ⁄Uπá«U ‚Á„UÃ
Percent of Respondents, Ages 15-49, Saying That They Have Heard of
or Seen a Condom, by Educational Level, India, 2006
÷Ê⁄Uà ◊¥ vz-y~ fl·¸ •ÊÿÈ flª¸ ∑§ ¬˝àÿÊÕ˸ÿÙ¥ ∑§Ê ¬˝ÁÇÊà ¡Ù ∑§„UÃ „Ò¥U Á∑§ ©Uã„UÙ¥Ÿ ∑§á«UÙ◊
∑§ ’Ê⁄U ◊¥ ‚ÈŸÊ „ÒU, Á‡ÊˇÊÊ SÃ⁄U mÊ⁄UÊ, ÷Ê⁄UÃ, wÆÆ{
TOTAL
∑ȧ‹
82
Graduate and above
SŸÊÃ∑§ ÿÊ SŸÊÃ∑§ ‚ ©UìÊ
Secondary+
higher secondary
◊ÊäÿÁ◊∑§,
©UëøûÊ⁄ ◊ÊäÿÁ◊∑§
Middle
¬Ífl¸ ◊ÊäÿÁ◊∑§
99
95
88
Literate+primary
¬˝ÊÕÁ◊∑§ M§¬ ‚ ‚ÊˇÊ⁄U
78
Illiterate
57
ÁŸ⁄UˇÊ⁄U
BSS-2006 (Final Report)
’Ë∞‚∞‚-wÆÆ{ (»§Êߟ‹ Á⁄U¬Ù≈¸U)
∑§á«UÙ◊ ∑§ ’Ê⁄U ◊¥ ¡ÊŸ∑§Ê⁄UË •ÊÒ⁄U
∞ø •Ê߸ flË ∑§Ê Ÿ$¡⁄U•¢ŒÊ$¡ ∑§⁄UŸ ◊¥ ß‚∑§Ë
÷ÍÁ◊∑§Ê èÊÊ⁄Uà ∑§ ∑ȧ¿U ⁄UÊÖÿÊ¥ ◊¥ ‚fl¸√ÿʬ∑§
„UÊ ªß¸ „ÒU, ∑ȧ¿U •ãÿ ⁄UÊÖÿÊ¥ ◊¥ ’„ÈUà ‚Ê ∑§Ê◊
„UÊŸÊ ’Ê∑§Ë „ÒU– ©UûÊ⁄U¬Ífl˸ ⁄UÊÖÿÊ¥ ◊¥ ∑§á«UÙ◊
∑§Ë ¡ÊŸ∑§Ê⁄UË Ã¡Ë ‚ ’…∏UË „ÒU ¡„UÊ¢ ¬⁄U
∞ø •Ê߸ flË •Ä‚⁄U Ÿ‚Ê¥ ◊¥ ‚È߸ ‹ªÊ∑§⁄U
Ÿ‡ÊÊ ∑§⁄UŸ flÊ‹Ê¥ ∑§ mÊ⁄UÊ »Ò§‹ÃÊ „ÒU ¡Ê ‚È߸
∑§Ê ‚Ê¢¤ÊÊ ¬˝ÿÙª ∑§⁄UÃ „Ò¥U– ÿ„U ∞‚Ê ‚◊Í„U „ÒU
¡„UÊ¢ Ã∑§ ¬„È¢Uø ¬ÊŸÊ ’„ÈUà ∑§Á∆UŸ „ÒU–
∞ø •Ê߸ flË ∑§Ë ¡ÊŸ∑§Ê⁄UË, ß‚∑§ ‚¢øÊ⁄UáÊ ∑§
⁄UÊSÃ •ÊÒ⁄U ß‚ Ÿ$¡⁄U•¢ŒÊ$¡ ∑§⁄UŸ ∑§ ⁄UÊSÃ ©UŸ
‹ÊªÊ¥ ◊¥ •Áœ∑§ ◊ÊòÊÊ ◊¥ »Ò§‹ „ÈU∞ „Ò¥U Á¡Ÿ∑§Ë
Á‡ÊˇÊÊ ∑§Ê SÃ⁄U ™°§øÊ „ÒU– ‚Ÿ˜ wÆÆ{
’Ë ∞‚ ∞‚ ◊¥ SŸÊÃ∑§ SÃ⁄U ∑§ ÿÊ ß‚‚
•Áœ∑§ Á‡ÊˇÊÊ flÊ‹ Á¡ã„¥U ∑§á«UÙ◊ ∑§Ë
¡ÊŸ∑§Ê⁄UË ÕË fl„UË¥ ŒÍ‚⁄UË •Ê⁄U •Êœ ‚ ∑ȧ¿U
•Áœ∑§ ÁŸ⁄UˇÊ⁄U ‹Êª Õ– ¡’Á∑§ ß‚ Ã⁄U„U ∑§Ë
•‚◊ÊŸÃÊ ∑§Ë •Ê‡ÊÊ Ÿ„UË¥ ∑§Ë ¡Ê ‚∑§ÃË „ÒU,
ÿ„U Œ‡ÊʸÃÊ „ÒU Á∑§ ¡ŸÃÊ ∑§Ê Á‡ÊÁˇÊà ∑§⁄UŸ
flÊ‹ ∑§Êÿ¸∑˝§◊Ê¥ ◊¥ ÁflÁ÷ÛÊ Ã∑§ŸË∑§Ê¥ ∑§Ê
ßSÃ◊Ê‹ Á∑§ÿÊ ¡ÊŸÊ øÊÁ„U∞ ÃÊÁ∑§ ‹ÙªÙ¥ Ã∑§
ÁflSÃÎà ‡ÊÒÁˇÊ∑§ •ÊÒ⁄U ‚ÊˇÊ⁄UÃÊ ∑§ SÃ⁄UÊ¥ ∑§ ‚ÊÕ
¬„È¢UøÊ ¡Ê ‚∑§–

3 Pages 21-30

▲back to top


3.1 Page 21

▲back to top


KNOWLEDGE AND USE OF THE CONDOM
∑§á«UÙ◊ ∑§Ë ¡ÊŸ∑§Ê⁄UË •ı⁄U ¬˝ÿÊª
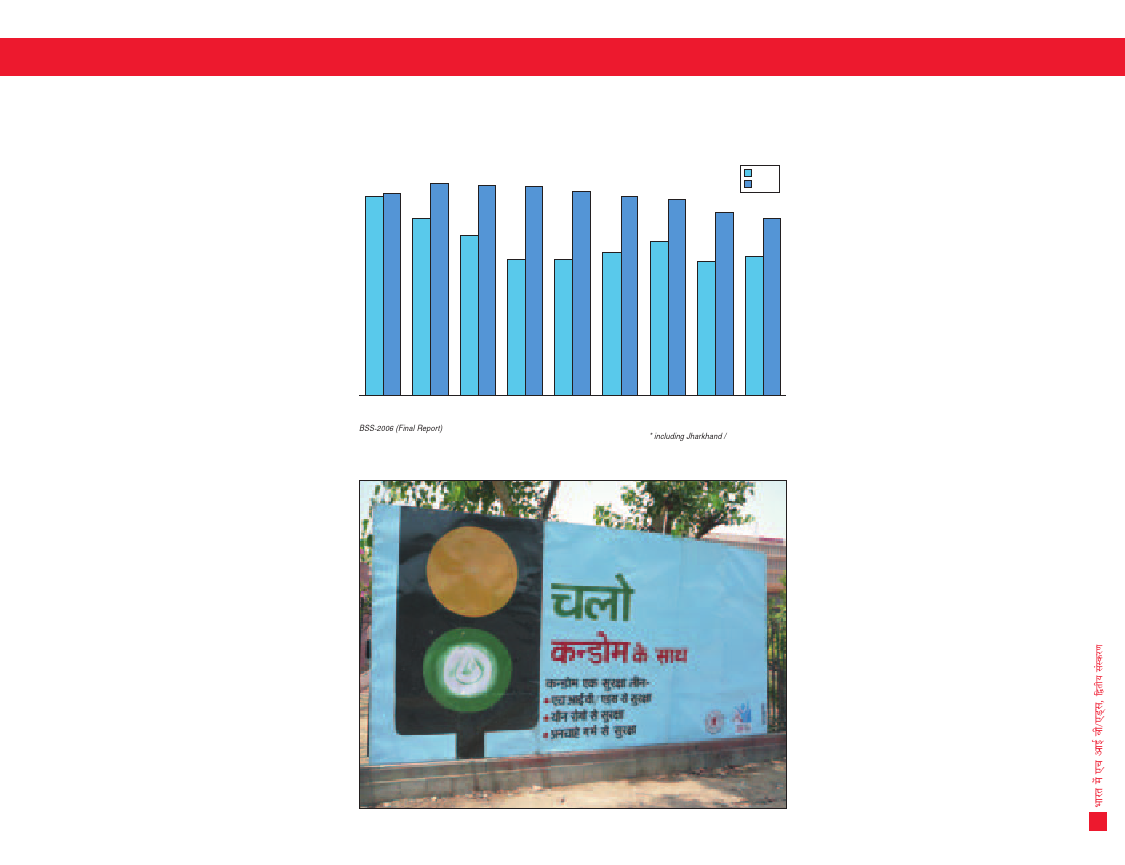
In addition to awareness of the
condom itself and its role in
preventing HIV, it is also essential
for those who need them to be
aware of a source where condoms
can be procured or purchased.
From 2001 to 2006, there was a
sharp increase in the percentage
of respondents who said that
condoms were easily available in
their area. It should be kept in
mind, however, that figures in the
graph are limited to those who
were also aware of the condom.
Nonetheless, BSS survey results
do show that informational
programmes about the condom
have had a considerable effect.
Percent of Respondents, Ages 15-49, Saying That Condoms Are Easily Available
in Their Area, Selected States and India, 2001 and 2006
÷Ê⁄Uà •ı⁄U øÈÁŸ¢ŒÊ ⁄UÊÖÿÙ¥ ◊¥ vz-y~ fl·¸ •ÊÿÈ flª¸ ∑§ ¬˝àÿÊÕ˸ÿÙ¥ ∑§Ê ¬˝ÁÇÊà ¡Ù ∑§„UÃ „Ò¥U
Á∑§ ©UŸ∑§ ˇÊòÊ ◊¥ ∑§á«UÙ◊ •Ê‚ÊŸË ‚ ©U¬‹éœ „Ò¥U, wÆÆv •ı⁄U wÆÆ{
89 90
94
94
93
91
89
87
2001
2006
82
79
79
71
69
64
61
60
60
62
INDIA Andhra Pradesh Rajasthan
÷Ê⁄Uà •Êãœ˝ ¬˝Œ‡Ê ⁄UÊ¡SÕÊŸ
BSS-2006 (Final Report)
’Ë∞‚∞‚-wÆÆ{ (»§Êߟ‹ Á⁄U¬Ù≈¸U)
Maharashtra
◊„UÊ⁄UÊc≈˛U
Bihar*
Á’„UÊ⁄ *
Tamil Nadu Manipur
ÃÁ◊‹ ŸÊ«È ◊ÁáʬÈ⁄
Orissa Karnataka
©U«∏UË‚ÊU ∑§ŸÊ¸≈U∑§
* including Jharkhand / ¤ÊÊ⁄Uπá«U ‚Á„UÃ
∑§á«UÙ◊ ∑§Ë ¡ÊŸ∑§Ê⁄UË •ÊÒ⁄U ∞ø •Ê߸ flË
⁄UÊ∑§Ÿ ◊¥ ß‚∑§Ë ÷ÍÁ◊∑§Ê ∑§Ë ¡ÊŸ∑§Ê⁄UË ∑§
•ÁÃÁ⁄UQ§ Á¡ã„¥U ß‚∑§Ë •Êfl‡ÿ∑§ÃÊ „ÒU ©UŸ∑§
Á‹∞ ÿ„U ¡ÊŸŸÊ ÷Ë ¡M§⁄UË „ÒU Á∑§ ∑§á«UÙ◊
∑§„UÊ¢ ‚ ©U¬‹éœ „Ò¥U ÿÊ π⁄UËŒ ¡Ê ‚∑§Ã „Ò¥U–
‚Ÿ˜ wÆÆv ‚ wÆÆ{ Ã∑§ ∞‚ ‹ÊªÊ¥ ∑§Ê
¬˝ÁÇÊà ’…∏UÊ „ÒU ¡Ê ÿ„U ∑§„UÃ „Ò¥U Á∑§ ©UŸ∑§
ˇÊòÊ ◊¥ ∑§á«UÙ◊ ‚⁄U‹ÃÊ ‚ ©U¬‹éœ ÕÊ– ÿ„U
÷Ë äÿÊŸ ◊¥ ⁄UπÊ ¡ÊŸÊ øÊÁ„U∞ Á∑§ ª˝Ê»§ ◊¥
ÁŒ∞ ª∞ •Ê¢∑§«∏U ©UŸ Ã∑§ ‚ËÁ◊à „Ò¥U ¡Ê
∑§á«UÙ◊ ∑§ ¬˝Áà ¡ÊªM§∑§ Õ– ’Ë ∞‚ ∞‚
‚fl¸ˇÊáÊ ∑§ ¬Á⁄UáÊÊ◊ ÿ„U ’ÃÊÃ „Ò¥U Á∑§
∑§á«UÙ◊ ∑§ ’Ê⁄U ◊¥ ¡ÊŸ∑§Ê⁄UË ÿÈQ§ ∑§Êÿ¸∑˝§◊Ê¥
∑§Ê ¬˝÷Êfl ’„ÈUà •ë¿UÊ ¬«∏UÊ „UÒ–
19

3.2 Page 22

▲back to top


SEXUAL BEHAVIOUR
ÿÊÒŸ √ÿfl„UÊ⁄U
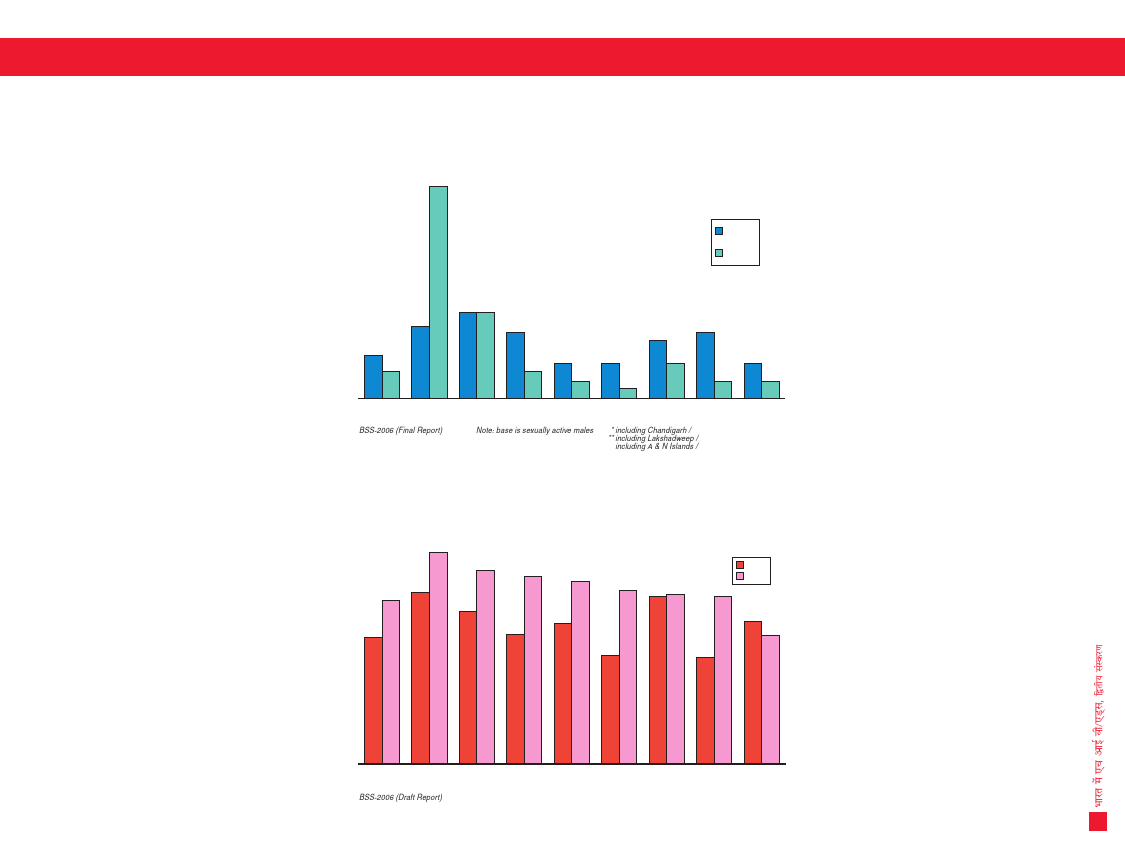
In India, risky sexual behaviour is
the primary cause of the spread of
HIV infection. In many states,
respondents in the BSS reported
rather high levels of sex with
non-regular partners. The risk of HIV
infection is not confined to those
who engage in such behaviour but
also endangers a regular partner,
such as a spouse or an unborn
child or a young child being
breastfed. Males reported sex with
non-regular partners much more
frequently than females, but the
BSS notes that female respondents
may have under-reported their
sexual activity. In states with high
proportions of males reporting sex
with non-regular partners, such as
Andhra Pradesh and Tamil Nadu,
similarly high percentages reported
sex with commercial sex workers.
There has, however, been a sharp
increase in those reporting consistent
condom use with non-regular
partners, giving evidence that
condom promotional programmes
can and do meet with success. The
BSS indicates that overall condom
awareness has risen, the proportion
of those using them in risky sex has
increased and that sex workers
are more likely to insist upon their
use. But, despite the rise, India
remains far from the goal of
universal, consistent condom use
during risky sex.
20
Percent of Respondents, Ages 15-49, Saying That They Had Sex with a
Non-regular Partner in the Past Year, by Sex, Selected States and India, 2006
÷Ê⁄Uà •ı⁄U øÈÁŸ¢ŒÊ ⁄UÊÖÿÙ¥ ◊¥ vz-y~ fl·¸ •ÊÿÈ flª¸ ∑§ ¬˝àÿÊÕ˸ÿÙ¥ ∑§Ê ¬˝ÁÇÊà ¡Ù ∑§„UÃ „Ò¥U
Á∑§ ªÃ fl·¸ ©Uã„UÙ¥Ÿ •ÁŸÿÁ◊à ÿıŸ-‚ÊÕË ∑§ ‚ÊÕ ÿıŸ ‚¢’¢œ ’ŸÊÿÊ, Á‹¢ªflÊ⁄U, wÆÆ{
21
15
15
9
9
6
4
3
INDIA Andhra Pradesh Tamil Nadu
÷Ê⁄Uà •Êãœ˝ ¬˝Œ‡Ê ÃÁ◊‹ ŸÊ«È
BSS-2006 (Final Report)
’Ë∞‚∞‚-wÆÆ{ (»§Êߟ‹ Á⁄U¬Ù≈¸U)
Punjab*
¬¢¡Ê’*
15
11
Male
¬ÈL ·
Female
◊Á„U‹Ê
8
3
Delhi
ÁŒÀ‹Ë
5
4
4
3
0.3
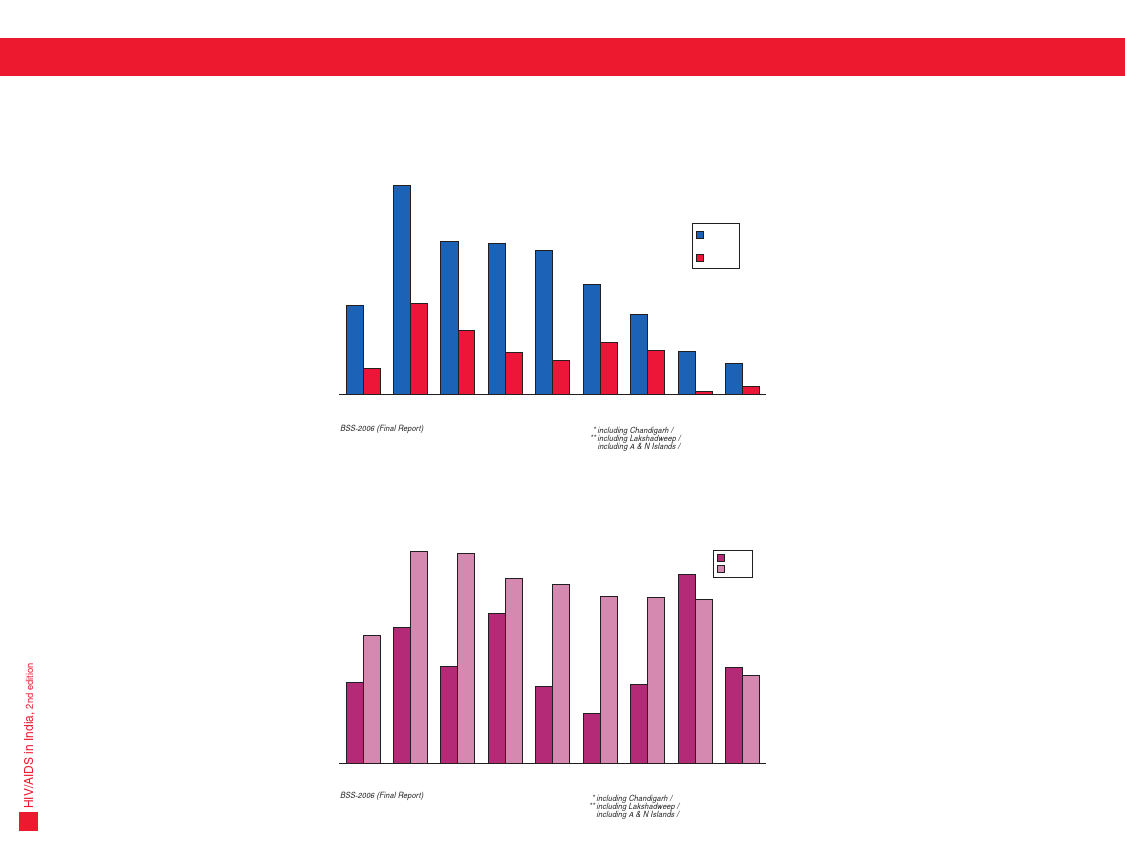
1
Maharashtra Kerala** West BengalKarnataka
◊„UÊ⁄UÊc≈˛U ∑§⁄U‹** ¬Á‡ø◊Ë ’¢ªÊ‹∑§ŸÊ¸≈U∑§
* including Chandigarh / øá«U˪…∏U ‚Á„UÃ
** including Lakshadweep / ‹ˇÿmˬ ‚Á„UÃ
including A & N Islands / ∞ ∞á«U ∞Ÿ mˬ ‚◊Í„U ‚Á„UÃ
Percent of Respondents, Ages 15-49, Reporting Consistent Condom Use with
Non-regular Partners in the Past Year, Selected States and India, 2001 and 2006
÷Ê⁄Uà •ı⁄U øÈÁŸ¢ŒÊ ⁄UÊÖÿÙ¥ ◊¥ vz-y~ fl·¸ •ÊÿÈ flª¸ ∑§ ¬˝àÿÊÕ˸ÿÙ¥ ∑§Ê ¬˝ÁÇÊà ¡Ù ∑§„UÃ „Ò¥U Á∑§ ªÃ
fl·¸ ©Uã„UÙ¥Ÿ •ÁŸÿÁ◊à ÿıŸ-‚ÊÕË ∑§ ‚ÊÕ ∑§á«UÙ◊ ∑§Ê ÁŸ⁄¢UÃ⁄U ßSÃ◊Ê‹ Á∑§ÿÊ, wÆÆv •ı⁄U wÆÆ{
69
69
60
58
2001
62
2006
55
54
54
49
44
42
32
31
29
27
25
26
16
INDIA
Punjab*
Delhi
÷Ê⁄Uà ¬¢¡Ê’* ÁŒÀ‹Ë
BSS-2006 (Final Report)
’Ë∞‚∞‚-wÆÆ{ (»§Êߟ‹ Á⁄U¬Ù≈¸U)
Kerala** Andhra Pradesh Karnataka West BengalMaharashtra Tamil Nadu
∑§⁄U‹** •Êãœ˝ ¬˝Œ‡Ê ∑§ŸÊ¸≈U∑§ ¬Á‡ø◊Ë ’¢ªÊ‹◊„UÊ⁄UÊc≈˛U ÃÁ◊‹ ŸÊ«È
* including Chandigarh / øá«U˪…∏U ‚Á„UÃ
** including Lakshadweep / ‹ˇÿmˬ ‚Á„UÃ
including A & N Islands / ∞ ∞á«U ∞Ÿ mˬ ‚◊Í„U ‚Á„UÃ
÷Ê⁄Uà ◊¥ ¡ÊÁπ◊¬Íáʸ ÿÊÒŸ √ÿfl„UÊ⁄U ∞ø •Ê߸ flË
‚¢∑˝§◊áÊ ∑§ »Ò§‹Ÿ ∑§Ê ◊ÈÅÿ ∑§Ê⁄UáÊ „ÒU– ’„ÈUÃ
‚ ⁄UÊÖÿÊ¥ ◊¥ ’Ë ∞‚ ∞‚ ∑§ •ŸÈ‚Ê⁄U •Áœ∑§Ã⁄U
ÿıŸ ‚¢’¢œ •ÁŸÿÁ◊à ‚ÊÕË ∑§ ‚ÊÕ „UÊÃÊ „ÒU–
∞ø •Ê߸ flË ∑§Ê ¡ÊÁπ◊ ∑§fl‹ ©UŸ Ã∑§
‚ËÁ◊à Ÿ„UË¥ „ÒU ¡Ê ß‚ √ÿfl„UÊ⁄U ◊¥ Á‹# „ÒU
•Á¬ÃÈ ÁŸÿÁ◊à ‚ÊÕË ÷Ë ¡ÊÁπ◊ ◊¥ „UÊÃÊ „ÒU
ÿÊ •¡ã◊Ê Á‡Ê‡ÊÈ ÿÊ ∞∑§ ¿UÊ≈UÊ Á‡Ê‡ÊÈ ¡Ê
S߬ʟ ∑§⁄UÃÊ „ÒU– •ÁŸÿÁ◊à ‚ÊÕË ∑§ ‚ÊÕ
ÿÊÒŸ ‚¢’¢œ ◊Á„U‹Ê•Ê¥ ∑§Ë •¬ˇÊÊ ¬ÈL ·Ê¥ mÊ⁄UÊ
’Ê⁄U-’Ê⁄U ŒÊ„U⁄UÊ∞ ¡ÊŸ ∑§Ë Á⁄U¬Ê≈¸U „ÒU– ¬⁄UãÃÈ
’Ë ∞‚ ∞‚ ‚fl¸ˇÊáÊ ŸÊ≈U ∑§⁄UÃÊ „ÒU Á∑§
‚¢÷flÃÿÊ ◊Á„U‹Ê•Ê¥ Ÿ ÿÊÒŸ ªÁÃÁflÁœÿÊ¥ ∑§Ê
∑§◊ Œ¡¸ ∑§⁄UflÊÿÊ „ÒU– ∑§ŸÊ¸≈U∑§ •ÊÒ⁄U ÃÁ◊‹ŸÊ«ÍU
¡Ò‚ ⁄UÊÖÿÊ¥ ◊¥ ¬ÈL§·Ù¥ ∑§ •ÁŸÿÁ◊à ‚ÊÕË ∑§
‚ÊÕ ÿÊÒŸ ‚¢’¢œ ∑§Ê ©Uëø •ŸÈ¬Êà „ÒU, ß‚Ë
¬˝∑§Ê⁄U √ÿfl‚ÊÁÿ∑§ ÿÊÒŸ ∑§Êÿ¸∑§àÊʸ ∑§ ‚ÊÕ ÿÊÒŸ
‚¢’¢œ ∑§Ê ¬˝ÁÇÊà ÷Ë •Áœ∑§ „ÒU–
•ÁŸÿÁ◊à ‚ÊÕË ∑§ ‚ÊÕ ÿÊÒŸ ‚¢’¢œ ∑§ ŒÊÒ⁄UÊŸ
∑§á«UÙ◊ ∑§Ê ßSÃ◊Ê‹ ∑§⁄UŸ flÊ‹Ê¥ ∑§Ë ‚¢ÅÿÊ ◊¥
’„ÈUà ’…∏UÊÃ⁄UË „ÈU߸ „ÒU ¡Ê ß‚ ’Êà ∑§Ë ªflÊ„UË
ŒÃ „Ò¥U Á∑§ ∑§á«UÙ◊ ∑§Ê ¬˝Ê◊Ê‡ÊŸ‹ ∑§Êÿ¸∑˝§◊
‚»§‹ÃÊ ¬˝Ê# ∑§⁄UflÊ ‚∑§Ã „ÒU¢– ’Ë ∞‚ ∞‚
ß‚ •Ê⁄U ‚¢∑§Ã ∑§⁄UÃ „ÒU¢ Á∑§ ∑§á«UÙ◊ ∑§Ë
¡ÊªM§∑§ÃÊ ’…∏UË „ÒU, ¡ÊÁπ◊¬Íáʸ ÿÊÒŸ ‚¢’¢œ ∑§
ŒÊÒ⁄UÊŸ ß‚ ßSÃ◊Ê‹ ∑§⁄UŸ flÊ‹Ê¥ ∑§Ê •ŸÈ¬ÊÃ
’…∏UÊ „ÒU •ÊÒ⁄U ÿÊÒŸ ∑§Êÿ¸∑§Ãʸ ÷Ë ß‚∑§ ßSÃ◊Ê‹
¬⁄U ¡Ê⁄U ŒÃ „Ò¥U– ¬⁄UãÃÈ ß‚ ’…∏UÊÃ⁄UË ∑§ ’Êfl¡ÍŒ
÷Ê⁄Uà ¡ÊÁπ◊¬Íáʸ ÿÊÒŸ ‚¢’¢œ ∑§ ŒÊÒ⁄UÊŸ ÁŸ⁄¢UÃ⁄U
∑§á«UÙ◊ ∑§ ßSÃ◊Ê‹ ∑§ Áfl‡flSÃ⁄UËÿ ‹ˇÿ ‚
•÷Ë ÷Ë ŒÍ⁄U „ÒU–

3.3 Page 23

▲back to top


SEXUAL BEHAVIOUR
ÿÊÒŸ √ÿfl„UÊ⁄U
Percent of Respondents, Ages 15-49, Saying That They Had Sex with
a Non-regular Partner in the Past Year, by Occupation, India, 2006
÷Ê⁄Uà ◊¥ vz-y~ fl·¸ •ÊÿÈ flª¸ ∑§ ¬˝àÿÊÕ˸ÿÙ¥ ∑§Ê ¬˝ÁÇÊÃ, Á¡ã„UÙ¥Ÿ ∑§„UÊ Á∑§ Á¬¿U‹ fl·¸ ©Uã„UÙ¥Ÿ
•ÁŸÿÁ◊à ÿıŸ ∑§◊˸ ∑§ ‚ÊÕ ÿıŸ ‚¢¬∑¸§ Á∑§ÿÊ, √ÿfl‚Êÿ •ŸÈ‚Ê⁄U, wÆÆ{
Spending time away from one’s
home increases the likelihood of
having sex with a non-regular
partner, often with a commercial
sex worker. Those in transport
occupations reported the largest
frequency of non-regular sex and
it is probable that the migratory
population’s experience is similar.
Condom use with a non-regular
partner appears to be greatly
influenced by exposure to
media messages, giving evidence
of the value of such outreach
campaigns. Media exposure of
cultivators in rural areas is likely
to be somewhat less frequent and
BSS responses do reflect lower
condom use among that group.
Transport worker/driver
18
≈˛UÊガÙ≈¸U ◊¥ ∑§Ê◊ ∑§⁄UŸ flÊ‹/øÊ‹∑§
Service (Gov’t/private)
⁄UÙ¡ªÊ⁄U (‚⁄U∑§Ê⁄UË/ÁŸ¡Ë)
8
Self-employed
Sfl⁄UÙ¡ªÊ⁄U
7
Skilled/unskilled labour
∑ȧ‡Ê‹/•∑ȧ‡Ê‹ ◊¡ŒÍ⁄U
6
Cultivator
Á∑§‚ÊŸ
5
Housewife
ª˝„UáÊË
2
Other
•ãÿ
7
BSS-2006 (Final Report)
’Ë∞‚∞‚-wÆÆ{ (»§Êߟ‹ Á⁄U¬Ù≈¸U)
Percent of Respondents, Ages 15-49, Reporting Condom Use During Last Sexual Intercourse
with a Non-regular Partner by Occupation and Media Exposure, India, 2006
÷Ê⁄Uà ◊¥ vz-y~ fl·¸ •ÊÿÈ flª¸ ∑§ ¬˝àÿÊÕ˸ÿÙ¥ ∑§Ê ¬˝ÁÇÊÃ, Á¡ã„UÙ¥Ÿ ∑§„UÊ Á∑§ Á¬¿U‹ fl·¸ ©Uã„UÙ¥Ÿ •ÁŸÿÁ◊Ã
ÿıŸ ∑§◊˸ ∑§ ‚ÊÕ ∑§á«UÙ◊ ∑§Ê ¬˝ÿÙª Á∑§ÿÊ, √ÿfl‚Êÿ •ŸÈ‚Ê⁄ •ÊÒ⁄ ◊ËÁ«UÿÊ ©U¡Êª⁄UÃÊU, wÆÆ{
Transport worker/driver
≈˛UÊガÙ≈¸U ◊¥ ∑§Ê◊ ∑§⁄UŸ flÊ‹/øÊ‹∑§
Service (Gov’t/private)
⁄UÙ¡ªÊ⁄U (‚⁄U∑§Ê⁄UË/ÁŸ¡Ë)
Self-employed
Sfl⁄UÙ¡ªÊ⁄U
Skilled/unskilled labour
∑ȧ‡Ê‹/•∑ȧ‡Ê‹ ◊¡ŒÍ⁄U
Cultivator
Á∑§‚ÊŸ
Housewife
ª˝„UáÊË
Other
•ãÿ
56
46
57
82
77
70
74
Á∑§‚Ë ÷Ë √ÿÁÄà ∑§Ê ÿÊŒÊ ‚◊ÿ ÉÊ⁄U ‚
ŒÍ⁄U Á’ÃÊŸÊ •ÁŸÿÁ◊à ‚ÊÕË ∑§ ‚ÊÕ, ÿÊ
•Ä‚⁄U ÿıŸ ∑§◊˸ ∑§ ‚ÊÕ ÿıŸ ‚¢¬∑¸§
∑§⁄UŸ ∑§Ë ‚ê÷ÊflŸÊ ∑§Ù ’…∏UÊ ŒÃÊ „ÒU– ¡Ù
‹Ùª ≈˛UÊガÙ≈¸U √ÿfl‚Êÿ ◊¥ „Ò¥U, ©UŸ◊¥
•ÁŸÿÁ◊à ÿıŸ ‚¢¬∑¸§ ∑§ ◊Ê◊‹ ‚’‚
ÿÊŒÊ ¬Ê∞ ¡ÊÃ „Ò¥U •ı⁄U ÿ„U ÷Ë ‚¢÷fl „ÒU
Á∑§ ÿ ‹Ùª „UË ß‚ ⁄UÙª ∑§Ù ∞∑§ SÕÊŸ ‚
ŒÍ‚⁄U SÕÊŸ ¬⁄U ‹ ¡ÊÃ „Ò¥U– •ÁŸÿÁ◊Ã
ÿıŸ ‚ÊÕË ∑§ ‚ÊÕ ∑§á«UÙ◊ ∑§Ê ¬˝ÿÙª
◊ËÁ«UÿÊ ∑§ ‚¢Œ‡ÊÙ¥ ‚ ¬˝÷ÊÁflà ‹ªÃ „Ò¥U,
¡Ù ß‚ Ã⁄U„U ∑§ •Á÷ÿÊŸÙ¥ ∑§Ë ŒÍ⁄U Ã∑§
¬„È¢Uø ∑§Ù ‚„UË ∆U„U⁄UÊÃ „Ò¥U– ª˝Ê◊ËáÊ ˇÊòÊÙ¥ ◊¥
Á∑§‚ÊŸÙ¥ Ã∑§ ◊ËÁ«UÿÊ ∑§Ë ¬„È¢Uø ∑ȧ¿U ∑§◊
„ÒU •ı⁄U ’Ë ∞‚ ∞‚ ∑§ •ŸÈ‚Ê⁄U ß‚ ‚◊Í„U
◊¥ ∑§á«UÙ◊ ∑§ ÁŸ◊A ¬˝ÿÙª ∑§ ¬˝Áà ∑§Ê◊
∑§⁄U ⁄U„UË „ÒU–
Exposed to Media
◊ËÁ«UÿÊ ‚ ©U¡Êª⁄U
68
Not Exposed
©U¡Êª⁄U Ÿ„UË¥
24
BSS-2006 (Final Report)
’Ë∞‚∞‚-wÆÆ{ (»§Êߟ‹ Á⁄U¬Ù≈¸U)
21

3.4 Page 24

▲back to top


THE ROLE OF SEXUALLY-TRANSMITTED DISEASE
ÿıŸ ‚¢øÊÁ⁄Uà ⁄U٪٥ ∑§Ë ÷ÍÁ◊∑§Ê
The presence of a sexually-transmitted
disease (STD) increases the
possibility that HIV will be contracted
during sexual activity. As a result,
knowledge of STDs and the link
between them and HIV is essential.
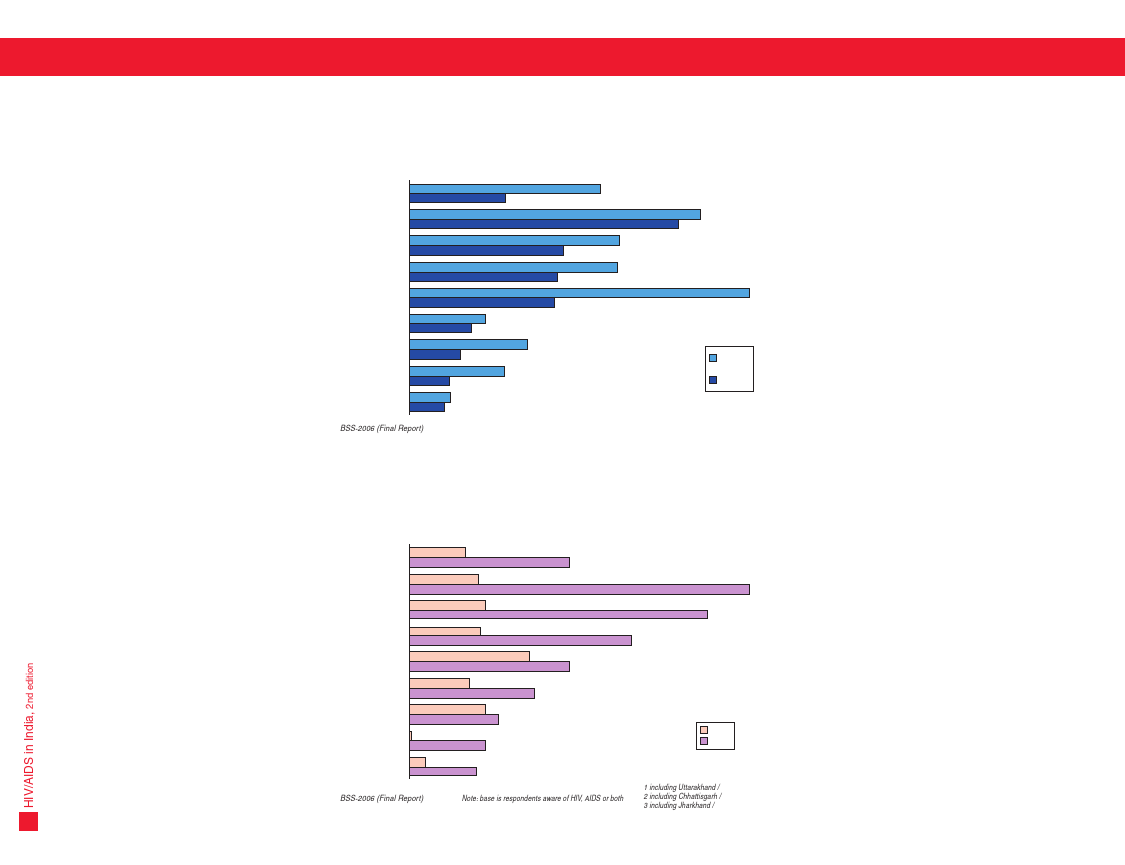
Overall, knowledge of the existence
of STDs remains low in India and is
below 50 percent in nearly every
state. Nationally, the percent of
respondents who said that they
had ever heard of a STD stood
at 38 percent in 2006, a modest
rise from 31 percent in 2001.
Ignorance of the very existence
of STDs places one at a greatly
elevated risk level of HIV infection
in the event of risky sexual
behaviour. Additionally, awareness
of the link between STDs and HIV
remains dangerously low.
Are people of India able to recognise
the symptoms of STDs in themselves
or a partner? Here again, awareness
levels are quite low in the country
although Gujarat stands out with
the largest proportion saying that
they are aware of symptoms.
It is likely that it is more difficult
to educate people concerning STD
symptoms given the sensitive
nature of the many issues
surrounding HIV in general, yet
sustained efforts to do so in
the proper setting must be made
so that they are not unwittingly
vulnerable.
22
Percent of Respondents, Ages 15-49, Saying That They Have Heard of STDs and
Those Aware of STD-HIV Linkage, Selected States and India, 2006
÷Ê⁄Uà •ı⁄U øÈÁŸ¢ŒÊ ⁄UÊÖÿÙ¥ ◊¥ vz-y~ fl·¸ •ÊÿÈ flª¸ ∑§ ∞‚ ¬˝àÿÊÕ˸ÿÙ¥ ∑§Ê ¬˝ÁÇÊà Á¡ã„UÙ¥Ÿ ∞‚ ≈UË «UË
∑§ ’Ê⁄U ◊¥ ‚ÈŸÊ „ÒU •ı⁄U ∞‚ ≈UË «UË-∞ø •Ê߸U flË ∑§ ’Ëø ‚ê’㜠∑§ ’Ê⁄U ◊¥ ¡ÊªM§∑§ „Ò¥U, wÆÆ{
65
Heard of STDs
∞‚ ≈UË «UË ∑§ Áfl·ÿ ◊¥ ‚ÈŸÊ „ÒU
50
Aware of STD-HIV Linkage
∞‚ ≈UË «UË •ı⁄U ∞ø •Ê߸ UflË ∑§
41
41
‚¢’¢œ ∑§Ë ¡ÊªM§∑§ÃÊ
38
37
36
36
26
24
23
20
16
18
15
15
10
12
INDIA
Gujarat* Kerala** Andhra Pradesh Orissa
÷Ê⁄Uà ªÈ¡⁄UÊÃ* ∑§⁄U‹** •Ê¢œ˝ ¬˝Œ‡Ê ©U«∏UË‚Ê
BSS-2006 (Final Report)
’Ë∞‚∞‚-wÆÆ{ (»§Êߟ‹ Á⁄U¬Ù≈¸U)
Note: base is all respondents
ŸÙ≈U— ‚÷Ë ¬˝ÁÃflÊŒË •ÊœÊ⁄U „Ò¥U
Manipur Tamil Nadu Bihar Madhya Pradesh
◊ÁáʬÈ⁄U ÃÁ◊‹ ŸÊ«ÈU Á’„UÊ⁄U ◊äÿ ¬˝Œ‡Ê
* including D & N Haveli / «UË ∞á«U ∞Ÿ „Ufl‹Ë ‚Á„UÃ
** including Lakshadweep / ‹ˇÿmˬ ‚Á„UÃ
Percent of Respondents, Ages 15-49, Saying That They Are Aware of STD
Symptoms among Men and Women, Selected States and India, 2006
÷Ê⁄Uà •ı⁄U øÈÁŸ¢ŒÊ ⁄UÊÖÿÙ¥ ◊¥ vz-y~ fl·¸ •ÊÿÈ flª¸ ∑§ ¬˝àÿÊÕ˸ÿÙ¥ ∑§Ê ¬˝ÁÇÊà ¡Ù ∑§„UÃ „Ò¥U Á∑§
©UŸ◊¥ ¬ÈM§·Ù¥ •ı⁄U ◊Á„U‹Ê•Ù¥ ◊¥ ∞‚ ≈UË «UË ∑§ ‹ˇÊáÊÙ¥ ∑§Ë ¡ÊªM§∑§ÃÊ „ÒU, wÆÆ{
56
47
28
23
25
20
39
33
31
25
24
16
15
13
Among Males
¬ÈL ·Ù¥ ◊¥
Among Females
◊Á„U‹Ê•Ù¥ ◊¥
12
9
12
10
INDIA
Gujarat* Kerala**
÷Ê⁄Uà ªÈ¡⁄UÊÃ* ∑§⁄U‹**
BSS-2006 (Final Report)
’Ë∞‚∞‚-wÆÆ{ (»§Êߟ‹ Á⁄U¬Ù≈¸U)
Andhra Pradesh
•Ê¢œ˝ ¬˝Œ‡Ê
Orissa
©U«∏UË‚Ê
Manipur Tamil Nadu Bihar Madhya Pradesh
◊ÁáʬÈ⁄U ÃÁ◊‹ ŸÊ«ÈU Á’„UÊ⁄U ◊äÿ ¬˝Œ‡Ê
* including D & N Haveli / «UË ∞á«U ∞Ÿ „Ufl‹Ë ‚Á„UÃ
** including Lakshadweep / ‹ˇÿmˬ ‚Á„UÃ
ÿÊÒŸ ‚¢øÊÁ⁄Uà ⁄UÊª (∞‚ ≈UË «UË) ∑§Ë ©U¬ÁSÕÁÃ
ß‚ ’Êà ∑§Ë ‚¢÷ÊflŸÊ ’…∏UÊ ŒÃË „ÒU Á∑§ ÿÊÒŸ
‚¢’¢œ ªÁÃÁflÁœ ∑§ ŒÊÒ⁄UÊŸ ∞ø •Ê߸ flË
‚¢øÊÁ⁄Uà „UÊªÊ– ¬Á⁄UáÊÊ◊SflM§¬ ∞‚ ≈UË «UË ∑§Ë
¡ÊŸ∑§Ê⁄UË •ÊÒ⁄U ߟ∑§Ê ∞ø •Ê߸ flË ‚ ‚¢’¢œ
„UÊŸ ∑§Ë ¡ÊŸ∑§Ê⁄UË „UÊŸÊ •Êfl‡ÿ∑§ „UÒ–
∞‚ ≈UË «UË ∑§ •ÁSÃàfl ∑§ ’Ê⁄U ◊¥ ¡ÊŸ∑§Ê⁄UË
„U◊‡ÊÊ ∑§◊ ⁄U„UÃË „ÒU •ÊÒ⁄U ‹ª÷ª „U⁄U ⁄UÊÖÿ ◊¥
ÿ„U ¡ÊŸ∑§Ê⁄UË zÆ ¬˝ÁÇÊà ‚ ∑§◊ „ÒU–
‚Ÿ˜ wÆÆ{ ◊¥ ⁄UÊCÔ˛UËÿ SÃ⁄U ¬⁄U ∞‚Ê ∑§„UŸ
flÊ‹Ê¥ ∑§Ê ¬˝ÁÇÊà x} ÕÊ Á∑§ ©Uã„UÊ¥Ÿ ∑§÷Ë
∞‚ ≈UË «UË ∑§ ’Ê⁄U ◊¥ ‚ÈŸÊ ÕÊ, ‚Ÿ˜ wÆÆv ◊¥
ÿ„U xv ¬˝ÁÇÊà ÕÊ– •ÁäÊ∑§ ¡ÊÁπ◊ flÊ‹
ˇÊòÊÊ¥ ◊¥ ∞‚ ≈UË «UË ∑§ãº˝Ê¥ ∑§Ë ◊ÊÒ¡ÍŒªË ∑§Ê
Ÿ$¡⁄U•¢ŒÊ$¡ Á∑§∞ ¡ÊŸ ‚ ¡ÊÁπ◊ ÷⁄U ÿÊÒŸ
√ÿfl„UÊ⁄U ‚ ∞ø •Ê߸ flË ∑§Ê ¡ÊÁπ◊ ÷Ë
’…∏U ªÿÊ „ÒU– ß‚∑§ ‚ÊÕ-‚ÊÕ ∞‚ ≈UË «UË
•ÊÒ⁄U ∞ø •Ê߸ flË ∑§ ’Ëø ‚¢’¢œ ∑§ ’Ê⁄U ◊¥
¡ÊªM§∑§ÃÊ ÷Ë πÃ⁄ŸÊ∑§ Ã⁄UË∑§ ‚ ∑§◊ „ÒU–
ÄÿÊ ÷Ê⁄UÃËÿ Sflÿ¢ ◊¥ ÿÊ •¬Ÿ ∞∑§ ‚ÊÕË ◊¥
∞‚ ≈UË «UË ∑§ ‹ˇÊáÊ ¬„UøÊŸ ¬ÊŸ ◊¥ ‚ˇÊ◊
„Ò¥U? ÿ„UÊ¢ ¬⁄U Á»§⁄U ‚ Œ‡Ê ◊¥ ß‚ ∑§Ë
¡ÊªM§∑§ÃÊU ÁŸêŸ SÃ⁄ ∑§Ë „ÒU ¡’Á∑§ ªÈ¡⁄UÊÃ
Á»§⁄U ‚ •‹ª π«∏UÊ „ÒU ÄÿÙ¥Á∑§ ÿ„UÊ¢ ∑§Ê ∞∑§
’„ÈUà ’«∏UÊ •ŸÈ¬Êà ÿ„U ∑§„UÃÊ „ÒU Á∑§ ©Uã„¥U
‹ˇÊáÊÙ¥ ∑§Ë ¡ÊŸ∑§Ê⁄UË „ÒU– ∞‚Ê ‹ªÃÊ „ÒU Á∑§
‹ÙªÙ¥ ∑§Ù ∞‚ ≈UË «UË ∑§ ‹ˇÊáÊÙ¥ ∑§ ¬˝ÁÃ
Á‡ÊÁˇÊà ’ŸÊŸÊ ◊ÈÁ‡∑§‹ „ÒU, ß‚∑§ ‚ÊÕ ∞ø
•Ê߸U flË ‚ ¡È«∏U ’„ÈUà ‚ ¬„U‹È•Ù¥ ∑§Ë
‚¢flŒŸ‡ÊË‹ ¬˝flÎÁà ÷Ë ¡È«∏UË „ÒU, Ã’ ÷Ë ∞‚Ê
∑§⁄UŸ ∑§ SÕÊ߸U ¬˝ÿÊ‚ ‚„UË Ã⁄UË∑§ ‚ Á∑§∞
¡ÊŸ øÊÁ„U∞, ÃÊÁ∑§ fl •¿ÍUÃ Ÿ ⁄U„U ¡Ê∞¢–

3.5 Page 25

▲back to top


THE ROLE OF SEXUALLY-TRANSMITTED DISEASE
ÿıŸ ‚¢øÊÁ⁄Uà ⁄U٪٥ ∑§Ë ÷ÍÁ◊∑§Ê
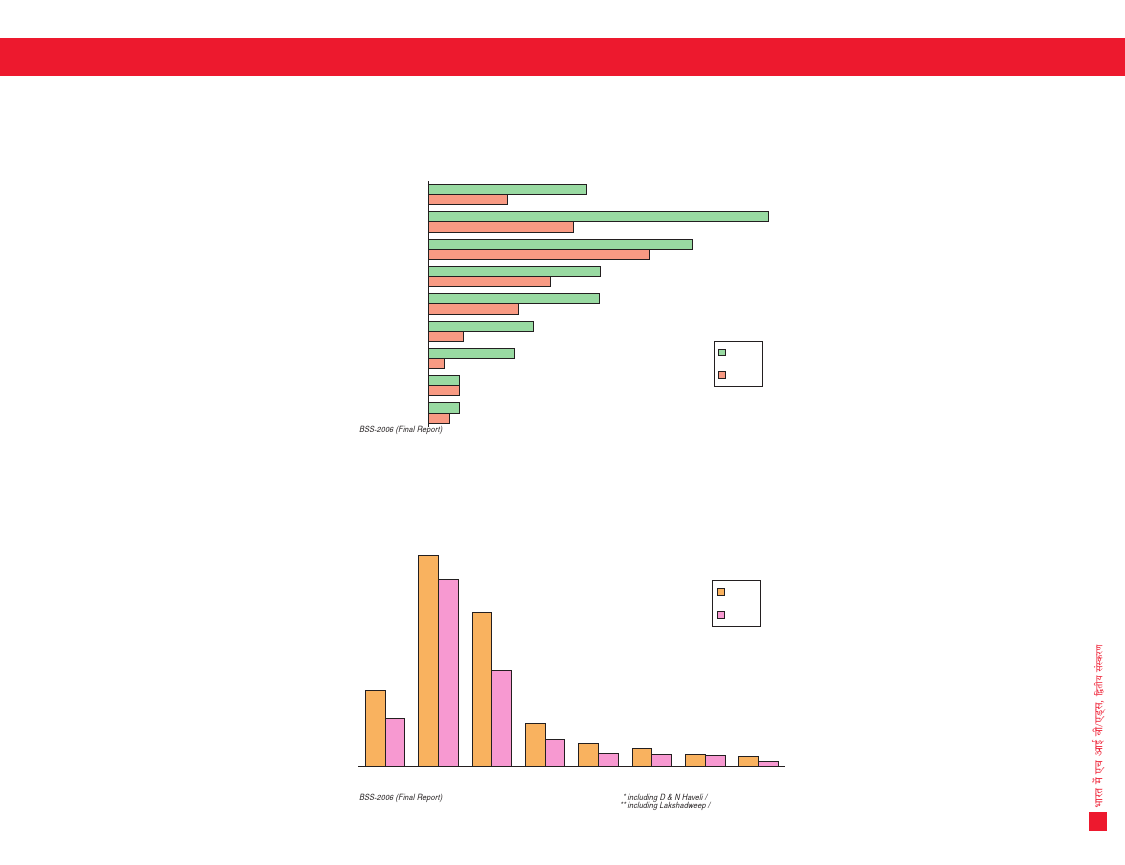
The percentage of respondents who
reported a symptom of a STD is
rather high and varies considerably
by state. In the majority of states,
women report STD symptoms more
often than do men. As in any such
survey, there is the possibility of
under-reporting or misreporting
symptoms, but the results provide
some idea of those particularly
vulnerable to HIV infection and
who could, in turn, pass the
infection to others. Throughout
India, the BSS also showed that
the proportions of rural respondents
reporting STD symptoms was
higher than in urban.
Treatment-seeking behaviour for
STD symptoms is quite low in India
with only a little more than half
saying they had sought medical
attention. In several southern states,
the percentage of those seeking
treatment was quite high, but, in the
majority of states, large proportions
of people did not seek treatment.
Further, the two BSS surveys
suggest that there was no
improvement on this important
measure from 2001 to 2006.
Percent of Respondents, Ages 15-49, Reporting a STD Symptom in the Past Year,
by Sex, Selected States and India, 2006
÷Ê⁄Uà •ı⁄U øÈÁŸ¢ŒÊ ⁄UÊÖÿÙ¥ ◊¥ vz-y~ fl·¸ •ÊÿÈ flª¸ ∑§ ¬˝àÿÊÕ˸ÿÙ¥ ∑§Ê ¬˝ÁÇÊà ¡„UÊ¢ ªÃ fl·¸
∞‚ ≈UË «UË ∑§Ê ∞∑§ ∑§‚ Œ¡¸ „UÈ•Ê, Á‹¢ªflÊ⁄U, wÆÆ{
16
7
5
3
9
2
7
4
7
5
7
6
4
2
Male
¬ÈL ·
Female
◊Á„U‹Ê
33
3
2
INDIA
Orissa
Gujarat*
÷Ê⁄Uà ©U«∏UË‚Ê ªÈ¡⁄UÊÃ*
BSS-2006 (Final Report)
’Ë∞‚∞‚-wÆÆ{ (»§Êߟ‹ Á⁄U¬Ù≈¸U)
Madhya Pradesh Andhra Pradesh
◊äÿ ¬˝Œ‡Ê •Ê¢œ˝ ¬˝Œ‡Ê
Kerala**
Bihar
Manipur Tamil Nadu
∑§⁄U‹** Á’„UÊ⁄U ◊ÁáʬÈ⁄U ÃÁ◊‹ ŸÊ«ÈU
* including D & N Haveli / «UË ∞á«U ∞Ÿ „Ufl‹Ë ‚Á„UÃ
** including Lakshadweep / ‹ˇÿmˬ ‚Á„UÃ
Percent of Respondents, Ages 15-49, Who Sought Treatment for a STD Symptom
in the Past Year, by Sex, Selected States and India, 2006
÷Ê⁄Uà •ı⁄U øÈÁŸ¢ŒÊ ⁄UÊÖÿÙ¥ ◊¥ vz-y~ fl·¸ •ÊÿÈ flª¸ ∑§ ¬˝àÿÊÕ˸ÿÙ¥ ∑§Ê ¬˝ÁÇÊà Á¡ã„UÙ¥Ÿ ªÃ fl·¸
∞‚ ≈UË «UË ‹ˇÊáÊ ∑§ Á‹∞ ©U¬øÊ⁄U ∑§⁄UflÊÿÊ, Á‹¢ªflÊ⁄U, wÆÆ{
85
81
Male
75
¬ÈL ·
58
55
56 54
50
Female
◊Á„U‹Ê
62
57
45
45
42
42
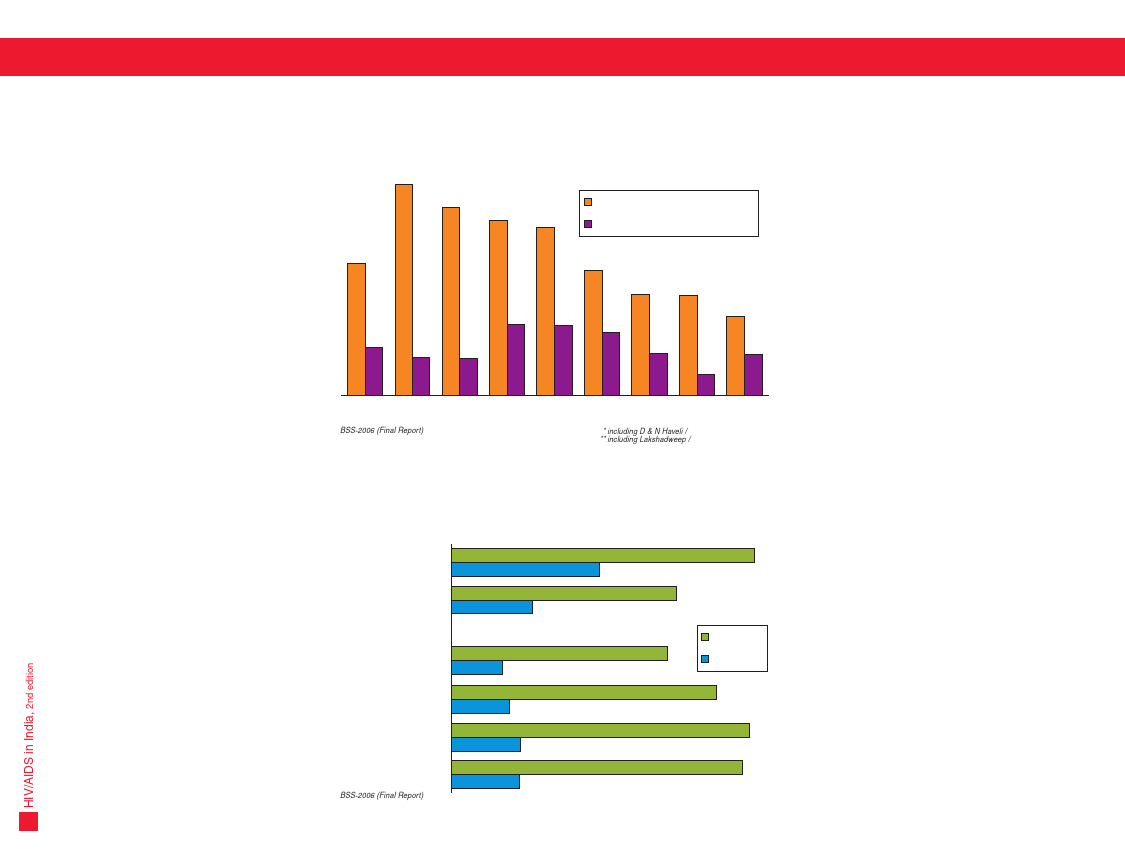
40
32 33
19
∞‚ ≈UË «UË ∑§ ‹ˇÊáÊ ∑§Ê Œ¡¸ ∑§⁄UflÊŸ flÊ‹
÷Ê⁄UÃËÿÊ¥ ∑§Ê ¬˝ÁÇÊà ∑§Ê»§Ë ™¢§øÊ „ÒU •ÊÒ⁄U
∞∑§ ⁄UÊÖÿ ‚ ŒÍ‚⁄U ⁄UÊÖÿ ◊¥ Á÷ÛÊ „ÒU– ’„ÈUÃ
‚ ⁄UÊÖÿÊ¥ ◊¥ ∞‚ ≈UË «UË ‹ˇÊáÊÊ¥ ∑§Ë Á⁄U¬Ê≈¸U
◊Á„U‹Ê∞¢ ¬ÈL ·Ê¥ ‚ •Ä‚⁄U ÖÿÊŒÊ ∑§⁄UÃË „Ò¥–
¡Ò‚Ê Á∑§ Á∑§‚Ë ÷Ë ∞‚ ‚fl¸ˇÊáÊ ◊¥ „UÊÃÊ „ÒU
‹ˇÊáÊÊ¥ ∑§Ë ∑§◊ - Á⁄U¬ÊÁ≈ZUª ÿÊ Á◊‚ -
Á⁄U¬ÊÁ≈¸U¢ª ∑§Ë ‚¢÷ÊflŸÊ ⁄U„UÃË „ÒU, ¬⁄UãÃÈ
¬Á⁄UáÊÊ◊ ©UŸ∑§ ’Ê⁄U ◊¥ ‚ȤÊÊfl ŒÃ „Ò¥U ¡Ê
Áfl‡Ê·ÃÊÒ⁄U ¬⁄U ∞ø •Ê߸ flË ‚¢∑˝§◊áÊ ∑§Ë
•Á¢flŒŸ‡ÊË‹ ÁSÕÁà ◊¥ Õ ÿÊ •ãÿ ‹ÊªÊ¥
◊¥ »Ò§‹Ê ‚∑§Ã Õ– ¬Í⁄U ÷Ê⁄Uà ◊¥, ’Ë ∞‚ ∞‚
Ÿ ÿ„U ÷Ë ÁŒπÊÿÊ „ÒU Á∑§ ∞‚ ≈UË «UË ‹ˇÊáÊÊ¥
∑§Ë Á⁄U¬ÊÁ≈ZUª ∑§⁄UŸ flÊ‹Ê¥ ◊¥ ª˝Ê◊ËáÊ ‹ÊªÊ¥ ∑§Ê
•ŸÈ¬Êà ‡Ê„U⁄UË ‹ÊªÊ¥ ‚ ÖÿÊŒÊ ÕÊ–
∞‚ ≈UË «UË ‹ˇÊáÊÊ¥ ∑§ Á‹∞ ©U¬øÊ⁄U ∑§Ë
•Êfl‡ÿ∑§ÃÊ ∑§Ê Sfl÷Êfl ÷Ê⁄Uà ◊¥ ’„ÈUà ∑§◊
„ÒU •ÊÒ⁄U •Êœ ‚ ∑ȧ¿U ÖÿÊŒÊ Ÿ ÁøÁ∑§à‚Ê fl
Œπ÷Ê‹ ∑§Ë ßë¿UÊ √ÿQ§ ∑§Ë „ÒU– ’„ÈUà ‚
ŒÁˇÊáÊË ⁄UÊÖÿÊ¥ ◊¥ ©U¬øÊ⁄U øÊ„UŸ flÊ‹Ê¥ ∑§Ê
¬˝ÁÇÊà ∑ȧ¿U ÖÿÊŒÊ ÕÊ– ¬⁄UãÃÈ ÖÿÊŒÊÃ⁄U
⁄UÊÖÿÊ¥ ◊¥, ‹ÊªÊ¥ ∑§ ÖÿÊŒÊ •ŸÈ¬Êà Ÿ ©U¬øÊ⁄U
∑§Ë ßë¿UÊ √ÿQ§ Ÿ„UË¥ ∑§Ë– ’Ë ∞‚ ∞‚ ∑§ ŒÊ
‚fl¸ˇÊáÊ ÿ„U ’ÃÊÃ „Ò¥U Á∑§ ‚Ÿ˜ wÆÆv ‚
wÆÆ{ Ã∑§ ß‚ ◊„Uàfl¬Íáʸ ◊Èg ¬⁄U ∑§Ê߸ ¬˝ªÁÃ
Ÿ„UË¥ „ÈU߸U–
INDIA Tamil Nadu Andhra Pradesh
÷Ê⁄Uà ÃÁ◊‹ ŸÊ«ÈU •Ê¢œ˝ ¬˝Œ‡Ê
BSS-2006 (Final Report)
’Ë∞‚∞‚-wÆÆ{ (»§Êߟ‹ Á⁄U¬Ù≈¸U)
Gujarat*
ªÈ¡⁄UÊÃ*
Orissa
©U«∏UË‚Ê
Manipur Madhya Pradesh Kerala**
Bihar
◊ÁáʬÈ⁄U ◊äÿ ¬˝Œ‡Ê ∑§⁄U‹** Á’„UÊ⁄U
* including D & N Haveli / «UË ∞á«U ∞Ÿ „Ufl‹Ë ‚Á„UÃ
** including Lakshadweep / ‹ˇÿmˬ ‚Á„UÃ
23

3.6 Page 26

▲back to top


COMMERCIAL SEX WORK
Raising sex workers’ perception of
their risk of exposure to HIV infection
is an essential part of the campaign
against HIV. From 2001 to 2006,
there was a noticeable increase
in the proportion of FSWs who felt
that their risk was “very high,” from
17 percent to 30 percent. Those
saying “low” or “no chance” dropped
from 48 to 38 percent. The BSS also
investigated attitudes among
brothel-based and non-brothel-based
FSWs. Fewer non-brothel-based sex
workers said they felt their chance of
contracting HIV was “very high,”
26 percent, compared to brothel-based
sex workers, 38 percent. Reaching this
group is especially important since,
in many parts of India, sex work is
informal and not based in fixed
locations.
The large majority of FSWs in
India insist upon condom use
(81 percent in 2001 and 87 percent in
2006). Still, many clients (56 percent
in 2006) initially object to the condom.
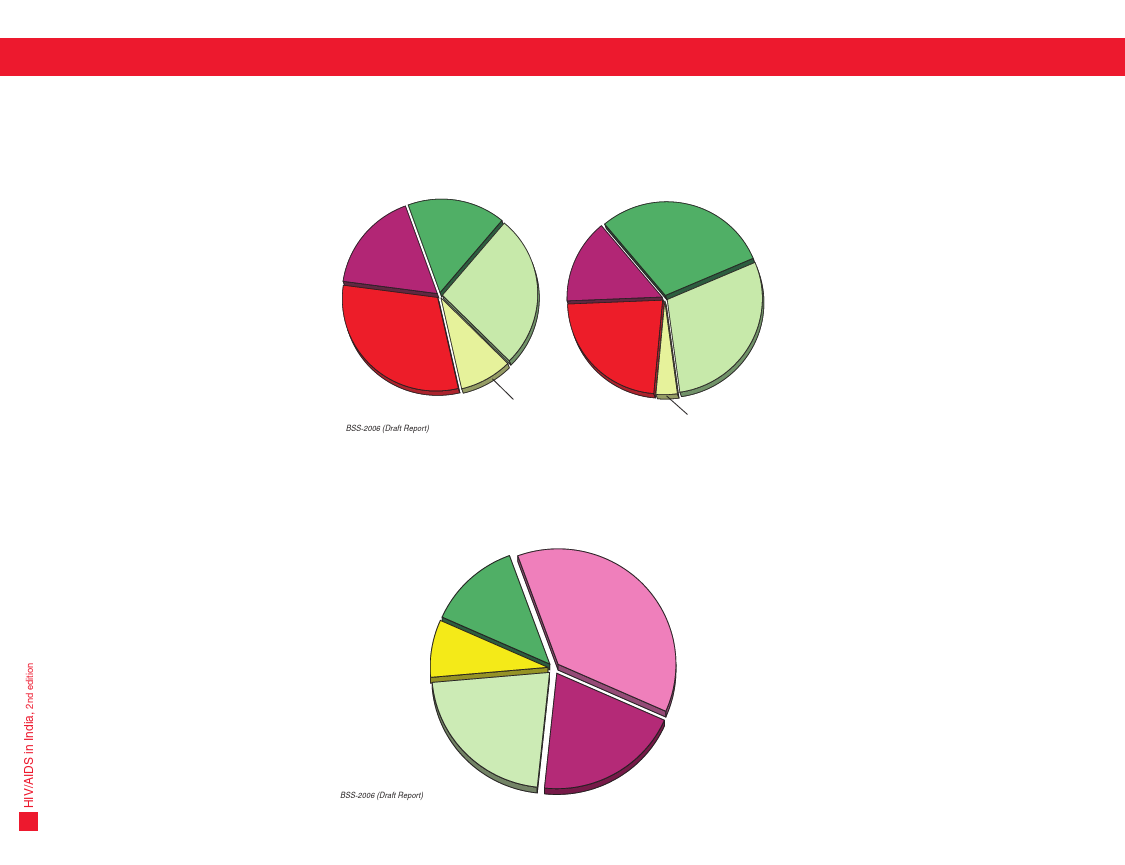
The pie chart to the right shows the
actions taken by the FSWs when the
client objected, with 59 percent either
persuading the client successfully
or refusing sex, although these
percentages have not changed greatly
since 2001. One hopeful indication from
the two surveys is that the proportion of
clients who initially refused the condom
dropped from 69 percent in 2001 to
56 percent in 2006.
Female Sex Workers' Perception of the Risk of Contracting HIV
India, 2001 and 2006
◊Á„U‹Ê ÿıŸ ∑§Êÿ¸∑§Ãʸ•Ù¥ ‚ ∞ø •Ê߸U flË ⁄UÙª „UÙŸ ∑§ ¡ÙÁπ◊ ∑§Ê ¬˝ÁÇÊÃ
÷Ê⁄UÃ, wÆÆv •ı⁄U wÆÆ{
2001
2006
No chance
‚ê÷ÊflŸÊ Ÿ„UË¥
17%
Low
∑§◊
31%
Very high
’„ÈUà ÖÿÊŒÊ
17%
Moderate
◊äÿ◊
26%
No chance
‚ê÷ÊflŸÊ Ÿ„UË¥
15%
Low
∑§◊
23%
Very high
’„ÈUà ÖÿÊŒÊ
30%
Moderate
◊äÿ◊
29%
BSS-2006 (Draft Report)
’Ë∞‚∞‚-wÆÆ{ («˛UÊç≈U Á⁄U¬Ê≈¸U)
No response
∑§Ù߸U ¬˝ÁÃÁ∑˝§ÿÊ Ÿ„UË¥
9%
No response
∑§Ù߸U ¬˝ÁÃÁ∑˝§ÿÊ Ÿ„UË¥
3%
Female Sex Worker Actions When Client Refused Condom Use
in the Past 3 Months, India, 2006
Á¬¿U‹ x ◊„UËŸÊ¥ ◊¥ ¡’ ª˝Ê„U∑§ Ÿ ∑§á«UÙ◊ ∑§ ßSÃ◊Ê‹ ‚ ◊ŸÊ Á∑§ÿÊ ÃÙ
◊Á„U‹Ê ÿıŸ ∑§Êÿ¸∑§Ãʸ ∑§Ë ¬˝ÁÃÁ∑˝§ÿÊ, ÷Ê⁄UÃ, wÆÆ{
Sold sex
ÿıŸ ‚¢’¢œ ’øÊ
13%
Refused sex
ÿıŸ ‚¢’¢œ ‚ ◊ŸÊ Á∑§ÿÊ
37%
Failed to persuade
◊ŸÊŸ ◊¥ •‚»§‹
8%
Persuaded successfully
‚»§‹ÃʬÍfl¸∑§ ◊ŸÊŸÊ
22%
BSS-2006 (Draft Report)
’Ë∞‚∞‚-wÆÆ{ («˛UÊç≈U Á⁄U¬Ê≈¸U)
Charged extra
•ÁÃÁ⁄UQ§ fl‚Í‹Ë ∑§Ë
20%
24
√ÿÊfl‚ÊÁÿ∑§ ÿıŸ ∑§Êÿ¸
ÿÊÒŸ ∑§Êÿ¸∑§Ãʸ•Ê¥ ∑§Ë ∞ø •Ê߸ flË ∑§ ¡ÊÁπ◊ ∑§
¬˝Áà ’…∏UÃË ¡ÊŸ∑§Ê⁄UË ∞ø •Ê߸ flË ∑§ Áπ‹Ê$»§
•Á÷ÿÊŸ ∑§Ê ∞∑§ Áfl‡Ê· Á„US‚Ê „ÒU– ‚Ÿ˜ wÆÆv ‚
wÆÆ{ Ã∑§ ∞»§ ∞‚ «UéÀÿÍ ∑§ •ŸÈ¬Êà ◊¥ ŒπŸ
ÿÊÇÿ flÎÁh „ÈU߸ ¡Ê ÿ„U •ŸÈ÷fl ∑§⁄UÃ Õ Á∑§
©UŸ∑§Ê ¡ÊÁπ◊ “’„ÈUà ©UìÊ” ÕÊ, v| ¬˝ÁÇÊà ‚
xÆ ¬˝ÁÇÊÖ “∑§◊” ÿÊ “ŸÊ øÊ¢‚” ∑§„UŸ flÊ‹Ê¥ ∑§Ê
•ŸÈ¬Êà y} ‚ x} ¬˝ÁÇÊà „UÊ ªÿÊ– ’Ë ∞‚ ∞‚
Ÿ fl‡ÿÊ‹ÿ •ÊœÊÁ⁄Uà •ÊÒ⁄U ªÒ⁄U-fl‡ÿÊ‹ÿ
•ÊœÊÁ⁄Uà ∞»§ ∞‚ «UéÀÿÍ ∑§ Áfl·ÿ ◊¥ ¡ÊŸ∑§Ê⁄UË
¬˝Ê# ÕË– ∑ȧ¿U ªÒ⁄U-fl‡ÿÊ‹ÿ •ÊœÊÁ⁄Uà ÿÊÒŸ
∑§Êÿ¸∑§Ãʸ•Ê¥ Ÿ ’ÃÊÿÊ Á∑§ ∞ø •Ê߸ flË ⁄UÊª
ª˝„UáÊ ∑§⁄UŸ ∑§ •fl‚⁄U ∑§Ê ©Uã„UÊ¥Ÿ “’„ÈUà ©UìÊ”
w{ ¬˝ÁÇÊà •ŸÈ÷fl Á∑§ÿÊ, ¡’Á∑§ fl‡ÿÊ‹ÿ
•ÊœÊÁ⁄Uà ÿÊÒŸ ∑§Êÿ¸∑§Ãʸ ∑§Ê •ŸÈ÷fl x} ¬˝ÁÇÊÃ
⁄U„UÊ– ß‚ ‚◊Í„U ◊¥ ¬„È¢UøŸÊ Áfl‡Ê·ÃÊÒ⁄U ¬⁄U ¡M§⁄UË „ÒU
ÄÿÊ¥Á∑§ ÷Ê⁄Uà ∑§ ’„ÈUà ‚ ÷ʪÊ¥ ◊¥ ÿÊÒŸ ∑§Êÿ¸
•ÁŸÿÁ◊à „ÒU •ÊÒ⁄U Á∑§‚Ë SÕÊ߸ ¡ª„U ¬⁄U Ÿ„UË¥ „ÒU–
÷Ê⁄Uà ◊¥ ∞»§ ∞‚ «UéÀÿÍ ∑§Ê ∞∑§ ’«∏UÊ ’„ÈU◊Ã
∑§á«UÙ◊ ∑§ ßSÃ◊Ê‹ ¬⁄U ¡Ê⁄U ŒÃÊ „ÒU (‚Ÿ˜ wÆÆv ◊¥
}v ¬˝ÁÇÊà •ÊÒ⁄U ‚Ÿ˜ wÆÆ{ ◊¥ }| ¬˝ÁÇÊÃ)– •÷Ë
÷Ë ’„ÈUà ‚ ª˝Ê„U∑§ (wÆÆ{ ◊¥ z{ ¬˝ÁÇÊÃ) ‡ÊÈM§ ◊¥
∑§á«UÙ◊ ∑§ Á‹∞ ◊ŸÊ ∑§⁄UÃ „Ò¥U– ’Ê¢∞ øÊ≈¸U ∑§
ŒÊÁ„UŸË •Ê⁄U Œ‡ÊʸÃÊ „ÒU Á∑§ ª˝Ê„U∑§ ∑§ ◊ŸÊ ∑§⁄U ŒŸ
¬⁄U ∞»§ ∞‚ «UéÀÿÍ mÊ⁄UÊ ÄÿÊ ¬˝ÁÃÁ∑˝§ÿÊ ÁŒπÊ߸ ªß¸,
z~ ¬˝ÁÇÊà Ÿ ÿÊ ÃÊ ª˝Ê„U∑§ ∑§Ê ‚»§‹ÃʬÍfl¸∑§
◊ŸÊÿÊ ÿÊ ÿÊÒŸ ∑§ Á‹∞ ◊ŸÊ Á∑§ÿÊ, ÿ ¬˝ÁÇÊà ‚Ÿ˜
wÆÆv ‚ ’Œ‹ Ÿ„UË¥ „Ò¥U– ŒÊ ‚fl¸ˇÊáÊÊ¥ ◊¥ ‚ ∞∑§
•Ê‡ÊʬÍáʸ ‚¢∑§Ã ÿ„U „ÒU Á∑§ ∞‚ ª˝Ê„U∑§Ê¥ ∑§Ê •ŸÈ¬ÊÃ
¡Ê ‡ÊÈM§•Êà ◊¥ ∑§á«UÙ◊ ∑§Ê ◊ŸÊ ∑§⁄UÃ Õ, ‚Ÿ˜
wÆÆv ◊¥ {~ ¬˝ÁÇÊà ‚ ÉÊ≈U∑§⁄U ‚Ÿ˜ wÆÆ{ ◊¥ z{
¬˝ÁÇÊà „UÊ ªÿÊ–

3.7 Page 27

▲back to top


COMMERCIAL SEX WORK
√ÿÊfl‚ÊÁÿ∑§ ÿıŸ ∑§Êÿ¸
In 2006, five percent of sexually
active urban males and three
percent of rural males said that
they had engaged in sex with a
commercial sex worker in the
past year. Rural males in Andhra
Pradesh reported the highest
percentage by far, but commercial
sex activity in other states is not
uncommon. It should also be kept
in mind that other studies in the
field of sexual behaviour have
shown that this activity tends to
be under-reported in face-to-face
surveys. Men who utilise the
services of commercial sex workers
form an obvious group who can
then act as a “bridge,” bringing
HIV into the general population.
There has been a significant
increase in the proportion of clients
of FSWs who reported using a
condom consistently with sex
workers in the three months before
the survey, from 57 percent in 2001
to 74 percent in 2006. A particularly
sharp increase was observed in
West Bengal, as well as in Delhi
and Punjab. This undoubtedly
reflects a growing realisation in
India of the risks of commercial and
non-regular partner sex as well as
the success of programmes to
encourage condom use.
Percent of Males, Ages 15-49, Saying That They Had Sex with a Commercial Sex
Worker in the Past Year, Urban and Rural, Selected States and India, 2006
÷Ê⁄Uà •ı⁄U øÈÁŸ¢ŒÊ ⁄UÊÖÿÙ¥ ◊¥ vz-y~ fl·¸ •ÊÿÈ flª¸ ∑§ ‹ÙªÙ¥ ∑§Ê ¬˝ÁÇÊà ¡Ù ∑§„UÃ „Ò¥U Á∑§ ªÃ
fl·¸ ©Uã„UÙ¥Ÿ ◊Á„U‹Ê ÿıŸ ∑§Êÿ¸∑§Ãʸ ∑§ ‚ÊÕ ÿıŸ ‚¢’¢œ ’ŸÊÿÊ, ‡Ê„U⁄UË •ı⁄U ª˝Ê◊ËáÊ, wÆÆ{
23
Urban
‡Ê„U⁄UË
Rural
ª˝Ê◊ËáÊ
8
5
3
99
7
3
4
2
4
1
6
4
7
2
4
2
INDIA Andhra Pradesh Tamil Nadu Punjab* Jharkhand
÷Ê⁄Uà •Êãœ˝ ¬˝Œ‡Ê ÃÁ◊‹ ŸÊ«È ¬¢¡Ê’* ¤ÊÊ⁄Uπá«U
BSS-2006 (Final Report)
Note: base is sexually active males
’Ë∞‚∞‚-wÆÆ{ (»§Êߟ‹ Á⁄U¬Ù≈¸U) ŸÙ≈U— ÿıŸ ‚Á∑˝§ÿ ¬ÈM§·Ù¥ ∑§Ê •ÊœÊ⁄U
Maharashtra Kerala** West BengalKarnataka
◊„UÊ⁄UÊc≈˛U ∑§⁄U‹** ¬Á‡ø◊Ë ’¢ªÊ‹∑§ŸÊ¸≈U∑§
* including Chandigarh / øá«U˪…∏U ‚Á„UÃ
** including Lakshadweep / ‹ˇÿmˬ ‚Á„UÃ
including A & N Islands / ∞ ∞á«U ∞Ÿ mˬ ‚◊Í„U ‚Á„UÃ
Percent of FSW Clients Reporting Consistent Condom Use with Female Sex Workers in the
Past Three Months, Selected States and India, 2001 and 2006
÷Ê⁄Uà •ı⁄U øÈÁŸ¢ŒÊ ⁄UÊÖÿÙ¥ ◊¥ ª˝Ê„U∑§Ù¥ ∑§Ê ¬˝ÁÇÊà ¡Ù ∑§„UÃ „Ò¥U Á∑§ ÃËŸ ◊„UËŸÙ¥ ◊¥ ©Uã„UÙ¥Ÿ ◊Á„U‹Ê
ÿıŸ ∑§Êÿ¸∑§Ãʸ•Ù¥ ∑§ ‚ÊÕ ÁŸ⁄¢UÃ⁄U ∑§á«UÙ◊ ∑§Ê ßSÃ◊Ê‹ Á∑§ÿÊ, wÆÆv •ı⁄U wÆÆ{
96
77
74
57
87
85
83
69
63
59
79
76 77
2001
2006
76
64
58
49
48
INDIA Maharashtra Karnataka
÷Ê⁄Uà ◊„UÊ⁄UÊc≈˛U ∑§ŸÊ¸≈U∑§
BSS-2006 (Draft Report)
’Ë∞‚∞‚-wÆÆ{ («˛UÊç≈U Á⁄U¬Ê≈¸U)
Delhi Andhra Pradesh West Bengal Kerala
ÁŒÀ‹Ë •Êãœ˝ ¬˝Œ‡Ê ¬Á‡ø◊Ë ’¢ªÊ‹ ∑§⁄U‹
Punjab Tamil Nadu
¬¢¡Ê’ ÃÁ◊‹ ŸÊ«È
‚Ÿ˜ wÆÆ{ ◊¥ ÿÊÒŸ ‚Á∑˝§ÿ z ¬˝ÁÇÊà ‡Ê„U⁄UË
ß‹Ê∑§ ∑§ •ÊÒ⁄U x ¬˝ÁÇÊà ª˝Ê◊ËáÊ ß‹Ê∑§Ê¥ ∑§
¬ÈL§·Ù¥ Ÿ ’ÃÊÿÊ Á∑§ Á¬¿U‹ ‚Ê‹ fl √ÿfl‚ÊÁÿ∑§
ÿÊÒŸ ∑§Êÿ¸∑§Ãʸ ∑§ ‚ÊÕ ÿÊÒŸ ‚¢’¢œ ◊¥ ⁄U„–
•Êãœ˝ ¬˝Œ‡Ê ∑§ ¬ÈL§·Ê¥ Ÿ •Áœ∑§Ã◊ ¬˝ÁÇÊà ∑§Ë
Á⁄U¬Ê≈¸U ŒË ¬⁄UãÃÈ •ãÿ ⁄UÊÖÿÊ¥ ◊¥ √ÿfl‚ÊÁÿ∑§ ÿÊÒŸ
∑§Êÿ¸ ∑§Ë ªÁÃÁflÁœ •Ê◊ Ÿ„UË¥ „ÒU– ÿ„U ’Êà ÷Ë
äÿÊŸ ◊¥ ⁄UπŸË øÊÁ„U∞ Á∑§ ÿÊÒŸ √ÿfl„UÊ⁄U ∑§ ˇÊòÊ
◊¥ •ãÿ •äÿÿŸ ’ÃÊÃ „Ò¢ Á∑§ ÿ„U ªÁÃÁflÁœ
•Ê◊Ÿ ‚Ê◊Ÿ ∑§ ‚fl¸ˇÊáÊ ‚ •ã«U⁄U Á⁄U¬ÊÁ≈¸«U „UÊ
‚∑§ÃË „ÒU– fl ¬ÈL§· ¡Ê √ÿfl‚ÊÁÿ∑§ ÿÊÒŸ
∑§Êÿ¸∑§Ãʸ•Ê¥ ∑§Ë ‚flÊ∞¢ ‹Ã „Ò¥U, ∞∑§ ß‚Ë ¬˝∑§Ê⁄U
∑§Ê ‚◊Í„U ’ŸÊÃ „Ò¥U •ÊÒ⁄U fl ∞∑§ “‚ÃÈ” ∑§ M§¬ ◊¥
∑§Êÿ¸ ∑§⁄UÃ „Ò¥U Á¡‚∑§ ¡Á⁄Uÿ fl ∞ø •Ê߸ flË ∑§Ê
•Ê◊ ¡ŸÃÊ Ã∑§ ‹ ¡ÊÃ „Ò¥U–
∞»§ ∞‚ «UéÀÿÍ ∑§ ª˝Ê„U∑§Ê¥ ∑§ •ŸÈ¬Êà ◊¥ ŒπŸ
ÿÊÇÿ ’…∏UÊÃ⁄UË „ÈU߸ „ÒU Á¡ã„UÊ¥Ÿ ’ÃÊÿÊ Á∑§ ‚fl¸ˇÊáÊ
‚ ÃËŸ ◊„UËŸ ¬„U‹ ‚ fl ÁŸ⁄¢UÃ⁄U ÿÊÒŸ
∑§Êÿ¸∑§Ãʸ•Ê¥ ∑§ ‚ÊÕ ÿÊÒŸ ‚¢¬∑¸§ ∑§ ŒÊÒ⁄UÊŸ
∑§á«UÙ◊ ∑§Ê ßSÃ◊Ê‹ ∑§⁄U ⁄U„U Õ, ‚Ÿ˜ wÆÆv ◊¥
z| ¬˝ÁÇÊà •ÊÒ⁄U ‚Ÿ˜ wÆÆ{ ◊¥ |y ¬˝ÁÇÊÖ
¬Á‡ø◊Ë ’¢ªÊ‹ ∑§ ‚ÊÕ-‚ÊÕ ÁŒÀ‹Ë •ÊÒ⁄U
¬¢¡Ê’ ◊¥ Áfl‡Ê·ÃÊÒ⁄U ¬⁄U ∞∑§ ÃËfl˝ flÎÁh ŒπË
ªß¸– ÁŸ—‚¢Œ„U fl„U ß‚ ’Êà ∑§Ë •Ê⁄U ‚¢∑§Ã
∑§⁄UÃÊ „ÒU Á∑§ ÷Ê⁄Uà ◊¥ √ÿfl‚ÊÁÿ∑§ •ÊÒ⁄U
•ÁŸÿÁ◊à ÿÊÒŸ ‚ÊÕË ∑§ ‚ÊÕ ‚¢’¢œ ∑§ πÃ⁄U
∑§Ê •’ ÖÿÊŒÊÃ⁄U ‹Êª ¬„UøÊŸŸ ‹ª „Ò¥U ß‚∑§
‚ÊÕ-‚ÊÕ ∑§á«UÙ◊ ∑§ ßSÃ◊Ê‹ ∑§Ê ’…∏UÊflÊ ŒŸ
∑§ Á‹∞ •ÊÿÊÁ¡Ã Á∑§∞ ¡ÊŸ flÊ‹ ∑§Êÿ¸∑˝§◊Ê¥ ∑§Ê
÷Ë ‚»§‹ÃÊ Á◊‹ ⁄U„UË „ÒU–
25

3.8 Page 28

▲back to top


TESTING FOR INFECTION
‚¢∑˝§◊áÊ ∑§Ë ¡Ê°ø
Awareness that one can be tested
for HIV infection has risen very
sharply in India, as well as the
opinion that there is likely to be a
nearby facility where such testing
can be done. Too often, HIV is
spread by people who did not
realise that they were HIV-positive
and could have taken simple steps
to prevent passing it to others.
A key to testing is confidentiality
in view of the stigma that society
frequently associates with the
disease. But do people, in fact,
know of a place where they can
go for testing? These proportions
are still rather low in most states,
more so in rural areas than in
urban. Given the vast size of
India’s rural population, efforts
to establish Voluntary Counseling
and Testing Centres (VCTCs) will
be a major, but necessary, task.
And, the confidential nature of
the test and the perception of
confidentiality must be maintained.
26
Percent of Respondents, Ages 15-49, Who Had Ever Heard of Voluntary Counseling and
Testing Centres (VCTCs), Urban and Rural, Selected States and India, 2006
÷Ê⁄Uà •ÊÒ⁄U øÈÁŸ¢ŒÊ ⁄UÊÖÿÊ¥ ◊¥ vz-y~ fl·¸ •ÊÿÈ ∑§ ¬˝àÿÊÕ˸ Á¡ã„UÊ¥Ÿ SflÒÁë¿U∑§ ¬⁄UÊ◊‡Ê¸ ∞fl¢ ¬⁄UˡÊáÊ
∑§ãº˝ (flË ‚Ë ‚Ë ≈UË) ∑§ ’Ê⁄U ◊¥ ‚ÈŸÊ „ÒU, ‡Ê„U⁄UË •ÊÒ⁄U ª˝Ê◊ËáÊ, wÆÆ{
INDIA
÷Ê⁄UÃ
Maharashtra
◊„UÊ⁄UÊc≈U˛
Karnataka
∑§ŸÊ¸≈U∑§
Tamil Nadu
ÃÁ◊‹ ŸÊ«ÈU
Andhra Pradesh
•Ê¢œ˝ ¬˝Œ‡Ê
Uttar Pradesh
©UûÊ⁄U ¬˝Œ‡Ê
Orissa
©U«∏UË‚Ê
Madhya Pradesh
◊äÿ ¬˝Œ‡Ê
Bihar
Á’„UÊ⁄
30
15
32
24
32
23
22
12
10
18
8
15
6
6
5
45
42
53
Urban
‡Ê„U⁄UË
Rural
ª˝Ê◊ËáÊ
BSS-2006 (Final Report)
’Ë∞‚∞‚-wÆÆ{ (»§Êߟ‹ Á⁄U¬Ù≈¸U)
Percent of Respondents, Ages 15-49, Who Believe That a HIV/AIDS Testing Facility
is Available in Their Area, Selected States and India, 2001 and 2006
÷Ê⁄Uà •ı⁄U øÈÁŸ¢ŒÊ ⁄UÊÖÿÙ¥ ◊¥ vz-y~ fl·¸ •ÊÿÈ flª¸ ∑§ ¬˝àÿÊÕ˸ÿÙ¥ ∑§Ê ¬˝ÁÇÊà ¡Ù ÿ„U Áfl‡flÊ‚ ∑§⁄UÃ
„Ò¥U Á∑§ ©UŸ∑§ ˇÊòÊ ◊¥ ∞ø •Ê߸U flË/∞«˜U‚ ∑§Ë ¡Ê¢ø ∑§Ë ‚ÈÁflœÊ ©U¬‹éœ „ÒU, wÆÆv •ı⁄U wÆÆ{
INDIA
10
÷Ê⁄UÃ
28
Maharashtra
12
◊„UÊ⁄UÊc≈U˛
Andhra Pradesh
13
•Ê¢œ˝ ¬˝Œ‡Ê
Karnataka
12
∑§ŸÊ¸≈U∑§
39
Tamil Nadu
ÃÁ◊‹ ŸÊ«ÈU
21
28
Uttar Pradesh1
©UûÊ⁄U ¬˝Œ‡Ê1
10
22
Madhya Pradesh2
13
◊äÿ ¬˝Œ‡Ê2
16
Bihar3 0.2
Á’„UÊ⁄ 3
13
Orissa
3
©U«∏UË‚Ê
12
60
52
2001
2006
BSS-2006 (Final Report)
’Ë∞‚∞‚-wÆÆ{ (»§Êߟ‹ Á⁄U¬Ù≈¸U)
Note: base is respondents aware of HIV, AIDS or both
ŸÙ≈U— ∞ø •Ê߸U flË/∞«˜U‚ ÿÊ ŒÙŸÙ¥ ∑§ ‚¢’¢œ ◊¥ ¡ÊªM§∑§ÃÊ •ÊœÊ⁄U „ÒU
1 including Uttarakhand / ©UûÊ⁄UÊπá«U ‚Á„UÃ
2 including Chhattisgarh / ¿UûÊË‚ª…∏U ‚Á„UÃ
3 including Jharkhand / ¤ÊÊ⁄Uπá«U ‚Á„UÃ
∞ø •Ê߸ flË ‚¢∑˝§◊áÊ ∑§Ë ¡Ê¢ø „UÊ ‚∑§ÃË „ÒU
ß‚ ’Êà ∑§Ë ¡ÊªM§∑§ÃÊ ◊¥ ’„ÈUà Ã¡Ë ‚
flÎÁh „ÈU߸ „ÒU ‚ÊÕ „UË ◊¥ ÿ„U ÷Ë ¬ÃÊ ø‹Ê
Á∑§ ÿ„U ¡Ê¢ø ∑§⁄UflÊŸ ∑§Ë ‚ÈÁflœÊ ÷Ë
•Ê‚-¬Ê‚ „UË „ÒU– •Ä‚⁄U ÖÿÊŒÊÃ⁄U ÿ„U „UÊÃÊ
„ÒU Á∑§ ∞ø •Ê߸ flË ©UŸ ‹ÊªÊ¥ ∑§ mÊ⁄UÊ »Ò§‹ÃÊ
⁄U„UÃÊ „ÒU Á¡ã„¥U ÿ„U ¬ÃÊ Ÿ„UË¥ „UÊÃÊ Á∑§ fl
∞ø •Ê߸ flË ¬ÊÚÁ$¡Á≈Ufl Õ •ÊÒ⁄U ŒÍ‚⁄UÊ¥ ∑§Ê
‚¢øÊÁ⁄Uà ∑§⁄UŸ ‚ ’øŸ ∑§ Á‹∞ ∑ȧ¿U ‚⁄U‹
©U¬Êÿ •¬ŸÊ ‚∑§Ã Õ– ÿ„U ‚◊Ê¡ ◊¥ ß‚
⁄UÊª ‚ ¡È«∏U ∑§‹¢∑§ ÷⁄UÊ‚ ∑§Ê ¬⁄UπŸ ∑§Ë
∑È¢§¡Ë „ÒU– ¬⁄UãÃÈ ÄÿÊ ‹Êª flÊSÃfl ◊¥ ÿ„U
¡ÊŸÃ „Ò¥U Á∑§ fl ÿ„U ¡Ê¢ø ∑§„UÊ¢ ¬⁄U ∑§⁄UflÊ
‚∑§Ã „Ò¥U? ’„ÈUà ‚ ⁄UÊÖÿÊ¥ ◊¥ ÿ„U •ŸÈ¬ÊÃ
•÷Ë ÷Ë ∑§◊ „ÒU, ∞‚Ê „UË •ŸÈ¬Êà ª˝Ê◊ËáÊ
ß‹Ê∑§Ê¥ ◊¥ ÷Ë „ÒU ¡Ê ‡Ê„U⁄UÊ¥ ∑§Ë •¬ˇÊÊ
•Áœ∑§ „ÒU– ÷Ê⁄Uà ∑§ ª˝Ê◊ËáÊ ß‹Ê∑§Ê¥ ∑§Ë
Áfl‡ÊÊ‹ ¡Ÿ‚¢ÅÿÊ ∑§Ê ŒπÃ „ÈU∞ SflÒÁë¿U∑§
ªÊ¬ŸËÿ ¬⁄UÊ◊‡Ê¸ ∞fl¢ ¬⁄UˡÊáÊ ∑§ãº˝
(flË ‚Ë ‚Ë ≈UË ‚Ë) ∑§Ë SÕʬŸÊ ∑§Ê
¬˝ÿÊ‚ ∞∑§ ’«∏UÊ ∑§Êÿ¸ „UÊªÊ ¡Ù Á∑§ •ÁÃU
•Êfl‡ÿ∑§ „ÒU– ß‚ ¡Ê¢ø ∑§Ë ªÊ¬ŸËÿÃÊ
•ÊÒ⁄U ß‚∑§Ë ªÊ¬ŸËÿÃÊ ∑§ ’Êœ ∑§Ê ∑§Êÿ◊
⁄UπŸÊ „UÊªÊ–

3.9 Page 29

▲back to top


EXPOSURE TO AND BELIEFS ON HIV/AIDS ISSUES
∞ø •Ê߸U flË/∞«˜U‚ ‚¢’¢Áœ ◊ÈŒ˜ŒÙ¥ ¬⁄U ¡ÊŸ∑§Ê⁄UË •ı⁄U Áfl‡flÊ‚
One of the HIV epidemic’s
sadder aspects is the fact that a
mother may unknowingly pass
HIV to her unborn child. This
can result from the mother’s
lack of awareness that she is
HIV-positive as well as her lack
of realisation that a child can be
infected before birth or during
breastfeeding. This adds further
urgency to the provision of
confidential testing facilities
and information on their location.
Treatment is available to reduce
the risk of mother-to-child
transmission. But, knowledge
of this method of HIV infection
is not widespread in India,
particularly in rural areas.
A blood supply that is 100 percent
free of HIV is a must in any
country. One way to ensure that
sufficient blood is available to
save lives is a campaign for
voluntary donors to give blood
that is most likely to be free of
HIV and other diseases. In
several states, including Andhra
Pradesh and Gujarat, large
percentages of survey
respondents reported that
they had been exposed to
a voluntary blood donation
campaign but, in most states,
those percentages were quite low.
Percent of Respondents, Ages 15-49, Aware of Parent-to-Child Transmission
of HIV, Urban and Rural, Selected States and India, 2006
÷Ê⁄Uà •ı⁄U øÈÁŸ¢ŒÊ ⁄UÊÖÿÙ¥ ◊¥ vz-y~ fl·¸ •ÊÿÈ flª¸ ∑§ ¬˝àÿÊÕ˸ÿÙ¥ ∑§Ê ¬˝ÁÇÊà Á¡Ÿ◊¥ •Á÷÷Êfl∑§
‚ ’ìÊ ◊¥ ∞ø •Ê߸U flË ∑§ ‚¢øÊ⁄UáÊ ∑§Ë ¡ÊªM§∑§ÃÊ „ÒU, ‡Ê„U⁄UË •ı⁄U ª˝Ê◊ËáÊ, wÆÆ{
∞ø •Ê߸ flË ∑§ √ÿʬ∑§ M§¬ ∑§Ê ∞∑§ ŒÈπË
¬„U‹Í ÿ„U ÷Ë „ÒU Á∑§ ◊ÊÃÊ ‚ •ã¡ÊŸ ◊¥
∞ø •Ê߸ flË ∑§Ê ‚¢øÊ⁄UáÊ ©U‚∑§ •¡ã◊¥
INDIA
÷Ê⁄UÃ
Andhra Pradesh
•Ê¢œ˝ ¬˝Œ‡Ê
Maharashtra
◊„UÊ⁄UÊc≈˛U
Karnataka
∑§ŸÊ¸≈U∑§
Tamil Nadu
ÃÁ◊‹ ŸÊ«ÈU
Madhya Pradesh
◊äÿ ¬˝Œ‡Ê
Orissa
©U«∏UË‚Ê
5
2
Bihar
4
Á’„UÊ⁄
4
Uttar Pradesh
4
©UûÊ⁄U ¬˝Œ‡Ê
3
BSS-2006 (Final Report)
’Ë∞‚∞‚-wÆÆ{ (»§Êߟ‹ Á⁄U¬Ù≈¸U)
20
10
19
22
16
22
12
13
11
43
34
28
Urban
‡Ê„U⁄UË
Rural
ª˝Ê◊ËáÊ
Á‡Ê‡ÊÈ ◊¥ „UÊ ¡ÊÃÊ „ÒU ß‚∑§Ê ◊ÈÅÿ ∑§Ê⁄UáÊ ◊Ê¢
∑§Ë ¡ÊªM§∑§ÃÊ ◊¥ ∑§◊Ë „ÒU Á∑§ ©U‚ ß‚ ’ÊÃ
∑§Ë ¡ÊŸ∑§Ê⁄UË Ÿ„UË¥ Á∑§ fl„U ∞ø •Ê߸ flË
¬ÊÚÁ$¡Á≈Ufl „ÒU •ÊÒ⁄U ‚ÊÕ „UË ◊¥ ß‚ ’Êà ‚ ÷Ë
•ã¡ÊŸ „ÒU Á∑§ ©U‚∑§Ê Á‡Ê‡ÊÈ ª÷¸ ◊¥ ÿÊ
S߬ʟ ∑§ ŒÊÒ⁄UÊŸ ‚¢∑˝§Á◊à „UÊ ‚∑§ÃÊ „ÒU–
ß‚ ∑§Ê⁄UáÊ ÿ„U •Êfl‡ÿ∑§ „UÊ ¡ÊÃÊ „ÒU Á∑§
ªÊ¬ŸËÿ ¡Ê¢ø ‚ÈÁflœÊ ∑§Ê ¬˝’¢œ „UÊ •ÊÒ⁄U
‚Ê⁄UË ¡ÊŸ∑§Ê⁄UË ©UãÊ∑§ SÕÊŸ ¬⁄U ©U¬‹éœ
∑§⁄UflÊ߸ ¡Ê∞– ◊Ê¢ ‚ Á‡Ê‡ÊÈ ◊¥ ‚¢∑˝§◊áÊ ∑§
‚¢øÊ‹Ÿ ∑§ πÃ⁄U ∑§Ê ∑§◊ ∑§⁄UŸ ∑§ Á‹∞
©U¬øÊ⁄U ©U¬‹éœ „ÒU– ¬⁄UãÃÈ ∞ø •Ê߸ flË ∑§
‚¢∑˝§◊áÊ ∑§ Áfl·ÿ ◊¥ ÿ„U ¡ÊŸ∑§Ê⁄UË ÷Ê⁄UÃ
◊¥, Áfl‡Ê·ÃÿÊ ª˝Ê◊ËáÊ ˇÊòÊÙ¥ ◊¥, ∆UË∑§ ¬˝∑§Ê⁄U
Percent of Respondents, Ages 15-49, Saying That They Had Exposure to a Voluntary
Blood Donation Campaign, Urban and Rural, Selected States and India, 2006
÷Ê⁄Uà •ı⁄U øÈÁŸ¢ŒÊ ⁄UÊÖÿÙ¥ ◊¥ vz-y~ fl·¸ •ÊÿÈ flª¸ ∑§ ¬˝àÿÊÕ˸ÿÙ¥ ∑§Ê ¬˝ÁÇÊà ¡Ù ∑§„UÃ „Ò¥U Á∑§
©Uã„¥U ÁŸÿÁ◊à Sflÿ¢‚flË ⁄UÄÌʟ ∑§Êÿ¸∑˝§◊ ∑§Ë ¡ÊŸ∑§Ê⁄UË „ÒU, ‡Ê„U⁄UË •ı⁄U ª˝Ê◊ËáÊ, wÆÆ{
82
‚ »Ò§‹Ë Ÿ„UË¥ „ÒU–
⁄UQ§ •Ê¬ÍÁø ¡Ê vÆÆ ¬˝ÁÇÊà ∞ø •Ê߸ flË
⁄UÁ„Uà „UÊ ¡Ù ‚÷Ë Œ‡ÊÊ¥ ◊¥ •ÁŸflÊÿ¸ „ÒU–
73
60
¡ËflŸ ’øÊŸ ∑§ Á‹∞ ⁄UQ§ ∑§Ë ¬˝øÈ⁄U ◊ÊòÊÊ ◊¥
Urban
©U¬‹éœÃÊ ∑§Ê ∞∑§ ©U¬Êÿ ÿ„U „ÒU Á∑§
‡Ê„U⁄UË
Rural
SflÒÁë¿U∑§ ŒÊÃÊ•Ê¥ ∑§ mÊ⁄UÊ ∞ø •Ê߸ flË •ÊÒ⁄U
ª˝Ê◊ËáÊ
•ãÿ ⁄UÊªÊ¥ ⁄UÁ„Uà ⁄UQ§ŒÊŸ ∑§⁄UŸ ∑§ Á‹∞
38
30
⁄UQ§ŒÊŸ Á‡ÊÁfl⁄UÊ¥ ∑§Ê •ÊÿÊ¡Ÿ Á∑§ÿÊ ¡Ê∞–
•Êãœ˝ ¬˝Œ‡Ê •ÊÒ⁄U ªÈ¡⁄UÊà ∑§ •‹ÊflÊ •ãÿ
⁄UÊÖÿÊ¥ ◊¥ ’„ÈUà ‚ ‚fl¸ˇÊáÊ ∑§⁄UŸ ¬⁄U ¬ÃÊ
19
17
ø‹Ê Á∑§ ©UŸ ⁄UÊÖÿÊ¥ ◊¥ SflÒÁë¿U∑§ ⁄UQ§ŒÊŸ
11
9
5
75
55
42
Á‡ÊÁfl⁄U •ÊÿÊÁ¡Ã ÃÊ Á∑§∞ ¡Ê ⁄U„U „Ò¥U Á∑§ãÃÈ
©UŸ∑§Ê ¬˝ÁÇÊà ’„ÈUà ∑§◊ „ÒU–
INDIA
Gujarat* Andhra Pradesh
÷Ê⁄UÃ
ªÈ¡⁄UÊÃ* •Ê¢œ˝ ¬˝Œ‡Ê
BSS-2006 (Final Report)
’Ë∞‚∞‚-wÆÆ{ (»§Êߟ‹ Á⁄U¬Ù≈¸U)
Kerala**
∑§⁄U‹**
Rajasthan Chhattisgarh Madhya Pradesh Uttarakhand
⁄UÊ¡SÕÊŸ ¿UûÊË‚ª…∏U ◊äÿ ¬˝Œ‡Ê ©UûÊ⁄UÊπ¢«U
* including D & N Haveli / «UË ∞á«U ∞Ÿ „Ufl‹Ë ‚Á„UÃ
** including Lakshadweep / ‹ˇÿmˬ ‚Á„UÃ
27

3.10 Page 30

▲back to top


EXPOSURE TO AND BELIEFS ON HIV/AIDS ISSUES
∞ø •Ê߸U flË/∞«˜U‚ ‚¢’¢Áœ ◊ÈŒ˜ŒÙ¥ ¬⁄U ¡ÊŸ∑§Ê⁄UË •ı⁄U Áfl‡flÊ‚
Misconceptions regarding HIV
can be one of its biggest allies.
If people believe that HIV can
be spread by sharing food, a
sneeze, or a mosquito bite, the
likelihood of stigma against its
victims will be greatly increased.
Similarly, should people believe
the disease is curable, they will
fear it less. India is not alone in
this, as all countries have had to
educate the public about HIV.
National campaigns to reduce
misconceptions about HIV have
intensified and would seem to
have had an effect in India.
The proportion of those saying
HIV/AIDS is curable is relatively
low although large proportions
still believe that HIV can be
transmitted by mosquito bite.
The importance of using
media to spread awareness
of HIV/AIDS cannot be
overemphasized. There are
very sharp differences in
knowledge between those
exposed to media and those
not so exposed. It is clearly
essential to use all channels
of information, including direct
communication, with those
who do not regularly use
media such as television,
radio and newspapers.
28
Percent of Respondents, Ages 15-49, with Particular Beliefs about HIV/AIDS
Selected States and India, 2006
÷Ê⁄Uà •ı⁄U øÈÁŸ¢ŒÊ ⁄UÊÖÿÙ¥ ◊¥ vz-y~ fl·¸ •ÊÿÈ flª¸ ∑§ ¬˝àÿÊÕ˸ÿÙ¥ ∑§Ê ¬˝ÁÇÊà Á¡ã„¥U
∞ø •Ê߸U flË/∞«˜U‚ ∑§ ¬˝Áà Áfl‡Ê· ¬˝∑§Ê⁄U ∑§Ê Áfl‡flÊ‚ „ÒU, wÆÆ{
46
41
38
37
Can be transmitted by mosquito bite
◊ë¿U⁄U ∑§ ∑§Ê≈UŸ ‚ ‚¢øÊÁ⁄Uà „UÙ ‚∑§ÃÊ „ÒU
Can be cured by medicine
•ı·Áœ¥ ‚ ©U¬øÊ⁄U „UÙ ‚∑§ÃÊ „ÒU
29
27
11
8
22
22
17
16
15
14
8
9
9
5
INDIA
Assam
Gujarat*
÷Ê⁄Uà •‚◊ ªÈ¡⁄UÊÃ*
BSS-2006 (Final Report)
’Ë∞‚∞‚-wÆÆ{ (»§Êߟ‹ Á⁄U¬Ù≈¸U)
Andhra Pradesh Tamil Nadu
•Ê¢œ˝ ¬˝Œ‡Ê ÃÁ◊‹ ŸÊ«È
Kerala
Bihar** Himachal Pradesh Madhya Pradesh
∑§⁄U‹ Á’„UÊ⁄**U Á„U◊Êø‹ ¬˝Œ‡Ê ◊äÿ ¬˝Œ‡Ê
* including D & N Haveli / «UË ∞á«U ∞Ÿ „Ufl‹Ë ‚Á„UÃ
** including Lakshadweep / ‹ˇÿmˬ ‚Á„UÃ
Percent of Respondents, Ages 15-49, Reporting Condom Knowledge and
Use and Ways of HIV Transmission, by Media Exposure, India, 2006
÷Ê⁄Uà ◊¥ vz-y~ fl·¸ •ÊÿÈ flª¸ ∑§ ¬˝àÿÊÕ˸ÿÙ¥ ∑§Ê ¬˝ÁÇÊà Á¡ã„¥U ∑§á«UÙ◊ ÃÕÊ ß‚∑§ ¬˝ÿÙª ∞fl¢
∞ø •Ê߸U flË ∑§ ‚¢øÊ⁄U ∑§ Áfl·ÿ ◊¥ ¡ÊŸ∑§Ê⁄UË ◊ËÁ«UÿÊ mÊ⁄UÊ ¬˝Êåà „ÈU߸U, wÆÆ{
Had seen or heard of a condom
∑§á«UÙ◊ ŒπÊ ÿÊ ©U‚∑§ Áfl·ÿ ◊¥ ‚ÈŸÊ „ÒU
91
45
Condom used with last non-regular partner
Á¬¿U‹ •ÁŸÿÁ◊à ‚ÊÕË ∑§ ‚ÊÕ ∑§á«UÙ◊ ∑§Ê ¬˝ÿÙª
Knows ways of transmission:
‚¢øÊ⁄UáÊ ∑§Ë ¡ÊŸ∑§Ê⁄UË
By breastfeeding
SÃ⁄U¬ÊŸ mÊ⁄UÊ
24
15
68
Exposed
•⁄UˡÊÃ
65
Not Exposed
•⁄UˡÊà Ÿ„UË¥
Mother to child
◊ÊÃÊ ‚ Á‡Ê‡ÊÈ ∑§Ù
18
Blood transfusion
⁄UÄà ‚¢øÊ⁄UáÊ
21
80
90
Sexual contact
88
ÿıŸ ‚¢’¢œ
21
BSS-2006 (Final Report)
’Ë∞‚∞‚-wÆÆ{ (»§Êߟ‹ Á⁄U¬Ù≈¸U)
∞ø •Ê߸ flË ∑§Ë ÷Ê⁄Uà ◊¥ ª‹Ã œÊ⁄UáÊÊ∞¢
ß‚∑§Ë ‚’‚ ’«∏UË ‚„UÿÊªË „UÊ ‚∑§ÃË „ÒU–
ÿÁŒ ‹Êª ÿ„U Áfl‡flÊ‚ ∑§⁄U ‹¥ Á∑§
∞ø •Ê߸ flË ÷Ê¡Ÿ ∞∑§ ‚ÊÕ πÊŸ ‚, ¿UË¥∑§
‚ ÿÊ Á»§⁄U ◊ë¿U⁄U ∑§ ∑§Ê≈UŸ ‚ „UÊ ¡ÊÃÊ „ÒU
ÃÊ ß‚‚ ¬˝÷ÊÁflà √ÿÁQ§ ∑§ ÁflM§h ß‚Ë
¬˝∑§Ê⁄U ‚ ÷ÿ ’…∏U ¡Ê∞ªÊ. ß‚Ë ¬˝∑§Ê⁄U ‹ÊªÊ¥
∑§Ê ÿ„U Áfl‡flÊ‚ ∑§⁄UŸÊ øÊÁ„U∞ Á∑§ ÿ„U ⁄UÊª
‹Êß‹Ê¡ Ÿ„UË¥ „ÒU– ÃÊ fl ß‚‚ ∑§◊ ÷ÿ÷ËÃ
„UÊ¥ª¥– ß‚ ∑§fl‹ ÷Ê⁄Uà ◊¥ „UË Ÿ„UË¥ •Á¬ÃÈ
‚÷Ë Œ‡ÊÊ¥ ∑§ ‹ÊªÊ¥ ∑§Ê ∞ø •Ê߸ flË ∑§ ¬˝ÁÃ
Á‡ÊÁˇÊà Á∑§ÿÊ ªÿÊ– ∞ø •Ê߸ flË ∑§ ¬˝ÁÃ
ª‹Ã œÊ⁄UáÊÊ•Ê¥ ∑§Ê Á◊≈UÊŸ ∑§ Á‹∞ ⁄UÊCÔ˛UËÿ
•ÊÿÊ¡∑§Ê¥ ∑§Ë ªÁà ◊¥ ÃËfl˝ÃÊ ‹Ê߸ ªß¸ „ÒU
•ÊÒ⁄U ÷Ê⁄Uà ◊¥ ß‚∑§ ¬˝÷Êfl ŒπŸ ∑§Ê Á◊‹
„Ò¥U– ∞ø •Ê߸ flË/∞«˜U‚ ∑§Ê ©U¬øÊ⁄U ‚¢÷fl „ÒU
ÿ„U ◊ÊŸŸ flÊ‹ ‹ÊªÊ¥ ∑§Ê •ŸÈ¬Êà ’„ÈUà ∑§◊
„ÒU– ÿlÁ¬ ‹ÊªÊ¥ ∑§Ê ’«∏UÊ •ŸÈ¬Êà •èÊË ÷Ë
ÿ„U Áfl‡flÊ‚ ∑§⁄UÃÊ „ÒU Á∑§ ∞ø •Ê߸ flË
◊ë¿U⁄U ∑§ ∑§Ê≈UŸ ‚ ‚¢øÊÁ⁄Uà „UÊ ‚∑§ÃÊ „ÒU–
∞ø •Ê߸ flË/∞«˜U‚ ∑§Ë ¡ÊªM§∑§ÃÊ ∑§Ù
»Ò§‹ÊŸ ◊¥ ◊ËÁ«UÿÊ ∑§Ë ◊„Uàfl¬Íáʸ ÷ÍÁ◊∑§Ê
∑§Ê Ÿ$¡⁄U•¢ŒÊ$¡ Ÿ„UË¥ Á∑§ÿÊ ¡Ê ‚∑§ÃÊ–
◊ËÁ«UÿÊ ‚ ‚¢¬∑¸§ ◊¥ ⁄U„UŸ flÊ‹Ê¥ ∑§Ë
¡ÊŸ∑§Ê⁄UË •ÊÒ⁄U ◊ËÁ«UÿÊ ∑§ ‚¢¬∑¸§ ◊¥ Ÿ
⁄U„UŸ flÊ‹ ‹ÊªÊ¥ ∑§Ë ¡ÊŸ∑§Ê⁄UË ◊¥ ’„ÈUÃ
•ãÃ⁄U „ÒU– ÿ„U S¬CÔU M§¬ ‚ •Êfl‡ÿ∑§ „ÒU
Á∑§ ¡ÊŸ∑§Ê⁄UË ∑§Ê ‚÷Ë SÊ˝ÊÃÊ¥ ‚ ∞∑§òÊ
Á∑§ÿÊ ¡Ê∞, ©UŸ‚ ÷Ë ¡Ê ◊ËÁ«UÿÊ ∑§
ÁŸ⁄¢UÃ⁄U ‚¢¬∑¸§ ◊¥ Ÿ„UË¥ „Ò¥U ¡Ò‚ ≈UË flË,
⁄UÁ«UÿÊ •ÊÒ⁄U ‚◊ÊøÊ⁄U ¬òÊ–

4 Pages 31-40

▲back to top


4.1 Page 31

▲back to top


EXPOSURE TO AND BELIEFS ON HIV/AIDS ISSUES
∞ø •Ê߸U flË/∞«˜U‚ ‚¢’¢Áœ ◊ÈŒ˜ŒÙ¥ ¬⁄U ¡ÊŸ∑§Ê⁄UË •ı⁄U Áfl‡flÊ‚
Knowing someone who is
HIV-positive is an effective,
but unfortunate, way in which the
dangers of HIV can be personally
observed. Knowing a person with
HIV brings home the truth of the
many warnings about the disease.
The percentage of respondents
who said that they did know of a
HIV-positive person could be an
indicator of HIV prevalence in a
particular state. But it could also
suggest the degree to which HIV
patients are accepted in a state’s
society and are less fearful of
their HIV status being known.
Beyond simply knowing of a
HIV-positive person, knowing
someone who died of AIDS makes
the nature of the disease very
clear, serving as a powerful
motivation to avoid it. If personal
experience with HIV is low, the
threat from it may not be fully
appreciated and beliefs that it can
be cured are likely to be more
widely held. This can easily lead
to a growing HIV epidemic in an
unsuspecting population.
Percent of Respondents, Ages 15-49, Aware of Someone Infected with HIV/AIDS
Selected States and India, 2001 and 2006
÷Ê⁄Uà •ı⁄U øÈÁŸ¢ŒÊ ⁄UÊÖÿÙ¥ ◊¥ vz-y~ fl·¸ •ÊÿÈ flª¸ ∑§ ¬˝àÿÊÕ˸ÿÙ¥ ∑§Ê ¬˝ÁÇÊà Á¡ã„¥U Á∑§‚Ë ∑§
∞ø •Ê߸U flË/∞«˜U‚ ‚ ‚¢∑˝§Á◊à „UÙŸ ∑§Ë ¡ÊŸ∑§Ê⁄UË „ÒU, wÆÆv •ı⁄U wÆÆ{
INDIA
8
÷Ê⁄UÃ
16
Andhra Pradesh
•Ê¢œ˝ ¬˝Œ‡Ê
36
60
Manipur
◊ÁáʬÈ⁄U
37
59
Maharashtra
◊„UÊ⁄UÊc≈˛U
16
34
Tamil Nadu
ÃÁ◊‹ ŸÊ«ÈU
17
27
Karnataka
∑§ŸÊ¸≈U∑§
15
26
Goa1
8
ªÙflÊ1
21
Bihar2 1
Á’„UÊ⁄ 2 3
2001
2006
Uttar Pradesh3
©UûÊ⁄U ¬˝Œ‡Ê3
3
7
BSS-2006 (Final Report)
’Ë∞‚∞‚-wÆÆ{ (»§Êߟ‹ Á⁄U¬Ù≈¸U)
1 including Daman & Diu / Œ◊Ÿ ∞á«U ŒËÿÍ ‚Á„UÃ
2 including Jharkhand / ¤ÊÊ⁄Uπá«U ‚Á„UÃ
3 including Uttarakhand / ©UûÊ⁄UÊπá«U ‚Á„UÃ
Percent of Respondents, Ages 15-49, Aware of Someone Who Died
from AIDS, Selected States and India, 2001 and 2006
÷Ê⁄Uà •ı⁄U øÈÁŸ¢ŒÊ ⁄UÊÖÿÙ¥ ◊¥ vz-y~ fl·¸ •ÊÿÈ flª¸ ∑§ ¬˝àÿÊÕ˸ÿÙ¥ ∑§Ê ¬˝ÁÇÊà Á¡ã„¥U Á∑§‚Ë ∑§
∞«˜U‚ ‚ ◊⁄UŸ ∑§Ë ¡ÊŸ∑§Ê⁄UË „ÒU, wÆÆv •ı⁄U wÆÆ{
INDIA
9
÷Ê⁄UÃ
15
Andhra Pradesh
•Ê¢œ˝ ¬˝Œ‡Ê
31
60
Manipur
◊ÁáʬÈ⁄U
38
59
Maharashtra
◊„UÊ⁄UÊc≈˛U
22
30
Tamil Nadu
ÃÁ◊‹ ŸÊ«ÈU
19
29
Goa1
10
ªÙflÊ1
27
Karnataka
∑§ŸÊ¸≈U∑§
Uttar Pradesh2
©UûÊ⁄U ¬˝Œ‡Ê2
2
6
17
23
2001
2006
Bihar3 0.4
Á’„UÊ⁄ 3 3
BSS-2006 (Final Report)
’Ë∞‚∞‚-wÆÆ{ (»§Êߟ‹ Á⁄U¬Ù≈¸U)
1 including Daman & Diu / Œ◊Ÿ ∞á«U ŒËÿÍ ‚Á„UÃ
2 including Uttarakhand / ©UûÊ⁄UÊπá«U ‚Á„UÃ
3 including Jharkhand / ¤ÊÊ⁄Uπá«U ‚Á„UÃ
Á∑§‚Ë ∞ø •Ê߸ flË ¬ÊÚÁ$¡Á≈Ufl flÊ‹ √ÿÁQ§ ∑§Ê
¡ÊŸŸÊ ∞∑§ ¬˝÷ÊflË ¬⁄UãÃÈ ŒÈ÷ʸÇÿ¬Íáʸ ’Êà „ÒU–
ÿ„U ∞∑§ ⁄UÊSÃÊ „ÒU Á¡‚‚ ∞ø •Ê߸ flË ∑§
πÃ⁄UÊ¥ ∑§Ê √ÿÁQ§ªÃ M§¬ ‚ Œπ ‚∑§Ã „Ò¥U–
∞ø •Ê߸ flË ª˝Á‚à √ÿÁQ§ ∑§Ê ¡ÊŸŸ ‚ ⁄UÊª ∑§
’Ê⁄U ◊¥ ’„ÈUà ‚Ë øÃÊflÁŸÿÊ¥ ∑§Ê ¬ÃÊ ø‹ÃÊ „ÒU–
ÿÁŒ ∑§Ê߸ ÿ„U ∑§„UÃÊ „ÒU Á∑§ fl„U ∞ø •Ê߸ flË
‚¢∑˝§Á◊à √ÿÁQ§ ∑§Ê ¡ÊŸÃÊ ÕÊ ÃÊ ÿ„U ß‚ ’ÊÃ
∑§ ‚¢∑§Ã ‚ ©U‚ ⁄UÊÖÿ ◊¥ ∞ø •Ê߸ flË ∑§Ë
√ÿʬ∑§ÃÊ ∑§Ê •ŸÈ◊ÊŸ ‹ªÊÿÊ ¡Ê ‚∑§ÃÊ „ÒU–
Á∑§ãÃÈ ÿ„U ß‚ ’Êà ¬⁄U ÷Ë ¬˝∑§Ê‡Ê «UÊ‹ÃÊ „ÒU
Á∑§ ∞ø •Ê߸ flË ⁄UÊªË ∑§Ê ⁄UÊÖÿ ∑§ ‚◊Ê¡ Ÿ
Á∑§‚ „UŒ Ã∑§ SflË∑§Ê⁄U Á∑§ÿÊ •ÊÒ⁄U ©U‚∑§
∞ø •Ê߸ flË ¬ÊÚÁ$¡Á≈Ufl „UÊŸ ∑§Ë ’Êà »Ò§‹Ÿ
∑§Ê ©U‚ Á∑§ÃŸÊ ÷ÿ „ÒU–
∑§fl‹ ∞ø •Ê߸U flË ¬ÊÚÁ ÊÁ≈Ufl √ÿÁÄà ∑§Ù
¡ÊŸŸÊ, ∞‚ ∑§Ù߸U √ÿÁÄà ∑§Ù ¡ÊŸŸÊ Á¡‚∑§Ë
◊ÎàÿÈ ∞«˜U‚ ª˝Á‚à „UÙŸ ‚ „ÈU߸U, ÃÙ ß‚ ’Ë◊Ê⁄UË
∑§ Áfl·ÿ ◊¥ S¬CÔU ¡ÊŸ∑§Ê⁄UË ¬˝Êåà „UÙÃË „ÒU ÃÕÊ
◊¡’ÍÃË •Á÷¬˝⁄UáÊÊ ∑§ ‚ÊÕ ß‚‚ ’øŸÊ
øÊÁ„U∞– •ª⁄U √ÿÁÄêà •ŸÈ÷fl ∞ø •Ê߸U flË
∑§ ‚ÊÕ ÁŸ◊A SÃ⁄U ∑§Ê „UÙ ÃÙ ß‚‚ ÿ„U øÈŸıÃË
Á◊‹ÃË „ÒU ß‚ Áfl‡flÊ‚ ∑§ ‚ÊÕ ß‚ ⁄UÙª ∑§Ê
©U¬øÊ⁄U ’«∏U ÁflSÃÊ⁄U ‚ „UÙ ¬Ê∞ªÊ– •ı⁄U ÿ„U
’…∏UÃ „ÈU∞ ∞ø •Ê߸U flË ∑§Ù •‚¢ÁhÇœ •Ê’ÊŒË
∑§Ë •Ù⁄U ‹ ¡Ê∞ªÊ–
29

4.2 Page 32

▲back to top


EXPOSURE TO AND BELIEFS ON HIV/AIDS ISSUES
∞ø •Ê߸U flË/∞«˜U‚ ‚¢’¢Áœ ◊ÈŒ˜ŒÙ¥ ¬⁄U ¡ÊŸ∑§Ê⁄UË •ı⁄U Áfl‡flÊ‚
In all countries, stigma and
discrimination against HIV-positive
people provides increased likelihood
that the disease will spread. Fear of
isolation from village and society,
fear of the loss of one’s livelihood,
or, in the case of a child, fear of
being dismissed from school will
make one reluctant to be tested for
HIV and receive treatment should
one be HIV-positive. Education
about the true nature of HIV and
how it spreads is stigma’s most
effective enemy. HIV stigma was
found to be greater in rural areas,
perhaps the result of the difficulty of
reaching a far-flung rural population.
But the fact that the majority of
Indians say that a HIV-positive
person should be allowed to stay
in the village area does indicate
progress against stigma has
been made.
The majority of people in India still
believe that HIV-positive people
should be treated in a separate
facility, apart from other patients.
This indicates that the battle
against the destructive attitudes
caused by stigma is far from over.
Widespread knowledge of HIV itself
is still relatively recent in India.
HIV education is entering its second
stage – eliminating ignorance and
misapprehensions about it.
30
Percent of Respondents, Ages 15-49, Saying That HIV/AIDS Patients Should Be Allowed
to Stay in the Village Area, Urban and Rural, Selected States and India, 2006
÷Ê⁄Uà •ı⁄U øÈÁŸ¢ŒÊ ⁄UÊÖÿÙ¥ ◊¥ vz-y~ fl·¸ •ÊÿÈ flª¸ ∑§ ¬˝àÿÊÕ˸ÿÙ¥ ∑§Ê ¬˝ÁÇÊà ¡Ù ∑§„UÃ „Ò¥U Á∑§
∞ø •Ê߸U flË/∞«˜U‚ ∑§ ⁄UÙÁªÿÙ¥ ∑§Ù ªÊ¢fl ∑§ ˇÊòÊ ◊¥ ⁄U„UŸ ∑§Ë •ŸÈ◊Áà „UÙŸË øÊÁ„U∞, wÆÆ{
INDIA
÷Ê⁄UÃ
Andhra Pradesh
•Ê¢œ˝ ¬˝Œ‡Ê
Maharashtra
◊„UÊ⁄UÊc≈˛U
Gujarat*
ªÈ¡⁄UÊÃ*
Uttar Pradesh
©UûÊ⁄U ¬˝Œ‡Ê
N.E. States**
©UûÊ⁄U ¬Ífl˸ ⁄UÊÖÿ**
Jharkhand
¤ÊÊ⁄Uπá«U
Bihar
Á’„UÊ⁄
Tamil Nadu
ÃÁ◊‹ ŸÊ«È
BSS-2006 (Final Report)
’Ë∞‚∞‚-wÆÆ{ (»§Êߟ‹ Á⁄U¬Ù≈¸U)
68
52
80
73
76
56
73
55
69
54
62
53
60
Urban
41
‡Ê„U⁄UË
51
Rural
ª˝Ê◊ËáÊ
27
49
48
* including D & N Haveli / «UË ∞á«U ∞Ÿ „Ufl‹Ë ‚Á„UÃ
** excluding Assam and Manipur / •Ê‚Ê◊ •ı⁄U ◊áÊˬÈ⁄U ⁄UÁ„UÃ
Percent of Respondents, Ages 15-49, Saying That HIV/AIDS Patients Should Have
Separate Care Centre, Urban and Rural, Selected States and India, 2006
÷Ê⁄Uà •ı⁄U øÈÁŸ¢ŒÊ ⁄UÊÖÿÙ¥ ◊¥ vz-y~ fl·¸ •ÊÿÈ flª¸ ∑§ ¬˝àÿÊÕ˸ÿÙ¥ ∑§Ê ¬˝ÁÇÊà ¡Ù ∑§„UÃ „Ò¥U Á∑§ ∞ø •Ê߸U
flË/∞«˜U‚ ∑§ ⁄UÙÁªÿÙ¥ ∑§Ù Á‹∞ •‹ª ‚ Œπ÷Ê‹ ∑§ãº˝ „UÙŸÊ øÊÁ„U∞, ‡Ê„U⁄UË •ı⁄U ª˝Ê◊ËáÊ, wÆÆ{
INDIA
÷Ê⁄UÃ
Maharashtra
◊„UÊ⁄UÊc≈˛U
Uttar Pradesh
©UûÊ⁄U ¬˝Œ‡Ê
Tamil Nadu
ÃÁ◊‹ ŸÊ«È
Gujarat*
ªÈ¡⁄UÊÃ*
N.E. States**
©UûÊ⁄U ¬Ífl˸ ⁄UÊÖÿ**
Jharkhand
¤ÊÊ⁄Uπá«U
Andhra Pradesh
•Ê¢œ˝ ¬˝Œ‡Ê
Bihar
Á’„UÊ⁄
BSS-2006 (Final Report)
’Ë∞‚∞‚-wÆÆ{ (»§Êߟ‹ Á⁄U¬Ù≈¸U)
69
61
81
85
74
65
72
68
70
62
64
64
62
53
Urban
‡Ê„U⁄UË
Rural
ª˝Ê◊ËáÊ
62
68
53
38
* including D & N Haveli / «UË ∞á«U ∞Ÿ „Ufl‹Ë ‚Á„UÃ
** excluding Assam and Manipur / •Ê‚Ê◊ •ı⁄U ◊áÊˬÈ⁄U ⁄UÁ„UÃ
‚÷Ë Œ‡ÊÊ¥ ◊¥ ∞ø •Ê߸ flË ¬ÊÚÁ$¡Á≈fl ‹ÊªÊ¥ ∑§
ÁflM§h ÷ÿ •ÊÒ⁄U ÁŸáʸÿ ‚ ÿ„U •Ê‚Ê⁄U Ÿ$¡⁄U
•ÊÃ „Ò¥U Á∑§ ⁄UÊª »Ò§‹ªÊ, ªÊ¢fl •ÊÒ⁄U ‚◊Ê¡ ‚
’Œπ‹ „UÊŸ ∑§Ê «U⁄U. ¡ËflŸ πÊ ŒŸ ∑§Ê «U⁄U
ÿÊ ’ëø ∑§ ∑§‚ ◊¥ S∑ͧ‹ ‚ ÁŸ∑§Ê‹ ÁŒ∞
¡ÊŸ ∑§Ê «U⁄U ©U‚ ∞ø •Ê߸ flË ∑§Ë ¡Ê¢ø
∑§⁄UflÊŸ •ÊÒ⁄U Á»§⁄U ©U‚∑§Ê ©U¬øÊ⁄U ∑§⁄UflÊŸ ‚
⁄UÊ∑§ÃÊ „ÒU– ∞ø •Ê߸ flË ⁄UÙª ∑§Ë flÊSÃÁfl∑§
¡ÊŸ∑§Ê⁄UË •ÊÒ⁄U ÿ„U ∑Ò§‚ »Ò§‹ÃÊ „ÒU ß‚ ’ÊÃ
∑§Ê ÷ÿ ∞∑§ ’„ÈUà ’«∏UÊ ¬˝÷ÊflË ŒÈ‡◊Ÿ „ÒU–
∞ø •Ê߸ flË ∑§Ê ÷ÿ ª˝Ê◊ËáÊ ˇÊòÊÊ¥ ◊¥ •ÁäÊ∑§
„ÒU– ‡ÊÊÿŒ ÿ„U ’Êà ŒÍ⁄U ŒÍ⁄U Ã∑§ »Ò§‹Ë „ÈU߸
ª˝Ê◊ËáÊ ¡ŸÃÊ Ã∑§ ¬„È¢UøŸ ◊¥ ∑§Á∆UŸÊ߸ ∑§
∑§Ê⁄UáÊ ‚ „ÒU– ¬⁄UãÃÈ Ãâÿ ÿ„U „ÒU Á∑§
•Áœ∑§Ã⁄ ÷Ê⁄UÃËÿ ‹Êª ÿ„U ∑§„UÃ „Ò¥U Á∑§
∞ø •Ê߸ flË ¬ÊÚÁ$¡Á≈Ufl √ÿÁQ§ ∑§Ê ªÊ¢fl ◊¥
⁄U„UŸ ∑§Ë •ŸÈ◊Áà Á◊‹ŸË øÊÁ„U∞– ÿ„U ß‚
•Ê⁄U ‚¢∑§Ã ∑§⁄UÃÊ „ÒU Á∑§ ∞ø •Ê߸ flË ∑§ ÷ÿ
∑§ ÁflM§h ¬˝ªÁà „ÈU߸ „ÒU–
÷Ê⁄Uà ∑§ ’„ÈU◊à ∑§Ê •÷Ë ÷Ë ÿ„U Áfl‡flÊ‚
„ÒU Á∑§ ∞ø •Ê߸ flË ¬ÊÚÁ$¡Á≈Ufl ‹ÊªÊ¥ ∑§Ê
©U¬øÊ⁄U ∑§ Á‹∞ •‹ª ‚ √ÿflSÕÊ „UÊŸË
øÊÁ„U∞, •ãÿ ⁄UÊÁªÿÊ¥ ‚ •‹ª– ÿ„U ß‚ ’ÊÃ
∑§Ë •Ê⁄U ‚¢∑§Ã ∑§⁄UÃÊ „ÒU Á∑§ ß‚∑§ ÷ÿ ‚
¬ÒŒÊ ÁflŸÊ‡Ê∑§Ê⁄UË ¬Á⁄UáÊÊ◊ ∑§ ÁflM§h ¡¢ª
‚◊Ê# „UÊŸ ◊¥ •÷Ë ‚◊ÿ ‹ªªÊ– ÷Ê⁄Uà ◊¥
∞ø •Ê߸ flË ∑§Ë ¡ÊŸ∑§Ê⁄UË •¬Ÿ •Ê¬ ◊¥
•÷Ë ∑ȧ¿U ‚◊ÿ „UË ¬È⁄UÊŸË „ÒU– Ÿ$¡⁄U•¢ŒÊ$¡
∑§ ÷Êfl ∑§Ê •ÊÒ⁄U ©U‚∑§ ’Ê⁄U ◊¥ ª‹Ã
œÊ⁄UáÊÊ•Ê¥ ∑§Ê ‚◊Ê# ∑§⁄UÃ „ÈU∞ ∞ø •Ê߸ flË
∑§Ë ¡ÊŸ∑§Ê⁄UË •’ ŒÍ‚⁄U ŒÊÒ⁄U ◊¥ ¬˝fl‡Ê ∑§⁄U
⁄U„UË „ÒU–

4.3 Page 33

▲back to top


EXPOSURE TO AND BELIEFS ON HIV/AIDS ISSUES
∞ø •Ê߸U flË/∞«˜U‚ ‚¢’¢Áœ ◊ÈŒ˜ŒÙ¥ ¬⁄U ¡ÊŸ∑§Ê⁄UË •ı⁄U Áfl‡flÊ‚
Interpersonal communication
and counseling is an essential
element of the anti-HIV
campaign. Awareness of HIV is
an important first step, but only
face-to-face communication
can assure full understanding
of the nature of HIV. Complete
knowledge of HIV’s transmission
routes, the value of the condom
in prevention and the fact that
treatment is available will not
only stem the tide of HIV
infection but greatly assist in
eliminating stigma against its
victims. BSS data indicate that
there has been gradual
improvement in this important
part of the HIV programme
from 2001 to 2006.
Percent of Respondents, Ages 15-49, Who Received Interpersonal Communication on
STD/HIV/AIDs in the Past Year, Selected States, 2006, and India, 2001 and 2006
÷Ê⁄Uà •ı⁄U øÈÁŸ¢ŒÊ ⁄UÊÖÿÙ¥ ◊¥ vz-y~ fl·¸ •ÊÿÈ flª¸ ∑§ ¬˝àÿÊÕ˸ÿÙ¥ ∑§Ê ¬˝ÁÇÊÃ, Á¡ã„UÙ¥Ÿ ∑§„UÊ
Á∑§ Á¬¿U‹ fl·¸ ∞‚ ≈UË «UË/∞ø •Ê߸U flË/∞«U‚˜ ‚ ¡È«∏UË ’ÊÃøËà ◊¥ ÷ʪ Á‹ÿÊ, wÆÆv-wÆÆ{
INDIA 2001
÷Ê⁄Uà wÆÆv
INDIA 2006
÷Ê⁄Uà wÆÆ{
14
21
Karnataka
∑§ŸÊ¸≈U∑§
Andhra Pradesh
•Ê¢œ˝ ¬˝Œ‡Ê
West Bengal*
¬Á‡ø◊Ë ’¢ªÊ‹*
Uttar Pradesh
©UûÊ⁄U ¬˝Œ‡Ê
Rajasthan
⁄UÊÖÿSÕÊŸ
Maharashtra
◊„UÊ⁄UÊc≈˛U
Bihar
Á’„UÊ⁄
12
Assam
•‚◊
12
Madhya Pradesh
◊äÿ ¬˝Œ‡Ê
6
BSS-2006 (Final Report)
’Ë∞‚∞‚-wÆÆ{ (»§Êߟ‹ Á⁄U¬Ù≈¸U)
42
34
31
22
22
21
* including A & N Islands / ∞ ∞á«U ∞Ÿ mˬ ‚◊Í„U ‚Á„UÃ
∞∑§-ŒÍ‚⁄U ∑§ ‚ÊÕ ’ÊÃøËà •ı⁄U ‚‹Ê„U
∞ø •Ê߸U flË ∑§ ÁflL§h •Á÷ÿÊŸ ∑§Ê ∞∑§
◊„Uàfl¬Íáʸ •¢ª „ÒU– ß‚∑§ Á‹∞ ¡ÊªL§∑§ÃÊ
¬„U‹Ê ∑§Œ◊ „ÒU, ‹Á∑§Ÿ •Ê◊Ÿ-‚Ê◊Ÿ „ÈU߸U
’ÊÃøËà ∑§ ÊÁ⁄U∞ „UË ∞ø •Ê߸U flË ∑§Ù
•ë¿UË Ã⁄U„U ‚ ‚◊¤ÊÊ ¡Ê ‚∑§ÃÊ „ÒU–
∞ø •Ê߸U flË ∑§ ’Ê⁄U ◊¥ ¬Í⁄UË ¡ÊŸ∑§Ê⁄UË
„UÙŸÊ ∑§á«UÙ◊ ∑§ mÊ⁄UÊ ß‚ ⁄UÙª ∑§
⁄UÙ∑§ÕÊ◊ ∑§ ◊„Uàfl ∑§Ù ‚◊¤ÊÊÃÊ „ÒU •ı⁄U
Percent of Respondents, Ages 15-49, Who Received Interpersonal Communication about
Condom Use in the Past Year, Selected States, 2006, and India, 2001 and 2006
÷Ê⁄Uà •ı⁄U øÈÁŸ¢ŒÊ ⁄UÊÖÿÙ¥ ◊¥ vz-y~ fl·¸ •ÊÿÈ flª¸ ∑§ ¬˝àÿÊÕ˸ÿÙ¥ ∑§Ê ¬˝ÁÇÊÃ, Á¡ã„UÙ¥Ÿ ∑§„UÊ
Á∑§ Á¬¿U‹ fl·¸ ∑§á«UÙ◊ ∑§ ¬˝ÿÙª ‚ ¡È«∏UË ’ÊÃøËà ◊¥ ÷ʪ Á‹ÿÊ, wÆÆv-wÆÆ{
ÿ„U ÷Ë ’ÃÊÃÊ „ÒU Á∑§ ß‚∑§ Á‹∞ ©U¬‹éœ
©U¬øÊ⁄U Ÿ ∑§fl‹ ⁄UÙª ∑§ ÷ÿ ∑§Ù ∑§◊
∑§⁄ÃÊ „ÒU ’ÁÀ∑§ ß‚‚ ¡È«∏U ‚Ê◊ÊÁ¡∑§
INDIA 2001
÷Ê⁄Uà wÆÆv
INDIA 2006
÷Ê⁄Uà wÆÆ{
Karnataka
∑§ŸÊ¸≈U∑§
Andhra Pradesh
•Ê¢œ˝ ¬˝Œ‡Ê
West Bengal*
¬Á‡ø◊Ë ’¢ªÊ‹*
Uttar Pradesh
©UûÊ⁄U ¬˝Œ‡Ê
Rajasthan
⁄UÊÖÿSÕÊŸ
Maharashtra
◊„UÊ⁄UÊc≈˛U
Bihar
Á’„UÊ⁄
Assam
•‚◊
Madhya Pradesh
◊äÿ ¬˝Œ‡Ê
BSS-2006 (Final Report)
’Ë∞‚∞‚-wÆÆ{ (»§Êߟ‹ Á⁄U¬Ù≈¸U)
10
11
12
7
∑§‹¢∑§ ∑§Ù ÷Ë ŒÍ⁄U ∑§⁄UŸ ◊¥ ◊ŒŒ ∑§⁄UÃÊ
19
„ÒU– ’Ë ∞‚ ∞‚ ∑§ •Ê¢∑§«U ‚¢∑§Ã ∑§⁄UÃ „ÒU
Á∑§ wÆÆv ‚ wÆÆ{ Ã∑§ ∞ø •Ê߸U flË
34
∑§Êÿ¸∑˝§◊ ◊¥ œË⁄U-œË⁄U ‚ÈœÊ⁄U „ÈU•Ê „ÒU–
28
30
19
20
21
* including A & N Islands / ∞ ∞á«U ∞Ÿ mˬ ‚◊Í„U ‚Á„UÃ
31

4.4 Page 34

▲back to top


INDIA RESPONDS TO HIV/AIDS
Shortly after the first HIV/AIDS cases
were reported in India, in 1986, the
government took its first steps to
confront the possibility of an epidemic.
It had long been observed that
failure to do this would result in a
fast-spreading epidemic. This had
occurred in Africa and was occurring
in other parts of Asia. A National AIDS
Committee was constituted in 1986
with the Union Ministry of Health and
Family Welfare the nodal agency.
Initial activities included raising
public awareness of the threat of
HIV infection, ensuring a blood supply
free from HIV and testing people for
HIV infection in areas of the country
where HIV was suspected to be more
prevalent.
Beginning in 1992, India established
the National AIDS Control Programme
which will begin its third phase (NACP-3)
in 2007. These programmes feature a
broad scope of activities and, with
NACP-3, increased emphasis will be
placed on bringing HIV education,
prevention and treatment to the district
level. Also in 1992, a State AIDS cell
was established in Tamil Nadu to
improve programme effectiveness at the
state level. Today, there are 35 State
and 3 AIDS Control Societies in cities
throughout India which are able to
operate efficiently and allocate funds
quickly.
32
∞ø •Ê߸U flË/∞«˜U‚ ∑§ ¬˝Áà ÷Ê⁄Uà ∑§Ê ¡flÊ’
v~}{ ◊¥ Œ‡Ê ∑§ •ãŒ⁄U ¬„U‹ ∞ø •Ê߸ flË/∞«˜U‚ ∑§Ê
◊Ê◊‹Ê ¬ÃÊ ø‹Ÿ ∑§ ∑ȧ¿U ‚◊ÿ ’ÊŒ, ‚⁄U∑§Ê⁄U Ÿ
ß‚∑§ ◊„UÊ◊Ê⁄UË Ÿ ’ŸŸ ∑§Ë ÁŒ‡ÊÊ ◊¥ ¬„U‹Ê ∑§Œ◊
©U∆UÊÿÊ– ’„ÈUà ‹ê’ ‚◊ÿ ‚ ÿ„U ŒπÊ ªÿÊ „ÒU Á∑§
ÿÁŒ ⁄UÊ∑§ÕÊ◊ ∑§⁄UŸ ∑§ ÿ ∑§Œ◊ ‚»§‹ Ÿ „ÈU∞ ÃÊ
ÿ„U ⁄UÊª Ã¡Ë ‚ ∞∑§ ◊„UÊ◊Ê⁄UË ∑§ M§¬ ◊¥ »Ò§‹ªÊ–
•»˝§Ë∑§Ê ◊¥ ∞‚Ê „UÊ øÈ∑§Ê „ÒU •ÊÒ⁄U ∞Á‡ÊÿÊ ∑§ •ãÿ
÷ʪÊ¥ ◊¥ „UÊ ⁄U„UÊ „ÒU– v~}{ ◊¥ ⁄UÊCÔ˛UËÿ ∞«˜U‚ ‚Á◊ÁÃ
∑§Ê ª∆UŸ Á∑§ÿÊ ªÿÊ, ÿ„U ‚Á◊Áà ∑§ãº˝Ëÿ SflÊSâÿ
∞fl¢ ¬Á⁄UflÊ⁄U ∑§ÀÿÊáÊ ◊ãòÊÊ‹ÿ ∑§ ‚ÊÕ ’ŸÊ߸ ªß¸,
◊ãòÊÊ‹ÿ ∑§Ë ÷ÍÁ◊∑§Ê ŸÊ«U‹ ∞¡ã‚Ë ∑§Ë ÕË–
‡ÊÈM§•ÊÃË ªÁÃÁflÁœÿÊ¥ ◊¥ •Ê◊ ¡ŸÃÊ ∑§Ê
∞ø •Ê߸ flË ‚¢∑˝§◊áÊ ∑§ πÃ⁄UÊ¥ ∑§ ¬˝Áà ¡ÊªM§∑§
Á∑§ÿÊ ªÿÊ, ∞ø •Ê߸ flË ‚¢∑˝§◊áÊ ◊ÈÄà ⁄UÄÌʟ
∑§Ê ‚ÈÁŸÁ‡øà Á∑§ÿÊ ªÿÊ •ÊÒ⁄U Œ‡Ê ∑§ Á¡Ÿ ˇÊòÊÊ¥ ◊¥
∞ø •Ê߸ flË •Áœ∑§ ¬Ò⁄U ¬‚Ê⁄U øÈ∑§Ê ÕÊ fl„UÊ° ‹ÊªÊ¥
◊¥ ß‚∑§Ë ¡Ê¢ø ∑§Ë ªß¸–
v~~w ◊¥ ‡ÊÈM§•Êà ∑§⁄UÃ „ÈU∞ ÷Ê⁄Uà Ÿ ⁄UÊCÔ˛UËÿ ∞«˜U‚
ÁŸÿãòÊáÊ ∑§Êÿ¸∑˝§◊ ∑§Ë SÕʬŸÊ ∑§Ë Á¡‚∑§Ê ÃË‚⁄UÊ
ø⁄UáÊ (∞Ÿ ∞ ‚Ë ¬UË-x) wÆÆ| ◊¥ ‡ÊÈM§ „ÈU•Ê– ߟ
∑§Êÿ¸∑˝§◊Ê¥ ◊¥ ÁflSÃÎà M§¬ ‚ ÿ„U ªÁÃÁflÁœÿÊ¢ ‡ÊÊÁ◊‹
ÕË¥ •ÊÒ⁄U ∞Ÿ ∞ ‚Ë ¬UË-x ∑§ ‚ÊÕ ∞ø •Ê߸ flË, ∑§
Á‹∞ Á‡ÊÁˇÊà ’ŸÊŸ ∑§ Á‹∞ Œ’Êfl ’…∏UªÊ, Á$¡‹Ê SÃ⁄U
¬⁄U ⁄UÊ∑§ÕÊ◊ •ÊÒ⁄U ©U¬øÊ⁄U ¬⁄U Œ’Êfl ’…∏UªÊ– ⁄UÊÖÿ
SÃ⁄U ¬⁄U ∑§Êÿ¸∑˝§◊ ∑§Ë ¬˝÷Êfl‡ÊË‹ÃÊ ∑§Ê ‚ÈœÊ⁄UŸ ∑§
Á‹∞ v~~w ◊¥ ⁄UÊÖÿ SÃ⁄UËÿ ∞«˜U‚ ‚Ò‹ ∑§Ê ª∆UŸ ÷Ë
Á∑§ÿÊ ªÿÊ– ¬Í⁄U Œ‡Ê ÷⁄U ◊¥ xz ⁄UÊÖÿ ∞«˜U‚ ÁŸÿãòÊáÊ
‚Ê‚Ê߸Á≈ÿÊ¢ •ÊÒ⁄U x ‚Ê‚ÊßÁ≈UÿÊ° ◊„UÊŸª⁄UÊ¥ ◊¥ „Ò¥U ¡Ê
•‚⁄UŒÊ⁄U Ã⁄UË∑§ ‚ ∑§Ê◊ ∑§⁄U ⁄U„UË „Ò¥U •ÊÒ⁄U ’„ÈUà Ã$¡Ë
‚ •ÊÁÕ¸∑§ ‚„UÊÿÃÊ ©U¬‹éœ ∑§⁄UÊÃË „ÒU–

4.5 Page 35

▲back to top


INDIA RESPONDS TO HIV/AIDS
The National AIDS Control
Organisation (NACO) in Delhi is
the nodal agency coordinating the
national HIV strategy. Its many
functions include:
• Public HIV Education
• National Media Campaigns
• Condom Promotion
• Blood Safety
• Sentinel Site Testing Programme
• HIV/AIDS/STD Prevention and
Control
• Care and Support for People
Living with HIV/AIDS
• Targeted Interventions among
High-risk Groups
• National Family Health Awareness
Campaign
• Prevention of Mother to Child
Transmission
• Voluntary, Confidential,
Counseling & Testing
• National Behavioural Surveillance
Surveys
• Programme Financing
• Financing of and Coordination
with SACS
• Monitoring and Evaluation
• Research and Development
Further information is available on
NACO’s website:
http://www.nacoonline.org
∞ø •Ê߸U flË/∞«˜U‚ ∑§ ¬˝Áà ÷Ê⁄Uà ∑§Ê ¡flÊ’
ÁŒÀ‹Ë ◊¥ ⁄UÊc≈˛UËÿ ∞«˜U‚ ÁŸÿãòÊáÊ ‚¢ª∆UŸ
(ŸÊ∑§Ù) ∞∑§ ŸÙ«U‹ ∞¡¥‚Ë „ÒU ¡Ù Á∑§ ⁄UÊc≈˛UËÿ
∞ø •Ê߸ flË ∑§ ‚ÊÕ ⁄UáÊŸËÁà ◊¥ ÷ʪˌÊ⁄U „ÒU–
ß‚∑§Ë ’„ÈUà ‚Ë ªÁÃÁflÁœÿÙ¥ ◊¥ ∑ȧ¿U ß‚
¬˝∑§Ê⁄U „Ò¥U—
¡ŸÃÊ ∑§Ù ∞ø •Ê߸ flË ∑§Ë Á‡ÊˇÊÊ
⁄UÊc≈˛UËÿ ◊ËÁ«UÿÊ •Á÷ÿÊŸ
∑§á«UÙ◊ ∑§Ê ¬˝øÊ⁄U
⁄UÄà ‚È⁄UˇÊÊ
⁄UˇÊÊ ∑§ãº˝ ¬⁄U ¡Ê¢ø ∑§Êÿ¸∑˝§◊
∞ø •Ê߸ flË/∞«˜U‚/∞‚ ≈UË «UË ‚ ’øÊfl •ı⁄U
ÁŸÿ¢òÊáÊ
∞ø •Ê߸U flË/∞«˜U‚ ‚ ª˝Á‚à √ÿÁÄÃÿÙ¥ ∑§Ë
Œπ÷Ê‹ •ı⁄U ‚„UÿÙª
©UìÊ ¡ÙÁπ◊¬Íáʸ ‚◊Í„UÙ¥ ◊¥ ‹ˇÿ¬Íáʸ √ÿflœÊŸ
⁄UÊc≈˛UËÿ ¬Á⁄UflÊ⁄U SflÊSâÿ ¡ÊªM§∑§ÃÊ •Á÷ÿÊŸ
◊Ê¢ ‚ Á‡Ê‡ÊÈ ◊¥ ‚¢øÊ⁄UáÊ ∑§Ê ’øÊfl
SflÒÁë¿U∑§ ªÙ¬ŸËÿ ¬⁄UÊ◊‡Ê¸ ∞fl¢ ¬Á⁄UˇÊáÊ ∑§ãº˝
⁄UÊc≈˛UËÿ √ÿfl„UÊ⁄U ÁŸÁ⁄UˇÊáÊ ‚fl¸
∑§Êÿ¸∑˝§◊ ∑§Ë ÁflûÊËÿ ‚„UÊÿÃÊ
⁄UÊÖÿ ∞«˜U‚ ÁŸÿ¢òÊáÊ ‚¢ª∆UŸ ∑§ ‚ÊÕ ‚„UÿÙª
•ı⁄U ÁflûÊËÿ ‚„UÊÿÃÊ
•Ê∑¢§‹Ÿ •ı⁄U ◊ÍÀÿÊ¢∑§Ÿ
•ŸÈ‚¢œÊŸ •ı⁄U Áfl∑§Ê‚
•ÊªÊ◊Ë ¡ÊŸ∑§Ê⁄UË ŸÊ∑§Ù ∑§Ë flÒ’‚Êß≈U ¬⁄U
©U¬‹éœ „ÒU—
http://www.nacoonline.org
33

4.6 Page 36

▲back to top


INDIA RESPONDS TO HIV/AIDS
Under India’s Tenth Five-Year Plan,
HIV/AIDS targets were set as
follows:
• 80 percent coverage of high risk
groups through targeted
interventions
• 90 percent coverage of schools
and colleges through education
programmes
• 80 percent awareness among the
general population in rural areas
• Reducing transmission through
blood transfusion to less than one
percent
• Establishing at least one voluntary
testing and counseling centre in
every district
• Expansion of prevention of
mother-to-child transmission to the
district level
• Achieving zero level increase of
HIV/AIDS by 2007
NACP-2 had two main strategies:
first, cost-effective interventions among
commercial sex workers, injecting drug
users, migrant workers, men having
sex with men and STI/STD clinic
attendees, along with interventions for
the general community and low cost
AIDS care. And, second, strengthening
institutions, such as the SACS and
intersectoral collaboration with NGOs
and experts in the field were also
priorities.
34
∞ø •Ê߸U flË/∞«˜U‚ ∑§ ¬˝Áà ÷Ê⁄Uà ∑§Ê ¡flÊ’
÷Ê⁄Uà ∑§Ë Œ‚flË¥ ¬¢ø-fl·Ë¸ÿ ÿÙ¡ŸÊ ∑§ •¢Ãª¸Ã,
∞ø •Ê߸ flË/∞«˜U‚ ∑§ ÁŸêŸÊŸÈ‚Ê⁄U ‹ˇÿ Ãÿ Á∑§∞
ª∞ ÕU—
‹ˇÿ¬Íáʸ √ÿflœÊŸÙ¥ ∑§ ÊÁ⁄U∞ ©UìÊ ¡ÙÁπ◊¬Íáʸ
‚◊Í„UÙ¥ ∑§Ê }Æ ¬˝ÁÇÊà ∑§fl⁄U¡ ∑§⁄UŸÊ–
‡ÊÒˇÊÁáÊ∑§ ∑§Êÿ¸∑˝§◊Ù¥ ∑§ mÊ⁄UÊ S∑ͧ‹Ù¥ fl ∑§ÊÚ‹¡Ù¥
∑§Ê ~Æ ¬˝ÁÇÊà ∑§fl⁄U¡ ∑§⁄UŸÊ–
ª˝Ê◊ËáÊ ˇÊòÊÙ¥ ∑§Ë ‚ÊœÊ⁄UáÊ •Ê’ÊŒË ◊¥ }Æ
¬˝ÁÇÊà ¡ÊªM§∑§ÃÊ ‹ÊŸÊ
⁄UÄà ‚¢øÊ⁄UáÊ ∑§ mÊ⁄UÊ ‚¢øÊ⁄UáÊ ∑§Ù ∞∑§ ¬˝ÁÇÊÃ
‚ ∑§◊ ∑§⁄UŸÊ
¬˝àÿ∑§ Á Ê‹ ◊¥ ∑§◊ ‚ ∑§◊ ∞∑§ Sflÿ¢‚flË
¡Ê¢ø ∑§ãº˝ •ı⁄U ‚‹Ê„U ∑§ãº˝ ∑§Ë SÕʬŸÊ
∑§⁄UŸÊ
◊Ê¢ ‚ Á‡Ê‡ÊÈ ◊¥ ‚¢øÊ⁄UáÊ ∑§Ë ⁄UÙ∑§ÕÊ◊ ∑§Ù Á¡‹Ê
SÃ⁄U Ã∑§ ’…∏UÊŸÊ
‚Ÿ˜ wÆÆ| Ã∑§ ∞ø •Ê߸ flË/∞«˜U‚ ∑§Ë ’…∏UÃ
∑§Ù ‡ÊÍãÿ SÃ⁄U Ã∑§ ¬„È¢UøÊŸÊ
∞Ÿ ∞ ‚Ë ¬Ë-w ∑§Ë ŒÙ ◊ÈÅÿ ⁄UáÊŸËÁÃÿÊ¢ ÕË¢—
¬„U‹Ë, √ÿfl‚ÊÁÿ∑§ ÿıŸ ∑§Êÿ¸∑§Ãʸ, ‚Í߸U mÊ⁄UÊ Ÿ‡ÊÊ
∑§⁄UŸ flÊ‹ ¬˝flÊÁ‚ÿÙ¥ ◊¥, ¬ÈL§· ∑§Ê ¬ÈL§· ∑§ ‚ÊÕ
ÿıŸ ‚¢’¢œ flÊ‹Ù¥ ◊¥ •ı⁄U ∞‚ ≈UË «UË ÁøÁ∑§à‚Ê
∑§ãº˝Ù¥ ¬⁄U ¡ÊŸ flÊ‹Ù¥ ◊¥ ©UÁøÃ-◊ÍÀÿ ∑§ √ÿflœÊŸ
ß‚∑§ ‚ÊÕ-‚ÊÕ ‚ÊœÊ⁄UáÊ ‚◊Ê¡ ∑§ Á‹∞
√ÿflœÊŸ •ı⁄U ∞«˜U‚ ∑§Ë ∑§◊ ‹ÊªÃ flÊ‹Ë
Œπ÷Ê‹ •ı⁄U ŒÍ‚⁄UÊ, ‚¢SÕÊ•Ù¥ ∑§Ù ‡ÊÁÄÇÊÊ‹Ë
’ŸÊŸÊ ¡Ò‚ ⁄UÊÖÿ ∞«˜U‚ ÁŸÿ¢òÊáÊ ‚Ù‚Êß≈UË Ê fl
ªÒ⁄U-‚⁄U∑§Ê⁄UË ‚¢SÕÊ•Ù¥ ∑§ ‚ÊÕ •ãøˇÊòÊËÿ
‚„U∑§Êÿ¸ÃÊ •ı⁄U ÁŸ¬ÈáÊÃÊ ÷Ë ß‚ ˇÊòÊ ∑§Ë
¬˝ÊÕÁ◊∑§ÃÊ∞¢ ÕË¥–

4.7 Page 37

▲back to top


INDIA RESPONDS TO HIV/AIDS
In order to achieve the national
goals, NACO works with the
national media and elected
representatives and assists states in
developing informational activities
appropriate for their local audiences.
To ensure a safe blood supply, over
2,200 blood banks were established
by 2006. The External Quality
Assessment Scheme (EQAS) was
established in 1999 to ensure
uniform standards of blood testing
and to continue qualitative
improvement. The National Institute
of Biologicals (NIB) in Noida, Uttar
Pradesh is the Apex Laboratory for
the EQAS programme. With a goal
of providing Voluntary Counseling
and Testing Centres (VCTCs) in
every district, model VCTCs have
been set up in Chennai, Imphal
and Mumbai to demonstrate best
practices in HIV testing and
psychological support and to
standardize procedures. In addition,
pregnant women receive antenatal
care and HIV testing at Integrated
Counseling and Testing Centres
(ICTCs). In 2006, the number
of women tested rose to over
1.5 million. A key component of
NACP-3 will be the involvement of
tribal communities. A Social
Assessment has been carried out
and a Tribal Action Plan (TAP)
prepared by NACO.
∞ø •Ê߸U flË/∞«˜U‚ ∑§ ¬˝Áà ÷Ê⁄Uà ∑§Ê ¡flÊ’
⁄UÊc≈˛UËÿ ‹ˇÿ Ã∑§ ¬„È¢UøŸ ∑§ Á‹∞, ŸÊ∑§Ù ⁄UÊc≈˛UËÿ
◊ËÁ«UÿÊ ∑§ ‚ÊÕ ∑§Ê◊ ∑§⁄UÃÊ „ÒU •ı⁄U ÁŸflʸÁøÃ
¬˝ÁÃÁŸÁœ ß‹Ê∑§Ù¥ ∑§ üÊÙÃÊ•Ù¥ ∑§ Á‹∞ ©UÁøÃ
¡ÊŸ∑§Ê⁄UË ÿÈÄà ªÁÃÁflÁœÿÙ¥ ∑§ Áfl∑§Ê‚ ∑§ Á‹∞
⁄UÊÖÿÙ¥ ∑§Ù ‚„UÊÿÃÊ ŒÃÊ „ÒU– ‚È⁄UÁˇÊà ⁄UÄà •Ê¬ÍÁø
∑§Ù ‚ÈÁŸÁ‡øà ∑§⁄UŸ ∑§ Á‹∞ ‚Ÿ˜ wÆÆ{ ◊¥ w,wÆÆ
‚ •Áœ∑§ é‹«U-’Ò¥∑§ SÕÊÁ¬Ã Á∑§∞ ª∞– ’ʱÿ
ªÈáÊflûÊÊ ÁŸœÊ¸⁄UáÊ ÿÙ¡ŸÊ (߸ ÄÿÍ ∞ ∞‚) •Ê⁄Uê÷
∑§Ë ªß¸– ⁄UÄà ¡Ê¢ø ∑§Ê ∞∑§‚Ê⁄U ◊ÊŸ∑§ ‚ÈÁŸÁ‡øÃ
∑§⁄UŸ ∑§ Á‹∞ •ı⁄U ªÈáÊflÃÊ Áfl∑§Ê‚ ∑§ Á‹∞
‚Ÿ˜ v~~~ ◊¥ ’ʱÿ ªÈáÊflûÊÊ ÁŸœÊ¸⁄UáÊ ÿÙ¡ŸÊ
(߸ ÄÿÍ ∞ ∞‚) •Ê⁄Uê÷ ∑§Ë ªß¸– ©UûÊ⁄U ¬˝Œ‡Ê
∑§ ŸÙ∞«Ê ◊¥ Ÿ‡ÊŸ‹ ßãS≈UË≈˜UÿÍ≈U •ÊÚ»§
’ÊÿÙ‹ÊÚÁ¡∑§‹ (∞Ÿ ∞ ’Ë) ߸ ÄÿÍ ∞ ∞‚
∑§Êÿ¸∑˝§◊ ∑§ Á‹∞ ∞∑§ Á‡Êπ⁄U ¬˝ÿÙª‡ÊÊ‹Ê „ÒU–
¬˝àÿ∑§ Á Ê‹ ◊¥ SflÒÁë¿U∑§ ªÙ¬ŸËÿ ¬⁄UÊ◊‡Ê¸ fl
¬⁄UˡÊáÊ ∑§ãº˝ ©U¬‹éœ ∑§⁄UflÊŸ ∑§ ‹ˇÿ ‚
∞ø •Ê߸ flË ¡Ê¢ø ∑§Ë ’„UÃ⁄UËŸ ‚flÊ ∑§Ê ¬˝Œ‡Ê¸Ÿ
∑§⁄UŸ ∑§ Á‹∞ •ı⁄U ◊ŸÙflÒôÊÊÁŸ∑§ ‚„UÊ⁄U ∑§
Á‹∞ •ı⁄U ∑§Êÿ¸¬˝áÊÊ‹Ë ∑§Ù ◊ÊŸ∑§ M§¬ ŒŸ ∑§
Á‹∞ øÒãŸß¸, ß껧ʋ •ı⁄U ◊Èê’߸ ◊¥ ◊ÊÚ«U‹
flË ‚Ë ≈UË ‚Ë SÕÊÁ¬Ã Á∑§∞ ª∞ „Ò¥U– ß‚∑§
•ÁÃÁ⁄UÄà ßã≈U˪˝≈U«U ∑§Ê©¢U‚Á‹¢ª ∞á«U ≈UÁS≈U¢ª
‚ã≈U‚¸ (•Ê߸ ‚Ë ≈UË ‚Ë) ◊¥ ª÷¸flÃË ◊Á„U‹Ê•Ù¥
∑§Ù ¬˝‚fl¬Ífl¸ Œπ÷Ê‹ •ı⁄U ∞ø •Ê߸ flË ¡Ê¢ø
∑§Ë ‚ÈÁflœÊ ¬˝ŒÊŸ ∑§Ë ¡ÊÃË „ÒU– ‚Ÿ˜ wÆÆ{ ◊¥
¡Ê¢ø ∑§⁄UflÊŸ flÊ‹Ë ◊Á„U‹Ê•Ù¥ ∑§Ë ‚¢ÅÿÊ
vz ‹Êπ Ã∑§ ’…∏U ªß¸– ∞Ÿ ∞ ‚Ë ¬Ë-x ∑§Ê
◊ÈÅÿ ÷ʪ Á¬¿U«∏UË ¬˝¡ÊÁÃÿÙ¥ ∑§Ù ‚Áê◊Á‹Ã Á∑§ÿÊ
¡Ê∞ªÊ– ŸÊ∑§Ù mÊ⁄UÊ ∞∑§ ‚Ê◊ÊÁ¡∑§ ◊ÍÀÿÊ¢∑§Ÿ
Á∑§ÿÊ ªÿÊ •ı⁄U ∞∑§ ≈˛UÊ߸’‹ ∞ćʟ å‹ÊŸ
(≈UË ∞ ¬Ë) ÃÒÿÊ⁄U Á∑§ÿÊ ªÿÊ–
35

4.8 Page 38

▲back to top


INDIA RESPONDS TO HIV/AIDS
Anti-retroviral Treatment (ART)
A key element in the campaign
against HIV is the treatment of
HIV-positive persons. ART greatly
improves the quality of life for
HIV-positive people, extends their
life span and helps to remove the
stigma against them when it is seen
that they can live normal lives.
When ART is fully integrated into
mainstream health services, patients
are likely to seek treatment more
readily and others, who may only
suspect that they are HIV-positive,
will be more willing to come for
a test.
Yet ART is a complex treatment
process that must be continuously
maintained. The programme must
also overcome logistical difficulties,
such as delivering services to the
rural population as well as the
urban. This will be a major goal of
NACP-3. In 2007, the number of
NACO-supported ART centres
passed 100, in addition to 10 centres
involving public-private partnerships
and funding from the Global Fund
to Fight AIDS, Tuberculosis and
Malaria. This phase includes scaling
up prevention of Parent-to-Child
Transmission of HIV (PPTCT),
strengthening the over 1,800 PPTCT
centres and expanding PPTCT
services to Community Health
Centres.
36
∞ø •Ê߸U flË/∞«˜U‚ ∑§ ¬˝Áà ÷Ê⁄Uà ∑§Ê ¡flÊ’
∞ã≈UË-Á⁄U≈˛UÊÁfl⁄U‹ ©U¬øÊ⁄U (∞ •Ê⁄U ≈UË)
∞ø •Ê߸ flË ∑§ ÁflM§h •Á÷ÿÊŸ ◊¥ ∞∑§ ◊ÈÅÿ
∑§Ê⁄U∑§ ∞ø •Ê߸ flË ¬ÊÚÁ$¡Á≈Ufl ‹ÊªÊ¥ ∑§Ê ©U¬øÊ⁄U „ÒU–
∞ •Ê⁄U ≈UË, ∞ø •Ê߸ flË ¬ÊÚÁ$¡Á≈Ufl ‹ÊªÊ¥ ∑§ ¡ËflŸ
∑§Ë ªÈáÊflûÊÊ ∑§Ê •Áœ∑§ ’„UÃ⁄U ’ŸÊÃÊ „ÒU, ©UŸ∑§
¡ËflŸ∑§Ê‹ ∑§Ê ’…∏UÊÃÊ „ÒU •ÊÒ⁄U ‚◊Ê¡ ◊¥ ©UŸ ¬⁄U
‹ª ∑§‹¢∑§ ∑§Ë Œ‡ÊÊ ∑§Ê ’„UÃ⁄U ’ŸÊÃ „ÈU∞ ©Uã„¥U
‚Ê◊Êãÿ ¡ËflŸ ¡ËŸ ∑§ •fl‚⁄U ŒÃÊ „ÒU– ¡’
∞ •Ê⁄U ≈UË, ∑§Ê ◊ÈÅÿ œÊ⁄UÊ flÊ‹Ë SflSâÿ ‚flÊ•Ê¥
∑§ ‚ÊÕ ¬Í⁄UË Ã⁄U„U ‚ ∞∑§Ë∑Χà ∑§⁄U ÁŒÿÊ ªÿÊ „ÒU,
ÃÊ ⁄UÊÁªÿÊ¥ •ÊÒ⁄U •ãÿ ‹ÊªÊ¥ ∑§Ê Á¡ã„¥U ◊ÊòÊ
∞ø •Ê߸ flË „UÊŸ ∑§Ê ‚¢Œ„U „UÊÃÊ „ÒU •Áœ∑§
Ãà¬⁄UÃÊ ‚ ©U¬øÊ⁄U Á◊‹ªÊ •ÊÒ⁄U •Áœ∑§ ‚
•Áœ∑§ ‹Êª ¡Ê¢ø ∑§ Á‹∞ ‚Ê◊Ÿ •Ê∞¢ª–
„UÊ‹Ê¢Á∑§ ∞ •Ê⁄U ≈UË, ©U¬øÊ⁄U ∑§Ë ¬˝Á∑˝§ÿÊ ∑ȧ¿U
¡Á≈U‹ „ÒU, ß‚ ∞‚Ê ’ŸÊ∞ ⁄UπŸÊ „UÊªÊ– ∑§Êÿ¸∑˝§◊
∑§Ê ∑ȧ¿U ÃâÿÊà◊∑§ ‚◊SÿÊ•Ê¥ ‚ ÷Ë ©U÷⁄UÃÊ
„UÊªÊ ¡Ò‚ ª˝Ê◊ËáÊ •Ê’ÊŒË ∑§ ‚ÊÕ-‚ÊÕ ‡Ê„U⁄UË
¡Ÿ‚¢ÅÿÊ ∑§Ê ‚flÊ∞¢ ©U¬‹éœ ∑§⁄UÊŸÊ–
∞Ÿ ∞ ‚Ë ¬Ë-x ∑§Ê ÿ„U ‚’‚ ’«∏UÊ ‹ˇÿ „UÊªÊ–
wÆÆ| ◊¥ ŸÊ∑§Ê ∑§ ‚„UÿÊª ‚ ø‹Ÿ flÊ‹ ∞ •Ê⁄U
≈UË ∑§ãº˝Ê¥ ∑§Ë ‚¢ÅÿÊ vÆÆ ‚ ™§¬⁄U ¬„È¢Uø ªß¸,
ß‚∑§ •ÁÃÁ⁄UQ§ vÆ ∑§ãº˝Ê¥ ∑§Ê ‚Êfl¸¡ÁŸ∑§ ÃÕÊ
ÁŸ¡Ë ˇÊòÊÊ¥ ∑§Ë ÷ʪˌÊ⁄UË •ÊÒ⁄U ß‚ ∞«˜U‚ ìÁŒ∑§
•ÊÒ⁄U ◊‹Á⁄UÿÊ ‚ ‹«∏UŸ ∑§ Á‹∞ Áfl‡flSÃ⁄U ¬⁄U
Á◊‹Ÿ flÊ‹ •ŸÈŒÊŸ ‚ •ÊÁÕ¸∑§ ‚„UÊÿÃÊ ÷Ë ¬˝Ê#
„ÒU– ß‚ ø⁄UáÊ ◊¥ ∞ø •Ê߸ flË ∑§Ê ◊ÊÃÊ-Á¬ÃÊ ‚
’ëøÊ¥ ◊¥ ‚¢∑˝§◊áÊ »Ò§‹Ÿ ∑§Ë ⁄UÊ∑§ÕÊ◊, ◊ÊÒ¡ÍŒÊ
v}ÆÆ ¬Ë ¬Ë ≈UË ‚Ë ≈UË ∑§ãº˝Ê¥ ∑§Ê ‚‡ÊQ§ ∑§⁄UŸÊ •ÊÒ⁄U
‚Ê◊ÍŒÊÁÿ∑§ SflÊSâÿ ∑§ãº˝Ê¥ Ã∑§ ¬Ë ¬Ë ≈UË ‚Ë ≈UË
‚flÊ•Ê¥ ∑§Ê ÁflSÃÊ⁄U ∑§⁄UŸÊ ‡ÊÊÁ◊‹ „ÒU–

4.9 Page 39

▲back to top


UNAIDS ACTIVITIES IN INDIA
At the country level, UNAIDS represents the corporate and
collective action of UN Cosponsors in support of the national
response to HIV/AIDS. It also provides key support to the United
Nations Theme Group on HIV/AIDS, the joint HIV/AIDS policy
and strategy decision-making body for Cosponsors and other
UN system agencies at the country level. In India, the Theme
Group has been expanded with bilateral donor agencies,
international organisations and the Indian Network for People
Living with HIV/AIDS.
The vision of UNAIDS India is: To decrease the rate of HIV
transmission in India and improve the lives of people living with
HIV/AIDS
The mission of UNAIDS India is: Working closely with the national
programme, cosponsors, bilaterals, civil society organisations,
persons living with HIV/AIDS, media, elected representatives,
private sector and other stakeholders, UNAIDS will contribute
to and strengthen the national response to HIV/AIDS in combating
the further spread of HIV/AIDS and providing support to those
infected and affected.
The key result areas for the UNAIDS Secretariat in 2005-2006 are:
• “Three Ones” implemented
• Enhanced joint UN action to support national and sub national
AIDS responses
• Technical assistance provided to national and sub-national AIDS
responses
• India supported to leverage financial resources
• Documentation, synthesis and management of strategic
information
• Strengthened AIDS response in the context of security, uniformed
services and humanitarian crises
• Strengthened regional-level coordination to support national and
sub-national AIDS responses
• Support to national and sub-national programming scaled up
÷Ê⁄Uà ◊¥ ÿÍ ∞Ÿ ∞«˜U‚ ∑§ ∑§Êÿ¸∑˝§◊
∞ø •Ê߸ flË/∞«˜U‚ ¬⁄U ÿÍŸÊß≈U«U Ÿ‡ÊŸ‹ ÕË◊ ª˝È¬, ∞ø •Ê߸ flË/∞«˜U‚ ∑§Ë ‚¢ÿÈÄÃ
ŸËÁà •ı⁄U ‚„U¬˝ÊÿÙ¡∑§Ù¥ ∑§ Á‹∞ ⁄UáÊŸËÁà ÁŸœÊ¸⁄UáÊ ‚Á◊Áà •ı⁄U •ãÿ ÿÍ ∞Ÿ ¬˝áÊÊ‹Ë
∞¡Áã‚ÿÙ¥ ∑§Ù ÿ„U ⁄UÊc≈˛UËÿ SÃ⁄U ¬⁄U ◊ÈÅÿ ‚„UÿÙª ©U¬‹éœ ∑§⁄UflÊÃÊ „ÒU– ÷Ê⁄Uà ◊¥
ÕË◊ ª˝È¬ ∑§Ê ÁflSÃÊ⁄U ŒÙ Ã⁄U»§Ê •ŸÈŒÊŸ ∞¡¥‚Ë, •¢Ã⁄UÊc≈˛UËÿ ‚¢ª∆UŸ •ı⁄U
∞ø •Ê߸ flË/∞«˜U‚ ‚ ª˝Á‚à ÷Ê⁄UÃËÿ ‹ÙªÙ¥ ∑§ Ÿ≈Ufl∑¸§ ∑§ ‚ÊÕ „ÈU•Ê „ÒU–
∞«˜U‚ ÷Ê⁄Uà ∑§Ë ŒÍ⁄UŒÎÁc≈U— ÷Ê⁄Uà ◊¥ ∞ø •Ê߸ flË ‚¢øÊ⁄UáÊ ∑§Ë Œ⁄U ∑§Ù ∑§◊ ∑§⁄UŸÊ •ı⁄U
∞ø •Ê߸ flË/∞«˜U‚ ∑§ ‚ÊÕ ⁄U„U ⁄U„U ‹ÙªÙ¥ ∑§ ¡ËflŸ ∑§Ê Áfl∑§Ê‚ ∑§⁄UŸÊ–
ÿÍ ∞Ÿ ∞«˜U‚ ÷Ê⁄Uà ∑§Ê ‹ˇÿ— ⁄UÊc≈˛UËÿ ∑§Êÿ¸∑˝§◊, ∑§ÙS¬Ùã‚‚¸, ŒÙ Ã⁄U»§Ê, Á‚Áfl‹
‚Ê◊ÊÁ¡∑§ ‚¢ª∆UŸ, ∞ø •Ê߸ flË/∞«˜U‚ ∑§ ‚ÊÕ ⁄U„U ⁄U„U ‹Ùª, ◊ËÁ«UÿÊ, øÈŸ ª∞ ¬˝ÁÃÁŸÁœ,
ÁŸ¡Ë ‚ÒÄ≈U⁄U •ı⁄U •ãÿ S≈U∑§„UÙÀ«U‚¸ ∑§ ‚ÊÕ Ÿ ÊŒË∑§Ë ‚ ∑§Ê◊ ∑§⁄UÃ „ÈU∞ ÿÍ ∞Ÿ ∞«˜U‚,
∞ø •Ê߸ flË/∞«˜U‚ ∑§ •ÊªÊ◊Ë ÁflSÃÊ⁄U ¬⁄U ⁄UÙ∑§ ‹ªÊŸ ∑§ Á‹∞ •ı⁄U ⁄UÊc≈˛UËÿ SÃ⁄U ¬⁄U ß‚
◊ÈÁ„U◊ ∑§Ù ‡ÊÁÄÇÊÊ‹Ë ’ŸÊŸ ◊¥ ÷ʪˌÊ⁄U ’ŸªÊ •ı⁄U ß‚‚ ‚¢∑˝§Á◊à •ı⁄U ¬˝÷ÊÁflà ‹ÙªÙ¥
∑§Ù ‚„UÊ⁄UÊ ŒªÊ–
‚Ÿ˜ wÆÆz-wÆÆ{ ◊¥ ÿÍ ∞Ÿ ∞«˜U‚ ‚ÁøflÊ‹ÿ ∑§ ◊ÈÅÿ ¬Á⁄UáÊÊ◊—
““Õ˝Ë flã‚”” ‹ÊªÍ ∑§Ë ªß¸
⁄UÊc≈˛UËÿ •ı⁄U ©U¬-⁄UÊc≈˛UËÿ ∞«˜U‚ Á⁄U‚¬ÙÁã‚‚ ∑§Ù ‚„UÊ⁄UÊ ŒŸ ∑§ Á‹∞ ‚¢ÿÈÄà ∞ćʟ ∑§Ê
ÁflSÃÊ⁄U Á∑§ÿÊ
⁄UÊc≈˛UËÿ •ı⁄U ©U¬-⁄UÊc≈˛UËÿ ∞«˜U‚ ∑§ ¬˝Áà ¡flÊ’Œ„UË ∑§Ù Ã∑§ŸË∑§Ë ‚„UÊÿÃÊ ©U¬‹éœ
∑§⁄UflÊ߸
ÁflûÊËÿ dÙÃÙ¥ ∑§ ∑§Êÿ¸ ∑§Ù ‚ê¬ÛÊ ∑§⁄UflÊŸ ◊¥ ÷Ê⁄Uà Ÿ ‚„UÊ⁄UÊ ÁŒÿÊ
⁄UáÊŸËÁÃÿ ¡ÊŸ∑§Ê⁄UË ∑§ ŒSÃÊfl Ê, ∑ΧÁòÊ◊ ⁄UøŸÊ (Á‚¢ÕÁ‚‚), •ı⁄U ¬˝’㜟
‚È⁄UˇÊÊ, ‚◊M§¬ ‚flÊ∞¢ •ı⁄U ◊ÊŸŸËÿ Áfl¬ŒÊ•Ù¥ ∑§ ‚¢Œ÷¸ ◊¥ ∞«˜U‚ ∑§ ¬˝Áà ¡flÊ’Œ„UË
∑§Ù ’‹ ÁŒÿÊ ªÿÊ
⁄UÊc≈˛UËÿ •ı⁄U ©U¬-⁄UÊc≈˛UËÿ SÃ⁄U ∑§ ‚◊ãflÿ ∑§Ù ’‹ ÁŒÿÊ ªÿÊ
⁄UÊc≈˛UËÿ •ı⁄U ©U¬-⁄UÊc≈˛UËÿ ∑§Êÿ¸∑˝§◊Ù¥ ∑§Ù ’…∏UÊflÊ
37

4.10 Page 40

▲back to top


GLOSSARY
AIDS
ANC
ART
BSS
FSW
HIV
ICTC
IVDU
MSM
NACO
NACP
PLWHA
SACS
STD
STI
UNAIDS
VCTC
WHO
38
Acquired immuno-deficiency syndrome
Antenatal clinic
Anti-retroviral treatment
Behavioural Surveillance Survey
Female sex worker
Human immuno-deficiency virus
Integrated Counseling and Testing Centre
Injecting (intravenous) drug users
Men who have sex with men
National AIDS Control Organisation
National AIDS Control Programme
People living with HIV/AIDS
State AIDS Control Society
Sexually transmitted disease
Sexually transmitted infection
Joint United Nations Programme on HIV/AIDS
Voluntary counseling and testing centre
World Health Organisation
‡ÊéŒ∑§Ê·
∞«˜U‚
∞∞Ÿ‚Ë
∞•Ê⁄U≈Ë
’Ë∞‚∞‚
‚Ë∞‚«UéÀÿÍ
∞ø•Ê߸flË
•Ê߸U‚Ë≈UË‚Ë
•Ê߸ÿÍ«UË
∞◊∞‚∞◊
ŸÊ∑§Ù
∞Ÿ∞‚ˬË
¬Ë∞‹«UéÀÿÍ∞ø∞
∞‚∞‚Ë∞‚
∞‚≈UË«UË
∞‚≈UË•Ê߸
ÿÍ∞Ÿ∞«˜U‚
flË‚Ë≈UË‚Ë
«UéÀÿÍ∞ø•Ù
∞ÄflÊÿ«¸U ßêÿÍŸÙ¥ «UÁ»§Á‚ÿã‚Ë Á‚¢«˛UÙ◊
¬˝‚fl¬Ífl¸ Œπ÷Ê‹ ∑§ãº˝
∞ã≈UË-⁄U≈˛UÙflÊÿ⁄U‹ ©U¬øÊ⁄U
√ÿfl„UÊ⁄U ÁŸ⁄UˡÊáÊ ‚fl¸
√ÿfl‚ÊÁÿ∑§ ÿıŸ ∑§Êÿ¸∑§Ãʸ
„UÿÍ◊Ÿ ßêÿÍŸÙ¥ «UÁ»§Á‚ÿã‚Ë flÊÿ⁄U‚
ßã≈U˪˝≈U«U ∑§Ê©¢U‚Á‹¢ª ∞á«U ≈UÁS≈U¢ª ‚ã≈U‚¸
Ÿ‚Ù¥ ¬⁄U ‚È߸ ‹ªÊ∑§⁄U Ÿ‡ÊÊ ∑§⁄UŸ flÊ‹
¬ÈL§·, ¡Ù ¬ÈL§· ∑§ ‚ÊÕ ÿıŸ ‚ê’㜠’ŸÊÿ
⁄UÊCÔ˛UËÿ ∞«˜U‚ ÁŸÿ¢òÊáÊ ‚¢ª∆UŸ
⁄UÊCÔ˛UËÿ ∞«˜U‚ ÁŸÿ¢òÊáÊ ∑§Êÿ¸∑˝§◊
∞ø •Ê߸ flË/∞«˜U‚ ‚ ª˝Á‚à ‹Ùª
⁄UÊÖÿ ∞«˜U‚ ÁŸÿ¢òÊáÊ ‚Ù‚Êÿ≈UË
ÿıŸ ‚¢øÊÁ⁄Uà ⁄UÙª
ÿıŸ ‚¢øÊÁ⁄Uà ‚¢∑˝§◊áÊ
∞ø •Ê߸ flË/∞«˜U‚ ¬⁄U ‚¢ÿÈÄà ⁄UÊCÔ˛U ∑§Ê ‚¢ÿÈÄà ∑§Êÿ¸∑˝§◊
SflÒÁë¿U∑§ ¬⁄UÊ◊‡Ê¸ ∞fl¢ ¬⁄UˡÊáÊ ∑§ãº˝
Áfl‡fl SflÊSâÿ ‚¢ª∆UŸ

5 Pages 41-50

▲back to top


5.1 Page 41

▲back to top


STATISTICAL APPENDIX
‚Ê¢Å∑§Ëÿ ¬Á⁄UÁ‡Êc≈U
State/Union Territory
⁄UÊÖÿ/∑§ãº˝ ‡ÊÊÁ‚à ¬˝Œ‡Ê
Andhra Pradesh
•Êãœ˝ ¬˝Œ‡Ê
Arunachal Pradesh
•M§áÊÊø‹ ¬˝Œ‡Ê
Assam
•‚◊
Bihar
Á’„UÊ⁄U
Chhattisgarh
¿UûÊË‚ª…∏U
Delhi
ÁŒÀ‹Ë
Goa
ªÙflÊ
Gujarat
ªÈ¡⁄UÊÃ
Haryana
„UÁ⁄UÿÊáÊÊ
Himachal Pradesh
Á„U◊Êø‹ ¬˝Œ‡Ê
Jammu & Kashmir
¡ê◊Í •ı⁄U ∑§‡◊Ë⁄U
Jharkhand
¤ÊÊ⁄Uπá«U
Karnataka
∑§ŸÊ¸≈U∑§
Kerala
∑§⁄U‹
Madhya Pradesh
◊äÿ ¬˝Œ‡Ê
Maharashtra
◊„UÊ⁄UÊc≈˛U
Mumbai
◊Èê’߸U
Manipur
◊ÁáʬÈ⁄U
Compiled from NACO data
ŸÊ∑§Ê ∑§ •Ê¢∑§«∏UÊ¥ ‚ ‚¢∑§Á‹Ã
— Not Available
©U¬‹éœ Ÿ„UË¥
Percent Testing Positive for HIV
at Sentinel Sites, 2005
‚¢∑˝§Á◊à ¬Êÿ ªÿ ‹ÙªÙ¥
∑§Ê ¬˝ÁÇÊÃ, wÆÆz
Patients
at sexually
transmitted
disease clinics
ÿıŸ ‚¢øÊÁ⁄UÃ
⁄UÙª ∑§ãº˝Ù¥
◊¥ ◊⁄UË¡
Pregnant
women at
antenatal
clinics
ª÷¸flÃË
◊Á„U‹Ê•Ù¥ ∑§
Á‹∞ ¬˝‚fl¬Ífl¸
Œπ÷Ê‹ ∑§ãº˝
Patients at
intravenous
drug users
clinics
‚È߸U ‚ Ÿ‡ÊÊ
∑§⁄UŸ flÊ‹ ‹ÙªÙ¥
∑§Ë Œπ÷Ê‹ ∑§
Á‹∞ ∑§ãº˝
22.0
1.7
0.5
0.5
1.7
0.0
7.9
0.4
0.4
2.8
0.3
7.7
0.3
22.8
14.0
0.0
3.2
0.4
1.3
0.2
0.3
0.2
0.0
0.0
0.0
0.0
0.1
15.7
1.5
2.6
0.3
5.2
1.7
0.3
15.1
1.1
22.1
1.1
12.8
12.2
1.3
24.1
HIV Prevalence Levels at Sentinel Sites, 2005
⁄UˇÊÊ ∑§ãº˝Ù¥ ◊¥ ∞ø •Ê߸U flË ∑§Ê ‚¢∑˝§◊áÊ SÃ⁄U, wÆÆz
Female
Sex
Workers
◊Á„U‹Ê
ÿıŸ
∑§Êÿ¸∑§Ãʸ
No. of
Female Sex
Worker
Sites
◊Á„U‹Ê ÿıŸ
∑§Êÿ¸∑§Ãʸ
∑§ãº˝Ù¥ ∑§Ë
‚¥ÅÿÊ
State/Union Territory
⁄UÊÖÿ/∑§ãº˝ ‡ÊÊÁ‚à ¬˝Œ‡Ê
Percent Testing Positive for HIV
at Sentinel Sites, 2005
‚¢∑˝§Á◊à ¬Êÿ ªÿ ‹ÙªÙ¥
∑§Ê ¬˝ÁÇÊÃ, wÆÆz
Patients
at sexually
transmitted
disease clinics
ÿıŸ ‚¢øÊÁ⁄UÃ
⁄UÙª ∑§ãº˝Ù¥
◊¥ ◊⁄UË¡
Pregnant
women at
antenatal
clinics
ª÷¸flÃË
◊Á„U‹Ê•Ù¥ ∑§
Á‹∞ ¬˝‚fl¬Ífl¸
Œπ÷Ê‹ ∑§ãº˝
Patients at
intravenous
drug users
clinics
‚È߸U ‚ Ÿ‡ÊÊ
∑§⁄UŸ flÊ‹ ‹ÙªÙ¥
∑§Ë Œπ÷Ê‹ ∑§
Á‹∞ ∑§ãº˝
13.0
7
Meghalaya
0.0
0.0
0.0
◊ÉÊÊ‹ÿ
Mizoram
3.0
0.8
4.8
Á◊ ÊÙ⁄U◊
0.8
4
Nagaland
3.5
2.0
4.5
ŸÊªÊ‹Òá«U
2.2
4
Orissa
3.6
0.6
©U«∏UË‚Ê
Punjab
1.1
0.3
¬¢¡Ê’
3.2
3
Rajasthan
4.8
0.5
⁄UÊ¡SÕÊŸ
Sikkim
0.9
0.3
0.5
Á‚ÁÄ∑§◊
8.1
3
Tamil Nadu
12.0
0.5
18.0
ÃÁ◊‹ŸÊ«ÈU
2.0
1
Tripura
1.3
0.0
10.9
ÁòʬÈ⁄UÊ
0.0
1
Uttar Pradesh
0.8
0.2
©UûÊ⁄U ¬˝Œ‡Ê
Uttarakhand
©UûÊ⁄UÊπá«U
0.6
0.0
0.8
3
West Bengal
2.5
0.9
7.4
¬Á‡ø◊ ’¢ªÊ‹
18.4
3
A & N Islands
0.4
0.0
∞ ∞á«U ∞Ÿ mˬ ‚◊Í„U
Chandigarh
1.0
0.0
9.2
ø¢«U˪…∏U
1.8
3
D & N Haveli
0.3
«UË ∞á«U ∞Ÿ „Ufl‹Ë
23.6
12
Daman & Diu
0.1
Œ◊Ÿ ∞á«U ŒËÿÍ
30.5
2
Lakshadweep
0.0
0.0
‹ˇÿmˬ
10.0
3
Pondicherry
4.2
0.3
¬ÊÚÁá«Uø⁄UË
Female
Sex
Workers
◊Á„U‹Ê
ÿıŸ
∑§Êÿ¸∑§Ãʸ
14.0
10.8
2.6
3.7
5.5
3.5
6.8
0.4
0.7
0.3
No. of
Female Sex
Worker
Sites
◊Á„U‹Ê ÿıŸ
∑§Êÿ¸∑§Ãʸ
∑§ãº˝Ù¥ ∑§Ë
‚¥ÅÿÊ
1
1
2
4
11
4
7
1
3
2
Note: Mean Values
ŸÊ≈U— •ÊÒ‚Ã
39

5.2 Page 42

▲back to top


STATISTICAL APPENDIX
‚Ê¢Å∑§Ëÿ ¬Á⁄UÁ‡Êc≈U
Ever heard of
both HIV and
AIDS (%)
∞ø •Ê߸U flË
•ı⁄ ∞«˜U‚ ∑§ ’Ê⁄U
◊¥ ‚ÈŸÊ (%)
State/Union Territory
⁄UÊÖÿ/∑§ãº˝ ‡ÊÊÁ‚à ¬˝Œ‡Ê
Male
Female
¬ÈL ·
◊Á„U‹Ê
Andhra Pradesh
88.1
79.7
Assam
79.1
72.1
Bihar
45.9
21.7
Chhattisgarh
60.6
49.5
Delhi
88.6
70.9
Goa + Daman & Diu
96.6
94.8
Gujarat + D & N Haveli
84.4
59.1
Haryana
72.0
49.6
Himachal Pradesh
86.9
67.0
Jammu & Kashmir
73.4
57.3
Jharkhand
64.6
44.2
Karnataka
63.9
58.6
Kerala + Lakshadweep
97.2
94.6
Madhya Pradesh
70.2
42.3
Maharashtra
84.0
79.2
Manipur
89.2
86.1
Orissa
42.8
29.1
Other Northeastern States
88.5
73.4
Punjab + Chandigarh
66.0
63.8
Rajasthan
64.2
38.0
Sikkim
57.5
56.0
Tamil Nadu
73.9
68.0
Uttar Pradesh
67.0
42.5
Uttarakhand
81.7
54.8
West Bengal + A & N Islands 65.3
57.1
BSS-2006 (Final Report)
’Ë∞‚∞‚-wÆÆ{ (»§Êߟ‹ Á⁄U¬Ù≈¸U)
40
HIV/AIDS Awareness and Behaviour, Adults 15-49, 2006
vz-y~ fl·¸ •ÊÿÈ flª¸ ∑§ ‹ÙªÙ¥ ∑§Ù ∞ø •Ê߸ flË/∞«˜U‚ ∑§Ë ¡ÊŸ∑§Ê⁄UË •ÊÒ⁄U √ÿfl„UÊ⁄U, wÆÆ{
Knows that an
uninfected faithful
partner and
consistent condom
use can prevent
HIV/AIDS (%)
¡ÊŸÃ „ÒU Á∑§ •‚¢∑˝§Á◊Ã,
Áfl‡fl‚ŸËÿ ‚ÊÕË
•ı⁄U ÁŸ⁄UÙœ ∑§Ê
‹ªÊÃÊ⁄U ¬˝ÿÙª ∞ø
•Ê߸U flË/∞«U˜‚ ‚
’øÊ ‚∑§ÃÊ „ÒU (%)
Knows that an
infected pregnant
woman can transmit
HIV to her unborn
child (%)
¡ÊŸÃ „ÒU Á∑§
‚¢∑˝§Á◊à ª÷¸flÃË
◊Ê° •¬Ÿ •¡ã◊
’ìÊ ∑§Ù
∞ø •Ê߸U flË ‚¢øÊÁ⁄UÃ
∑§⁄U ‚∑§ÃË „ÒU (%)
Had sex with a
non-regular partner
in the last
12 months (%)
Á¬¿U‹ vw ◊„UËŸÙ¥
◊¥ •ÁŸÿÁ◊à ÿıŸ
‚ÊÕË ‚ ‚¢’¢œ
’ŸÊÿÊ (%)
Reported condom
use last time
with a non-regular
partner in the
last 12 months (%)
Á¬¿U‹ vw ◊„UËŸÙ¥
◊¥ •ÁŸÿÁ◊à ÿıŸ
‚ÊÕË ‚ Á¬¿U‹Ë’Ê⁄
‚¢’¢œ ∑§ ‚◊ÿ ∑§á«UÙ◊
¬˝ÿÙª Á∑§ÿÊ (%)
Male
Female
¬ÈL ·
◊Á„U‹Ê
Male
Female
¬ÈL ·
◊Á„U‹Ê
Male
Female
¬ÈL ·
◊Á„U‹Ê
69.4
55.3
69.8
86.5
21.0
9.1
74.6
68.9
46.3
79.7
76.5
5.3
1.2
79.4
47.9
30.9
52.5
26.6
3.7
0.0
31.5
44.4
33.1
59.2
46.7
4.8
0.6
38.8
80.0
49.2
80.8
69.6
14.5
3.4
81.3
72.4
67.7
88.1
88.9
10.9
0.6
81.7
81.6
51.4
80.7
62.0
7.4
2.2
65.5
85.3
58.4
85.0
69.4
6.0
1.0
50.1
82.8
74.8
86.0
71.1
5.8
0.5
76.7
70.3
44.8
81.8
62.2
6.0
0.5
63.8
55.6
29.7
63.1
50.1
3.4
1.7
69.9
56.0
26.3
74.1
76.5
3.1
0.8
73.0
88.8
81.9
88.6
90.1
8.0
4.4
69.7
62.3
43.6
59.3
44.8
8.8
0.4
60.6
75.9
53.5
77.4
74.4
11.0
5.2
63.7
66.4
67.1
73.3
70.9
4.5
2.1
74.7
52.9
36.0
67.4
65.5
6.7
4.3
37.9
60.8
49.4
91.7
84.5
9.8
8.8
77.5
79.9
55.4
70.6
63.5
15.2
4.2
79.7
64.7
41.1
58.5
43.8
8.0
1.5
56.5
37.7
35.7
53.9
57.5
5.4
0.7
65.0
72.3
53.6
86.7
82.2
15.4
6.4
50.9
78.9
52.2
71.6
52.7
9.2
0.4
45.0
81.8
58.4
80.1
62.6
4.5
0.0
54.1
41.8
31.4
66.9
63.4
4.3
0.3
67.3
Aware of
any HIV/AIDS
testing facility
in their area (%)
ˇÊòÊ ∑§ Á∑§‚Ë
∞ø •Ê߸U flË ¡Ê°ø
∑§ãº˝ ∑§ ’Ê⁄U ◊¥
¡ÊŸÃ „Ò¥ (%)
Male
Female
¬ÈL ·
◊Á„U‹Ê
State/Union Territory
⁄UÊÖÿ/∑§ãº˝ ‡ÊÊÁ‚à ¬˝Œ‡Ê
56.2
47.8
•Êãœ˝ ¬˝Œ‡Ê
13.3
5.6
•‚◊
14.4
6.0
Á’„UÊ⁄U
23.5
8.1
¿UûÊË‚ª…∏U
51.3
38.0
ÁŒÀ‹Ë
44.0
19.9
ªÙflÊ + Œ◊Ÿ ∞á«U ŒËÿÍ
28.5
16.4 ªÈ¡⁄UÊà + «UË ∞á«U ∞Ÿ „Ufl‹Ë
45.2
17.9
„UÁ⁄UÿÊáÊÊ
45.2
28.6
Á„U◊Êø‹ ¬˝Œ‡Ê
19.7
9.3
¡ê◊Í •ı⁄U ∑§‡◊Ë⁄U
23.9
9.9
¤ÊÊ⁄Uπá«U
44.6
33.1
∑§ŸÊ¸≈U∑§
42.0
38.2
∑§⁄U‹ + ‹ˇÿmˬ
18.8
10.9
◊äÿ ¬˝Œ‡Ê
66.0
52.3
◊„UÊ⁄UÊc≈˛U
34.6
26.9
◊ÁáʬÈ⁄U
14.6
8.7
©U«∏UË‚Ê
37.1
31.0
•ãÿ ©UûÊ⁄UË ⁄UÊÖÿ
35.4
21.3
¬¢¡Ê’ + ø¢«U˪…∏U
34.2
14.5
⁄UÊ¡SÕÊŸ
29.5
34.5
Á‚ÁÄ∑§◊
26.7
29.5
ÃÁ◊‹ŸÊ«ÈU
41.2
7.1
©UûÊ⁄U ¬˝Œ‡Ê
27.8
9.9
©UûÊ⁄UÊπá«U
15.4
8.0 ¬Á‡ø◊ ’¢ªÊ‹ + ∞ ∞á«U ∞Ÿ mˬ ‚◊Í„U

5.3 Page 43

▲back to top


For additional copies of this chartbook, please contact the Population Foundation of India at
the address below. These publications are free of charge to individuals and organisations.
Population Foundation of India
B-28, Qutab Institutional Area, Tara Crescent, New Delhi 110 016
Telephone: 91-11-42899770 Fax: 91-11-42899795 e-mail: popfound@sify.com
www.popfound.org
Population Reference Bureau
1875 Connecticut Ave., NW, Suite 520, Washington, DC 20009
Telephone: (202) 483-1100 Fax: (202) 328-3937 e-mail: popref@prb.org
www.prb.org
Funding was provided through the generosity of the Joint United Nations Programme on
HIV/AIDS.
Printed in India at Ajanta Offset & Packagings Ltd., Delhi. June 2007.
ß‚ øÊ≈¸’È∑§ ∑§Ë •ÁÃÁ⁄UÄà ¬˝ÁÃÿÊ¥ ∑§ Á‹∞ ¬Êڬȋ‡ÊŸ »§Ê©¢U«U‡ÊŸ •ÊÚ»§ ßÁá«UÿÊ ‚ ÁŸêŸÁ‹Áπà ¬Ã ¬⁄U ‚ê¬∑¸§ ∑§⁄¥U–
ÿ„U ¬˝∑§Ê‡ÊŸ √ÿÁÄêà ÃÕÊ ‚¢ª∆UŸÊ¥ ∑§Ë ÁŸ‡ÊÈÀ∑§ ©U¬‹éœ „Ò¥U–
¬Êڬȋ‡ÊŸ »§Ê©¢U«U‡ÊŸ •ÊÚ»§ ßÁá«UÿÊ
’Ë-w}, ∑ȧÒ ßãS≈UË≈K͇ʟ‹ ∞Á⁄UÿÊ, ÃÊ⁄UÊ ∑˝Ò§‚ã≈U, Ÿß¸ ÁŒÀ‹Ë-vvÆ Æv{
Telephone: 91-11-4289 9770 Fax: 91-11-4289 9795 e-mail: popfound@sify.com
www.popfound.org
¬Êڬȋ‡ÊŸ ⁄U»§⁄Uã‚ éÿÍ⁄UÊ
v}|z ∑§ŸÒÄ≈UË∑§≈U ∞flãÿÍ, ŸÊÕ¸flS≈U, ‚Í≈U zwÆ, flÊÁ‡Ê¢ª≈UŸ-«UË‚Ë wÆÆÆ~
Telephone: (202) 483-1100 Fax: (202) 328-3937 e-mail: popref@prb.org
www.prb.org
ÁflûÊËÿ ‚„UÿÙª ∞ø •Ê߸U flË/∞«˜U‚ ¬⁄U ‚¢ÿÈÄà ⁄UÊc≈˛U ∑§Êÿ¸∑˝§◊ (ÿÍ∞Ÿ∞«U˜‚) ∑§ ‚ı¡ãÿ ‚ ¬˝Ê# „ÈU•Ê
•¡ãÃÊ •ÊÚ»§‚≈U ∞á«U ¬Ò∑§Á¡¢Ç‚ Á‹Á◊≈U«U, ÁŒÀ‹Ë mÊ⁄UÊ ÷Ê⁄Uà ◊¥ ◊ÈÁº˝Ã– ¡ÍŸ wÆÆ|

5.4 Page 44

▲back to top


HIV/AIDS
in
INDIA