PFI or UNICEF

PFI or UNICEF


1 Pages 1-10

▲back to top


1.1 Page 1

▲back to top


1.2 Page 2

▲back to top


1.3 Page 3

▲back to top


1.4 Page 4

▲back to top


1.5 Page 5

▲back to top


© UNICEF, FAO, SaciWATERs, 2013
UNICEF, India Country Office
73 Lodi Estate
New Delhi 110 003
India
Tel: 91 11 2469-0401, 2469-1410
Fax: 011 2462-7521, 2469-1410
Email: newdelhi@unicef.org
Web: http://www.unicef.in
FAO Representation in India
55 Lodi Estate, Max Muller
Marg
New Delhi- 110 003
Telephone: +91-11-24628877
Fax: +91-11-24620115
E-mail: fao-in@fao.org
Web: http://www.fao.org
SaciWATERs
B- 87, 3rd Avenue, Sainikpuri,
Secunderabad- 500 094,
Andhra Pradesh, India
Telephone : +91 40 64642602,
Telefax: +91 40 27116721 ext :202
Email: info@saciwaters.org
Web: www.saciwaters.org
All rights reserved. No part of this publication may be reproduced, stored in a retrieval system, or transmitted,
in any form or by any means, without the prior permission in writing of UNICEF, India or as expressly permitted
by law, by license, or under terms agreed with the appropriate reprographics rights organization.
This report was carried out by UN agencies working in India and involved on water issues. This included
active participation from WHO, UN-Habitat, UNESCO and UNRC office. The work was funded by FAO and
UNICEF and was managed by Aidan Cronin (UNICEF Water, Sanitation and Hygiene Section, India Country
Office) and Satya Priya (FAO, National Programme Coordinator - Land and Water).
This publication was carried out in partnership with the South Asia Consortium for Interdisciplinary Water
Resources Studies, SaciWATERs, a policy research institute that works on transforming water resources
knowledge systems from an interdisciplinary approach. It looks at water resources from a pro-poor, gendered
and human development perspective, with emphasis on exchange, interaction and collaboration at the South
Asia level.
Report Content Advisors & Reviewers: Satya Priya and Aidan Cronin
Report writing: Anjal Prakash, Medhavi Sharma and Jayati Chourey
Design coordination: Md. Abdul Fahad
Cover photo courtesy: FAO, India
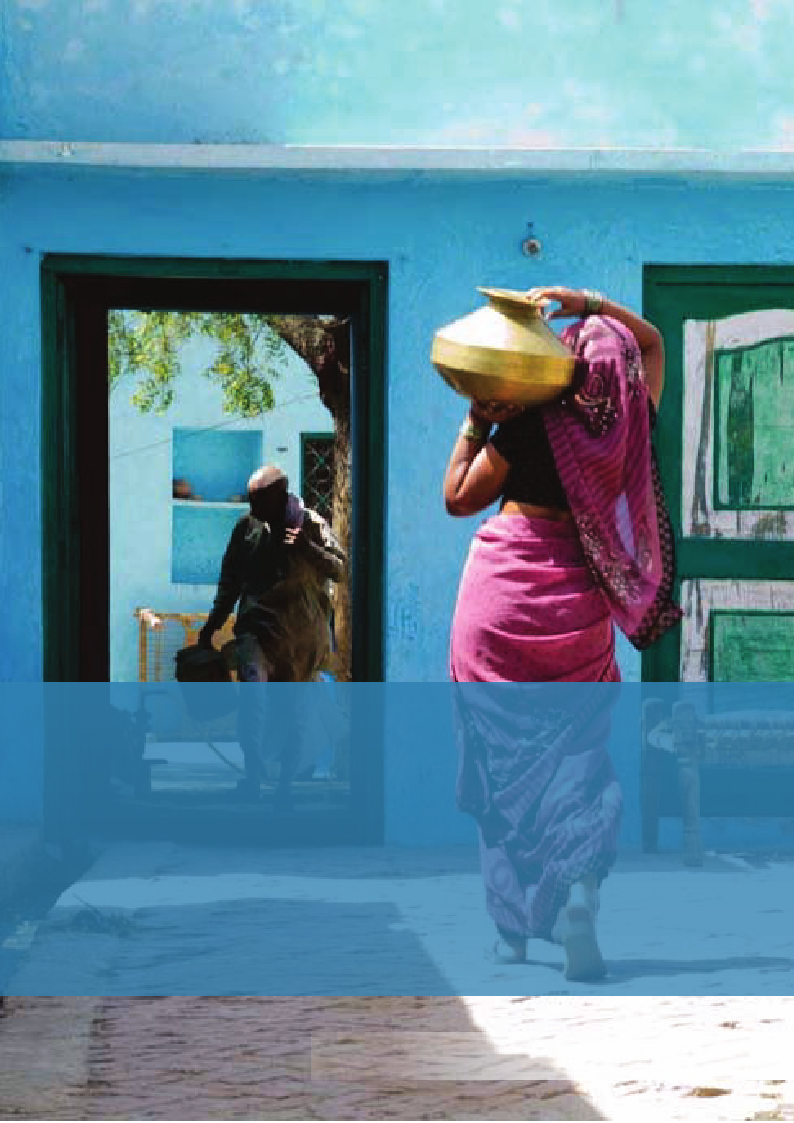
Back cover photo courtesy: Rohan Dhawan
Disclaimer
The opinions expressed are those of the authors and editors and do not necessarily reflect the views of
UNICEF, FAO or the United Nations.
Citation
UNICEF, FAO and SaciWATERs. 2013. Water in India: Situation and Prospects.

1.6 Page 6

▲back to top


UNITED NATIONS
UNITED NATIONS
The aim of this report is to present information on the water sector in an integrated, holistic manner. The report
compiles data on the full range of water issues from water hydrogeology to resource use, water quality, health
impact, agricultural productivity, livelihoods, governance and gender. In producing this report, the UN in India
hopes to contribute to efforts by the Government of India and partners to manage water resources more
effectively during implementation of the Twelfth Five Year Plan.
Improved management of water resources will have a major impact on India's social and productive progress.
Nowhere is this more important than in the area of child health. Studies show that forty-five percent of India's
children are stunted and 600,000 children under five die each year, largely because of inadequate water
supply and poor sanitation. Improving water supply, for example by reducing, and eventually eradication
open defecation, would contribute majorly to reducing child morbidity and mortality and improving nutrition.
Better management of water resources will also help to ensure sustainable food security. The UN's Food and
Agriculture Organization estimates that total water demand will equal water availability by 2025. With
industries and cities needing more and more water, steps need to be taken now to boost productivity of both
irrigated and rein-fed agriculture.
This publication, which was prepared by FAO, UNICEF and SaciWATERs, is timed to contribute to the
implementation of the Government of India's Twelfth Five Year Plan. By highlighting critical challenges and
priorities and offering recommendations for policy makers and planners, the UN hopes to contribute to a
sustainable water sector for all.
Lise Grande
United Nations Resident Coordinator, India
55, Lodi Estate, New Delhi – 110 003, India
Telephone: +91 11 4659 2333 Fax: +91 11 24627612
Email: lise.grande@undp.org Website: www.un.org.in

1.7 Page 7

▲back to top


The crisis of access to adequate and safe water for drinking, agriculture and livelihood activity for the poor has
gained currency in recent years. This is more so after the debate around MDGs that tracks development of
countries on various developmental index including access to water. Sanitation too has long been seen as
key gap in the Sector in India. This report worked towards building a comprehensive and consolidated
interdisciplinary understanding on the status of different aspects of water in India with the latest available
information. The report aims at achieving a holistic and dynamic understanding of the current situation in India
and looks at the strategic steps required for the appropriate actions. It aspires at creating an environment
where water is available for all in a sustainable manner: safe drinking water for basic needs, sufficient water
for agriculture, water for industry etc. Thus it encompasses both a picture of the state of water resources,
potential problems and progress towards identified goals, and workable solutions.
This report was commissioned by the United Nations (UN) agencies working in India and involved in water
issues. This included United Nations Children's Fund (UNICEF), Food and Agriculture Organisation (FAO),
World Health Organization (WHO), UN-Habitat, United Nations Educational, Scientific and Cultural
Organization (UNESCO) and United Nations Resident Coordinator (UNRC) office. The work was funded by
FAO and UNICEF.
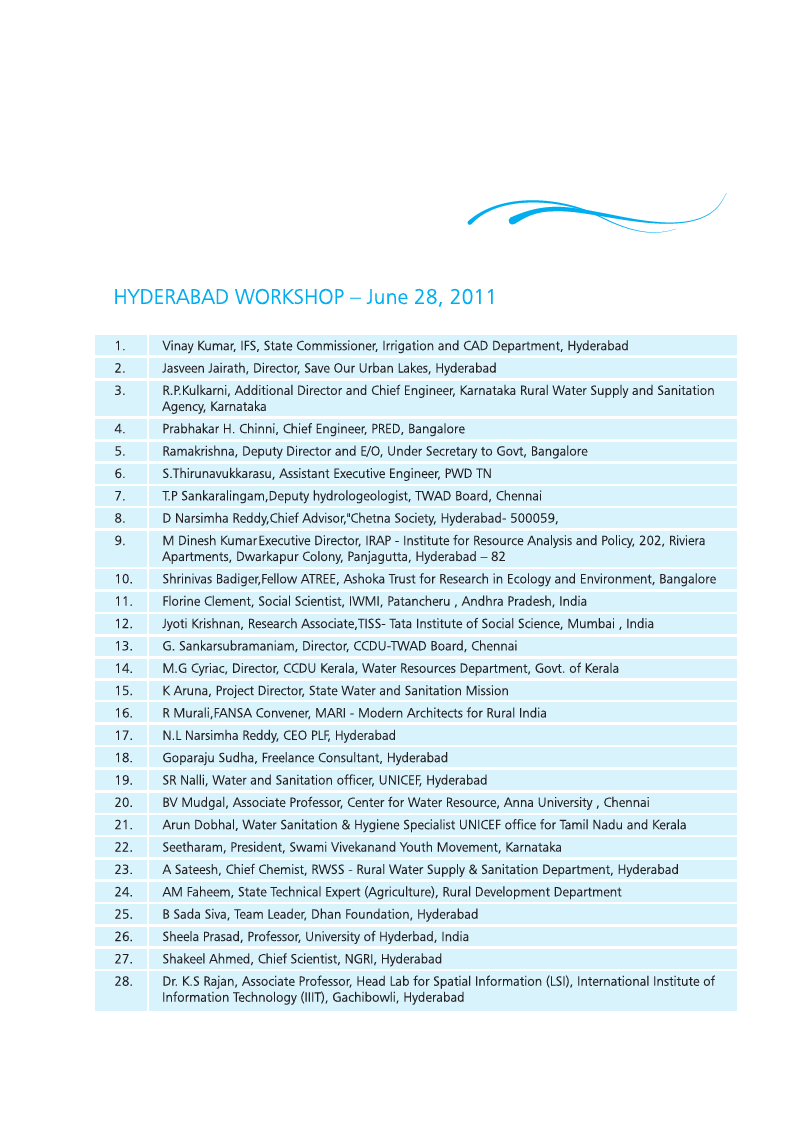
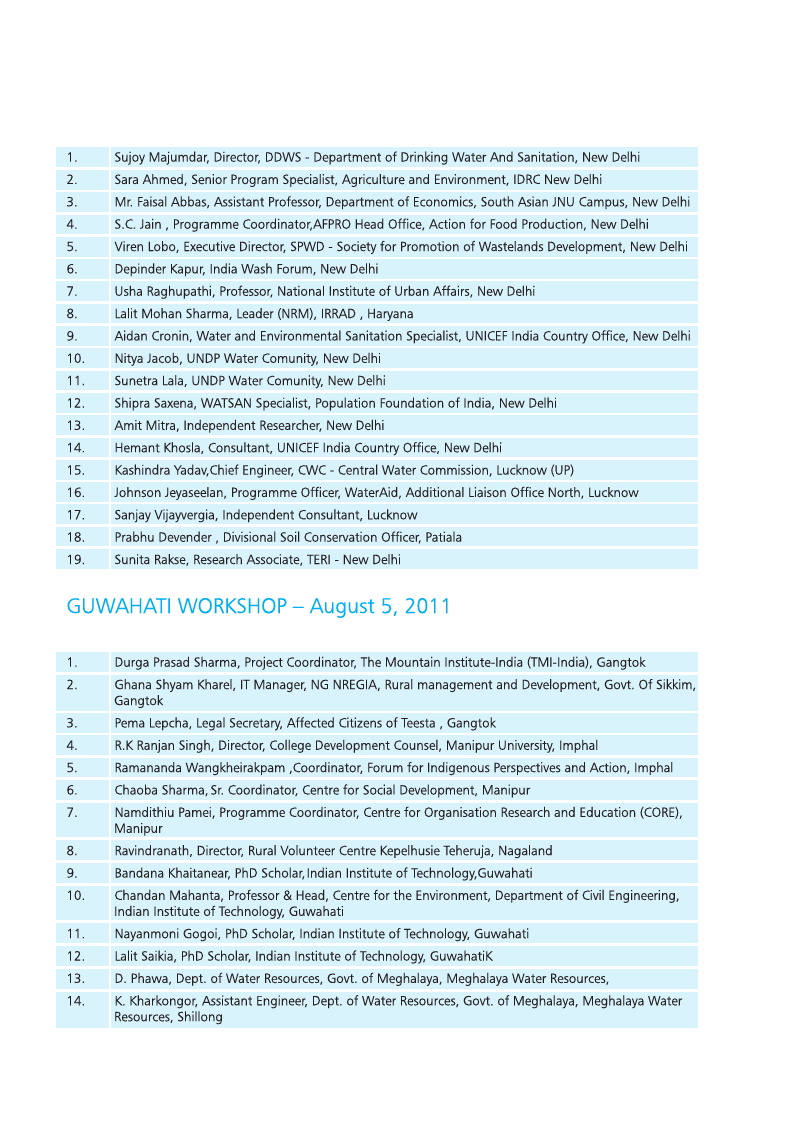
Five consultations were held in 2011 with representations from Northern, Eastern, Western, Southern and
North-Eastern states of India. The participants of these consultations included government representatives,
experts, civil society members and grass roots NGOs. We sincerely thank the participants of the consultation
workshops for their active engagement and suggestions to improve the content of the report. The process of
consultations included partnership with local institutions where the workshops were held. We would like to
thank Indian Institute of Technology, Guwahati (IITG), Centre for Environmental Planning (CEPT),
Ahmedabad, Xaviour Institute of Management, Bhubaneswar (XIMB), which hosted the consultation
workshops. In particular, Dr. Anamika Barua, IITG, Dr. Shrawan Kumar Acharya, CEPT and Dr. S Peppin,
XIMB deserves special mention. Each of these workshops had two keynote addresses to represent
government and non-government\\academic\\activists perspective. We would like to thank Mr. Vinay Kumar,
IFS, State Commissioner, Irrigation and Command Area Development Programme, Govt. of Andhra Pradesh,
Dr. Jasveen Jairath, Save Our Urban Lakes (SOUL) Hyderabad, Mr. H. K Borah, Secretary Public Health and
Engineering Department (PHED), Guwahati, Professor Chandan Mahanta, Associate Professor, Department
of Civil Engineering, IITG, Mr. Sujoy Majumdar, Director (Water) Ministry of Drinking Water and Sanitation
(MDWS), Dr. Sara Ahmed, Senior Programme Specialist, International Development Research Centre
(IDRC), Mr. Surendra Nath Tripathi, Principle Secretary, Department of Rural Development, Orissa, Dr. Smita
Mishra Panda, Human Development Foundation, Bhubaneswar, Orissa, Mr. H. K Dash, Principle Secretary,
Department of Water Supply, Govt. of Gujarat and Prof. Amita Shah, Director, Gujarat Institute of
Development Research for giving key note addresses and setting the stage for the consultation workshops.
The final draft report went through several presentations, consultations and reviews. The first draft of this
report was reviewed by Prof. Chandan Mahanta of IITG and Dr. Jasveen Jairath, SOUL, Hyderabad. The
members of UN Water Cluster who periodically reviewed the draft reports, deserve special mention. In
particular, Ms. Sunetra Lala and Mr. Nitya Jacob (Solutions Exchange Water Community), Dr. Kulwant Singh
(UN-Habitat), Dr. Srinivasan Iyer (UNDP), Dr. Bhanu R Neupane (UNESCO), Mr. Himanshu Pradhan, Dr. A
Gunasekar (WHO) and members of the UNICEF India WASH team who have given their comments on
different drafts of this report.
The final draft was reviewed by eminent Indian scholars working on water issues. Our sincere gratitude to
Prof. Amita Shah of Gujarat Institute of Development Research (GIDR), Ahmedabad, Ms. Seema Kulkarni of
Society for Promotion of Participative Ecosystem Management (SOPPECOM), Pune, Dr. Himanshu Kulkarni
of Advance Centre for Water Resources Development and Management (ACWADAM), Pune, Mr. Vijay
Shankar of Samaj Pragati Sahyog, Dewas, Madhya Pradesh and Dr. Ravi Narayan, Advisor Arghyam,
Bangalore for minutely scanning the document and providing comments that have improved the draft
considerably. Sunaina Rachel Dalaya painstakingly copy-edited this report. Comments received from
Ministry of Drinking Water and Sanitation and Central Water Commission are graciously acknowledged.

1.8 Page 8

▲back to top


We are indebted to several people who provided administrative support for the production of this report.
Jessinda Mathew, Om Prakash Mago and George Thomas of UNICEF, Uma Balaji of FAO, Hemalatha Paul
and C Sreenivas of SaciWATERs supported the administration and financial management for this project.
The designing of the report was done by Md. Abdul Fahad of SaciWATERs.
This report was commissioned to South Asia Consortium for Interdisciplinary Water Resources Studies,
SaciWATERs, a policy research Institute working on the issues of integrated water resources management in
South Asia. We would like to very sincerely thank Dr. Anjal Prakash and the SaciWATERs team for taking up
this important assignment and working tirelessly on many drafts. Dr. Chanda Gurung Goodrich, Dr. Jayati
Chourey, and Ms. Medhavi Sharma who worked with SaciWATERs during the time of commissioning this
report need special mention for writing specific chapters and coordinating part of the workshops, writing initial
drafts and case studies. A chapter of this report on Urban Water and Sanitation was written by experts
associated with Health of the Urban Poor program funded by USAID. Anand Rudra, USAID, India, Sainath
Banerjee, Shipra Saxena, Biraja Kabi Satapathy, Johnson R Jeyaseelan of HUP -PFI, Meeta Jaruhar,
Merajuddin Ahmad, Anil Kumar Gupta of HUP – Plan and Himani Tiwari of HUP-IIHMR's contribution is
profoundly acknowledged.
This is certainly not a perfect product; it has also been a difficult process to narrow down and not include other
important issues pertaining to the Sector. We thank you for your understanding in this respect and we
sincerely hope that this report will generate fresh debate and discussion to strengthen the water discourse in
India.
Satya Priya
National Programme Coordinator (Land and Water)
FAO India Country Office, New Delhi
Aidan Cronin
Water and Environmental Sanitation Specialist
UNICEF India Country Office, New Delhi

1.9 Page 9

▲back to top


List of Abbreviations ...................................................................................................................... ii-iii
List of Tables .................................................................................................................................. iv
List of Figures ................................................................................................................................ v
List of Boxes .................................................................................................................................. vi
Executive Summary ........................................................................................................................ vii-x
Chapter One: Water Availability and Scarcity .............................................................................. 1-18
Chapter Two: Water Demand ...................................................................................................... 19-31
Chapter Three: Urban Water and Sanitation .................................................................................. 33-38
Chapter Four: Water Pollution....................................................................................................... 39-47
Chapter Five: Gender and Water ................................................................................................. 49-56
Chapter Six: Water Resources Governance and Management: Changing Contexts ................ 57-64
Chapter Seven: Water Conservation and Management: Positive Examples and Case Studies...... 65-69
Chapter Eight: Pressures and Drivers of Change and the Role of Stakeholders in Overcoming
the Problem ........................................................................................................... 71-78
Chapter Nine: Conclusion: Water For All: From Promise to a Reality? ........................................ 79-86
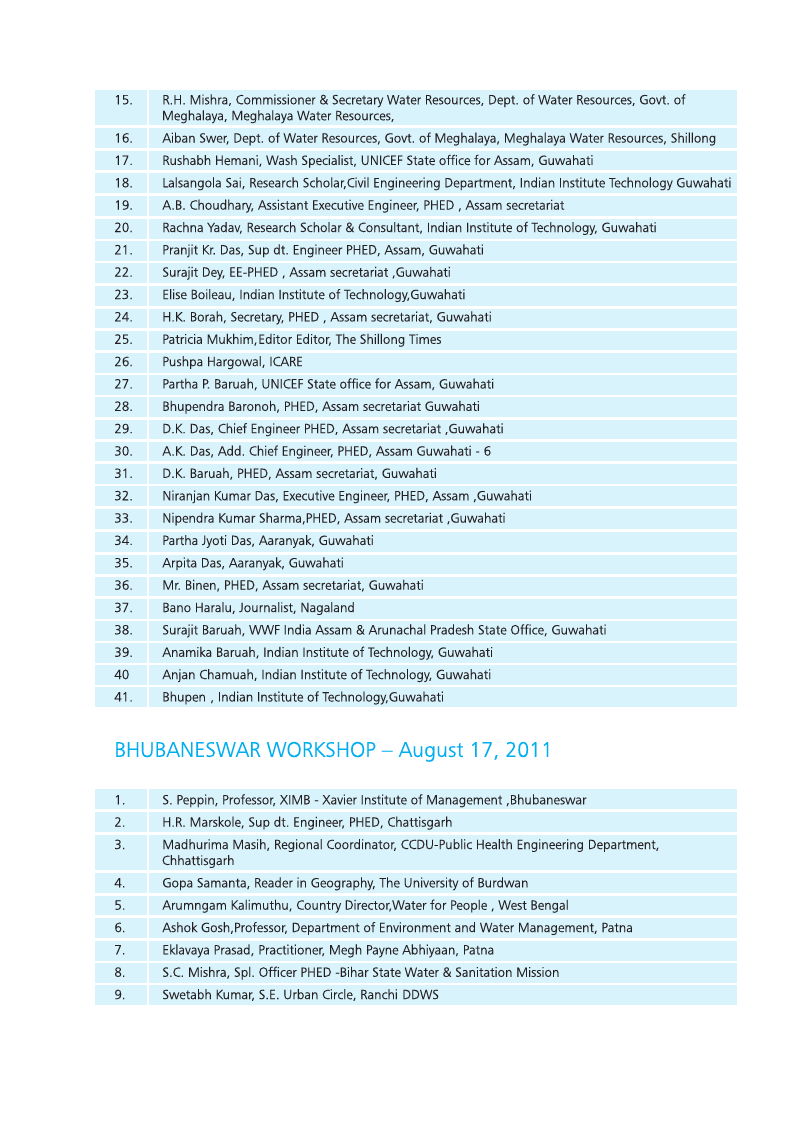
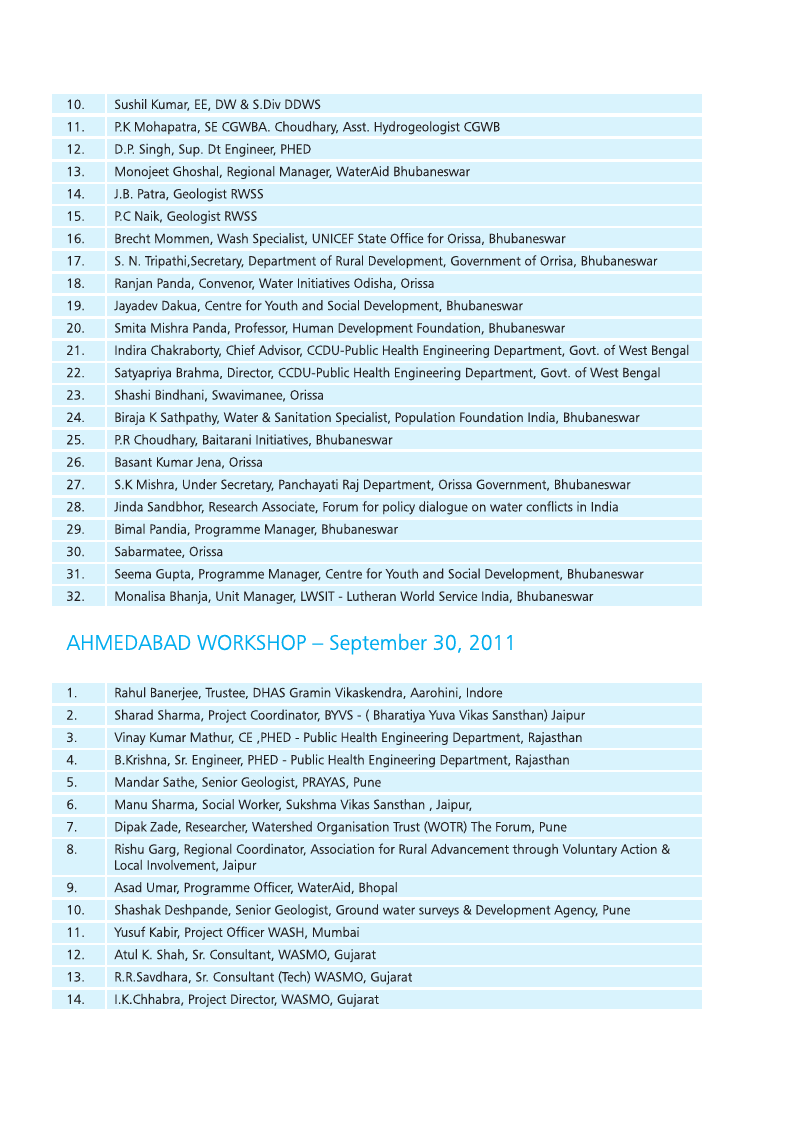
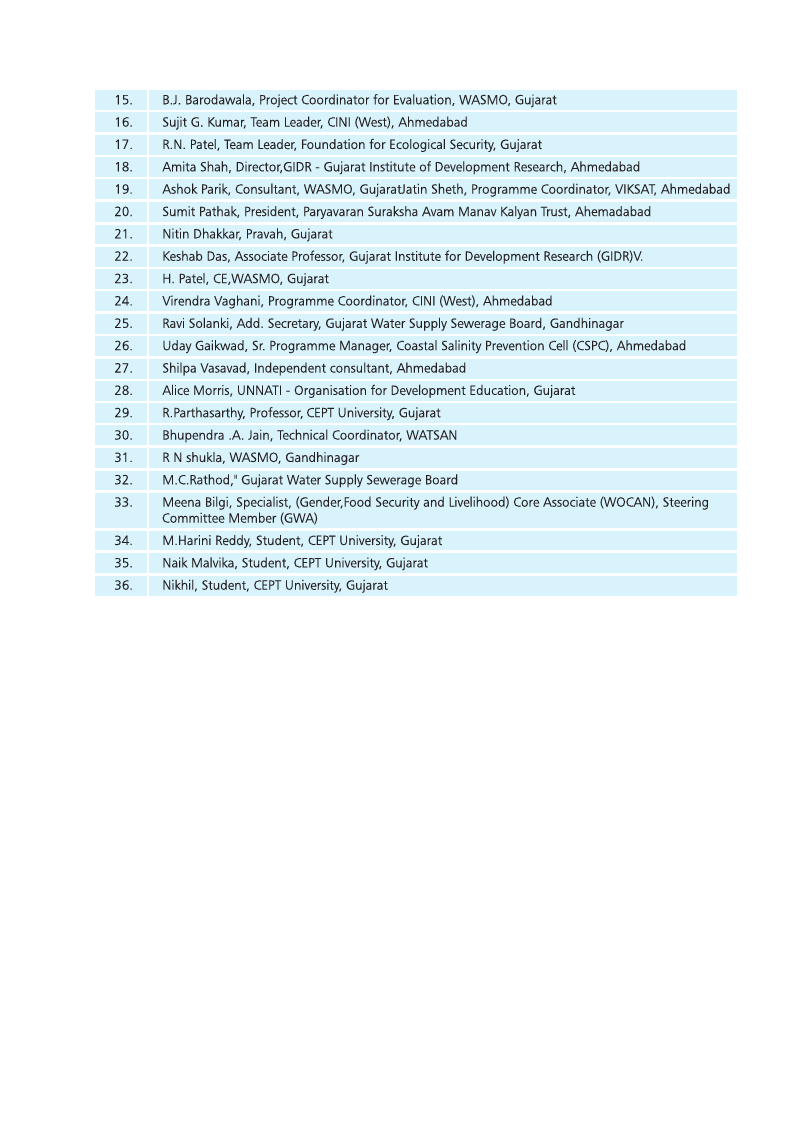
Annexure 1: Details of the Participants (Consultation Workshops) ................................................. 87-91
i

1.10 Page 10

▲back to top


ABD
Asian Development Bank
APWRDC
Andhra Pradesh Water Resources Development Corporation
ARWSP
Accelerated Rural Water Supply Programme
BCM
Billion Cubic Meters
BIS
Bureau of Indian Standards
BOD
Biochemical oxygen demand
CIFRI
Central Inland Fisheries Research Institute
CGWB
Central Ground Water Board
CPCB
Central Pollution Control Board
CRED
Centre for Research on the Epidemiology of Disasters
CSE
Centre for Science and Environment
CWC
Central Water Commission
DDP
Desert Development Programme
DDWS/MDWS Ministry of Drinking Water and Sanitation
DPAP
Drought Prone Area Programme
ELRS
Environmental Law Research Society
FAO
Food and Agriculture Organisation
GOI
Government of India
GRACE
Gravity Recovery and Climate Experiment
Ha
Hectare
ICID
International Commission on Irrigation and Drainage
INCCA
Indian Network for Climate Change Assessment
INCID
Indian National Committee of Irrigation and Drainage
IRAs
Independent Regulatory Authorities
IRAP
Institute of Resource Analysis and Policy
ISWP
Integrated State Water Plan
IWDP
Integrated Wasteland Development Programme
IWMI
International Water Management Institute
IWRM
Integrated Water Resources Management
MGI
McKinsey Global India
Mha
Million Hectares
MoAC
Ministry of Agriculture and Cooperation
MoEF
Ministry of Environment and Forests
MoWR
Ministry of Water Resources
MoUD
Ministry of Urban Development
MTA
Mid Term Appraisal
MUS
Multiple Water Use
MWRRA
Maharashtra Water Resources Regulatory Authority
NAPCC
National Action Plan on Climate Change
NATCOM
India's National Communication to UNFCCC
ii

2 Pages 11-20

▲back to top


2.1 Page 11

▲back to top


NCIWRD
NDMD
NFHS
NRAA
NRDWP
NSS
NUEPA
NUSP
NWDA
NWM
NWP
NWRWS
PIM
PIB
PFI
PHED
PIM
PPM
PPP
PRI
RWLI
SGRY
SoE
TSC
ULBs
UNFCCC
UNICEF
UNWWDR
UTs
UPWMRC
WASH
WATSAN
WB
WES
WHO
WRI
WSP
WUAs
WWP
National Commission on Integrated Water Resources Development
National Disaster Management Division
National Family Health Survey
National Rainfed Area Authority
National Rural Drinking Water Programme
National Sample Survey
National University of Educational Planning and Administration
National Urban Sanitation Policy
National Water Development Agency
National Water Mission
National Water Policy
Narmada, Water Resources ,Water Supply and Kalpsar Department
Participatory Irrigation Management
Public Information Bureau
Population Foundation of India
Public Health Engineering Department
Participatory Irrigation Management
Parts Per Million
Public Private Partnership
Panchayati Raj Institutions
Rural Water Livelihood Index
Sampoorna Grameen Rozgar Yojana
State of Environment
Total Sanitation Campaign
Urban Local Bodies
United Nations Framework Convention on Climate Change
United Nations Children Fund
United Nations World Water Development Report
Union Territories
Uttar Pradesh Water Management and Regulatory Commission
Water, Sanitation and Hygiene
Water and Sanitation
World Bank
Water Entitlement System
World Health Organisation
World Resources Institute
Water and Sanitation Programme
Water Users Associations
Women Water Professionals
iii

2.2 Page 12

▲back to top


1.1 India's Water Budget ..................................................................................................... 1
1.2 Water Resources Potential of River Basins of India ...................................................... 3-4
1.3 Average annual per capita water availability ................................................................. 4
1.4 Major Inter-state River Conflicts in India ....................................................................... 6
1.5 Disaster Risk Statistics for India (1967-2006) ............................................................... 8
1.6 Economic Loss Potential (1967-2006) .......................................................................... 9
1.7 Flood Damages in India ................................................................................................ 10
1.8 Food Grain and Feed Demand Projection .................................................................... 11
1.9 Total Water Requirement for Different Uses ................................................................. 11
2.1 Projected Water Demand (in BCM) for Various Sectors ............................................... 19
2.2 Water Balance in the Major Cities of Madhya Pradesh ................................................. 21
2.3 Physical Coverage of Drinking Water Supply: Five Lowest Covered States ................. 22
2.4 Physical Coverage of Drinking Water Supply: Five Highest Covered States ................ 22
2.5 Comparative Water Use by Industry ............................................................................. 25
3.1 Population Growth During 1991-2011 .......................................................................... 33
3.2 Sewerage Treatment Capacity of Class I and Class II Cities of Some States .............. 34
3.3 Waste and Sanitation Coverage Details of Selected States ......................................... 35
4.1 Top Five Polluted Water Bodies and the BOD Values ................................................... 40
4.2 Summary of Water Supply, Sewage Generation and its Treatment .............................. 44
8.1 Pressures and Drivers for Water Availability, Effects and Probable Solutions .............. 73-74
8.2 The Stakeholders and their Roles and Responsibilities ................................................ 76-77
9.1 Key Sectoral Gaps ........................................................................................................ 79-80
9.2 Key Gaps at Government, Community and Institutional Level in Implementation of
'Water for All' .................................................................................................................. 80-81
iv

2.3 Page 13

▲back to top


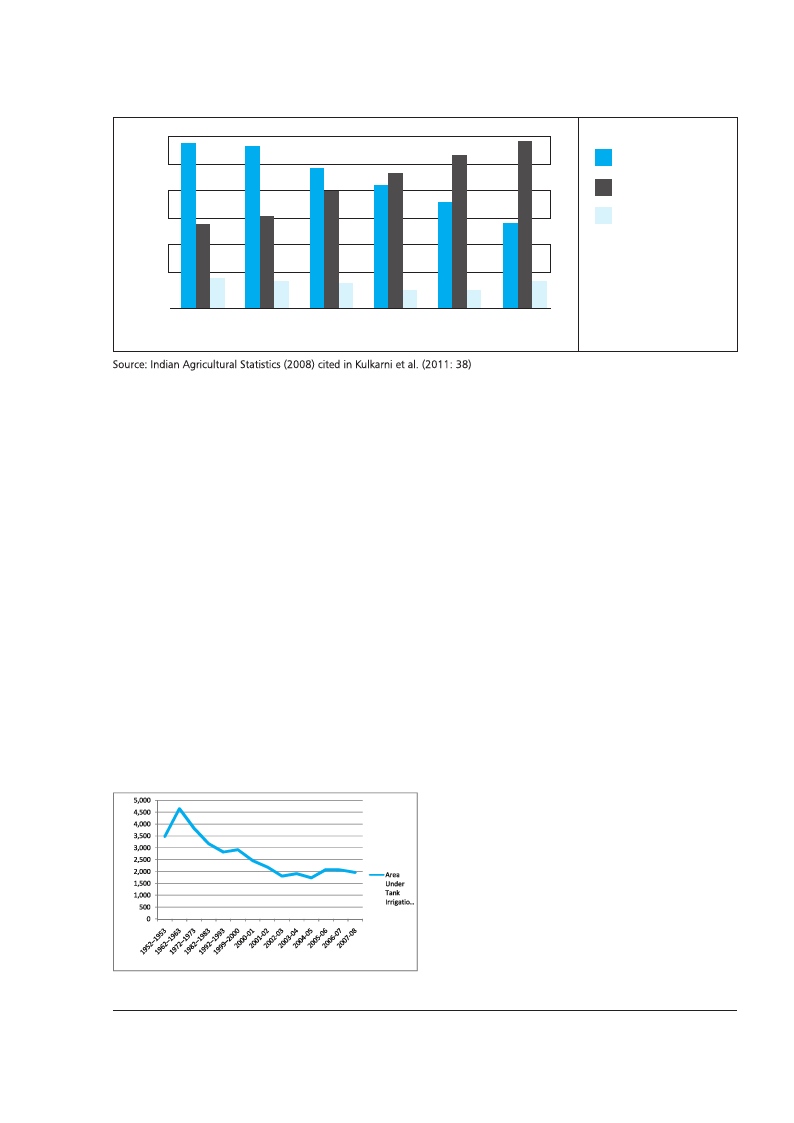
1.1 Decade-wise trend of shares of groundwater and surface water to NIA - an aggregated
National Picture ............................................................................................................... 7
1.2 India's Water Supply and Demand Gap .......................................................................... 8
1.3 Percentage Distribution of Reported Disaster in India (1967-2006) ................................ 9
1.4. Average Annual Economic Loss (USD million) of India ................................................... 9
1.5 Average Hours per day of Water Service in Select Indian Cities (2006) ......................... 13
2.1 Estimated Improved Drinking Water Coverage in Urban and Rural Areas (2008) .......... 20
2.2 Comparative Analysis of Access to an Improved Drinking Water Source (2000-8) ......... 20
2.3 Estimated Sanitation Coverage in Urban and Rural Areas (2008) .................................. 21
2.4 Decade-wise Share of Surface Water and Groundwater in Net Irrigated Area (%) ......... 23
2.5 Net Irrigated Area under Tanks in India since Independence .......................................... 23
3.1 Status of piped water supply and sanitary facility for urban poor and non-poor .............. 35
3.2 Percentage of households (slum and non-slum) with access to improved individual toilet
................................................................................................................................. 36
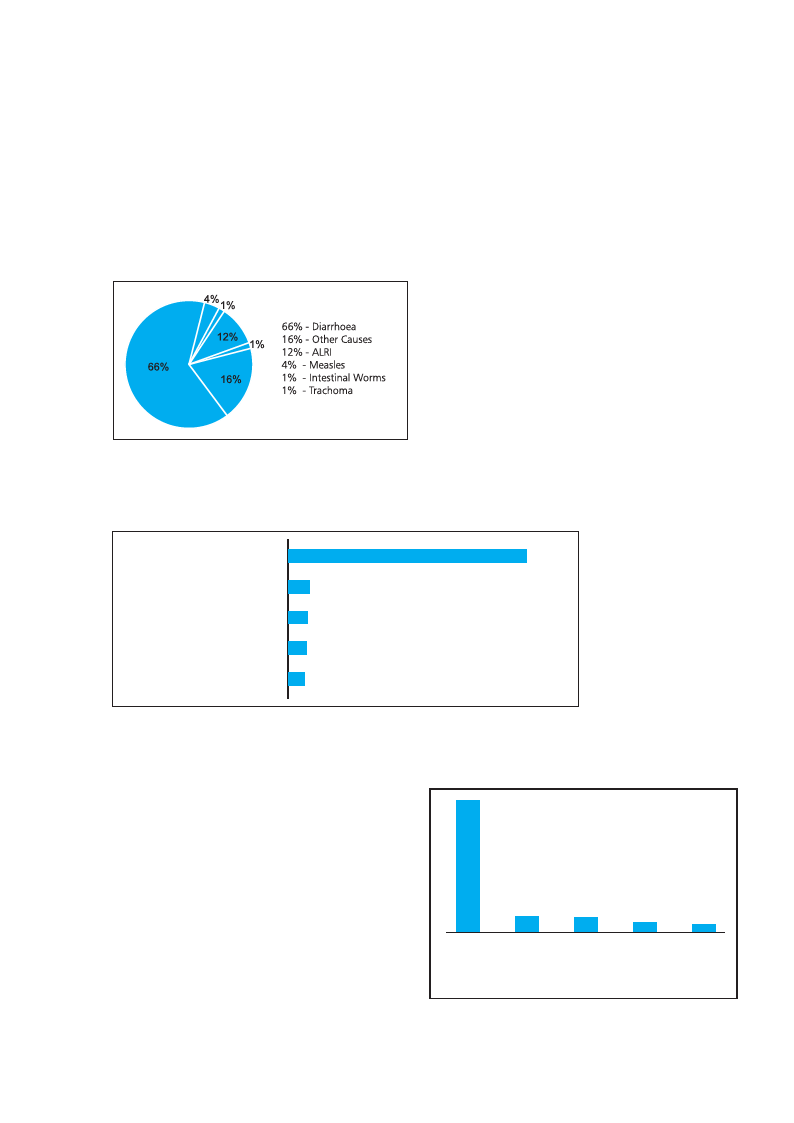
4.1 Distribution of the Health Impact of Inadequate Sanitation by Disease in India (2006) .. 41
4.2 Economic Impact of Inadequate Sanitation in India: Comparison with some Economic
Indicators .........................................................................................................................41
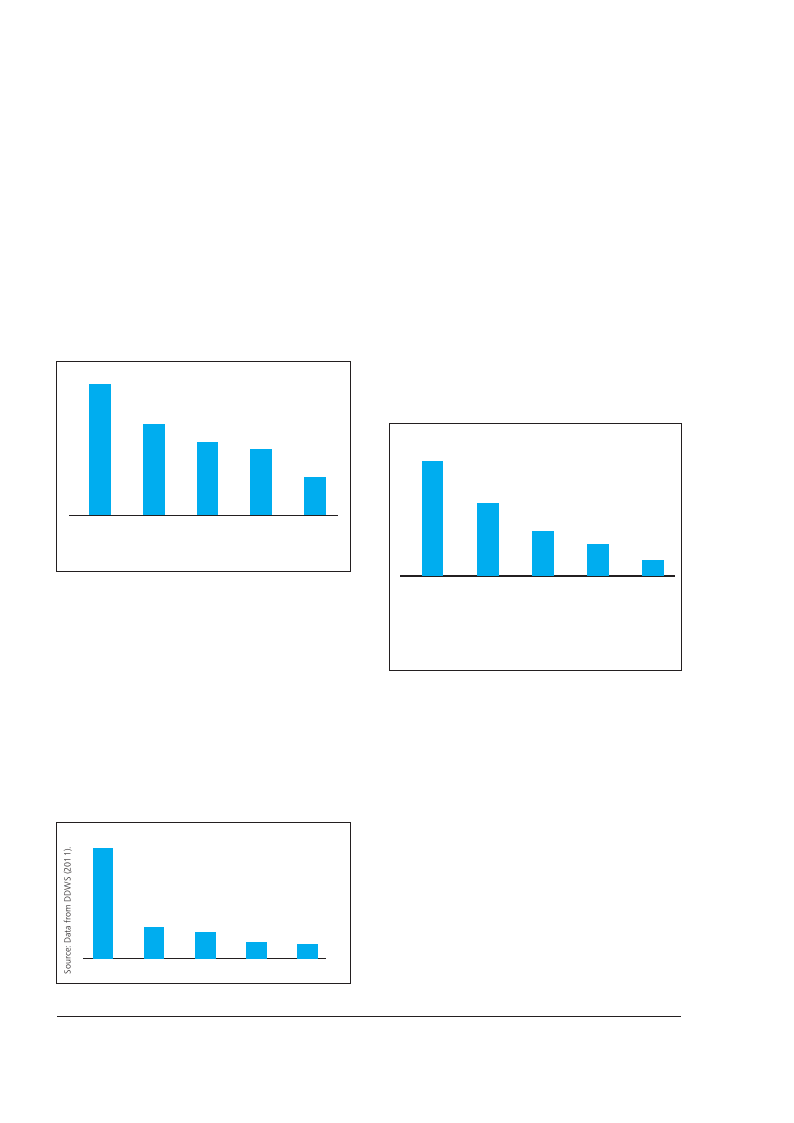
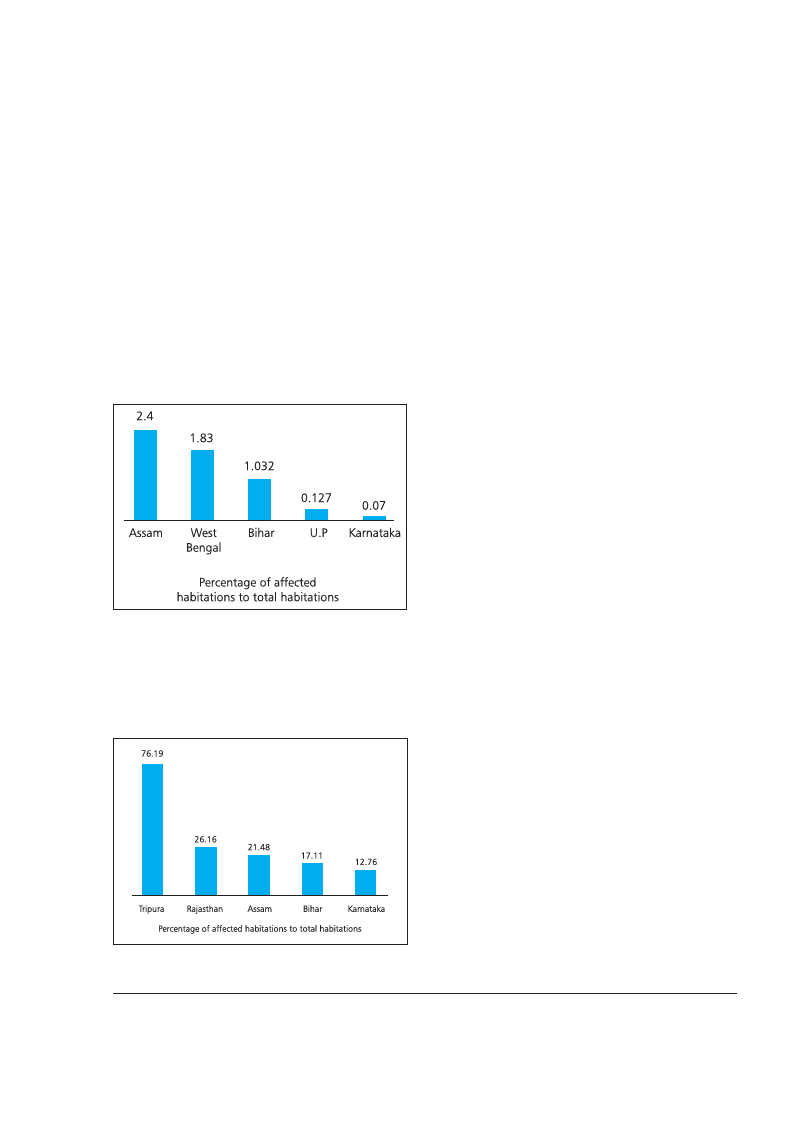
4.3 Top Five Salinity Affected States ..................................................................................... 41
4.4 Top Five Iron Affected States ........................................................................................... 42
4.5 Top Five Nitrate Affected States ...................................................................................... 42
4.6 Top Five Fluoride Affected States .................................................................................... 42
4.7 Top five Arsenic Affected States ...................................................................................... 43
4.8 Top Five Water Quality Affected States in India .............................................................. 43
5.1 WWPs in MJP Technical Hierarchy, Maharashtra (State-level data) ............................... 54
5.2 WWPs in APSIDC Technical Hierarchy, Andhra Pradesh (State-level data) ................... 54
8.1 The Drivers of Change in Water Availability in India ........................................................ 71
v

2.4 Page 14

▲back to top


1.1 The North - east Water Paradox .................................................................................
5
1.2 24x7 Water Supply .....................................................................................................
12
2.1 State of Sanitation Facilities in Government Schools .................................................
22
2.2 Water for Livelihoods: Case of Inland Fisheries .........................................................
25-26
4.1 Pollution Hotspots in India ..........................................................................................
45
5.1 Does Decentralised Water Governance further Gender Justice in India? .................. 50
5.2 The Women's Irrigation Group of Jambar, south Gujarat ........................................... 51
5.3 Community Managed Toilets (CMT) scheme in Tiruchirappalli, Tamil Nadu ............... 52
5.4 Women's Collective Action and Sustainable Water Management ............................... 54-55
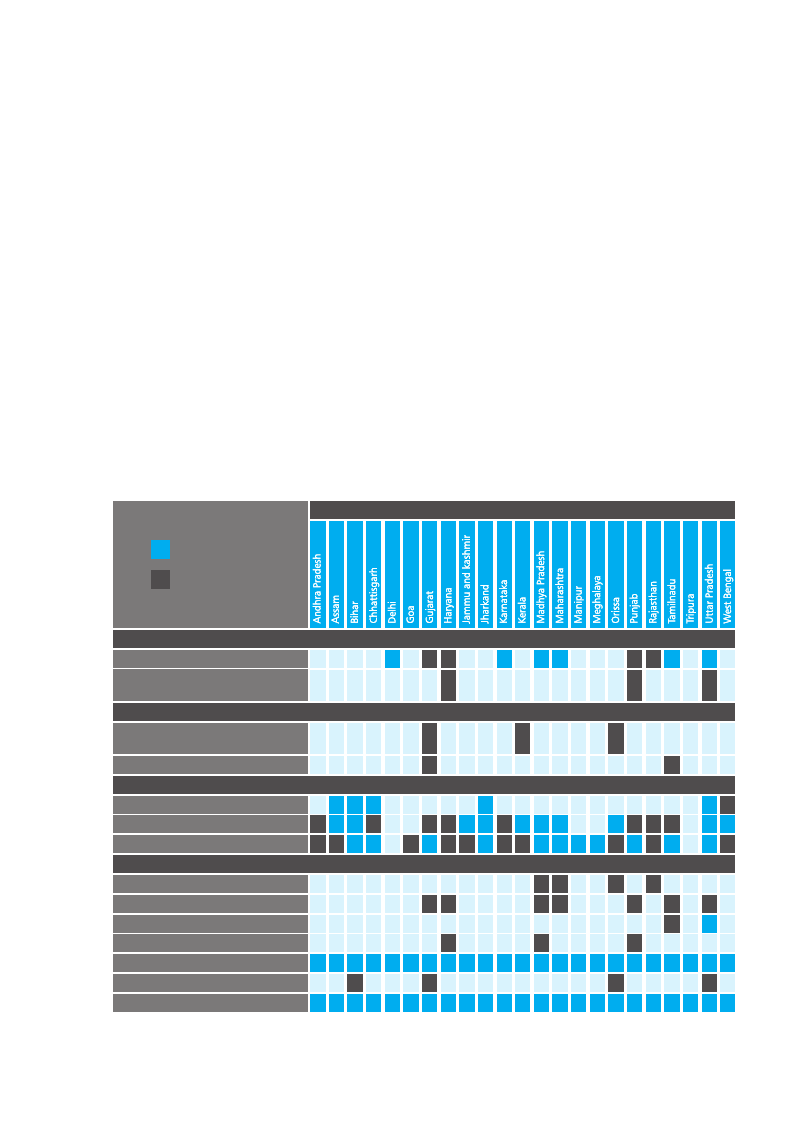
6.1 National Rural Drinking Water Programme ................................................................. 58-59
6.2 Water as a Right .......................................................................................................... 63
vi

2.5 Page 15

▲back to top


Introduction
Since independence, India has made significant
progress in developing its water resources and
supporting infrastructure. Post-independence
years have witnessed large-scale investments in
water storage structures which have contributed
considerably in making India a self-sustaining
economy. Today, India has the capacity to store
about 200 BCM of water, an irrigated area of about
90 Mha, and an installed hydropower capacity of
about 30,000 MW (World Bank, 2005). However,
due to rapid development, increasing population
and iniquitous distribution of water, the demand for
this natural resource far outweighs its supply. In
addition and for a while now, the water sector in
India has faced significant and problematic issues
related to management. In spite of a sizeable water
resource base and vast land resource, India
continues to struggle to meet its water sector
infrastructure requirements, including operation
and maintenance costs. India has about 16 per
cent of the world's population as compared to only
4 per cent of its water resources. With the present
population of more than 1,000 million, the per
capita water availability is around 1,170 cu
m/person/year (NIH, 2010).
Some of the crucial issues faced by the water
sector in India include (a) erratic distribution of
rainfall, often leading to floods and droughts in
various areas; (b) water use inefficiency; (c)
unregulated groundwater extraction; (d) water
pollution; and (e) decreasing water quality due to
poor waste management laws, inter-state river
disputes, growing financial crunch for development
of resources and scarce safe drinking water.
Inadequate institutional reforms and ineffective
implementation of existing provisions also affect
the performance level for water service delivery.
Severe water shortages have led to a growing
number of conflicts between users in the
agricultural and industrial sectors, as also the
domestic sector. The situation is exacerbated due
to the effects of climate change. Future predictions
include worsening of the situation due to a
disturbed hydrological cycle and regional climatic
variability. The lack of water availability and poor
management practices have also manifested in
poor sanitation facilities, one among the biggest
environmental and social challenges India faces
today. A recent study conducted by the Water and
Sanitation Programme (WSP), a global partnership
administered by the World Bank, estimates that
inadequate sanitation causes India 'considerable
economic losses', equivalent to 6.4 per cent of
India's gross domestic product (GDP) in 2006
(US$53.8 billion) (WSP, 2010).
Large-scale dams are now being used to transform
hydropower and irrigation, and yet water storage
infrastructure in India remains one of the lowest in
the world. The governance structure around water
has also undergone considerable change with a
view to be more participative rather than techno-
centric, the latter approach being more of a
hindrance to the development of the Indian water
sector. Apart from the dismal record of managing
water, newer challenges such as climate change
are going to transform the water management
scenario rapidly. A case of the Lower Bhavani
Project (LBP) in the southern state of Tamil Nadu,
India, with a command area of 84,000 ha, is a clear
example, where the most significant uncertainty
factor is rainfall variability. This has led to water
scarcity and a highly unpredictable situation for the
farmers to endure and adapt to seasonal
fluctuations in water availability without canal
supply (UNWWDR4), 2012. It is estimated that the
impact of climate change is significantly larger for
the water sector and therefore newer strategies
have to be evolved to achieve a sustainable
trajectory of growth and development with respect
to water management in the country. The
management of water resources, accompanied by
upgrading the existing water infrastructure, is
therefore among the key challenges. Given the
multiple issues that the water resource sector
faces, it is necessary to re-think the approach to
planning and implementation of the water projects.
Since water is used for multiple purposes, involving
potential users from the start of a project should be
made essential. This would not only help resolve
the conflicting demands, but also help maintain
transparency. It is therefore necessary to have a
comprehensive assessment of India's water sector,
from an inter-disciplinary perspective.
The Millennium Development Goals (MDGs),
through its eight international development goals,
greatly emphasise the need for sustainable access
to safe drinking water and sanitation. Issues of
poverty, education, health and disease are all
directly or indirectly related to water and therefore
response options need to be formulated so that
these goals are achieved effectively. Cases of
better demand management, ensuring balance
among competing water demands, addressing
vii

2.6 Page 16

▲back to top


water rights issues, fair and effective water
governance, water-based partnerships, promoting
sustainable use, water harvesting and
management, all of these need to be addressed
and incorporated in the form of recommendations
towards better water management.
In recent decades, much interest has been
generated in India's water management and policy
matters. The country's comprehensive National
Water Policy (NWP), was formulated in 1987, and
was revised in 2002. In 2012, a draft NWP has been
put up for debate. Critiques point out that the most
striking feature of 2012 NWP is the absence of a
commitment towards Right to Water. Instead, the
overall direction of the policy is to reduce the
involvement of the State and leave out space for
market to operate. Further, it does not recognize
growing inequity in available water as the main
driving force of the current water crisis, not the
absolute water scarcity per se.1
Water is an immensely political issue due to the
nature of the resource. This resource interacts with
a highly inequitable society marked with class,
caste and gender differentiation. Techno-
managerial reforms in the water sector have been
unable to tackle the fundamental issues of inequity
in water supply.2 In this light, the right to water issue
becomes important. India is now a signatory to the
2010 United Nations (UN) declaration of water as a
right. Rights promote the idea of equal
opportunities for all. Rights could also be a useful
strategic instrument, especially in negotiations with
governments and donors (Sangameswaran,
2010). Therefore, a rights-based approach to water
means that communities have the opportunity to
participate in decision making on water-related
projects and plans, and have access to information
concerning water, such as safe hygiene practices
and water quality data. Ensuring right to water
means that the obligation to guarantee that
everyone has access to safe clean water rests with
governments. While lack of both financial and
technical resources is in some cases an important
barrier to a government's ability to ensure access to
water for the entire population, it is crucial to
understand that in most instances other factors
also come into play. Lack of access to safe drinking
water and sanitation can be related to economic,
political and social power imbalances;
discrimination against certain groups or
communities; a government's failure to prioritise
water for the poor; lack of political will; the exclusion
of communities in water and sanitation decision
making; and inadequate legal and policy
frameworks relating to water access and use (FAN,
2010).
The Present Report
This report attempts to provide a comprehensive
analysis of the state of water resource
development and management in India, based on
secondary information. It maps the current
challenges and suggests feasible alternatives
amidst increasing water scarcity and
disenfranchisement of resource bases for the poor
and the marginalised. The issues consolidated
using secondary data are backed by consultations
with major stakeholders. Thus, this report aims at
achieving a holistic and dynamic understanding of
the level of development around water and looks at
the strategic steps required for action. In addition,
major discourses on the subject are also
presented. The focus is to evolve an environment
where water is available for all in a sustainable
manner—safe drinking water for basic needs,
adequate water for agriculture, water for industry
and for the ecosystem. Thus, it encompasses both
a depiction of the state of freshwater resources and
potential problems and progress towards identified
goals, including workable solutions.
Methodology and Structure of the Report
This report is developed at three levels. Level one
focuses on the status of water resources, including
water availability, demand, water quality, and
issues such as access to water and sanitation
collected through secondary sources followed by
the analysis. Secondary data was collected
through available information, government records
and census reports (Chapters 1 to 6). The second
level includes documentation of successful water
management cases which point towards
sustainable management and efficient utilisation of
the resource (Chapter 7). The third level is based
on consultations at the regional level on issues
arising out of the secondary data analysis
(Chapters 8 and 9). In total, five consultation
workshops were organised in the north, south,
east, west, and north-east. The
consultation workshops were attended by experts,
government representatives, civil society
members, and grass-roots non-governmental
organisations (NGOs) who discussed and
deliberated various solutions and alternatives.
The report is in three sections. Section A maps the
status of water resources in the country in terms of
1Excerpts of consultations at UN Solution Exchange Network - Water Community of practice - Query and feedback on Draft National Water
Policy 2012.
2Prakash and Sama (2006) document one such experience from Gujarat where water access is intertwined with caste and gender
relationships. The authors observed 'that power structure and social and economic hierarchy go hand in hand and unless the issue of resource
inequity is tackled through policy and advocacy means, the real issue will not be solved'.
viii

2.7 Page 17

▲back to top


quality and quantity of available water and
evaluates the major trends and shifts. It also looks
into the issue of climate variability and its impact,
present and future, on the limited water resources
at our disposal. Section B analyses the water
needs and demands and attempts an
understanding of the changes required. Further, it
looks into the multipurpose nature of water with a
focus on problem areas and suggests means to
incorporate the issues into the policy debates. In
addition, it explores the pressures and drivers of
change. Section C focuses on stakeholders'
responses to the question: What can be done to
reach the goal of water for all? It subsequently
provides a framework for workable solutions and
provides a way forward with specific
recommendations for ensuring water for all.
Key Messages from this Report
1. New indices are needed to measure available
water resources: The calculations of per capita
water availability do not include disparity in water
allocation and access. This disparity is identified as
a major determining factor for water access and
use. The per capita water availability does not take
into account the temporal and spatial variability in a
vast country like India that has varied socio-
ecology.3 These data are the starting points of
policy initiatives in the country and therefore any
ambiguity in identifying the magnitude of the
problem will only hamper workable solutions to it.
The validity of the per capita water availability index
needs to be rethought in the light of social and
economic disparities in water usage that exist in
India. On the same grounds, putting forward the
argument that increase in population leads to water
scarcity needs rigorous debate. A farmer's need of
water for basic livelihood support often gets
mingled with wasteful water uses of high-end
consumers. Therefore, as a point of departure from
this orthodox concept, some new indices should be
developed and used which are able to capture the
underlying differences in water access.
2. Water demand is far exceeding supply and
leading to inter-sectoral conflicts: Myopic
approaches in attaining food security are risking
agricultural sustainability by encouraging
increased use of water. The water demand from
agriculture is set to increase tremendously and will
have to be met to ensure food security in a high
consumption scenario. The concept of inter-state
virtual water transfer also needs emphasis. The
states with lower availability of water resources end
up being the net exporters of virtual water to the
water surplus states. With the current rate of
industrial expansion in the country, the water
demand from this sector will also escalate in future.
Present experiences also suggest increasing inter-
sectoral conflicts in the country. It is imperative to
initiate efforts for designing an appropriate
industrial water use policy which could provide a
framework for sustainable water use by this sector.
Multiple uses of water and the traditional water
allocation priorities and quantities also need to be
revisited. The concept of scarcity and surpluses of
water must look beyond State Boundaries, as with
a more disaggregated assessment, these
comparisons will surely change.
3. The time bomb of increasing water pollution is
ticking: Water quality issues in India have reached
an alarming proportion. Augmenting water supply
to achieve the MDG targets will not suffice until its
quality is ensured. There is no model in India that
shows best ways to tackle the waste water
generated through the industrial and domestic
sectors. The economic implications of poor
sanitation in urban India and its impact on water
quality are profound. The agencies responsible for
checking industrial pollution have failed. Pollution
has reached an alarming level and contributes to
water scarcity by polluting freshwater resources.
This situation needs to be addressed soon.
4. To achieve any headway in gender-sensitive
policies, data disaggregation is urgently required:
An analysis of the water sector is incomplete
without an understanding of the inter-relations
between gender and water. In India, gender
intersects with class and caste and produces
layered social hierarchies that impinge on one's
access to, and control over, a precious resource,
water. Gender and water issues remain at the level
of rhetoric for the want of a broad based and shared
understanding, without any support from the
ground data on changing gender and social
relations. The issue of gender disaggregated data
needs to be taken up as priority by the state for any
progress to be made in mainstreaming gender in
water resources management. Apart from the
mainstreaming gender in water-related projects,
another major issue is about how to tackle gender
mainstreaming at the organisational level. The
bureaucratic set-up that manages water also
suffers from serious inadequacies with respect to
gender mainstreaming. Without addressing these
issues, well-meaning gender inclusion efforts will
not lead to logical and intended outcomes. These
will have to be addressed at the earliest.
5. Reorientation and capacity building required for
technocrats for a new vision for water
3This report doesn't suggest a particular index but encourages academicions and policy makers to think beyond current indices used. For
example, an index developed by Lawrence et al (2002) called the International Water Poverty Index, This index is created in an interdisciplinary
measure which links household welfare with water availability and indicates the degree to which water scarcity impacts on human
populations. Such an index makes it possible to rank countries and communities within countries taking into account both physical and socio-
economic factors associated with water scarcity.
ix

2.8 Page 18

▲back to top


management: Educating technocrats working in
various water - and environment-related
departments with integration skills is the need of
the hour. Present day engineers with their
backgrounds in engineering education are
incapable of resolving certain issues, for example,
of everyday water supply. Once hired, these
engineers have limited access to resources to
refresh their existing knowledge and/or to acquire
new knowledge for water management. In addition
to the issue of the changing paradigm for water
education in India, there appears to be lack of
coordinated and concerted effort in training in-
service engineers on the new vision of water
management. Most of the engineers have received
training from government-funded institutes that
lack participatory methodology in imparting key
messages and encouraging participants to
understand the need for training and capacity
building. India's water sector, dominated by
engineers, has to see this change. Senior officials
have often enunciated the need for more
'community involvement' but this has not translated
into action on the ground for various reasons. A new
set of capacity-building programmes and
envisioning is required for technocrats to deal with
present day water problems. An evaluation of
current training program can inform the key gaps in
training and education and provide the lead for
further action.
References
Freshwater Action Network (FAN). 2010. Right to Water
and Sanitation: A Handbook for Activists. UK: Freshwater
Action Network.
Lawrence, Peter, Jeremy Meigh and Caroline Sullivan
(2002). The Water Poverty Index: An International
Comparison. Keele Economic Research Papers. Keele
University. Keele. UK. Paper available at:
citeseerx.ist.psu.edu/viewdoc/download?doi=10.1.1.19
6. [Accessed on April 23, 2012]
National Institute of Hydrology (NIH). 2010. Water
Resources of India. Roorkee, Uttarakhand: National
Institute of Hydrology.
Prakash, A. and R.K. Sama. 2006. 'Contending Water
Uses: Social Undercurrents in a Water-Scarce Village',
Economical and Political Weekly, vol. 41, no. 7, pp. 577-
79.
Sangameswaran, Priya. 2010. 'Review of Right to Water:
Human Rights, State Legislation, and Civil Society
Initiatives in India', Centre for Interdisciplinary Studies in
Environment & Development. Bangalore, India.
UNWATER. 2012. The United Nations World Water
Development Report 4: Managing Water under
Uncertainty and Risk, Volume 1. Available at:
http://www.unesco.org/new/en/natural-sciences/
environment/ water/wwap/ wwdr /wwdr4-2012/.
Water and Sanitation Programme (WSP). 2010. 'The
Economic Impact Of Inadequate Sanitation In India'.
Available at:
http://www.Wsp.Org/Wsp/Sites/Wsp.Org/Files/Publicati
ons/Wsp-Esi-India.Pdf [Accessed on 10 April 2011.]
World Bank. 2005. India's Water Economy: Bracing For a
Turbulent Future. Washington DC: World Bank.
x

2.9 Page 19

▲back to top


1.1 Water Availability
India is the second most populated country in the
world with over 1.2 billion people (Census of India,
2011). Water in India is intricately intertwined with
the cultural fabric of the country, and has both
economic and social connotations. Several
attempts have been made to estimate the country's
available water resources and the total estimated
water budget varies considerably. Official
estimates of the Ministry of Water Resources
(MoWR) have put total utilisable water at 1,123
billion cubic metres (BCM)4 as against the current
use of 634 BCM, reflecting a surplus scenario
(Planning Commission, 2010). Narsimhan (2008)
calculated the water budget using an
evapotranspiration rate of 65 per cent as against
the 40 per cent5 used in official estimates. The
utilisable water for human use thus comes out to be
654 BCM, which is very close to the current actual
water use estimate of 634 BCM reflecting an
alarming situation (ibid.). Table 1.1 gives the
comparative picture of the water budget as per the
two estimates. It is pertinent to note that there
exists a considerable temporal and spatial variation
within the country with respect to water availability.
For instance, the Ganga-Meghna-Brahmaputra
basin covers a land area of 33 per cent and
accounts for 60 per cent of India's water resources,
while the catchment of rivers flowing west is 3 per
cent and they account for 11 per cent of the
country's water resources. Therefore, 71 per cent
of India's water resources are available to only 36
per cent of the area while the remaining 64 per cent
has 29 per cent available (Verma and Phansalkar,
2007). Various estimates point to a widening gap
between water demand and supply in the future.
For example, in the base case scenario developed
Table 1.1: India's Water Budget
Annual rainfall
Evapotranspiration
Surface runoff
Groundwater recharge
Available water
Utilisable water
Current water use
Remarks
Analysis based on MoWR
Analysis based on MoWR Estimates
based on worldwide comparison
(Values in BCM)
3,840
3,840
3,840-(1,869+432)=1539 (40%)
3,8402,500 (65%) World-wide
comparison
1,869 (48.7%)
432(11.3%)
Not used in estimate
2,301 (60%)
1,123 (48.8% of 2,301)
1,340 (35%)
654 (48.8% of 1,340)
634
634
Current use (634) well below 1,123 Current use (634) well below 654
Source: Narsimhan (2008), cited in Planning Commission (2010: 427)
4This is based on the Central Water Commission's (CWC) estimation of India's water resource potential as 1,869 BCM.
5This rate is in agreement with worldwide figures of 60 to 90 per cent.
1

2.10 Page 20

▲back to top


by 2030 by the Water Resources Group, India
faces a large gap between current supply and
projected demand, amounting to 50 per cent of
demand or 754 BCM (Addams et al., 2009).
Critiques argue that the way in which India's water
budget has been calculated, is highly aggregated
and gross which does not lead to much of decision
making. Garg and Hassan (2007) reveals that the
assessment of utilisable water resources of India
are overestimated to the range of 66 to 88%. The
authors estimate the utilisable water resources as
668 BMC, much less than the estimates of CWC,
NCIWRD and National Water Policy of India.
The report of the working group on water database
development and management for the 12th five
year plan (2012-2017) by the planning commission
documents the historical account of this. “In the
1950's, A.N. Khosla, who headed the then newly
constituted Central Water and Power Commission
(CWC), used an empirical equation relating surface
run-off to rainfall and evaporation (postulated as a
function of temperature) to estimate average
annual water resources potential in six regions.
Subsequently, the CWC sought to assess the water
resources potential in major basins. Studies based
on statistical analysis of flow data wherever
available and rainfall–run-off relations were done
for 23 basins and sub-basins between 1952 and
1966, and for some major peninsular rivers and the
Ganges and Brahmaputra basins during the 70s. At
that time the needed data on rainfall, terminal
discharge observations, and validated
rainfall–surface flow relationships were limited. In
the early 90s, the conceptual framework for
assessing water resources availability for several
basins was refined on the basis of observed
outflows at the terminal site for upstream extraction
of surface water, reservoir evaporation and return
flows, and taking explicit account of the contribution
of groundwater recharge and interactions between
surface and groundwater. For some large basins,
estimates adopted by tribunals ((Narmada,
Godavari, Mahanadi and Cauvery) and those
based on special studies (Ganges and
Brahmaputra) were used. Subsequent reviews by
the National Commission for Integrated Water
Resources Development (NCIWRD) and an
internal group of the CWC followed the same
procedures and more or less endorsed the 1993
estimates of the country's water potential.
In any event, the estimates of overall water
resources potential for the country made at
different times have remained more or less the
same. The CWC is currently engaged in a joint
project with National Remote Sensing Centre
(NRSC) to develop and test a water balance
approach using remote sensing data for assessing
overall water potential in two basins. It is also
important to undertake rigorous analysis of
rainfall–run-off relations in different regions using
up-to-date data, ensuring that estimates of
upstream extractions are based on reliable
measurements, conducting systematic surveys to
determine the magnitude of groundwater actually
pumped, consumption for various non-agricultural
uses, and other components of the balance
equation. Estimates of overall water resources
potential cover both surface flows and
groundwater. Though these two sources are
interrelated, estimates of their individual
contributions, both overall and to utilizable
volumes, are made independently by the CWC (for
surface water) and the CGWB (for groundwater).
Since interactions between these sources are
significant, the sum of these two estimates cannot
be taken as a measure of the total volume of
available and utilizable water resources. It is
essential that this exercise be done jointly by these
two bodies.” (Planning Commission, 2011: ii-iii)
1.2 Water Resources
According to the National Environment Policy
(NEP) 2006:
“India's freshwater resources comprise the single
most important class of natural endowments
enabling its economy and its human settlement
patterns. The freshwater resources comprise the
river systems, groundwater, and wetlands. Each of
these has a unique role and characteristic linkages
to other environmental entities. (MoEF, 2006: 28)”
The following section provides a brief overview of
the available water resources and related issues.
We begin with an overview of rainwater, and then
move onto surface and groundwater resources.
1.2.1 Rainwater
The long-term average rainfall for the country is
1,160 mm, which is the highest in the world for a
country of comparable size.6 Owing to
physiographic factors, rainfall in India is highly
variable. For example, in 2008, rainfall measured
from about 500 mm in east and west Rajasthan to
3,798 mm in coastal Karnataka (CWC, 2010). India
ranks first among rain-fed agricultural countries in
terms of both extent (86 Mha) and value of produce
(Amarsinghe and Sharma, 2009). More than 80 per
cent of the annual run-off of the rivers occurs in the
monsoon months of June to September, often
causing floods. However, acute water shortage is
faced in many parts of India during the rest of the
year. Even in areas such as Cherrapunjee in
Meghalaya, where there is surplus rainfall, the soil
may not be able to retain the water for long thereby
6Lal (2001) cited in Kumar et al. (2005)
2

3 Pages 21-30

▲back to top


3.1 Page 21

▲back to top


causing water scarcity (Bandyopadhyay et al.,
1998). In India, rain-fed agro-ecologies contribute
56.7 per cent of the net sown area, 40 per cent of
the foodgrain production, and 66 per cent of the
livestock. About 85 per cent of coarse cereals, 83
per cent pulses, 42 per cent rice, 70 per cent
oilseeds and 65 per cent cotton are cultivated as
rain-fed (CRIDA, 2011: 31). In addition, they are
substantial means of providing livelihood, income,
employment and environmental security. During
1985-95, the growth rate in un-irrigated areas was
higher than that of irrigated areas. A study by Bhatia
(2005)7 showed that the crop yield per hectare from
irrigated land was consistently much higher than
the yield from rain-fed agriculture.
1.2.2 Surface Water Resources
Surface water resources comprise of rivers and
inland water resources like lakes, tanks, canals,
ponds, reservoirs, etc. They are crucial for
ecosystem services as well as for providing
livelihood support to a large section of the
population.
1.2.2.1 Rivers
Of the many rivers in India, 12 are classified as
major rivers whose total catchment area is 252.8
Mha. Among the major rivers, the Ganga-
Brahmaputra-Meghna system is the biggest with a
catchment area of about 110 Mha (CWC, 2010).
The other major rivers with catchment areas of over
10 Mha are the Indus (32.1 Mha), Godavari (31.3
Mha), Krishna (25.9 Mha) and Mahanadi (14.2
Mha) (ibid.). The catchment area of medium rivers
is about 25 Mha. Since independence, India has
made significant progress in increasing the storage
potential of the available water by building dams on
various rivers. A total storage capacity of 212.78
BCM has been created in the country through
major and medium projects. The projects under
construction will contribute to an additional 76.26
BCM, while the contribution expected from projects
under consideration is 107.54 BCM (ADB, 2009).
The entire country was divided into twenty river
basins/group of river basins comprising twelve
major basins: 1.Indus; 2.Ganga-Brahmaputra-
Meghna, 3.Godavari, 4. Krishna, 5.Cauvery,
6.Mahanadi, 7.Pennar, 8.Brahmani-Baitarani,
9.Sabarmati, 10.Mahi, 11.Narmada and 12.Tapi
each of these basins combining suitably together
all the other remaining medium and small river
basins are: 1.Subernarekha - combining
Subernarekha and other small rivers between
Subernarekha and Baitarni, 2. East flowing rivers
between Mahanadi and Pennar, 3. East flowing
rivers between Pennar and Kanyakumari, 4.Area of
inland Drainage in Rajasthan Desert, 5.West
flowing rivers of Kutch and Saurastra including
Luni, 6.West flowing rivers from Tapi to Tadri,
7.West flowing rivers from Tadri to Kanyakumari
and 8.Minor rivers draining into Myanmar(Burma)
and Bangladesh.
After accounting for the natural process of
evaporation etc., the average annual water
resources potential in the country was assessed as
1869 BCM and given in the report entitled
‘Reassessment of Water Resources Potential of
India’ (1993). It is estimated that owing to
topographic, hydrological and other constraints,
the utilizable water is 1123 BCM which comprises
of 690 BCM of surface water and 433 BCM of
replenishable ground water resources. A table
showing the average annual water resources
potential river basin-wise is given below.
The per capita average annual water availability in
the country is reducing progressively due to
increase in population. The average annual per
capita availability of water in the country taking into
consideration the population of the country as per
the 2001 census, 2011 census and the population
projections for the year 2025 and 2050 is as under:-
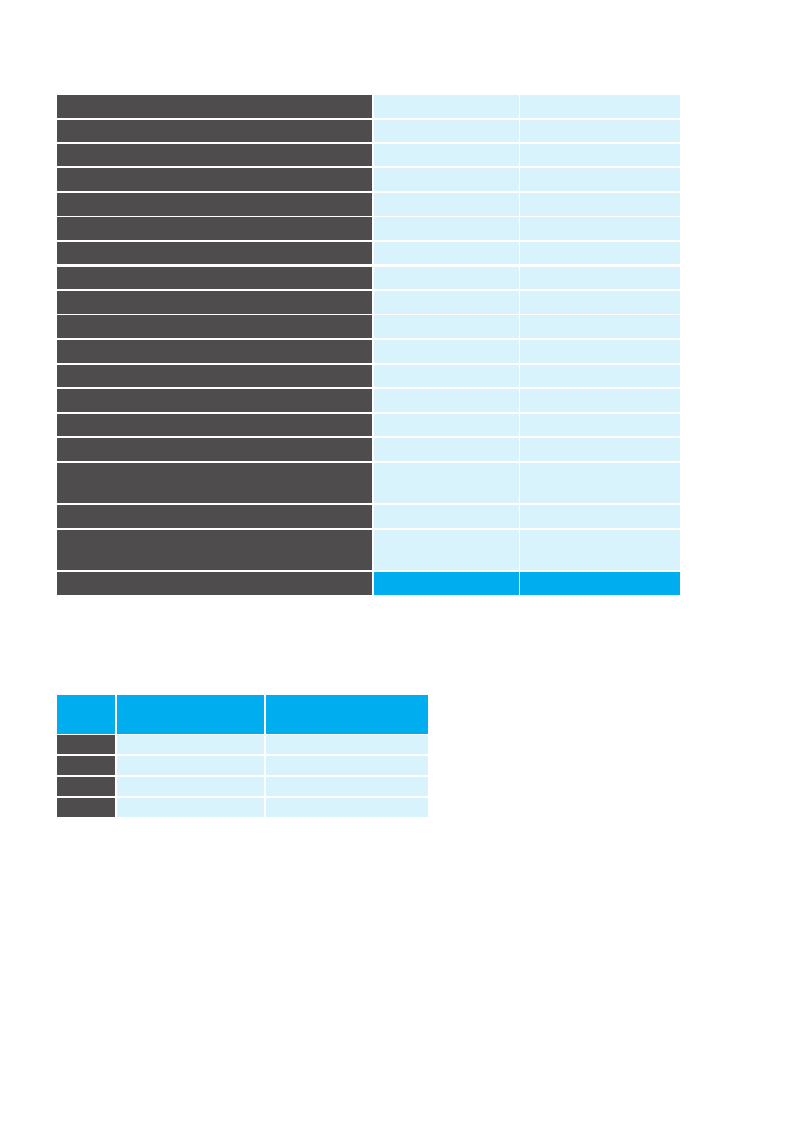
Table 1.2: Water Resources Potential of River Basins of India
River basin
Indus
Ganga-Brahmaputra-Meghna
a. Ganga
b. Brahmaputra
c. Barak & others
Catchment area
(Sq.Km)
321289
861452
194413
41723
Average Water Resources
Potential (BCM)*
73.3
525
537.2
48.4
7Cited in World Bank (2005: 15)
3

3.2 Page 22

▲back to top


Godavari
Krishna
Cauvery
Subernarekha
Brahmani-Baitarni
Mahanadi
Pennar
Mahi
Sabarmati
Narmada
Tapi
West Flowing Rivers from Tapi to Tadri
West Flowing Rivers form Tadri to Kanyakumari
East Flowing Rivers between Mahanadi and Pennar
East Flowing Rivers between Pennar & Kanyakumari
West Flowing Rivers of Kutch and Saurashtra
including Luni
Area of Inland Drainage in Rajasthan
Minor Rivers draining into Myanmar (Burma) and
Bangladesh
Total
Source: CWC, 1993
312812
258948
81155
29196
51822
141589
55213
34842
21674
98796
65145
55940
56177
86643
100139
321851
36302
110.5
78.1
21.4
12.4
28.5
66.9
6.3
11
3.8
45.6
14.9
87.4
113.5
22.5
16.5
15.1
Negl.
31
1,869.4
Table 1.3: Average annual per capita
months of the monsoon season. Brahmaputra,
Barak and Ganga accounts for as much
Year
Per capita Average Annual as 60% of the total flow causing recurring
Population (Million)
Availability (m3/year) floods. At the same time large areas in
2001
1029 (2001 census)
1816
Rajasthan, Gujarat, Andhra Pradesh,
Karnataka and Tamil Nadu get scanty
2011
1210 (2011 census)
1545
rainfall and face drought like condition.
2025
2050
1394 (Projected)
1640 (Projected)
1340
1140
While per capita water availability in
Brahmaputra and Barak basin is very
high, it is low in the river basins such as
Sabarmati, west flowing rivers in Kutch
A per capita availability of less than 1700 cubic
metres (m3) is termed as a water-stressed condition
while per capita availability below 1000m3 is termed
and Saurashtra including Luni, Cauvery, Pennar,
etc.
as a water scarcity condition.
To address the spatial inconsistencies in overall
available water resources, the concept of
The per capita water availability figures given
developing a national grid by linking the river
above are the national average figures while the
systems was proposed in the early 1970s. The
position is quite different in the individual river
National Water Development Agency (NWDA) set
basins. As mentioned above, distribution of water
up in 1982 by the Government of India (GoI)
resources in space and time is highly uneven.
worked out the possibilities of storage, links and
Majority of the runoff is generated during the 3-4
transfer but the ambitious project reached an
4

3.3 Page 23

▲back to top


impasse as the concept of river interlinking is
vehemently debated and awaits consensus. The
per capita water availability of many river basins is
declining over the years due to sustained
pressures of population, agriculture and industrial
expansion ( also see box 1.1 on water scarcity in
north-eastern states). Pennar, Sabarmati and east
flowing rivers are believed to face acute water
scarcity with per capita availability of water less
than or around 500 cu m during 2010 (CWC, 2010).
Water quality has also been affected because
many stretches of rivers pass through industrial
towns
Box 1.1: The North–east Water Paradox
The country's north-east, comprising eight states –
Assam, Arunachal Pradesh, Manipur, Meghalaya,
Mizoram, Nagaland, Tripura and Sikkim is known
for its unique cultural and biological diversity. In the
north-east consultation workshop held during the
preparatory phase of this report at the Indian
Institute of Technology (IIT) in Guwahati, the
participants were unanimous in their views against
projecting the north-east as a water surplus region,
based on statistical data, since acute water
shortages are emerging at the local level. There
was a consensus among the participants that the
physical surplus of water in the north-eastern
region has for long given the rest of the country
misconstrued notions about the water availability
scenario in the region. Citing examples of cities like
Shillong and Kohima they noted that unplanned
urbanisation had led to some cities facing water
scarcity and any upcoming policy planning in the
region should recognise this at the outset. The
participants expressed their concern over lack of
coordination among the north-east states on water
resource planning, an issue which will need to be
addressed in order to make any headway in
designing an integrated water resource
management framework for the region. Another
concern common across all the seven states was
the large-scale damming of the region. The
participants proposed the Enactment of National
Water Security Act from three perspectives:
Ÿ The human rights, including health,
perspective, thereby insuring there be a
provision for clean water required for drinking
and domestic uses.
Ÿ The livelihood perspective, thereby ensuring
water for the livelihood of all.
Ÿ The ecological perspective, thereby ensuring
protection of rivers, wetlands, lakes, water
bodies, etc., and declaring some of the
rivers/tributaries in each state as a 'NO GO
ZONE' where no dams, barrages, or
hydropower will be allowed.
Source: Culled out from responses of participants at multi-
stakeholder's workshop at IIT Guwahati, August 5, 2010
8Cited in Shankar (2009: 37)
1.2.2.2 Other Water Bodies
Inland water resources of the country are classified
as rivers and canals, reservoirs, tanks, lakes and
ponds, derelict water, and brackish water. These
water sources are crucial support systems for a
large percentage of the population especially that
of rural areas where they are recognised as
common property resources. They are sources
from which a large number of poor and deprived
communities derive economic and non -economic
benefits. Other than rivers and canals, total water
bodies cover an area of about 7.4 Mha. Of the rivers
and canals, Uttar Pradesh occupies the first place
with 31.2 thousand km stretches, which is about 17
per cent of the total length of rivers and canals in the
country, followed by Jammu and Kashmir and
Madhya Pradesh. Among the remaining inland
water resources, reservoirs have maximum area
(2.9 Mha) followed by tanks, lakes and ponds (2.4
Mha) (CWC, 2010). Most of the area under tanks,
lakes and ponds lies in states of Andhra Pradesh,
Karnataka, Arunachal Pradesh and West Bengal.
These states account for 56 per cent of the total
area under tanks and ponds in the country (ibid.).
As far as and cities and are thus being severely
polluted (for example, the Ganges in Kanpur and
the Yamuna in Delhi). According to estimates,
uncontrolled discharge of untreated
domestic/municipal wastewater has resulted in
contamination of 75 per cent of all surface water
across India (MoUD, 2009).
In the backdrop of unsustainable development and
increasing population pressure, many inter-state
conflicts over river water have emerged, with the
states involved claiming a greater share in the
water or the benefits associated with it. The details
of some of the major inter-state water issues are
given in Table 1.4. With the growing situation of
contending water uses, these conflicts can only be
expected to escalate in future.
1.2.3 Groundwater
India is the largest consumer of groundwater in the
world with an estimated usage of 230 km3 per year
(World Bank, 2010a). Approximately 60 per cent of
the demand from agriculture and irrigation, and
about 80 per cent of the domestic water demand, is
met through groundwater (ibid.). As per the
Department of Drinking Water and Sanitation
(DDWS)8 nearly 90 per cent of the rural water
supply is from groundwater sources. The last
estimation of groundwater resources in the country
was carried out in 2004 by the Central Ground
Water Board (CGWB). According to it, the total
annual replenishable groundwater resource of the
country was 433 BCM at the time. The groundwater
resources available for irrigation was 369.6 BCM,
while for industrial, domestic and other purposes it
5

3.4 Page 24

▲back to top


Table 1.4: Major Inter-state River Conflicts in India9
Rivers
Krishna
States concerned
Date of reference to
the tribunal
Decision of the tribunal
Maharashtra, Andhra Pradesh,
Karnataka
April 1969
May 1976
Godavari
Maharashtra, Andhra Pradesh,
Karnataka, Madhya Pradesh
and Orissa
April 1969
July 1980
Narmada
Ravi and Beas
Cauvery
Rajasthan, Madhya Pradesh,
Gujarat, Maharashtra
Punjab, Haryana and Rajasthan
Kerala, Karnataka, Tamil Nadu
and Puducherry
October 1969
April 1986
June 1990
December 1979
Krishna
Karnataka, Andhra Pradesh and June 1990April 2004
Maharashtra
Madel/Mandovi/
Goa, Karnataka and Maharashtra
November 2010
Mahadayi
Vamasadhara Andhra Pradesh and Orissa
February 2010
Periyar10
Tamil Nadu and Kerala
Godavari
(Bhabli Barrage) Maharashtra and Andhra Pradesh
Source: ADB (2009), updated with information available on Periyar River and Bhabli Barrage, 2011
was 71 BCM (CWC, 2009). These figures however
do not project the actual situation of groundwater
due to its highly skewed distribution across the
country. The notion of groundwater as a private
resource, the rights of which are associated with
land rights, has led to an exploitative extraction
regime. Since the 1970s, groundwater irrigation
has been expanding at a very rapid pace in India.
According to Shah (2009: 4): “Until [the] 1960s,
Indian farmers owned just a few tens of thousands
of mechanical pumps using diesel or electricity to
pump water; today India has over 20 million
modern water extraction structures. Every fourth
cultivator household has a tube well; and two out of
the remaining three purchased irrigation services
are supplied by tube well owners.”
The National Sample Survey's (NSS) remote
sensing data suggest that as much as 75 to 80 per
cent of the country's irrigated area is served by
groundwater wells (Shah,2009). This
unsustainable level of exploitation has put the
groundwater resources at great peril, lowering the
groundwater table in many areas and causing
saline water intrusion in various parts of the
country. A growing demand for water coupled with
unreliable public supply schemes has led to a
growing dependence on the groundwater sources
in the country whereby it is being extracted not only
through the municipal water utilities but also by
private owners through borewells and pumps. The
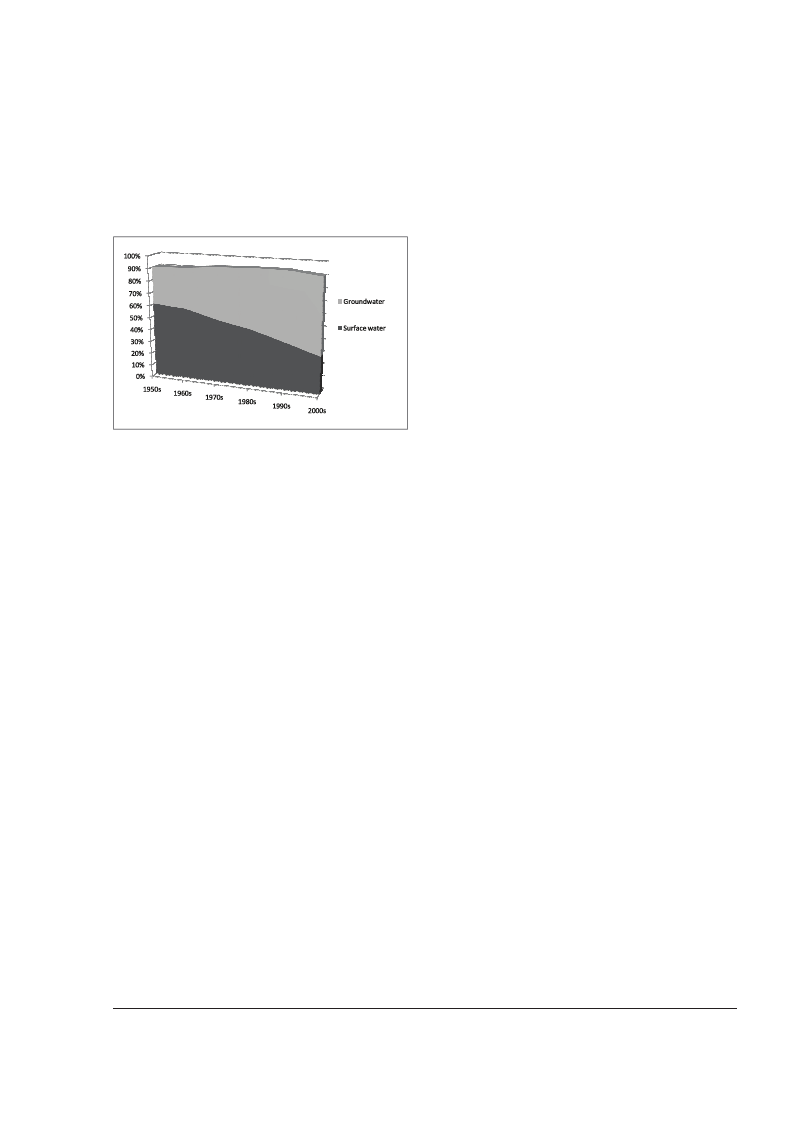
share of groundwater in the net irrigated area has
changed drastically during last couple of decades
(see figure 1.1) using data imagery from NASA's
Gravity Recovery and Climate Experiment
satellites (GRACE), Rodell et al. (2009)11 showed
that during 2002-2008, three states (Punjab,
Haryana and Rajasthan) together lost about 109
km3 of water leading to a decline in the water table
to the extent of 0.33 m per annum. According to
Shankar et al. (2011), in a span of nine years (from
1995 to 2004) the rate of groundwater withdrawal
9The blank columns indicate the tribunals that have either not been formed or are awaiting a decision.
10For both, the Mullaperiyar dam issue over Periyar and Bhabli Barrage over Godavari, Supreme Court hearing has already commenced
and is in different stages.
11Cited in Kulkarni et al. (2011: 38).
6

3.5 Page 25

▲back to top


reached an 'unsafe’12 level in 31 per cent of the
districts, which is about 33 per cent of the land area
and 35 per cent of the population. Even the so-
called 'safe' districts battle some issue or other with
water quality thus threatening water security.
Figure 1.1: Decade-wise trend of shares of
groundwater and surface water to Net Irrigated
Area - an aggregated National Picture
Source: Indian Agricultural Statistics, 2008 (Figure courtesy:
Himanshu Kulkarni, ACWADAM)
While there are a lot of discussions on the
overexploitation of groundwater resources, there is
no update on the status of groundwater in India
after 2004. The central agency, Central
Groundwater Board (CGWB) uses the old 2004
data in its Groundwater Year Handbook 2011
(CGWB, 2011). So lack of data in public domain is a
serious concern as in absence of data, any recent
trends are not captured. Regarding the sustainable
groundwater management, Shankar et al (2011)
has discussed about carefully constructing a
disaggregated picture by mapping aquifers and
delineating aquifer typologies incorporating
variations in hydrogeological and socio-economic
contexts. They suggest that the aquifer mapping
should take place at the scale of watersheds of the
order of 1,000 to 2,000 hectares.
These maps can be then aggregated at a more
regional scale rather than move down from an
aggregated picture. Along with mapping, one also
needs to build a comprehensive database on the
groundwater flow systems and groundwater
availability in each hydro-geological setting. The
concern has also been reflected in the approach
paper to the 12th Five Year Plan by the Planning
Commission of India and the working group's
report on sustainable groundwater management.
Building on the premise of 'faster, sustainable and
more inclusive growth', the approach paper to the
12th Five Year Plan emphasises the urgency to
manage groundwater sustainably in four pronged
approach. First, there is a need for comprehensive
aquifer mapping at the watershed level. Second,
the observation wells need to achieve a ratio of
1:100 between observation wells and groundwater
use structures from the current ratio of 1:500 to
estimate actual groundwater use more accurately.
Third, developing sustainable groundwater
management plans for each aquifer, based on
partnerships between the stakeholders, hydro-
geologists and social mobilisers is also the need of
the hour. Fourth, separation of agricultural feeders
to improve the power situation and revive the
groundwater levels is needed (Planning
Commission, 2011). The working group's report on
sustainable groundwater management (Planning
Commission, 2011) also focused on building strong
partnerships and collaborations among a broad
spectrum of institutions. It envisions improved co-
ordination between various institutions dealing with
groundwater resources such as CGWB, state
agencies, technical research institutions, civil
society organizations, PRIs.
It visualizes an institutional restructuring with
specific roles being played by each of these. A
crucial interface with the Ministry of Drinking Water
and Sanitation (MoDWS) will also be established
through the programme. Further, the group
recommends that The National Programme on
Groundwater Management will centrally address
the challenge of groundwater legislation. Since
groundwater is a fugitive resource that does not
respect administrative boundaries and distinctions,
it is important that the groundwater legislation
provides for a separation of rights over land from
rights over water. The focus of groundwater
legislation should be on protection and sustainable
use of groundwater. The group also recommends
that groundwater management and use cannot be
discussed in isolation from the patterns of energy
consumption and pricing policies. Hence, a key
aspect of the programme is the co-management of
groundwater and energy use, with indirect
instruments like pricing of electricity, subsidies etc.,
playing a crucial role. Creating consensus on the
order of priority for different uses of groundwater:
drinking water, water for livestock and domestic
purposes, irrigation (small-holder, large scale),
industrial uses, urban non-domestic; creating a
system of regulation and water pricing to
encourage allocation of water resource based on
such priorities. (Ibid: 12)
1.3 Disasters and Extreme Events
Water availability and scarcity is governed by both
seasonal and temporal factors. Seasonal
extremes, coupled with the socio-economic
dynamics of various regions, affect the water
scenario in the country to a great extent. Due to its
unique physiographical features, India is
12The districts with the status of groundwater development greater than 70 per cent are termed 'unsafe'.
7

3.6 Page 26

▲back to top


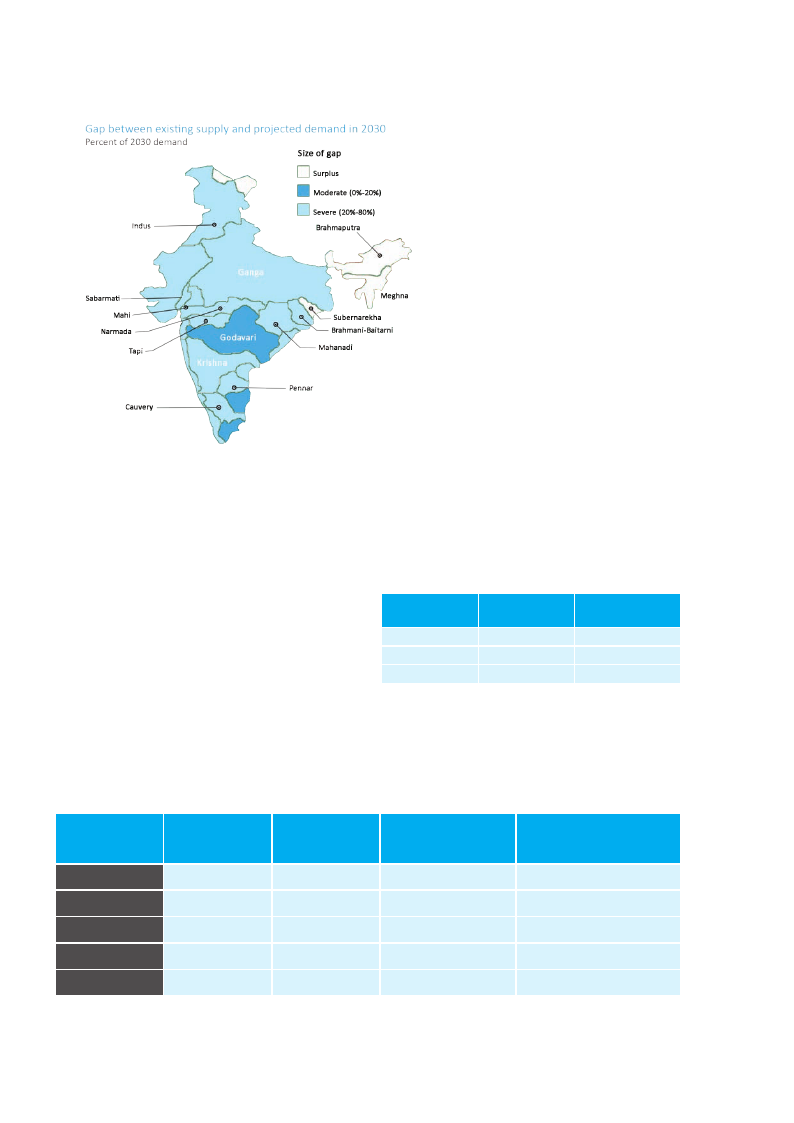
Figure 1.2: India's Water Supply and Demand Gap
Source: Addams et al. (2009 : 55)
vulnerable to various geophysical hazards. About
60 per cent of India's landmass is prone to
earthquakes of various intensities; over 12 per cent
is prone to floods; about 8 per cent to cyclones; and
68 per cent to drought (NDMD, 2004). The
economic and humanitarian impact of such
disasters is escalating due to the lack of
appropriate organisational systems, inappropriate
land management, pressure of increasing
population, and settlements in high-risk areas,
particularly by poor people (see Figure 1.2 and
Table 1.5). Infact, India is in danger of being ill-
prepared for natural disasters and climate change,
while unsustainable water-use patterns are evident
in Pakistan and Uzbekistan (UNWWDR4: 194).
Unmitigated natural or anthropogenic disasters
can be a serious impediment to the economy as
they set back the development clock by many years
(see Table 1.6 ). In the year 2009 alone,
India incurred a loss of about Rs 121.14
billion owing to hydrological and
meteorological disasters, with this
figure being fourth highest in the world
(Vos et al. 2009). In the state of
Maharashtra, a single drought (2003)
and flood (2005) absorbed more of the
budget (Rs 175 billion) than the entire
planned expenditure (Rs 152 billion) on
irrigation, agriculture and rural
development during 2002-7 (World
Bank, 2008). This report is aware of the
problem problem with such
demand/supply gap projections as they
assume that demand for water will grow
at a rate consistent with its historical
growth trend. Such an approach
ignores that the binding constraint on
water resource management is always
on the demand side. Unless the end-
uses to which water is applied are
regulated, supply augmentation is
never going to be a solution. Hence, the
projection of demand/supply gap, in the
absence of strategies for management
of demand, has to be looked at from multiple
angles. In absence of such calculations, the
present figure (1.2) gives an aggregate situation
which may just be the first step to understanding
the complexity of situation.
Table 1.6: Economic Loss Potential (1967-2006)
Annual exceedance
probability (in %)
0.5
5
20
Economic Loss
(USD million)
10,987
4,913
2,035
Percentage to GDP
1.2
0.5
0.2
Source: UNISDR (2010)
Table 1.5: Disaster Risk Statistics for India (1967-2006)
Disaster type
Earthquake
Flood
Drought
Landslide
Cyclone
Number of
disasters/yr
0.88
4.05
0.20
0.88
1.83
Causalities/yr
2,672
1,308
8
104
1,219
Physical exposure
(no./yr) million
0
18
24
0
2
Relative vulnerability
(killed/million exposed)
14,836
72
0
1,079
595
Source: UNISDR (2010)
8

3.7 Page 27

▲back to top


Figure 1.3: Percentage Distribution of Reported
Disaster in India (1967-2006)
Cyclone
23%
Floods
52%
Earthquake
11%
Landslide
Drought 11%
3%
Source: UNISDR (2010)
Figure 1.4.: Average Annual Economic Loss (USD
million) of India
Cyclone
19%
Drought
8%
Earthquake
9%
Flood
63%
Note: Loss data for landslide insufficient.
Source: UNISDR (2010)
The above data provides information about
extreme events till 2006. In 2008, the massive Kosi
River floods caused unprecedented loss to lives,
livelihoods, infrastructure and property in north-
eastern Bihar. Although floods have been a
recurring feature in parts of the state, the 2008
floods were not usual. The Kosi burst its
embankments and changed course, inundating
areas of Bihar that had not experienced such
flooding for half a century. About 1,000 villages in
five districts were affected, involving three million
people, of whom about one million were evacuated.
An assessment by the United Nations
Development Programme (UNDP) shows that the
valuation of houses damaged stands at around Rs
880 crores (US$195 million). Enormous amounts
of goods were lost, including foodgrains and
domestic items estimated to be worth Rs 400
crores (nearly US$88 million) and Rs 155 crores
(US$34 million) respectively (UNDP, 2009).
The overall approach currently being followed in
India is one of disaster management as opposed to
risk management for more than 20 years. The
socio-economic set-up of the country leaves a
large chunk of the population without adequate
capacity to cope with the after-effects of such
events. Taking note of the lacunae in the overall
approach, the GoI has formulated a number of
schemes. Some of these include the Integrated
Wasteland Development Programme (IWDP),
Drought Prone Area Programme (DPAP), Desert
Development Programme (DDP), flood control
programmes, National Afforestation and Eco-
development Programme, Accelerated Rural
Water Supply Programme (ARWSP), crop
insurance, Sampoorna Grameen Rozgar Yojana
(SGRY), Food for Work, etc. But a changing climate
will put these conventional approaches to test and
newer methods will have to be devised to deal with
both the increase in, and intensity of, natural
hazards.
1.3.1 Floods
The magnitude of flooding has increased in recent
decades. This can be deduced from the fact that
flood affected areas have increased to 40 Mha
(about 12 per cent of India's geographic area) from
approximately 19 Mha in 1953 (NDMD, 2004).
Floods have occurred almost every year since
1980 and were substantial in 2003 due to
widespread rains, which affected even some of the
most drought-prone areas. In recent years, the
increase in population in vulnerable areas,
inadequate drainage, and deforestation have all
contributed to the rise in flood damage (World
Bank, 2008). In 2008, flooding in the Kosi River in
Bihar affected about 1.4 million people in 13
districts (WHO, 2008). In December 2010, floods
wreaked havoc in the southern region of the
country, killing about 180 people and forcing
thousands of others to seek refuge in the
government relief camps. The flash floods and
mudslides of 2010 in Leh in north India claimed
about 180 lives and injured about 400 people
besides causing widespread damage to public and
private properties (Table 1.7). In addition,
epidemics in the aftermath of flood events are also
responsible for considerable loss of human lives.
For instance, the floods of July-August 2007 led to
an outbreak of cholera in four districts of Orissa,
killing more than 100 people (SDMC, 2008.
1.3.2 Droughts
About 73 per cent of India's annual rainfall is
accounted for by the south-west monsoon, the
failure of which generally results in drought and
drought-like conditions (MoA, 2009). Droughts
have always been a recurring event in the Indian
subcontinent. There are debates around the
occurrence of drought as meteorological or human
factors. Critiques argue that droughts are variously
experienced, politically inspired, socially
constituted and arise essentially from the
monopoly of available water (Jairath and
Ballabh,2009). Almost 20 per cent of India's total
land area is drought prone (World Bank, 2008). As
per the Ministry of Agriculture (MoA), 14 states
declared drought-like situation in 338 districts with
Himachal Pradesh, Assam, Jharkhand, Manipur
and Nagaland declaring all their districts as drought
prone in the year 2009. The government of Kerala
9

3.8 Page 28

▲back to top


Table 1.7: Flood Damages in India
Affected area(Mha)
Population affected (millions)
Damage to crops (Rs crores)
Damage to houses (Rs crores)
Damages to public utilities (Rs crores)
Cattle lost ('000)
Human life lost (No.)
Total damages to crops houses and
public utilities (Rs crores)
Source: CWC (2010)
2008
3.55
41.46
1,336.32
1,011.97
1,591.62
71
2,439
3,939.90
Year of maximum
Maximum Damage
damage
17.50
70.45
4,246.62
1,307.89
5,604.46
618
11,316
1978
1978
2000
1995
2001
1979
1977
8,864.54
2000
also declared drought in 14 districts in 2010 due to
acute water shortage and drying up of water
sources. Since droughts are a deviation from the
normal rainfall, they can occur in any rainfall region.
Over the years, many cases in India have provided
ample evidence that droughts are not exclusively
caused by water scarcity or absence of rainfall;
increasingly, it is mismanagement of water
resources to blame, whereby such droughts are
termed 'man-made' droughts. Droughts have huge
social repercussions and cause large-scale and
long-term distress to society
1.4. Water Scarcity
With an estimated per capita availability of 1,588 cu
m/capita/year (CWC, 2010), India does not fall
under the category of a water scarce country per
se, rather it can be termed as a country under
'water stress'.13 But it is widely believed that an
aggregate estimation does not reveal the actual
scenario. As mentioned earlier, in the 2030 base
case scenario, India faces a large gap between
current supply and projected demand, amounting
to 50 per cent of demand or 754 BCM (Addams,
2009). This is depicted in Figure 1.1. A projected 40
per cent of the population will be living in the urban
areas by 2030 with higher purchasing power. This
will increase calorie intake putting greater pressure
on existing water resources. For the projected 685
million metric tons of food production in 2030, 175
million tons are expected to come from rain-fed
agriculture, which will leave some 510 million to
irrigated production (ibid.). Many towns in India are
currently in the midst of acute water stress, and
even where water may be available, quality is a
major concern. Several factors are responsible for
this water scarcity.
The projected foodgrain and feed demand (in
million tonnes) as estimated by National
Commission on Integrated Water Resources
Development (NCIWRD-1999) constituted by
Ministry of Water Resources is as given below:
1.4.1 Population Growth
One of the major constraints often cited for India in
achieving developmental goals is the pressure of
an ever-increasing population. According to the
provisional census data of 2011, the population of
India is 1.21 billion. The per capita water availability
during this period has decreased from 2,309 cu m
in 1991 (Sharma and Bharat, 2009) to 1,588 cu m in
2001 (CWC, 2010). Considering the projected
population growth in 2025, the per capita water
availability can further decrease to 1,000 cu m,
which would then be termed a 'water scarcity'
situation. Despite the National Water Policy (NWP)
assigning the highest priority to drinking water,
providing adequate and safe drinking water to
every household in the country remains an onerous
task.
According to WHO-UNICEF data, as of 2008,
about 96 per cent of the urban population and 84
per cent of the rural population has access to
improved water sources (WHO-UNICEF, 2010).
However, this access does not ensure adequacy
and equitable distribution, and the per capita
availability is not as per norms in many areas.
Average access to drinking water is highest in
Class I towns (73 per cent), followed by Class II
towns (63 per cent), Class III towns (61 per cent),
and other towns (58 per cent) (Planning
Commission, 2008). The rural water supply
coverage has also increased steadily in recent
13According to the UN, an area experiences water stress when annual water supplies drop below 1,700 cu m per person. When annual
water supplies drop below 1,000 cu m per person, the population faces water scarcity, and below 500 cu m 'absolute scarcity'.
10

3.9 Page 29

▲back to top


years; however, water quality continues to be a
major concern.
It must be noted that an indicator like 'per capita
water availability' may not present the true picture
as a large population does not have physical
access to water even when it may appear so in
official records. Similarly, rising population is cited
as a reason for water scarcity although there exists
a huge disparity between the water consumption
patterns of the rich and the poor.14 This approach
considers the quantity of water but not its access
and control by different agents. Access to water
resources is governed by power relations in the
society with the poor often being differentially
excluded from this process. The efforts to augment
water supplyand 'manage the scarcity' often
concentrate on the technical and managerial
aspects thereby reinforcing existing inequalities. It
is imperative to consider the relational aspect of
water scarcity and the differential consumption
patterns as the scarcity experienced by a poor
person with reference to basic livelihood needs
should not be clubbed with the luxury needs of the
urban rich. A detailed discussion of this issue is
beyond the scope of this chapter.
1.4.2 Urban Development
One of the characteristics of population increase in
India is the marked rise in urban population. In
2010, about 30 per cent of the population (377
million people) lived in urban areas (Census of
India, 2011. This figure is set to increase to 40 per
cent by 2030 (ibid.). Due to various socio-economic
factors, like population pressure and poverty, the
urban regions have witnessed a large influx of
people from the rural areas. The consequence is
Table 1.8 : Food Grain and Feed Demand Projection
Demand
2010
High Demand
224
Low Demand
222
With addition of seed, feed, wastage, etc
High Demand
247
Low Demand
245
Years
2025
291
280
320
308
2050
449
382
494
420
Total water requirement of the country for different uses as assessed by NCIWRD-1999, is given below:
Table 1.9 : Total Water Requirement for Different Uses
Uses
Year
1997-98
Irrigation
524
Domestic
30
Industries
30
Power
9
Inland Navigation
0
Flood Control
0
Environment(1)
Afforestation
0
Env.(2) Ecology
0
Evaporation Losses
36
Total
36
Year 2010
Low
High
543
557
42
43
37
37
18
19
7
7
0
0
0
0
5
5
42
42
42
42
Year 2025
Low
High
561
611
55
62
67
67
31
33
10
10
0
0
0
0
10
10
50
50
50
50
Year 2050
Low
High
628
807
90
111
81
81
63
70
15
15
0
0
0
0
20
20
76
76
76
76
14A study by Water Aid in Delhi reveals that in one particular locality, '92 per cent of water supplied goes to 20 per cent of population and the
remaining 80 percent of population gets 8 per cent of the total piped water supply'. See Water Aid (2006: 58).
11

3.10 Page 30

▲back to top


unprecedented pressure on urban infrastructure
and resources. Increasing urbanisation coupled
with rise in the consumption pattern would mean a
new challenge for water resources. At present,
access to water in urban India is severely
constrained. While many major cities in developing
countries maintain a nearly 24-hour water supply
(see Box 1.2), Figure 1.5 shows that most Indian
cities have water supply for only a few hours of the
day (World Bank, 2006). The increasing population
means that the urban settlements not only face the
challenge of meeting the water requirement but
also of adequate sanitation facilities (as will be
discussed later; in 2008, 54 per cent of the urban
population used improved sanitation15 facilities).
According to estimates, the loss due to diseases
caused by poor sanitation for children less than 14
years in urban areas alone amounts to Rs 5,000
million at 2001 prices (MoUD, 2009); this is further
elaborated in Chapter 4, Section 4.3. Although the
access to water supply in the urban areas is
considerable there exists a huge disparity in terms
of accessibility with those living in the slums being
worse off.
A detailed discussion of the urban water scenario is
entailed in Chapter 3.
Box 1.2: 24X7 Water Supply
Although there has been a thrust in the water sector
over the years about the 24x7 water supply
schemes, the issue remains a contested one.
Proponents of such scheme base their arguments
on increasing water supply efficiency, the gains of
which can be accrued to the poor who bear the
maximum burden of erratic and irregular water
supply. While on one hand such schemes are seen
to result in higher efficiency in the water supply
side, on the other they are also been seen as a
means to allow private control of water supply.
Some opine that the plan for 24x7 supply cannot be
implemented given the present status of water
infrastructure in the country. While many pilots in
limited areas of a city have demonstrated the
successful implementation of 24x7 water supply, it
is not clear if these have served poorer locations or
are confined to middle-class localities. Critiques
believe that 24X7 water supply argument is a back
door entry route to privatisation of water services in
the name of the poor. The actual gains across all
sections of society and equity concerns for
stakeholders are some of the key concerns.
Source: Discussions between Dr David Foster and Dr Anjal
Prakash at UNDP Solution Exchange. Document available at
http://www.indiawaterportal.org/sites/indiawaterportal.org/files/
Strategy_for_Improving_Urban_Drinking_Water_Supply_Wat
er_Supply_is_too_Expensive.pdf [accessed on 29 December
2011]
1.4.3 Localised Scarcity
The constraints posed by the terrain in India means
that water is not uniformly distributed across the
country. Apart from variation in the precipitation
pattern, unplanned expansion of cities has
exacerbated the pressure on water resources,
especially groundwater. The recent NSS 65th
round report, July 2008-June 2009, reveals that 14
per cent of rural households and 9 per cent of urban
households did not have access to sufficient
drinking water during that year (NSSO, 2010).
In India, the groundwater contamination rate is
alarmingly high (MoEF, 2009). Seasonal water
scarcity is also a matter of grave concern. What is
alarming is that some of the most productive
regions (industrial and agricultural) are faced with
water shortages, due primarily to exploitative and
unsustainable water use practice. According to
2004 data of the CGWB, with respect to
groundwater, 48.67 per cent of blocks in Haryana
are 'over-exploited' while about 9.7 per cent blocks
fall under the 'critical category. These figures are
75.18 per cent and 3.64 per cent for Punjab
respectively (CGWB, 2004). Many metros in the
country have resorted to the practice of water
rationing to make up for the erratic water supply. To
add to existing woes, a scenario has developed
where many metropolitans that have run out of
water supply options are turning to water sources of
the surrounding peri-urban areas or even nearby
cities, as is the case with the national capital New
Delhi. This may result in increases in conflict
situations.
1.5 Managing Our Way to Scarcity
The water scenario presented above brings forth
some grave challenges which will need to be
addressed at the earliest. The first step would be to
recognise the magnitude of the problem. Clearly, a
considerable discrepancy exists in the estimation
of total available water resources in the country.
Any analysis pertaining to water resource
management would be futile without incorporating
the spatial and temporal variations in the
distribution of the resource. The ambitious river
15According to WHO-UNICEF Joint Monitoring Programme for monitoring of MDGs, 'an improved sanitation facility is defined as one that
hygienically separates human excreta from human contact' while 'an improved drinking-water source is defined as one that, by nature of
its construction or through active intervention, is protected from outside contamination, in particular from contamination with faecal
matter'. See WHO/UNICEF Joint Monitoring Programme (JMP) for Water Supply and Sanitation, available at
http://www.wssinfo.org/definitions-methods/introduction/) [accessed on 25 March 2011].
12

4 Pages 31-40

▲back to top


4.1 Page 31

▲back to top


Figure 1.5: Average Hours per day of Water Service in Select Indian Cities (2006)
Goa
8
Chandigarh
10
Mumbai
Delhi
Ludhiana
Jodhpur
5
4
10
2.5
Jaipur
3
Ahmedabad
2
Bikaner
2.5
Bengaluru
2.5
Udaipur
2.5
Chennai
32
1.5
341
332
240
223
220
190
149
145
133
123
80
LPCD
Hrs/day
Source: MoUD and WSP's benchmark study, ADB utilities book, cited in World Bank (2006: 14)
interlinking project aims to address this issue but
has proved to be contentious between the
government and civil society groups. While
theoretically it might be feasible to divert water
resources from surplus to deficit regions, the
ecological sustainability and affordability of such an
exercise puts constraints on its implementation.
Even in the areas where water is made available it
is important to revisit the sustainability of such
supply by looking into service indicators and
customer feedback rather than mere technical
supply indicators. India will need to invest heavily
on water storing structures while trying to find
newer methods to enhance its irrigation efficiency.
Much research will also be needed to back the
policy initiatives strongly. For example, with an aim
to support decision making, the study 'Charting Our
Water Future' by 2030 Water Resources Group
developed a 'water-marginal cost curve, which
provides a microeconomic analysis of the cost and
potential of a range of existing technical measures
to close the projected gap between demand and
supply in a basin' (p. 12).16
It is also imperative to take into account that people
cope with declining water availability in a variety of
ways. A recent study of the costs of coping with
inadequate water supply in Delhi found that the true
total costs of water supply are already 'privatized';
on average, the private coping costs are Rs 262 per
month (when capital costs are included) versus a
monthly water bill of only Rs 141 per month.17 A UN-
HABITAT supported study conducted in four major
cities of Madhya Pradesh in 2006, revealed that the
levels of system losses through 'unaccounted-for
water' or 'non-revenue water' ranged between 31
per cent and 66 per cent, maximum being in
Gwalior (UN-HABITAT, 2006). Similarly, the
reforms will need to be more in line with current
emerging situations. For the provision of availing a
consistent 24x7 supply to water at higher cost
might not appeal to the elite group which already
has ensured supplies by means of borewells, water
storage tanks or pumps. Managing this water
scarcity situation is an immense challenge due to
the socio-economic set-up of the country. This and
workable solutions are discussed in Chapter 8,
Section C.
1.6 Climate Change
Climate change has passed the phase of scientific
curiosity and debate and has now become one of
the developmental challenges for nations across
16The 2030 Water Resources Group was formed in 2008 to contribute new insights to the increasingly critical issue of water resource
scarcity. The group aimed to create an integrated fact base on the potential technical levers and costs for reducing water scarcity, with the
ultimate goal of advancing solutions-driven dialogue among stakeholders. The report Charting Our Water Future was developed to take
a first step in providing greater clarity on the scale, costs and trade-offs of solutions to water scarcity. For more details please visit
http://www.2030waterresourcesgroup.com/water_full/Charting_Our_Water_Future_Final.pdf.
17Misra 2005 cited in World Bank (2006: 13).
13

4.2 Page 32

▲back to top


the world. Scientific studies have established a
changing climate, its impact on the natural
resources and concomitantly on the lives and
livelihoods of people. It is often quoted that such
kinds of impacts will be more on people in the
developing countries due to their heavy
dependence on the natural resource base and
lower resilience to environmental shocks. Climate
change has an altogether different connotation for
a country like India due to its varied topography,
consisting of diverse bio-geographical features
including forests, coasts, mountains, mangroves,
islands, etc. Further, the dependence of people,
especially the poor, on the natural resource base
also makes them more vulnerable to such
changes. In India, a great deal of research18 has
been undertaken to assess and bring forth the
evidences of climate change and its impacts on
human lives These studies have clearly indicated
that a changing climate is manifesting itself in the
form of unprecedented changes in almost all major
ecosystems. From the receding glaciers to
changing cropping patterns, studies have shown
how the changing climate pattern is affecting the
ecosystem and its services. A thorough analysis of
climate change is beyond the scope of this report
but the following is a summarised account of
climate change vis-à-vis water resources in the
Indian context.
1.6.1 Implications for Water Sector
According to India's Initial National Communication
(NATCOM) to United Nations Framework
Convention on Climate Change (UNFCC), climate
change is likely to adversely affect the water
balance in different parts of India due to changes in
precipitation and evapotranspiration and rising sea
levels, leading to increased saline intrusion into
coastal and island aquifers. The National Water
Mission (NWM), a part of the National Action Plan
on Climate Change (NAPCC), identifies the threat
to water resources in India due to climate change in
terms of the expected decline in the glaciers and
snow-fields in the Himalayas; increased drought-
like situations due to the overall decrease in the
number of rainy days over a major part of the
country; increased flood events due to the overall
increase in the rainy day intensity; effect on
groundwater quality in alluvial aquifers due to
increased flood and drought events; impact on
groundwater recharge due to changes in
precipitation and evapotranspiration; and
increased saline intrusion of coastal and island
aquifers due to rising sea levels (NWM, 2009).
1.6.1.1 Melting Ice and the Changing State
The Himalayas comprise about 16.2 per cent of the
total geographical area of the country. India's three
main rivers – Indus, Brahmaputra and Ganga –
which support a very large percentage of the Indian
population, originate from here. The average water
yield per unit area of the Himalayan rivers is almost
double that of the peninsular systems, indicating
the importance of snow and glacial melt water
contribution from the high mountains (Kumar and
Sharma, 2005). Moreover the water from the
glacial melts is also crucial for sustaining the lives
and livelihoods of the people living in the
Himalayan region. The Himalayan snowline and
the glacier boundaries are sensitive to a changing
climate. According to the Indian Network for
Climate Change Assessment (INCCA) report
(MoEF, 2010), the annual temperature in this
region is expected to increase from 0.9±0.6oC to
2.6±0.7oC in the 2030s. The water yield in the
Himalayan region, mainly covered by the river
Indus, is likely to increase by 5 per cent to 20 per
cent in most of the areas, with some areas of
Jammu and Kashmir and Uttarakhand showing an
increase of up to 50 per cent with respect to the
base year of the 1970s (ibid.). Increased glacial
melt due to warming is predicted to affect river
flows. Increased warming might result in increased
flows initially with reduced flows later as the glacier
disappears. The impact of climate change on river
basins can be understood with the example of the
Indus River Basin. The total annual run-off from the
upper basin is likely to increase by 11 per cent to 16
per cent. It is estimated that although increased
run-off could be advantageous for water supply and
hydropower production it could aggravate
problems of flooding, water logging and salinity in
the upper basin. Also, even with an overall water
surplus, shortages might occur in local areas of the
highly productive Punjab rice-wheat zone and in
the unglaciated valleys of the upper basin
(UNSDR, forthcoming).
1.6.1.2 Climate Variability
The south-west monsoon system in India is the
most important climatic phenomenon. Shifts from
the normal regime can have catastrophic effects in
the form of floods, droughts or famines. Though it
has been established that there will be an impact on
the rainfall pattern of the country, it is not yet certain
as to what that will exactly be, with some models
predicting increase while others showing a
decreased rainfall pattern. INCCA, in its recent
report, has given a comprehensive region-wise
analysis of the predicted changes in the
precipitation pattern in the country. It indicates
clearly that climate variability in the future will
present newer challenges. The experiences from
around the country over the past few years reiterate
these predictions. Sectors which are climate
18 See, for example, Mohan and Sinha (2009) and Hallegatte (2010).
14

4.3 Page 33

▲back to top


sensitive, such as agriculture, are likely to be worst
affected by these changes. In a recent study on
climate change and its impact on flood and
drought-affected areas of India, the World Bank
notes that farm incomes and yields are likely to be
adversely impacted due to changes in temperature
and precipitation (World Bank, 2008). Although the
linkages between the two have yet to be
categorically established, it is believed that in the
absence of any countermeasures, climate change
is expected to influence future disaster risks
through likely increase in weather and climatic
hazards. It may also increase the vulnerability of
communities to natural hazards due to ecosystem
degradation, reductions in water resources and
food availability, and changes in livelihoods, and
push more people to higher levels of hazard
exposure (Asia Pacific Disaster Report, 2010).
What is perhaps significant is to realise that year-
to-year climate variability (as opposed to secular
climate change) in itself is a source of risk to life and
livelihoods in many parts of India. This manifests as
floods, droughts and other forms of disasters and
one of the key challenges in the water sector is to
build resilience to such climate variability.
In India, an “Adaptive Strategies project was
initiated in an attempt to reconcile differences in
perceptions of and responses to extreme weather
events in the context of climatic and social change.
The project was designed to document and flesh
out concepts and opportunities for more effective
approaches to water management and flood and
drought mitigation through an integrated study of
four field locations: two drought affected areas in
the arid regions of Rajasthan and Gujarat (India)
and two flood affected areas along the Rohini and
Bagmati River basins across the India-Nepal
border” (UNWWDR4).
1.6.1.3 Saltwater Intrusion and Climate Change
According to the Intergovernmental Panel on
Climate Change (IPCC 2001: 383), 'salt water
intrusion is the displacement of fresh surface water
or groundwater by the advance of saltwater due to
its greater density, usually in coastal and estuarine
areas'. This usually occurs in coastal and estuarine
areas due to reducing land-based influence (for
example, either from reduced run-off and
associated groundwater recharge, or from
excessive water withdrawals from aquifers) or
increasing marine influence (for example, relative
rise in sea level). High population pressure, intense
human activities, inappropriate resource use and
absence of a proper management system are
some such reasons. In India, the coastal aquifers
are faced with degrading water quality due to
various anthropogenic activities. Salinity ingress is
already a major problem in the coastal regions of
Tamil Nadu and Saurashtra, while inland salinity is
a major problem in regions of Rajasthan, Haryana,
Punjab and Gujarat. With its possible impact on the
hydrological cycle, climate change can further
exacerbate the problem of saline water intrusion in
the coastal and island aquifers.
1.6.2 Decision Making in a Changing Climate:
Progress and Challenges
Although India has no legally binding commitments
to cut down its carbon dioxide emissions, it has
been at the forefront of taking action for climate
change. Developing NAPCC in 2008 has reflected
a strong commitment in this direction. With its eight
missions, NAPCC aims to adapt the country to the
changing climate and make it more resilient to its
future impact. As one of its missions, NWM aims to
bring about 'conservation of water, minimizing
wastage and ensuring more equitable distribution
both across and within States through integrated
water resources development and management'
(NWM, 2009: iii). The goals envisaged by NWM
are:
Ÿ Making public a comprehensive water database
and the assessment of the impact of climate
change on water resources.
Ÿ Promotion of citizen and state actions for water
conservation, augmentation and preservation.
Ÿ Focused attention on over-exploited areas.
Ÿ Increasing water use efficiency by 20 per cent.
Ÿ Promotion of basin level integrated water
resources management.
A revision of the NWP 2002 (the revision is one of
the goals of the NWM) was undertaken in July 2010
recognising climate change as a serious challenge.
India released a comprehensive document in
November 2010, assessing the sector-wise climate
change situation in the country. The report has
been prepared by INCCA, a network- based
programme that brings together over 120
institutions and over 220 scientists from across the
country to undertake scientific assessments of
different aspects of climate change. Water being a
major sector, the report also provides information
about current status and future predictions in water
availability due to climate change. India's Ministry
of Environment and Forests (MoEF) is preparing its
second national communication on climate change
(NATCOM) as a commitment to the UNFCCC.
Climate change has also been recognised in the
National Policy for Farmers, 2007, as well as in the
NEP 2006.
Since its inception, the NAPCC has had its share of
criticism. Critics maintain that the primary attention
of the NAPCC has been towards the energy sector
with the water sector still not receiving its due. It has
also been condemned for not setting hard targets
15

4.4 Page 34

▲back to top


on the issues of water management. Achieving the
goals set in the NWM will require a paradigm shift in
the institutional mechanism and it is to be seen how
this will be achieved. It is apparent that a sound
response system to climate change should entail
strengthening both the technological as well as the
institutional set-up at the national, sub-national and
local levels. Owing to India's geography and socio-
economic profile, decision-making processes
around climate change will have to be proactive.
Additionally, to contend with climate change
surprises, decision making must also be designed
to be responsive and flexible to adjust to changes
and new information. At the same time, decisions
must be robust given the uncertainty surrounding
climate risks if they are to enable communities and
ecosystems to prepare for a variety of possible
scenarios of impact. And, lastly, given the long-
lasting nature and magnitude of the impact of
climate change on water, as a result of the temporal
and spatial scales of climate impact, decision-
making processes must be durable.
1.7 Summing Up
There is evidence to suggest that water budget
estimates may be seriously overestimating the
availability of water in the country. The business-
as-usual approach followed in the water sector has
given rise to unsustainable management and
extractive water use regimes particularly with
respect to groundwater. The rivers and water
bodies are already under tremendous pressure to
meet the demands from various sectors while
maintaining their ecological integrity. Climate
variability, now a characteristic feature of the
country, is more pronounced than ever, challenging
people's resilience and increasing pressure on
water bodies.
The national per capita water resource availability
has declined considerably over the years and of
particular concern is the disparity in water footprints
of the rich and the poor. The government and local
communities have responded well to many
imminent challenges but a paradigm shift in the
way water is perceived as a resource will be
required to build a robust future course of action.
The scenario of available water resources in India
can be better gauged by comparing it vis-à-vis the
sectoral demand scenario which is dealt with in the
next chapter.
References
Addams, L., G. Boccaletti, M. Kerlin, and M. Stuchtey.
2009. Charting Our Water Future: Economic
Frameworks to Inform Decision-making. World Bank.
Available at:
http://www.mckinsey.com/App_Media/Reports/Water/C
harting_Our_Water_Future_Full_Report_001.pdf
[accessed on 2 April 2011].
Amarsinghe, U. and B. Sharma. 2009. 'Water
Productivity of Food Grains in India: Exploring Potential
Improvements', in D. Kumar and U. Amarsinghe (eds),
Strategic Analysis of National River Linking Project
(NRLP) of India: Series 4, pp. 13-54. New Delhi: IWMI.
Asian Development Bank (ADB). 2009. Water
Resources Development in India: Critical Issues and
Strategic Options. New Delhi: Asian Development Bank.
Available at:
http://www.adb.org/Documents/Assessments/Water/IN
D/Water- Assessment.pdf [accessed on 6 January 2011].
Asia Pacific Disaster Report. 2010. Protecting
Development Gains: Reducing disaster vulnerability and
building resilience in Asia and the Pacific. Thailand:
UNESCAP-UNISDR.
Bandyopadhyay , J., B. Gujja, A. Nigam, and R. Talbot.
1998. Fresh Water for India's Children and Nature. New
Delhi: UNICEF-WWF.
Census of India 2001. Metadata and Brief Highlights on
Slum Population. Available at:
http://censusindia.gov.in/Data_Products/Data_Highlight
s/Data_Highlights_link/metadata_highlights.pdf
[accessed on 25 January 2011).
Census of India. 2011. Size, Growth Rate and
Distribution of Population. Available at:
h t t p : / / w w w. c e n s u s i n d i a . g o v. i n / 2 0 11 - p r o v r e s u l t s /
data_files/india/Final%20PPT%202011_chapter3.pdf
[accessed on 7 April 2011].
Central Groundwater Board (CGWB). 2004. Dynamic
Groundwater Resource of India. Available at:
h t t p : / / c g w b . g o v. i n / d o c u m e n t s / D G W R 2 0 0 4 . p d f
[accessed on 29 December 2011].
Central Groundwater Board (CGWB). 2011.
Groundwater Year Book India – 2010-2011. Cebtral
Ground Water Board, Ministry of Water Resources,
Government of India. Available at:
http://www.cgwb.gov.in/documents/Ground%20Water%
20Year%20Book-2010-11.pdf. [Accessed on April 19,
2012]
Central Pollution Control Board. 2009. Status of Water
Quality in India-2009. Delhi: MoEF.
CRIDA. 2011. Vision 2030. Santoshnagar, Hyderabad:
Central Research Institute for Dryland Agriculture.
Central Water Commission (CWC). 2009. Central Water
Commission – Annual Report 2008-2009. India: Ministry
of Water Resources (MoWR), Government of India.
Central Water Commission (CWC). 2010. Water and
Related Statistics. Water Planning and Projects Wing.
Available at
http://www.indiaenvironmentportal.org.in/files/water%2
0and%20related%20statistics.pdf [accessed on 8 March
2010].
Garg, N K and Q Hassan. 2007. Alarming Scarcity of
Water in India. Current Science. Vol 93, No 7, 10th
October. PP – 932-941.
Hallegatte, S. et al. (2010). 'Flood Risks, Climate Change
Impacts and Adaptation Benefits in Mumbai: An Initial
Assessment of Socio-Economic Consequences of
Present and Climate Change Induced Flood Risks and of
16

4.5 Page 35

▲back to top


Possible Adaptation Options', OECD Environment
Working Papers, No. 27, OECD Publishing.
Intergovernmental Panel on Climate Change (IPCC).
2001. Third Assessment Report on Climate Change.
IPCC, p. 383.
Jairath, Jasveen and Vishwa Ballabh. 2009. Droughts
and Integrated Water Resources Management in South
Asia. Sage Publications. New Delhi
Kumar, R., K.D. Sharma, and R.D. Singh. 2005. 'Water
Resources of India', Current Science, Special Section:
Water, vol. 89, no. 5, pp. 794-811.
Mohan, D. and S. Sinha. 2009. Vulnerability Assessment
of People, Livelihoods and Ecosystems in the Ganga
Basin. Delhi: WWF.
Ministry of Agriculture (MoA). 2009. Drought-2009.
Overview and management. New Delhi; Government of
India.
Ministry of Environment and Forest (MoEF). 2006.
National Environment Policy 2006. Ahmedabad: Center
for Environment Education, pp. 28.
Ministry of Environment and Forests (MoEF). 2009.
State of Environment Report, 2009. New Delhi:
Government of India.
Ministry of Environment and Forests (MoEF). 2010.
Climate Change and India: A 4X4 Assessment- A
Sectoral and Regional Analysis for 2030s. Available at:
http://moef.nic.in/downloads/public-information/fin-rpt-
incca.pdf [Accessed on 21 December 2010].
Ministry of Urban Development (MoUD). 2009. National
Urban Sanitation Policy. Available at:
http://www.urbanindia.nic.in/programme/uwss/slb/SubN
USP.htm [Accessed on 5 January 2011].
Narsimhan, T N. 2008. A note on India's water budget
and evapotranspiration. Journal of Earth System
Science. Vol 117. No 3. PP 237- 240.
National Disaster Management Division (NDMD). 2004.
Disaster Management in India. New Delhi: Ministry of
Home Affairs, Government of India.
National Sample Survey Office (NSSO). 2010. Housing
Conditions and Amenities in India, 2008-2009: NSS 65th
Round. Available at:
http://mospi.nic.in/mospi_nsso_rept_pubn.htm
[Accessed on 3 October 2011].
National Water Mission (NWM). 2009. Ministry of Water
Resources, Government of India. Available at:
h t t p : / / i n d i a . g o v. i n / a l l i m p f r m s / a l l d o c s / 1 5 6 5 8 . p d f
[Accessed on 23 March 2011].
Planning Commission. 2008. Eleventh Five Year Plan
(2007-2012). New Delhi: Oxford University Press.
Planning Commission. 2010. 'Mid-term Appraisal of the
11th Five Year Plan'. Available at:
http://planningcommission.gov.in/plans/mta/11th_mta/
MTA.html.
Planning Commission. 2011. Faster, Sustainable and
more Inclusive Growth: An approach paper to 12th Five
year Plan (2012-2017). Planning Commission,
Government of India. Accessed on April 10, 2012 at
www.planningcommission.nic.in.
Planning Commission 2011. The report of the working
group on Sustainable Groundwater Management, Inputs
to 12th Plan Document. Planning Commission,
Government of India. Accessed on April 21, 2012 at
http://planningcommission.nic.in/aboutus/committee/wr
kgrp12/wr/wg_susgm.pdf.
Planning Commission. 2011. The report of the working
group on water database development and management
for the 12th five year plan (2012-2017). Available online
at
http://planningcommission.nic.in/aboutus/committee/wr
kgrp12/wr/wg_data.pdf. Accessed on March 12, 2012.
SDMC. 2008. South Asia Disaster Report 2007. New
Delhi: SAARC Disaster Management Center. Available
at: http://saarc-sdmc.nic.in/pdf/publications/sdr/
cover.pdf [accessed on 12 March 2011].
Shah, T. 2009. 'India's Groundwater Irrigation Economy:
The Challenge of Balancing Livelihoods and
Environment', in U. Badarayani, H. Kulkarni, and D.
Upasani, Groundwater Management: Typology of
Challenges, Opportunities and Approaches, Chapter 1.
Pune: ACWADAM.
Shankar, P.S. 2009. 'Hydrogeology in Watershed
Management: A Practitioner's View', in U. Badarayani, H.
Kulkarni, and D. Upasani, Groundwater Management:
Typology of Challenges, Opportunities and Approaches,
Chapter 3. Pune: ACWADAM.
Shankar P.S. H Kulkarni and S. Krishnan. 2011. 'India's
Groundwater Challenge and the Way Forward',
Economic and Political Weekly, vol. XLVI, no. 2, pp. 37-
45.
Sharma, D. and A. Bharat. 2009. 'Conceptualizing Risk
Assessment Framework for Impacts of Climate Change
on Water Resources', Current Science, vol. 96, pp. 1044-
1052.
Verma, S. and S. Phansalkar, S. 2007. 'India's Water
Future 2050', International Journal of Rural
Management, vol. 3, no. I,pp. 149-79.
Vos, F., J. Rodriguez, R. Below, and D. Guha-Sapir.
2009. Annual Disaster Statistical Review 2009: The
Numbers and Trends. Brussels: CRED.
United Nations Development Prorgamme (UNDP).
2009. 'Kosi Floods 2008: How we Coped, What we
Need', UNDP, New Delhi. Available at:
http://www.undp.org.in/content/pub/CrisisPrevention/Ko
si-Floods-2008.pdf [accessed on 16 February 2012].
United Nations International Strategy for Disaster
Reduction (UNISDR).2010. Synthesis Report on South
Asia Region Disaster Risks. New Delhi: RMSI Private
Limited. Available at:
http://www.unisdr.org/files/18873_southasiadisasterrisk
assessmentstud.pdf [Accessed on 14 February 2012].
UN-HABITAT. 2006. 'Water Demand Management
17

4.6 Page 36

▲back to top


Strategy & Implementation Plan for Gwalior', Water for
Asian Cities Programme, UN-Habitat, New Delhi.
Water Aid (2006). 'Profiling Informal City of Delhi:
Policies, Norms, Institutions and Scope of Interventions',
Water Aid India and Delhi Slum Dwellers Federation,
New Delhi.
WHO, 2008. 'Situation Report Bihar Floods 2008'.
Available at:
http://www.searo.who.int/LinkFiles/EHA-India_
Sunsari_Flooding_.pdf [accessed on: 5 December
2011].
WHO-UNICEF. 2010. Estimates for the Use of Improved
Drinking Water Sources. Joint Monitoring Programme for
Water Supply and Sanitation. Available at:
http://www.wssinfo.org/ [Accessed on 24 February
2011].
World Bank. 2005. India's Water Economy: Bracing for a
Turbulent Future. World Bank Report. Washington DC:
World Bank.
UNWATER. 2012. The United Nations World Water
Development Report 4: Managing Water under
Uncertainty and Risk, Volume 1. Available at:
http://www.unesco.org/new/en/natural-sciences/
environment/ water/wwap/ wwdr /wwdr4-2012/.
World Bank. 2006. Inclusive Growth and Service
delivery: Building on India's Success. Available at
http://go.worldbank.org/ODEO1J4A50 [Accessed on 22
December 2010].
World Bank. 2008. Climate Change Impacts in Drought
and Flood Affected Areas: Case Studies in India.
Available at http://go.worldbank.org/MIWPE4LL20
[Accessed on 16 December 2010).
World Bank. 2010a. Deep Well and Prudence: Towards
Pragmatic Action for Addressing Groundwater
Overexploitation in India. Washington, DC: The World
Bank. Available at
http://siteresources.worldbank.org/INDIAEXTN/Resour
ces/295583-1268190137195 /DeepWellsGround
WaterMarch20. [Accessed on 15 December 2010].
Web Sources
http://mowr.gov.in/ viewed on 30 January 2011.
http://www.cpcb.nic.in viewed on 13 January 2011.
http://cgwb.gov.in/ viewed on 13 January 2011.
18

4.7 Page 37

▲back to top


Inadequate access to water is often referred to as
one of the biggest factors limiting development in
India. It is an indispensible factor of production in
almost all enterprises, and access to water is
inextricably linked to achieving the Millennium
Development Goals (MDGs). Water is also a
determinant of good health and productivity. The
Human Development Report (UNDP, 2011: 46)
notes, 'ensuring access–including modern cooking
fuel, safe water and basic sanitation–also creates
the potential to expand higher order capabilities,
thereby enlarging people's choices and furthering
human development'. The main users of water are
the agricultural, domestic and industrial sectors.
While agriculture continues to dominate in terms of
water demand and use, industrial and domestic
water demands are also rising steadily in the
country. Table 2.1 gives the water demand estimate
of diverse sectors by two different agencies—the
Standing Sub-committee of the Ministry of Water
Resources (MoWR) and the National Commission
on Integrated Water Resources Development
(NCIWRD). While assessing the population rise
vis-à-vis demand, an estimate of the averages
leads us to believe that we are nearing a 'water
stressed' situation at the local level; many river
basins are already faced with an acute water
shortage. Nine out of 20 river basins with
populations of 200 million are currently facing water
scarcity (Planning Commission, 2008). The
government has constructed many massive
storage structures to store surface water and
retrieve it for controlled use. But even after
constructing 4,525 large and small dams, the per
capita storage in the country is 213 cu m as against
6,103 cu m in Russia, 4,733 cu m in Australia, 1,964
cu m in the United States, and 1,111 cu m in China.
Per capita storage may touch 400 cu m only after
the completion of all the on-going and proposed
dams (ibid.).
Table 2.1: Projected Water Demand (in BCM) for Various Sectors
Sector
Standing Sub-committee
Report of MoWR
Year
2010
2025
2050
Irrigation
688
910
1072
Drinking water
56
73
102
Industry
12
23
63
Energy
5
15
130
Others
52
72
80
Total
813
1093
1447
Source: GoI (2006) cited in ADB (2009: 3)
2010
557
43
37
19
54
710
NCIWRD
2025
611
62
67
33
70
843
2050
807
111
81
70
111
1180
19

4.8 Page 38

▲back to top


2.1 Household/Human Consumption
2000 to 2008, the overall household connections
have almost been stagnant. In urban areas, where
As shown in Figure 2.1, the domestic water
demand in India has remained low and accounted
for 7 per cent of the annual freshwater withdrawal in
2010. It is pertinent to note that as much as 80 per
cent of the domestic water requirement is met by
groundwater (World Bank, 2005). The water crunch
is felt the most during the critical summer months
household connections have actually declined,
there could be two issues which explains this; an
increase in population leading to household
connections not been able to keep pace with the
rising population every year, and there could be
slip-back due to groundwater depletion and water
quality issues.
when many areas suffer from severe water
shortages. The Government of India (GoI) has an
ambitious scheme of providing piped drinking
water to all uncovered habitations by 2012 under
Figure 2.1: Estimated Improved Drinking Water
Coverage in Urban and Rural Areas (2008)
Source: WHO-UNICEF (2010)
the Bharat Nirman Yojana. The programme
was launched in 2005. Phase I of the
programme was implemented in the period
2005-06 to 2008-09.Phase II is being
11
implemented from 2009-10 to 2011-12. Rural Rural
84
drinking water is one of the six components of
Bharat Nirman. During the Bharat Nirman
Phase – I period, as per the official monitoring
figures 55,067 un-covered and about 3.31 lakh Urban
slipped-back habitations were to be covered
48
96
with provisions of drinking water facilities and
2.17 lakh quality-affected habitations were to
Household Connections(percent) Total(percent)
be addressed for water quality problem.
According to the Eleventh Plan document of
the Planning Commission (2008), though more
than 95 per cent coverage was achieved prior to
Bharat Nirman, out of the 1.422 million habitations
Figure 2.2: Comparative Analysis of Access to an
Improved Drinking Water Source (2000-8)
Source: WHO-UNICEF (2010)
covered in the country, about 0.16 million have
slipped back to a position where people do
not have adequate water to drink and have to
walk more than 2 km to fetch potable water.
URBAN
RURAL
Similarly, about 0.18 million habitations are
93
95
96
dependent on contaminated water supply,
thereby exposing themselves to water
81
84
76
induced diseases (ibid.). Improved water
coverage for urban and rural areas till the year
50
49
48
2008 is given in Figure 2.1. It is notable that
while the total coverage figures are
9
11
11
satisfactory, the coverage with respect to
household connections is a matter of
2000
2005
2008
2000
2005
2008
concern. Further, a comparative analysis of
the improved drinking water coverage over
Household Connections(percent) Total(percent)
eight years (2000-08) reveals that in urban
areas the coverage in terms of household
In terms of sanitation services, Figure 2.3 shows
connections has actually declined (see Figure 2.3).
that in urban India an estimated 18 per cent of the
The same holds true for rural areas in 2005-08.
population still do not have access to any kind of
toilet facility (WHO-UNICEF, 2010). In rural areas,
Water access is determined by the government
the scale of the problem is particularly daunting, as
more from the physical availability and access point
69 per cent of the rural population still defecates in
of view. Understanding that there are social
the open (ibid.). While building the physical
differences within communities, water is also a
infrastructure is accorded priority for increasing
social factor and its access is socially constructed.
sanitation coverage, it will have to be accompanied
Therefore overall water coverage data does not
by increasing water availability for achieving the
give an understanding of who is accessing and who
real targets, including safe waste disposal. It is
does not. Further disaggregation of data at
estimated that around 37.7 million Indians are
household and caste\\community level will be a
affected by waterborne diseases annually, 1.5
better indicator of individual's water access. The
million children are estimated to die of diarrhoea
data presented in Figure 2.2 shows that even
alone and 73 million working days are lost due to
through the overall access to water has increased
waterborne diseases each year (Khurana and Sen,
from 76 per cent to 84 percent in rural areas from
2007). A recent study conducted by the Water and
20

4.9 Page 39

▲back to top


Sanitation Programme (WSP) (WSP, 2010), a
capita per day (lpcd). But at the consumption end,
global partnership administered by the World Bank,
the availability remains low, due to substantial non-
estimates that inadequate sanitation causes India
revenue water which is estimated to range among
'considerable economic losses' each year,
cities between 28-45 per cent (Table 2.2) . The
equivalent to 6.4 per cent of its Gross Domestic
study reveals that the present water supply
Product (GDP) in 2006 (US$53.8 billion). The
problems can be attributed to lack of governance
health and economic burden of inadequate
and inadequate monitoring infrastructure rather
sanitation is elaborated in Chapter 3. Tables 2.3
than to scarcity of water resources. The financial
and 2.4 give the top five lowest and highest covered
and institutional assessments suggest that the
states with respect to physical coverage of drinking
reporting on revenue is inappropriate with poor
water supply as per the Ministry of Drinking Water
estimates of collection efficiency, revenue and
and Sanitation data. Box 2.1 presents the case of
expenditure and over reliance on the government
improper sanitation facilities in the government
for financial support. Overall accountability and
schools in rural India. The data presented is based
transparency is also very low. Current practices
on the Annual Status of Education Report 2011. It is
appear to match the disaster management
notable that in India, as in many South Asian
approach rather than an organised style of
countries, lack of toilets is cited as one of the major
functioning based on meticulous scientific
reasons for the high drop-out ratio of children,
planning.
especially girls from schools (Boruah 2011). The
decline in the household coverage is attributed to
Based on the outcome of the above studies, water
multiple factors like increase in population and lack
demand management strategies reflect a three-
of source sustainability. It is pertinent to note here
pronged approach: (i) engineering solutions for
that for a country like India where access to water is
controlling leakages including metering, water
governed by many social and cultural factors
audits and balancing, setting up of district metered
(discussed later in the report), household
areas, etc.; (ii) accounting reforms and tariff
rationalisation; and, (iii) institutional, legal and
organisational changes, etc.
Figure 2.3: Estimated Sanitation Coverage in Urban and
Rural Areas (2008)
According to the National Sample Survey
(NSS) 65th round report, in rural areas, tap as
Rural
21
a major source of drinking water was the
69
lowest among Scheduled Tribe (ST)
households (19 per cent) and was the highest
among Other Backward Class (OBC)
18
Urban
households (33 per cent) followed by
households in the residual social group (31
54
per cent). In rural areas, the highest
proportion of Scheduled Caste (SC)
Open Defecation (percent) Improved(percent)
households had no latrine facility (76 per
cent), followed by ST households (75 per
Source: WHO-UNICEF (2010)
cent) and the lowest proportion of 'others'
connections can be argued to be better means of
ensuring equitable water access.
households (43 per cent). Likewise, in urban
areas, the proportion of households who depended
on 'tap' was lowest among ST households (69 per
Urban Water Demand Management
cent) and the same was highest among 'others' (78
per cent). In urban areas, the highest proportion of
A water balance study of municipal water supply
conducted in the four cities of Madhya Pradesh
(UN-HABITAT 2006) suggests that the available
SC households had no latrine facility (23 per cent),
closely followed by ST households (21 per cent)
and 'others' households (4 per cent).
water supplies theoretically translate into per capita
availabilities ranging between 150-70 litres per
The data of physical coverage has to be taken with
a pinch of salt. Data collected from the Department
Table 2.2: Water Balance in the Major Cities of Madhya Pradesh
Particulars
Water Losses(%)
Non-revenue water (%)
Authorised consumption (%)
Bhopal
22.8
28.2
71.8
Gwalior
43.2
43.9
56.1
Jabalpur
33.8
36.9
63.1
Indore
30.5
38.5
61.5
21

4.10 Page 40

▲back to top


Table 2.3: Physical Coverage of Drinking Water
Supply: Five Lowest Covered States
Table 2.4: Physical Coverage of Drinking Water
Supply: Five Highest Covered States
State
Percentage habitation level
coverage as on 1 April 2011
State
Tripura
28.59
Jharkhand
Karnataka
34.33
Gujarat
Jammu and Kashmir
43.12
Tamil Nadu
Chhattisgarh
46.06
West Bengal
Manipur
48.29
Goa
Source: Department of Drinking Water and Sanitation (DDWS) Source: (DDWS) (2011)
(2011)
Percentage habitation level
coverage as on 1 April 2011
98.04
95.46
90.86
90.11
87.88
of Drinking Water Supply and Sanitation on the
physical coverage of drinking water supply shows
that Jharkhand tops the list of percentage of
habitation level covered against the total
habitation. The state has 98.04 percentage of
habitation covered with drinking water supply
sources. Any person with slightest understanding
of the State Jharkhand may refute this. There could
be two issues – one that the data may be wrong. If
not, then the definition of coverage needs be
changed to represent the reality in better fashion.
Box 2.1: State of Sanitation Facilities in
Government Schools: ASER Report 2011
The 2011 Annual State of Education Report
(ASER) reveals that only 43.8 per cent of the rural
government schools in India have functional and
usable toilets for girls. This is little less than a total
49.1 per cent schools with functional toilets. Only
73.5 per cent rural government schools have
drinking water facility. The Right to Education Act
guarantees the provision of free and compulsory
education to children aged six to fourteen. To fulfil
this right, the Act requires all schools to comply with
the norm of having separate toilets for girls and
boys. The schools are expected to meet these
norms within three years of the implementation of
the Act in 2009. The ASER survey is carried out
each year between September and November
where in, a total of 28,523 government schools
were visited in 2010 and 2011. Following is the list
of top five states with the lowest percentage of the
coverage of girls' toilets in India. Incidentally, these
are north-eastern and tribal states. The top five
states with highest coverage of functioning girls'
toilets are: Kerala (68.6%), Haryana (68%), Gujarat
(67.7%), Rajasthan (66.3%) and Himachal
Pradesh (64.9%).
Source : ASER (2011)
2.2 Agriculture
According to the Planning Commission (2008),
although the share of agriculture in the GDP
Top five states with lowest percentage coverage of
girls' toilets in government schools
20.7
21.9
22.0
18.6
15.3
Manipur
Meghalaya Chhattisgarh
Tripura
Arunachal
Pradesh
declined from over half at the time of independence
to less than one-fifth in 2010, it remains the
predominant sector in terms of employment and
livelihood with more than half of India's workforce
engaged in it as the principal occupation. It
contributes significantly to export earnings and is
an important source of raw materials for many
industries. Therefore, it also receives the greatest
share of the annual water allocation and the GoI
has assigned the highest priority to development of
the agricultural sector in the Eleventh Five Year
Plan period (2007-12), with a targeted growth of 4
per cent (ibid.). Present extraction for the sector
(along with livestock) accounts for 91 per cent of
the total freshwater withdrawals in 2010 (FAO,
2010). One of the determining factors for the
success of the green revolution was timely
availability of water through utilisation of
groundwater, contrary to the highly regulated and
corrupt system of canal irrigation (World Bank,
2005).
It is widely agreed now that irrigation development
in the country traversed an unsustainable trajectory
with increased dependence on groundwater. Free
or cheap power as an economic subsidy initially,
and political sop later, has also been detrimental to
sustainable groundwater extraction. The
groundwater irrigation structures which stood at
about 18.5 million in 2001 have been estimated to
reach about 27 million, with every fourth rural
household owning one such structure.19 These
22

5 Pages 41-50

▲back to top


5.1 Page 41

▲back to top


Figure 2.4: Decade-wise Share of Surface Water and Groundwater in Net Irrigated Area (%)
60
Surface water
50
40
Ground Water
30
Other Sources
20
10
0
1950-51 to 1960-61 to 1970-71 to 1980-81 to 1990-91 to 2000-01 to
1959-60 1969-70 1979-80 1989-90 1999-2000 2004-07
figures reiterate that agriculture continues to put
immense pressure on groundwater resources (see
Figure 2.3). The 2030 case scenario projects
increasing population and rise in demand for
food/feed crops leading to agriculture accounting
for 1,200 BCM or 80 per cent of total water demand
which is almost double the demand in 2005
(Addams et al., 2009). The deteriorating state of
traditional water management systems, which
serve the multiple needs of livelihood security and
irrigation source of many small-scale farmers, has
been another disturbing trend. Figure 2.5, for
example, shows the declining trend of tank
irrigation in the country. To ensure the food security
of the burgeoning population, as well as address
the escalating levels of consumption by the
urbanising population, enhancing agricultural
productivity will be imperative while addressing the
issue of sustainability at the earliest.
2.3 Water for Ecology
Much like the sectoral demand for water, there also
Figure 2.5: Net Irrigated Area under Tanks in India
since Independence
exists an ecological demand. Although difficult to
quantify it numerically, it is seen in some ways as a
minimum right of ecosystems. The issue involved
here is whether or not there is a need to ensure that
minimum flows remain unbound and 'unused' so
that ecosystem services may be regenerated.
Though there is an increasing acceptance of this
concept, there are different views on it. Those with
environmental leanings tend to treat preservation
of ecosystem integrity to be of higher importance
than simple regeneration of ecosystem services,
and tend to see minimum environmental flows as a
prior charge on water services. The issue remains
unresolved and probably some compromise will
have to be made around the subject, but it is
becoming increasingly clear that we can no longer
treat unbound flows as 'wasted' because it 'flows
out to the sea' and must reach consensus on the
level of flows that may be treated as necessary for
environmental needs (Joy and Paranjape, 2008).
More recently, Ramaswamy Iyer, while proposing
an alternate water policy for the country, has
fervently put forth the argument for recognising
environmental needs while designing any national
water policy. He argues that rivers are more than
mere water channels that can be regulated and
altered at our will (Iyer, 2011). The ambitious project
of interlinking rivers has reached an impasse due to
vehement opposition by ecologists and
hydrologists alike. Although empirical research20
has persistently questioned the net benefits arising
from such projects, considering the huge social and
environmental costs involved, the enchantment of
policy makers with big dams doesn't seem to fade.
As per the National Register of Large Dams (CWC,
2009), there are 4,711 completed, large dams in
India and another 390 dams under construction,
although no comprehensive assessment has been
done to evaluate the performance of the existing
dams (Thakkar, 2005).
19Shah (2009) cited in Kulkarni et al. (2011: 37)
20See, for example, Thakkar (2005)
23

5.2 Page 42

▲back to top


2.3.1 Wetlands
Wetlands cover an estimated area of 58.2 MHa
(Prasad et al., 2002) of the country. Natural
wetlands in India consists of the high-altitude
Himalayan lakes; wetlands situated in the flood
plains of the major river systems; saline and
temporary wetlands of the arid and semi-arid
regions; coastal wetlands such as lagoons,
backwaters and estuaries; mangrove swamps;
coral reefs; and marine wetlands. It is estimated
that freshwater wetlands alone support 20 per cent
of the known range of biodiversity in India.21 They
perform crucial ecosystem services, including
retaining water during the dry periods, keeping the
water table high. In Chilika Lagoon in eastern India,
200,000 people are dependent on wetland fishery
and agricultural production; the sale of fishery-
related products generated an estimated
US$18.23 in 2004-5 (Wetlands International,
2010). The East Kolkata Wetland is an example of
wetlands where usage of city sewage for traditional
practice of fisheries and agriculture is practised
(ibid.). The wetlands are seriously threatened by
reclamation through drainage and landfill, pollution
(discharge of domestic and industrial effluents,
disposal of solid wastes), hydrological alterations
(water withdrawal and inflow changes) and over-
exploitation of their natural resources resulting in
loss of biodiversity and disruption of ecosystem
services. The Millennium Ecosystem Assessment
(2005) highlighted that the primary direct drivers of
wetland degradation were 'infrastructure
development, land conversion, water withdrawal,
eutrophication and pollution, over-harvesting and
overexploitation, and the introduction of invasive
alien species' (p. 15). India has lost 38 per cent of
its wetlands in the last decade with the loss rate
being as high as 88 per cent in some districts.22
Currently, 25 wetlands in the country are
designated as Ramsar Wetlands of International
Importance,23 and 68 wetlands have been identified
for protection under the National Wetland
Conservation Programme (ibid.). At least nine of
India's 25 Ramsar sites are severely affected
through hydrological alterations and large-scale
water abstraction (ibid.). In 2009, the Ministry of
Environment and Forests (MoEF) issued
Guidelines for Conservation and Management of
Wetlands and identified 122 wetlands for
protection. In December 2010, it notified the
Wetlands (Conservation and Management) Rules,
under the Environment Protection Act of 1986
(MoEF, 2009). Though this has been a welcome
step since India had no legislation to protect inland
or freshwater resources the law has been criticised
for its lack of citizen involvement among other
things.
2.4 Industry
Industries are a large promoter of economic growth
and as India strives to maintain and accelerate its
impressive GDP growth, the demand for water in
the industrial sector is also bound to increase. India
is the tenth most industrialised country in the world
with about 88 industrial clusters scattered across
the country (CPCB, 2009). Water is an integral
component in industrial infrastructure and hence its
importance in sustaining the GDP cannot be
undermined. As mentioned before, the industrial
sector accounts for only 2 per cent withdrawal of
the total freshwater resources of the country.
According to the projected water demand for 2030,
the demand from industry will quadruple to 196
BCM (13 per cent), pushing overall demand growth
close to 3 per cent per annum (Addams et al.,
2009). The Centre for Science and Environment
(CSE) in 2004 published an analysis about water
use in industry, making a case for the
underestimation of water use by the industries in
India (CSE, 2004). It argued that water use
efficiency in Indian industries continues to be much
lower when compared to some other developing
countries in the world (Table 2.5). Water is not only
needed as an input in the industrial process, but
also for discharging the effluents generated.
Industries like the pulp and paper industry, thermal
power plants, textiles, and the iron and steel
industry are highly water intensive. Industries in
India have also been criticised for taking
inadequate steps to comply with existing
environmental standards (discussed later in
Chapter 3). As mentioned earlier, stretches of some
major rivers passing through industrial clusters are
severely polluted. Extraction of water by industries
has often come in conflict with the livelihood
interests of the people, as is seen in the case of
Plachimada, Kerala.24 A boom in the real estate
sector has raised the demand of sand for
construction, leading to mining of sand in some
riverine areas of the countries beyond sustainable
levels. This has had a negative impact on both the
ecosystem as well as the people dependent on it
(Anappara 2005). The bottled water industry is one
of the fastest growing industrial sectors and India
ranks tenth in the list of largest bottled water
consumers in the world (Bhushan 2006).
Unchecked expansion of this industry also has
adverse repercussions for water security in many
areas where groundwater is the only water source.
Although industries make a significant contribution
21Deepa and Ramachandra (1999) cited in Prasad et al. (2002)
22Vijayan (2004) cited in Dandekar and Thakkar (2010)
23For more details see: http://www.ramsar.org/cda/en/ramsar-home/main/ramsar/1_4000_0__
24See, for example, 'Water: Private, Limited – Issues in Privatisation, Corporatisation and Commercialisation of Water Sector in India' at:
http://www.indiawaterportal.org/sites/indiawaterportal.org/files/Privatisation,%20Corporatisation%20and%20Commercialisation%20o
f%20the%20water%20sector_India_Manthan%20Adhyayan%20Kendra_2002.pdf (accessed on 25 November 2011).
24

5.3 Page 43

▲back to top


to economic growth, their non-compliance to
pollution control measures has led to a
continuously growing water pollution burden. It is
implicit that an unchecked rise in industrial demand
will eventually prove to be harmful for India's water
resources.
2.5 Water for Livelihoods
The dynamic nature of water makes it an
indispensible input in almost all livelihood ventures.
Even after 63 years of independence, most of the
poor and the marginalised communities continue to
depend on the natural resource base for
sustenance. Water security is absolutely essential
to ensure livelihood security especially in the
context of both rural and urban poor, for in addition
to basic uses like drinking, sanitation and irrigation,
water is also used for livestock rearing, home
gardens and other small-scale commercial
activities. Contemporary development literature on
water management cites many examples of using
water as a means to address rural poverty by
ensuring appropriate quality and quantity of water
at the right time. A recent development in this
regard has been the genesis of the Rural Water
Livelihood Index (RWLI), which is essentially a
composite index of four key aspects of rural
livelihoods: (a) access to basic water services; (b)
crop and livestock water security; (c) clean and
healthy water environment; and (d) secure and
equitable water entitlement (Sullivan et al., 2008).
Water is an essential pre-requisite for
development, not only because it is inextricably
linked to agriculture and other production functions
but also because it can be a focal point around
which other interventions can be designed (World
Water Assessment Programme, 2009). The
examples collected from the field for the United
Nations World Water Development Report (ibid.)
exemplify the latter whereby water and sanitation
interventions in the villages proved to be a starting
point for Non-governmental Organisations (NGOs)
and government agencies to address other
concerns like gender imbalance and secure
livelihoods. One such economic enterprise which
generates income for the people is inland fisheries,
a crucial livelihood support system to rural and
urban poor. In the wake of changing patterns of
growth, escalating inter-sectoral water competition
and rising population have emerged as some of the
serious concerns (see Box 2.2).
Box 2.2: Water for Livelihoods: Case of Inland
Fisheries
ŸIn a study conducted in the Tungabhadra sub-
basin, Karnataka, 47 per cent of the fishermen
surveyed cited pollution and fish kills as having a
negative impact on health and income. According
to the findings, 'Instances of fish kill have
abounded at different stretches of the river, for
instance, in Hale Ayodhya, in 2004; fish kill was
very intense, where the fishing communities were
unable to fish for the whole year. There are
documentations on the composition of fish
species that have been reduced or have become
extinct over the years'.
(Source: Manasi, et al., 2009)
ŸIncreased urbanisation and other anthropogenic
activities are also hampering traditional livelihood
practices of the people. For example, the Dal
Lake, which is a source of income for the 1,200
houseboat owners and fishermen, has shrunk to
less than half its original size in just 30 years . The
Lakes and Waterways Development Authority
blames the people living on the lake for this sorry
state, even as the raw sewage from Srinagar's
million plus inhabitants continue being dumped
into it.
(Source: Byerly, 2010)
ŸA study (1999-2000) of the leather industries in
Vellore district of Tamil Nadu by Sekar (2003),
reveals that pollution of the common property
resources (river Palar in the study) due to
Table 2.5: Comparative Water Use by Industry
Country
Industrial water use
(billion cubic metres)
Argentina
2.6
Brazil
9.9
India
15.0
Republic of Korea
2.6
Norway
1.4
Sweden
0.8
Thailand
1.3
United Kingdom
0.7
Source: World Bank (2001) cited in CSE (2004)
Industrial productivity
(million US$)
77,171.0
231,442.0
113,041.0
249,268.0
47,599.0
74,703.0
62,800.0
330,097.0
Industrial water productivity
(US$/cubic metres)
30.0
23.4
7.5
95.6
35.0
92.2
48.9
443.7
25

5.4 Page 44

▲back to top


industrial effluents had altered the cropping
pattern, employment potential, income
distribution in the area, leading to social
instability.
(Source: Sekar, 2003)
2.6 Water: Multiple Use of the Resource
Water has multiple functions social, economic and
environmental. Historically, water from the same
source has been used for different purposes
simultaneously. In rural India, the water received or
procured by a household is not only used for
drinking and personal hygiene, but also for
livestock, fishing, kitchen gardening, brick making,
and other varied small enterprises. It is primarily the
rural poor and people living in the peri-urban areas
who depend on water for diversified livelihoods
(van Koppen et al., 2006). An assured water supply
in terms of quantity, quality and reliability with
improved access can benefit these communities in
two ways: by enabling resource base for these
water dependent livelihoods and/or by helping
them save precious time spent earlier in collecting
water; time that can be used for livelihoods.
Moriarty et al. (2004) use the concept of 'productive
use' of water to refer to water used for small-scale,
often informal, activities whose primary purpose is
improved nutrition and/or income generation.
According to them, “[H]ousehold water supplies are
most often thought of as coming under the remit of
the domestic water supply and sanitation
(WATSAN) sub-sector, with its exclusive focus on
water supplies for drinking, washing, cooking, and
sanitation (so-called basic needs). Water for
agricultural production is assumed to be provided
by the irrigation sector, but this in turn seldom
focuses on smaller scale or domestic uses at the
household scale. (ibid.: 21).“
Thus, these multiple water use services have a lot
to contribute in terms of livelihood security and the
overall well-being of these people who otherwise
face a serious resource crunch. While a community
designed system will take into consideration the
entire multiple uses to different extents, it is the top-
down approach of water management by the
various government departments which fails to
acknowledge the same due to their highly
segregated sectoral approach. In many areas, big
irrigation schemes that supply large quantities of
water would come up, even though the demand for
basic survival needs of the population is not
fulfilled. While in quantitative terms, it might be
easy to manage the water needs of households
from reservoir supplies, there are two common
constraints in allocating water from such systems.
First, the water available through irrigation
schemes may not meet potability standards.
Second, the irrigation sources, which primarily
supply water to farms located far away from village
settlements, may not be easily accessible for the
rural households.
2.6.1 Multiple Use Water Services (MUS): The
Indian Experience
Water allocation by state agencies in India is not
based on environmental, social, economic, or
fundamental rights considerations. For instance,
the rural water supply agencies in most Indian
states are concerned with supplying only 40 lpcd of
water for basic human needs, without considering
the water needs for cattle rearing, and watering
homesteads, which are basic necessities of the
rural households. National Rural Drinking Water
Programme (NRDWP) guidelines stipulate that 40
lpcd water supply for drinking, cooking and bathing
should maintain quality as per BIS standards and
additional 30 lpcd for Desert Development
Programme (DDP) areas to cover livestock.
However, for other household and animal needs,
other water sources of acceptable standard should
be used. Thus, it leaves much to be desired from
the point of view of equity and social justice. Water
administration, works by compartmentalizing the
broad functions of water supply into departments
such as irrigation, drinking water, industrial water
supply, etc., with about ten different ministries
dealing with various aspects of water (CSE,
2004).25 The statutory laws which govern the
functioning of such bodies may not be relevant to
the situation on the ground, where water allocation
might be governed by customary laws, religious or
cultural norms, and local administration and
politics.26 In India, as elsewhere, an ongoing
scheme of water supply in an area is used by the
people to serve other water needs as well.
Reiterating this fact were the findings of Mikhail and
Yoder (2008) in Maharashtra from their study of
MUS implementation in Nepal and India. In this
study on the implementation of multiple use water
service in India, it was found that while government
departments would make a distinction between
various water uses, the people had been using four
successive water schemes over the past 20 years
to meet a variety of their water needs. However,
because these uses are unplanned and rarely
acknowledged, they often lead to health risks for
water users, water shortages at the tail end of
supply systems, damage to infrastructure, and
conflicts between users.
In the Gangetic flood plain of West Bengal,
wetlands are used as multiple use systems and
have a significant impact on the livelihoods of rural
people who derive major economic benefits from
wetland cultivation, direct irrigation, jute retting,
25For example, MoWR, MoI, MoP, MoEF, MoRD, MoUD and agencies like the Central Ground Water Board Authority, central and state
pollution control boards.
26See, for example, Cullet (2007: 5-6)
26

5.5 Page 45

▲back to top


and fisheries. The most important benefit is from
fisheries, followed by wetland cultivation and jute
retting.27 However, these benefits also depend on
the agro ecology, socio-economic conditions and
the cultural context. In Sambalpur district of
western Orissa, the village tanks serve functions as
varied as a source of water supply for paddy and
vegetable cultivation, for domestic use, for
livestock, reservoir for fish cultivation and for
recreation, with highest economic benefits
accruing from irrigation. More importantly, the
economic value realised from the use of water for
irrigation was high during years of drought as
compared to normal rainfall years (Kumar et al.,
2011). Field-based research by the Indian Council
of Agricultural Research (ICAR) in Bihar and Orissa
show that well-designed multiple user systems can
enhance the productivity of soil and water in
eastern India remarkably (Sikka, 2009). This
involved integrating fisheries, prawn farming and
duck-keeping with paddy irrigation using local
secondary reservoirs for the water. Research in
south India shows how the revenue maximisation
can be possible by using irrigation tanks for multiple
uses such as social forestry, brick making,
fisheries, silt collection and groundwater recharge
(Palanisami et al., 2010). James (2004), in his
study in Banaskantha in Gujarat and Anantapur in
Andhra Pradesh noted that rural women allow the
time saved by improved water supply to other
productive work. In this way, each woman could
earn between US$16 and US$115 per year.
Similarly, from her work on gender roles and
multiple uses of water in north Gujarat, Upadhyay
(2005) concludes that women have a central role to
play in many socio-economic production functions
dependent on water such as dairy farming and crop
cultivation, in addition to collecting water for
domestic needs, and, therefore, MUS would prove
to be beneficial for them.
Taking a cue from the successful implementation of
MUS by International Development Enterprises
(IDE) in the hills of Nepal, Sharma et al. (2010)
have discussed how MUS can be used for poverty
alleviation in India's north-eastern hilly region.
Malik 2010,28 while analysing the level of water
security provided through infrastructure built as
part of the Mahatma Gandhi National Rural
Employment Guarantee Scheme (MNERGS),
found that although the structures allowed multiple
uses of water, the water made available for each
use may not be sufficient to meet thel
requirements. About 43 per cent of the sampled
farmers used the water available from these
structures for single use only, as against 26 per
cent who use it for at least four purposes, viz.,
irrigation, livestock, drinking and sanitation.
Other pilot projects of MUS are also being tried in
different parts of India. For instance, in one of the
three pilot experiments being carried out by the
United Nations Children Fund (UNICEF),
Groundwater Survey and Development Agency,
Maharashtra , and Institute of Resource Analysis
and Policy (IRAP) in Satara district of western
Maharashtra involves converting a natural spring-
based rural water supply scheme in a foothill village
into MUS that would cater to the water needs for
livestock and kitchen gardens. Studies found that it
would be possible to augment the limited water
supplies during lean season through the creation of
a large underground reservoir which can tap the
spring discharge during the wet season and supply
water during summer.
2.6.2 MUS in India: Barriers to Scale-Up29
While the vast experience from around the world
suggests that MUS systems would be socially and
economically more viable than many single use
systems,30 there are multiple blocks at the
government level to start designing the system for
multiple use such as irrigation and domestic water
supply. Wherever such efforts have been made,
some barriers to the scale-up process are
observed. The following barriers were identified by
the locals and NGOs with regard to MUS in
Maharashtra:
ŸInstitutional Inadequacy: Although most single
use systems are de facto multiple use systems at
the level of the water users, government officials
still follow the sectoral norms of water supply and
distribution as set during the colonial period. Part
of the problem lies in the way in which water
administration is organised in Indian states.
ŸQuality and Quantity of Water Required: Due to
the conflicting nature of demands vis-à-vis
quality, quantity and reliability between sectors
(for example, while quality and high dependability
is important for drinking water supply, quantity is
more important for meeting irrigation
requirements), designing and water delivery of
the MUS may become difficult.
27Mukherjee (2008) as cited in Khan (2010: 5)
28Cited in Clement (2011). Inputs received on 23 February 2011 from Floraine Clement (IWMI) for the query posted on Solution Exchange
website, Available at: http://www.indiawaterportal.org/sites/indiawaterportal.org/files/Inputs_for_India_Water_Development_Report-
Experiences_Advice.pdf [Accessed on: 1 April 2011].
29This section is based on the experiences of IDE from the MUS implementation in Maharashtra (Mikhail and Yoder, 2008). This is also in
the light of the fact that MUS is a highly understudied subject in India even though there are greater evidences of multiple use water
systems in many locations in India.
27

5.6 Page 46

▲back to top


ŸLand Use: Due to land use constraints, whatever
little land is available may preferably go to
agricultural use rather than other uses like
homesteads and kitchen gardens
ŸTime lapse in Completion of Projects: Constraints
like the callous attitude of the authorities
combined with administrative red-tapism and
delayed awarding of contracts due to prolonged
rainy season, prevent water delivery schemes
from reaching a state of completion in a timely
manner. This, in turn, hampers related schemes,
which cannot be initiated until the original
scheme is completed.
ŸCommunity Barriers: Community participation is
crucial for the successful running of multiple use
water systems. However, due to the water
allocation issues often going against the interests
of the local population, there is a lack of good
rapport between communities and official
agencies and NGOs. The reluctance of the local
population to contribute to the scheme and its
management too acts as a barrier to the
successful implementation of such projects.
Ÿ Government Barriers: Different policies at the
centre and states may lack coherence with
ground realities. For instance, water supply
schemes in many Indian states are designed with
rigid norms regarding per capita water supply for
drought-prone areas. Relaxing these norms and
making upward revisions would require a high
level of coordination within the state
administration amongst senior policy makers. A
highly centralised bureaucracy makes it difficult
for different departments at varied levels to
achieve such coordination. Often the officials
may also be indifferent if an issue of self-interest
is involved.
ŸIssues of Fund Allocation: While it is understood
that MUS would benefit the communities by
supplying water for both productive and domestic
needs, there would be an increase in the number
of agencies contributing to the schemes. For
instance, given the fact that dairy, horticulture,
fisheries, etc., would be promoted with the
improved water supply in rural areas through a
well-designed MUS, the concerned departments
will have to earmark funds for the implementation
of the scheme as against a single agency, that is,
the rural water supply department for now. This is
not an easy task, as it would involve attribution of
different cost components of the scheme to
different purposes.
2.7 Summing Up
Meeting the rising water demand is a pressing
challenge that India currently faces. Demand side
management has been put forward as a viable
option but it requires strong political will backed by
adequate infrastructural support. Many models of
demand side management like the public-private
partnership, water pricing, metering, etc., have
been suggested and tested. But the 'one size fits all'
approach is far from applicable in the context of
India. Meeting target ten (halve, by 2015, the
proportion of people without sustainable access to
safe drinking water) of goal seven (ensuring
environmental sustainability) of the MDGs will
indeed be a herculean task considering that the
water sector suffers from major deficit of funds with
almost all schemes failing to recover the operation
and maintenance costs, let alone the capital costs
for infrastructure. The significant achievements by
India in the engineering sphere of water resource
development continue to be undermined by the
poor demand and supply side management.
Agricultural demand for water will continue to
dominate. Even as the disenchantment with
agriculture continues, it nonetheless remains ‘the
backbone of the Indian economy. As the World
Bank puts it, the irrigation and hydropower are the
'direct benefits', which in turn generate both inter-
industry linkage impacts and consumption-induced
impacts on the regional and national economy’
(World Bank, 2005). But the excessive level of
groundwater exploitation by the agriculture sector
needs to be addressed to ensure the sustainability
of the resource. Lost in the rhetoric of development
are the voices of the poor and the marginalised at
whose expense the country continues to 'develop'.
Traditional livelihoods dependent on water are
being lost, thus changing the social dynamics of the
country. Ecological needs rank fourth on the water
allocation priorities in the National Water Policy
(NWP) but in practice it remains dismal. The
increasing pressure from industries on water
resources is for everyone to see but an industrial
water policy is still the want of the day. It is
imperative that in future, all the sectors , viz.,
domestic, agricultural and industrial will compete
with each other due to a rise in demand. The inter-
sectoral conflicts have not yet reached the
magnitude of water wars, but have at many places
transformed into serious political and
developmental issues. Considering the multiplicity
of water needs and their linkages with rural
livelihoods there is a need to rethink the way in
which water supply projects are being planned
today. Where problems in the management of
water supply schemes exist, they can often be
traced back to the fact that some of the existing
uses of water were not considered at the time of
building the project. No source is generally used for
a single purpose and so all potential users must be
involved at the time of planning the scheme. As is
30For instance, as a review of the literature shows, many large irrigation schemes in Thailand are designed as multiple use systems
catering to fisheries, domestic water supply, recreation, hydropower, and rural industries.
28

5.7 Page 47

▲back to top


the case with Indian water sector, MUS could be the
solution to several problems currently plaguing the
sector, including poor maintenance, low cost
recovery and poor overall economic and financial
viability. Water demand has both quality and
quantity dimensions. A factor that severely limits
the water availability to different sectors is water
pollution, which is dealt with in the following
chapter.
References
Anappara, Deepa. 2005. 'Mining Away the River', India
Together. Available at:
http://www.indiatogether.org/2005/jun/env-
sandmine.htm (accessed on 21 December 2011).
Annual Status of Education Report (ASER). 2011. Right
to Education Report Card 2011. New Delhi: ASER
Center. Available at http://www.asercentre.org/
[accessed on 12 January 2012].
Addams, L., G. Boccaletti, M. Kerlin, and M. Stuchtey.
2009. Charting Our Water Future: Economic
Frameworks to Inform Decision-making. Available at:
http://www.mckinsey.com/App_Media/Reports/Water/C
harting_Our_Water_Future_Full_Report_001.pdf.
[Accessed on 2 April 2011].
Asian Development Bank (ADB). 2009. 'Water
Resources Development in India: Critical Issues and
Strategic Options'. Asian Development Bank, New Delhi.
Available at
http://www.adb.org/Documents/Assessments/Water/IN
D/Water-Assessment.pdf [Accessed on 6 January 2011].
Bhushan, C. 2006. 'Bottled Loot', Frontline. Available at:
http://www.frontline.in/fl2307/stories/200604210067023
00.htm (accessed on 20 December 2011).
Boruah, M. 2011. 'Lack of Little Girls' Rooms Leads to
High Dropout Rates in Karnataka'. Available at:
http://www.dnaindia.com/bangalore/report_lack-of-little-
girls-rooms-leads-to-high-dropout-rates-in-
karnataka_1501187 (accessed on 21 Decemeber 2011).
Byerly, R. 2010. ''Venice of Asia' Canals Disappearing:
Kashmir's Tourist Houseboats May Shut Down Due to
Pollution, Overcrowding', National Geographic News.
Available at:
http://news.nationalgeographic.com/news/2010/06/100
609-kashmir-houseboats-himalayan-glaciers-water/
[Accessed on 27 January 2011].
Central Pollution Control Board (CPCB). 2009.
Comprehensive Environmental Assessment of Industrial
Clusters. New Delhi: The Energy and Resources Institute
Press.
Centre for Science and Environment (CSE). 2004.
'Industrial Water Use: Overused, Underrated'. Available
at: http: / /www.cseindia.org /dte- supplement / industry
20040215/industry-index.htm [Accessed on 2 February
2011].
Central Water Commission (CWC). 2009. 'National
Register of Large Dams'. Available at:
http://www.cwc.nic.in/main/downloads/National%20Re
gister%20of%20Large%20Dams%202009.pdf
[Accessed on 2 March 2011].
Cullet, P., 2007. Water Law in India: Overview of Existing
Reforms and Proposed Reforms, pp 5-6. Geneva:
IELRC.
Dandekar, P and H. Thakkar. 2010. 'Wetland
(Conservation and Management) Rules 2010 Welcome,
but a lost opportunity: This cannot help protect the
wetlands, Sir', South Asia Network for Dam, Rivers and
People, vol 8,nos 11-12, pp. 1-11.
Department of Drinking Water and Sanitation (DDWS).
2011. 'Coverage Status of Habitations' (as on April 2011)
Available at:
http://indiawater.gov.in/IMISWeb/Reports/rws/rpt_Cove
rageHabitationStatus.aspx. [Accessed on 12 September
2011].
Food and Agricultural Organisation (FAO). 2010.
'Aquastat Country Profile: India'. Available at:
http://www.fao.org/nr/water/aquastat/data/factsheets/aq
uastat_fact_sheet_ind_en.pdf [Accessed on 20 October
2011].
Iyer, R. 2011. 'National Water Policy: An Alternate Draft
for Consideration', Economic and Political Weekly, vol.
XLVI, nos 26&27, pp. 201-214.
Khan, M.A. 2010. Enhancing Water Productivity through
Multiple Uses of water in Indo Gangetic basin.
Montpellie, France: Innovation and Sustainable
Development in Agriculture and Food (ISDA).
Khurana, I. and R. Sen. 2007. 'Drinking Water Quality in
Rural India: Issues and Approaches', Water Aid.
Available at:
http://www.corecentre.co.in/Database/Docs/DocFiles/dr
inking_water .pdf. [Accessed on 4 February 2011].
Kulkarni, H., S. Krishnan, and P.S. Shankar. 2011.
'India's Groundwater Challenge and the Way Forward',
Economic and Political Weekly, vol. XLVI, no. 2, pp. 37-
45.
Kumar, M. Dinesh, R. Panda, N. Vedantam, N. Bassi,
and S. Mukherjee. 2011. 'Tank Ecology and Multiple
Uses of Water in Villages of Western Orissa: Technology
Choices, Economics, Institutions and Livelihoods', Draft
report submitted to IWMI-Tata Water Policy Research
programme, IWMI South Asia Sub-Regional Office,
Patancheru, Andhra Pradesh.
James, A.J. 2004. 'Linking Water Supply and Rural
Enterprise: Issues and Illustrations from India',in P.
Moriarty, J. Butterworth, and B. Van Koppen, Beyond
Domestic: Case Studies on Poverty and Productive Uses
of Water at the Household Level, pp. 199-216. Technical
Paper Series no. 41. Delft, the Netherlands: IRC
International Water and Sanitation Centre .
Joy, K.J. and S. Paranjape. 2008. 'Water Conflicts,
Contending Water Uses and Agenda for a New Policy,
Legal and Institutional Framework', Paper presented at
International Conference on Water Resources Policy in
South Asia organised by SaciWATERs at Colombo, Sri
Lanka.
Manasi, S., N. Latha, and K.V. Raju. 2009. 'Fisheries and
Livelihoods in Tungabhadra Basin, India: Current Status
29

5.8 Page 48

▲back to top


and Future Possibilities', Working Paper 217. Bengaluru:
ISEC.
Mikhail, M. and R. Yoder. 2008. Multiple Use Water
Service Implementations in Nepal and India:
Experiences and Lessons for Scale up. USA: CPWF, IDE
and IWMI.
Millennium Ecosystem Assessment. 2005. 'Ecosystems
and Human Well-being: Wetlands and Water', Synthesis,
World Resources Institute, Washington, DC.
Ministry of Environment and Forests (MoEF). 2009.
State of Environment Report, 2009. New Delhi: MoEF,
Government of India.
Moriarty, P., J. Butterworth, and B. Van Koppen. 2004.
Beyond Domestic: Case Studies on Poverty and
Productive Uses of Water at the Household Level.
Technical Paper Series no. 41. Delft, the Netherlands:
IRC International Water and Sanitation Centre.
Palanisami, K., Ruth Meinzen Dick, and M. Giordano.
2010. 'Climate Change and Water Supplies: Options for
Sustaining Tank Irrigation Potential in India', Review of
Agriculture, Economic and Political Weekly, 26 June.
Planning Commission. 2008. Eleventh Five Year Plan
(2007-2012). New Delhi: Oxford University Press.
Prasad, S.N., T.V. Ramachandra, N. Ahalya, T.
Sengupta, A. Kumar, A.K. Tiwari, V.S. Vjjayan, and L.
Vijayan. 2002. 'Conservation of Wetlands in India: A
Review', International Society of Tropical Ecology, vol.
43, no. 1, pp. 173-186.
Sekar, C. (2003). 'Industrial Pollution and its Impacts on
Soil, Water, Crop, Livelihood Status and Ecology: A Micro
Level Investigation in Vellore District of Tamil Nadu',in K.
Chopra, C.H. Rao, and R. Sengupta (eds), Water:
Resources, Sustainable Livelihoods and Ecosystem
Services, Ch. 12, pp. 240-264. New Delhi: Indian Society
for Ecological Economics.
Sharma, B.R., M.V. Riaz, D. Pant, D.L. Adhikary B.P.
Bhatt, and H. Rahman. 2010. Water Poverty in the
Northeastern Hill Region (India): Potential Alleviation
through Multiple-use Water Systems - Cross Learnings
from Nepal Hills, IWMI-NAIP Report 1, International
Water Management Institute, New Delhi.
Sikka, Alok, K. (2009). 'Water Productivity of Different
Agricultural Systems',in M. Dinesh Kumar and U.
Amarasinghe (eds), Water Productivity Improvements in
Indian Agriculture: Potentials, Constraints and
Prospects, Strategic Analyses of the National River
Linking Project (NRLP) of India, Series 4. Colombo:
International Water Management Institute.
Sullivan, C.A., A. Cohen, J.M. Faures, and G.
Santini.2008. 'The Rural Water Livelihoods Index: A Tool
to Prioritize Water-related Interventions for Poverty
Reduction', Food and Agriculture Organization of the
United Nations and International Fund for Agricultural
Development, Rome. Available at:
http://www.fao.org/nr/water/docs/FAOW_RWLI_paper.p
df [accessed on 16 February 2012].
Thakkar, H. 2005. 'Who pays for our giant follies?'
Infochange Agenda. Available at:
http://infochangeindia.org/ index2.php?option=com_
contentanddo_pdf=1andid=5607. [Accessed on 2 March
2011].
United Nations Development Programme (UNDP). 2011.
Human Development Report, 2011. Available at:
http://hdr.undp.org/en/reports/global/hdr2011/download
/. [Accessed on 10 November 2011].
Upadhyay, B. 2005. 'Gendered Livelihoods and Multiple
Water Use in North Gujarat', Agriculture and Human
Values, vol. 22, pp. 411-420. Available at:
http://www.springerlink.com/content/f0175
277117638k1/. [Accessed on 23 February 2011].
UN-HABITAT. 2006. Water Demand Management
Strategy and Implementation Plan for Bhopal, Gwalior,
Indore and Jabalpur. New Delhi: UN-Habitat.
Van Koppen, B., P. Moriarty, and E. Boelee. 2006.
Multiple-use water services to advance the millennium
development goals. Research Report 98. Colombo, Sri
Lanka: International Water Management Institute,
(IWMI).
Wetlands International. 2010. Wetlands & Water,
Sanitation and Hygiene (WASH): Understanding the
Linkages. The Netherlands: Wetlands International.
WHO-UNICEF. 2010. Estimates for the Use of Improved
Sanitation Facilities. Joint Monitoring Programme for
Water Supply and Sanitation. Available at:
http://www.wssinfo.org/ [Accessed on 24 February
2011].
World Bank. 2005. India's Water Economy: Bracing for a
Turbulent Future, a report. Washington DC: World Bank.
Water and Sanitation Programme (WSP). 2010. The
Economic Impact of Inadequate Sanitation in India.
Available at:
http://www.wsp.org/wsp/sites/wsp.org/files/
publications/wsp-esi-india.pdf [Accessed on 10 April
2011].
World Water Assessment Programme. 2009. The United
Nations World Water Development Report 3: Water in a
Changing World. Paris: UNESCO, and London:
Earthscan.
30

5.9 Page 49

▲back to top


3.1 Urban Population Growth
share of urban population was 25.49 per cent in
1991, which has increased to 31.16 per cent in
The urban population of India is now 377.1 million
(Census of India, 2011), which is 31.16 per cent of
the country's total population. The decadal urban
2011. The number of towns (urban centers) have
increased from 5,161 to 7,935, an addition of 2,774
towns during 2001-11.
population growth rate during 2001-11 is 31.8 per
cent, which is 1.8 times the overall and 2.6 times
the rural population growth, and the absolute
3.2 Slums and the Urban Poor
increase in urban population is more than the rural
population (see Table 3.1).
There is a wide variation in the estimation/reported
slum population by various government and other
Table 3.1: Population Growth During 1991-2011
agencies. The Census of India 2001 reported a
slum population of 42.6 million from 640 towns of
the country which was 14.88 per cent of the
Population
(in millions)
1991
2001
Addition during total census population (it did not include
2011
1991-2011 towns with a population below 50,000 and
few town and cities with populations of more
India [Total] 846.4 1028.7 1210.2
363.8
than 50,000 where local bodies did not
recognise any slum area). Later, it also
Rural
630.6 742.6 833.1
202.5
included towns with populations between
20,000-50,000 and reported slum
Urban
215.8 286.1 377.1
161.3
populations of 52.4 million from 1,743
cities/towns. The reported slum population
Share of
was less than the Town and Country
Urban
25.49 27.81 31.16
Population%
44.34
Planning Organization's (TCPO) estimated
slum population of 61.8 million. The UN
population report estimated a 158.42 million
Source: Provisional population totals, Census of India (2011)
slum population was less than the Town and
Country Planning Organization's (TCPO)
Historically, India is known as the country of
villages, but the population composition of the
country in last two decades has changed
significantly. During 1991-2011, the overall
estimated slum population of 61.8 million. The UN
population report estimated a 158.42 million slum
population in 2001 (Ministry of Housing and
Poverty Alleviation, 2010).
population of the country increased by 43 per cent –
the rural population increased by 32 per cent while
urban population increased by 75 per cent. The
The Committee on Slum Statistics and Census
(constituted by the National Building Organisation,
31This chapter is written by Health of the Urban Poor Programme of the Population Foundation of India (PFI). In particular, Anand Rudra,
USAID, India, Sainath Banerjee HUP -PFI, Shipra Saxena HUP –PFI, Biraja Kabi Satapathy HUP-PFI, Meeta Jaruhar HUP-Plan,
Merajuddin Ahmad HUP – Plan, Himani Tiwari HUP- IIHMR, Anil Kumar Gupta HUP-Plan, Johnson R Jeyaseelan HUP-PFI and Sanjay
Vijayvargiya, Consultant HUP PFI contributed to this chapter. The authors acknowledge the support of the United States Agency for
International Development (USAID). The contents are the responsibility of PFI and do not necessarily reflect the views of USAID or the
United States government. For more information about PFI, please visit: www.populationfoundation.in.
33

5.10 Page 50

▲back to top


Ministry of Housing and Poverty Alleviation,
strategies were developed to minimise water
Government of India in 2008) estimated a 75.26
losses and to increase revenue for municipal
million slum population in 2001 and projected that
corporations (UN-HABITAT, 2006).
slum populations would reach 93.05 million by
2011 (which is about 25 per cent of the provisional
Discharge of untreated sewage is the most critical
population of 2011). Further, UN-HABITAT
water polluting source for surface and groundwater
estimated the slum population at 169 million in
in India. Estimated sewage generation from Class I
2004-5 (Ministry of Health and Family Welfare,
and Class II cities is about 38,000 million l per day
2009). Although the 11th Five Year Plan (2007-12)
(80 per cent of the water supply) and only 31.5 per
considered the census slum population (42.6
cent of the generated sewage can be treated per
million, 14.88 per cent) but it is also mentioned in
day on the basis of the installed capacity. Estimated
the document that 'almost 30–40 percent of India's
sewage generation by Class I cities is 35,558 MLD
urban population lives in slums' (Planning
and sewage treatment capacity is only 32 per cent
Commission, 2008).
of the total sewage generated. Estimated sewage
generation from Class II cities is about 2,697 MLD
3.3 Urban Water Supply and Sewerage
and the treatment capacity is only 8 per cent of the
generation. Thus, 70 per cent of untreated sewage
According to the Census of India 2001, there were
498 Class I and 410 Class II cities in the country;
the estimated total population of these cities in
from Class I cities and 92 per cent from Class II
cities contaminates surface and groundwater on a
daily basis (see Table 3.2)
2008 was 257.75 million and total water supply was
48090.88 MLD. Average per capita water supply in
Class I and Class II cities
Table 3.2: Sewage Treatment Capacity of Class I
and Class II Cities of some States
was 179.02 and 120.79 l
per day (CPCB, 2009).
Population (2008
Sewage Treatment Capacity
Water supply is not
State
estimated) million
(% of sewage generation)
uniform across all states
or cities. The average per
Class I cities Class II cities Class I cities Class II cities
capita water supply for Maharashtra
40.25
2.50
42
13
Class I cities of Tamil
Nadu is 79.9 l and for Uttar Pradesh
25.76
3.38
35
03
Maharashtra, it is 310.09
l whereas the average Delhi
14.85
61
per capita per day water
supply for Class II cities Madhya Pradesh
10.79
1.74
15
07
of the state is 106.74 l.
Among the Class II cities Rajasthan
9.61
1.59
04
of Maharashtra, water
supply ranges between Odisha
3.33
0.90
08
34.5 LCPD in Malkapur Chhattisgarh
2.51
0.56
20
to 464.94 LCPD in
A n j a n g a o n . S u c h Bihar
variations are common
5.78
1.10
13
02
across all the cities and Tamil Nadu
states of the country. One
16.85
3.25
31
16
of the major reasons for Andhra Pradesh
20.14
3.44
37
05
wide variation in per
capita water supply is the Uttarakhand
1.24
0.06
10
70
mismanagement of the
water supply system.
Source: CPCB (2009)
Levels of system losses through 'unaccounted-for
water' or 'non-revenue water' are often as high as
50 per cent in Indian cities and represent large
financial and environmental losses to cities and
3.4 Status of Drinking Water and
Sanitation
their economies. A UN-HABITAT supported study
for four cities of Madhya Pradesh has revealed that
this Non-Revenue Water (NRW) ranged between
31 per cent and 49 per cent in Bhopal, between 37
per cent and 43 per cent in Jabalpur, and between
36 per cent and 66 per cent in Gwalior. Based on
the study, city-specific water demand management
As per census 2011, 70.6 percent of urban
households use tap water for drinking, of which
62.0 percent is treated and 8.6 percent remains
untreated. 20.8 percent use water from hand pump
/ tube well, 6.2 percent use water from well, of
which 1.7 percent are covered and 4.5 percent un-
34

6 Pages 51-60

▲back to top


6.1 Page 51

▲back to top


covered. 71.2 percent of urban households have
source of water within the premises while 20.7
percent households have to fetch water from a
source located 100 meters from the premises and
8.1 percent household collect water from a source
located beyond 100 meters.
The census 2011 data shows that 18.6 percent
households in urban India do not have latrines
within the premises. 6 percent urban households
use public latrines.32.7 percent Pour flush latrine in
urban areas connected to sewer pipes. At the same
time, pour flush latrine connected to a septic tank is
recorded in 38.2 percent of households.It is
reported that 95 per cent of urban households have
access to improved source of water (NFHS-III,
2005-6)32 and access to improved source of water
is not a reflection of availability of safe drinking
water. It is also reported that about 78 per cent of
India's urban population has access to safe
drinking water (CPCB, 2009).
Location is the deciding factor for source and
availability of drinking water. It is reported that 50.7
per cent of urban households have access to piped
water supply at home but access in non-slum and
slum areas is 62.2 and 18.5 per cent respectively.33
Further, the disparity on the basis of tenure status is
more severe and, generally, households of the non-
notified slums are totally deprived from piped water
supply in a dwelling unit (see Figure 3.1).
According to NFHS-III, of the total urban
households, 50.4 per cent have access to sanitary
facilities (either flush or pit), but out of the total
urban poor only 18.2 per cent have access to
sanitary facilities while 62.2 per cent of the non-
slum population has access to sanitation facility.
Figure 3.1: Status of Piped Water Supply and
Sanitary Facility for Urban Poor and Non-poor
Urban poor
18.5
47.2
Non-poor
62.2
95.9
Overall Urban
Sanitary Facility
50.4
83.2
Piped Water
Source: NFHS III
The sanitary coverage includes individual as well
as community toilets. As per NFHS–III, 52.8 per
cent of urban households have access to improved
but not shared toilet facility, 24.2 per cent have
access to shared facility, 0.5 per cent have access
to dry toilets and about 16.8 per cent have no facility
and defecate in the open. The disparity in access to
improved not shared (individual) toilet facility
between slum and non-slum households is very
clearly visible (see Figure 3.2).
Provision of services and coverage further
depends on the tenure status of a settlement; it may
be categorised as a legal/illegal, notified/non-
notified, listed/non-listed,
recognised/unrecognised slum according to the
state's slums act. Sanitation conditions in both
recognised and unrecognised slums are appalling.
For example, Jaipur is the capital of Rajasthan with
a million plus people, that is, 86.5 per cent of the
population, as per the City Development Plan of
Jaipur City (JNNURM, 2011: 13), covered through
Table 3.3: Waste and Sanitation Coverage Details of Selected States
State
% Households with access to
piped water supply at home
% Households accessing
public tap/handpump
% Households using sanitary
facility (flush/pit)
Urban non
Urban non
Urban non
Urban poor
poor
Urban total Urban poor
poor
Urban total Urban poor
poor
Urban total
Maharashtra
47.8
87.5
81.3
48.2
11.5
17.2
50.1
94.9
87.9
Uttar Pradesh
11.5
40.9
32.2
84.6
58.1
65.9
53.5
96.4
83.8
Delhi
29.8
82.3
75.0
63.3
7.9
15.7
65.6
98.6
94
Bihar
2.8
17.1
11.9
90.3
80.6
84.2
29.5
98.0
72.9
Madhya Pradesh
22.9
60.2
47.1
58.2
36.3
44.2
22.9
93.7
71.2
Rajasthan
51.7
87.3
80.7
44.9
10.5
16.9
44.6
94.6
85.4
All States
18.5
60.2
50.7
72.4
30.7
41.6
47.2
95.9
83.2
Source: Compiled on the basis of key indicators for urban poor, available at http://uhrc.in/module
32National Family Health Survey (NFHS) – III, 2005-6, available at http://www.nfhsindia.org/NFHS-3%20Data/VOL-
1/India_volume_I_corrected_17oct08.pdf (accessed 10 September 2011).
332005-6, 'Key Indicators for Urban Poor in India', available at http://www.uhrc.in/name-CmodsDownload-index-req-getit-lid-99.html
(accessed 16 October 2011).
35

6.2 Page 52

▲back to top


the Public Health Engineering Department's
(PHED) water supply system while the remaining is
covered by another system. Further, it is also
mentioned that 45 per cent of urban poor families
are dependent on community water sources, 39
per cent on private water sources and 16 per cent
have no definite source of water. Whereas,
according to the study conducted by the Mahila
Housing Sewa Trust (2009), 26 per cent of slum
households have access to in-house tap
connections, 37 per cent are dependent on public
taps, 17 per cent are dependent on neighbours, 8
per cent are dependent on private sellers, and
about 25 per cent of slum households have no
definite source of water. The sewerage facility
covers 65 per cent of the city area, and
slums/kachchi bastis are neither covered by the
sewerage network nor by septic tanks, and 48 per
cent of slum households have no sanitation facility
and defecate in the open (HUP-IIHMR, 2011).
Figure 3.2: Percentage of households (slum and
non-slum) with access to improved individual
toilets
Source: MoHFW (2009)
A UN-HABITAT supported poverty mapping
situation analysis study in partnership with
WaterAid India in four major cities of Madhya
Pradesh (Bhopal, Gwalior, Indore and Jabalpur)
revealed that access to piped water for slum
communities range from 28 to 65 per cent, and that
31 to 66 per cent households depend on public
standposts and the rest on private sources.
Further, it showed that access to household toilets
in slum communities range from 48 to 76 per cent,
that 6.1 to 8.0 per cent households use community
toilets, and that 16 to 46 per cent households
defecate in the open (WaterAid, 2006).
The National Capital Territory of Delhi is an
example of the provision of the services as per
tenure status. It is reported that improved sources
of drinking water and improved individual sanitation
facility is accessed by 92.6 and 63.9 per cent of
households respectively and 75 per cent have
piped water supply at home. But only 49 per cent of
slum households have piped water at home. In
Delhi, slums are broadly divided into two
categories: notified slums and non-notified slums.
Generally, the jhuggi/jhopari (JJ) clusters are in the
category of non-notified/listed/identified slums.
The Delhi Shelter Improvement Board reported
685 JJ clusters and 4.18 lakh jhuggies (Delhi Urban
Shelter Improvement Board, 2011) and the 65th
round of the National Sample Survey (NSS)
reported 4,390 slums with 5.77 lakh (0.577 million)
households and 2.8 million population. Only 21.7
per cent of the JJ clusters are covered with piped
water supply (JNNURM, 2011) and individual tap
connections are not allowed in the JJ clusters.
According to the 65th round report of the NSS
(Directorate of Economics and Statistics, 2010)
individual latrine facility is reported from only 7.84
per cent of slums.
There are 377
slums with
populations of
308,614 recorded
in Bhubaneswar in
2008 and it is
reported that none
of the slums have
piped water supply
in the dwelling
units and that
public stand posts,
handpumps/
tubewells, open
wells, etc., are the
sources of drinking
water. Of the total
slum households,
80 per cent have
no toilet facility
(HUP-PFI, 2011). As per NFHS 3, urban
households in Uttarakhand that have piped water
supply in houses is 75.6 per cent and 72.8 percent
of the urban household have flush/pour-flush
latrines connected to piped sewer system, septic
tank, or pit latrine (HUP-Plan, 2011). Similarly, in
Jharkhand, tap water is the main source of drinking
water for 34.7 percent households and out of total
reported urban households 6.9 percent are getting
tap water from untreated sources and 16.7 percent
are using water from uncovered wells for drinking
and out of total households 31 percent have no
access to any type of latrine facility and defecating
in open (Census 2011). Most of the cities are facing
such situation but there is no concerted planning to
deal with it.
36

6.3 Page 53

▲back to top


3.5 Challenges
Urban population growth is much faster compared
to both overall population growth and rural
population growth; on the other hand, rural
population growth is declining compared to urban
population growth and the challenges of
urbanisation are increasing. There are a number of
factors–natural growth, geographical expansion of
urban centres, migration from rural to urban areas
due to natural calamities, displacement and non-
availability of gainful employment-responsible for
faster urban population growth.
In the absence of a widely acceptable definition of
slums/slum dwellers/urban poor, availability of the
authentic data is not possible.34 Various agencies
are involved in estimating slums and slum
population on the basis of their own definitions and
assessment methods. Generally, every state has
its own definition and procedure for the
declaration/notification of slums and mostly it is the
notified/listed slums that are included for the
situation assessment and provision of basic
services thereby leaving out about half the
slums35/human settlements from consideration.
The Ministry of Housing and Urban Poverty
Alleviation, Government of India, with the support
of the United Nations Development Programme
(UNDP) have launched a report on the nature and
dynamics of urban poverty in the country (UNDP
India-Urban Poverty Report 2009) The report
estimates that urban poverty in India remains high,
at over 25 percent which is about 80 million poor
people who live in the cities and towns of India.
Further, the report indicates towards an increasing
urbanisation of poverty looking at future
projections.
Disposal of untreated sewage into the water
streams is adversely affecting the health of the
slum dwellers as about 24 per cent of the slums are
located around the nallahs and 48 per cent of the
slums are usually affected by water logging during
monsoon.36 Safe drinking water, sanitation, and a
clean environment are essential needs and basic
human rights, and India's policy framework very
well recognises this. The provision of adequate
drinking water for the entire urban and rural
populations is one of the priorities of the National
Water Policy (NWP). Provision of clean drinking
water, sanitation and a clean environment are vital
to improve the health of our people and to reduce
incidence of diseases and deaths (Planning
Commission, 2008). But disparity in the provision of
services and an approach based on exclusion
rather than inclusion, results in the urban poor
being generally deprived from essential facilities
and services of water, sanitation and clean
environment.
3.6 Summing Up
The 2011 provisional Census of India reports the
annual exponential growth rate of the urban
population is tuned to 2.76 per cent, which is almost
the same (2.73 per cent) reported in 2001. India's
urban population stands at about 377 million with
31.16 per cent people living in urban locations. The
decadal urban population growth rate during 2001-
11 is 31.8 per cent, which is 1.8 times the overall
and 2.6 times the rural population growth.
Therefore, the absolute increase in the urban
population is more than the rural population. The
latest figures corroborate the fact that due to
various socio-economic factors, like population
pressure and poverty, the urban regions have seen
large influx of population from rural areas thus
creating new urban centres.
With the rise in urban areas, urban poverty is also
on the rise. The Committee on Slum Statistics and
Census estimated 75.26 million slum populations
in 2001 and projected slum populations to increase
to 93.05 million by 2011, which is about 25 per cent
of the provisional population of 2011. What is more
problematic is that the slum locations where poor
people live are hardly served by the water supply
systems. Examples from select cities show a
skewed number of poor being served in the cities.
Another challenge is urban sanitation. With the lack
of individual coverage for sanitation, and also poor
infrastructure to deal with a city's sewage,
wastewater is becoming an alarming problem in
almost all cities across India. The government has
announced a National Urban Sanitation Policy
(NUSP) intended towards making slum-free cities
and provisions for safe drinking water, sanitation
and solid waste management for entire urban
34The 2001 Census is the first census to provide independent estimates of the population in slum and non-slum areas. Slums were
enumerated in 640 cities/towns that had more than 50,000 residents and that reported the existence of slums. For the 2001 Census, the
criteria used to designate the area as slum or non-slum (Office of the Registrar General and Census Commissioner, 2005): are - (i) all
specified areas in a town or city notified as 'Slum' by State/Local Government and UT Administration under any Act including a "Slum
Act"; (ii) all areas recognized as 'Slum' by State/Local Government and UT Administration, Housing and Slum Boards, which may have
not been formally notified as slum under any act; and, (iii) a compact area of at least 300 population or about 60-70 households of poorly
built congested tenements, in unhygienic environment usually with inadequate infrastructure and lacking in proper sanitary and drinking
water facilities". (Kamla Gupta, Fred Arnold, and H. Lhungdim. 2009:10)
35The NSS 65th round estimated that that 51 per cent of the slums are notified and 49 per cent are non-notified. The report is available at
http://mospi.nic.in/mospi_nsso_rept_pubn.htm (accessed 04 October 2011).
36Some Characteristics of Urban Slums, NSS 65th round report, 2010.
37

6.4 Page 54

▲back to top


populations.
These are among the targets of the 11th Five Year
Plan (2007-12) and reduction of the burden of
water born diseases by 50 per cent by the year
2015 is one of the goals of the National Health
Policy 2002. The need is to recognise the fact and
reduce the disparities in the provision of water and
sanitation facilities and services. Considering the
fact that water and sanitation are among the
essential needs and basic human rights of all
people, they should be provided to all, irrespective
of the tenure status. Availability of reliable
information on slum settlements and populations is
essential for planning and providing water and
sanitation, and therefore comprehensive counting
and mapping is required. Sustainable and effective
water and sanitation is only possible though
community participation and there is a need to
develop strategies based on learning and past
experience.
REFERENCES
Census of India. 2011. Size, Growth Rate and
Distribution of Population. Available at:
http://www.censusindia.gov.in /2011-provresults/
data_files/india/Final%20PPT% 202011_chapter3.pdf
[Accessed on 7 April 2011].
Census of India 2011, House listing and Housing Census
data highlights, Houses Household Amenities and
Assets, Available at:
http://www.censusindia.gov.in/2011census/hlo/hlo_high
lights.html
Central Pollution Control Board (CPCB). 2009. Status of
Water Supply, Waste Water Generation and Treatment in
Class I and Class II Cities of India. Ministry of
Environment and Forest (MoEF), Government of India.
Available at:
http://www.cpcb.nic.in/upload/NewItems/NewItem_153
_Foreword.pdf [Accessed 16 October 2011].
Delhi Urban Shelter Improvement Board. 2011. 'List of JJ
Clusters 2011', Available at:
delhishelter.nic.in/jjc685_ march2011.pdf [Accessed 10
October 2011].
Directorate of Economics and Statistics, Delhi. 2010.
'Urban Slums in Delhi'. Available at:
http://delhi.gov.in/wps/wcm/connect/dfb6e00045a1125c
80d4cfb4db7ec898/UrbanSlum_65thRound.pdf?MOD=
AJPERES&lmod=-523581320&CACHEID=dfb6e000
45a1125c80d4cfb4db7ec898.
HUP-IIHMR. 2011. 'Rajasthan WATSAN Profile. Health
for the Urban Poor', Internal unpublished document,
Indian Institute of Health Management Research.
HUP-PFI. 2011. 'Odisha WATSAN Profile. Health for the
Urban Poor', Internal unpublished document, Population
Foundation of India.
HUP-Plan. 2011. 'Jharkhand WATSAN Profile, Health for
the Urban Poor', Internal unpublished document, Plan
International.
HUP-Plan. 2011. 'Uttarakhand WATSAN Profile, Health
for the Urban Poor', Internal unpublished document, Plan
International.
Jawaharlal Nehru National Urban Renewal Mission
(JNNURM). 'City Development Plan Delhi, 2006',
Ministry of Urban Development MoUD), Government of
India. Available at:
http://jnnurm.nic.in/citywise-cdp.html [Accessed 10
October 2011].
Jawaharlal Nehru National Urban Renewal Mission
(JNNURM). 2011. 'Jaipur City Development Plan, 2006',
Ministry of Urban Development (moUD), Government of
India. Available at:
http://www.jnnurm.in [accessed 7 October 2011].
Kamla Gupta, Fred Arnold, and H. Lhungdim. 2009.
Health and Living Conditions in Eight Indian Cities.
National Family Health Survey (NFHS-3), India, 2005-
06. Mumbai: International Institute for Population
Sciences; Calverton, Maryland, USA: ICF Macro.
Mahila Housing SEWA Trust. 2009. 'Urban Slums in
Gujarat and Rajasthan, Study of Basic Infrastructure in
Seven Cities – 2009'. Available at:
http://www.sewahousing.org/download.php?f=urban%2
0slums.pdf&p=studies. [Accessed on 11 November
2011].
Ministry of Health and Family Welfare (MoHFW). 2009.
'Health and Living Condition in 8 Indian Cities'. Available
a
t
:
www.nfhsindia.org/urban_health_report_for_website_1
8sep09.pdf [Accessed on 4 October 2011].
Ministry of Housing and Poverty Alleviation. 2010.
'Report of the Committee on Slum Statistics/Census,
National Building Organization'. Available at:
http://mhupa.gov.in/W_new/Slum_Report_NBO.pdf
[Accessed 4 October 2011].
Planning Commission. 2008. Eleventh Five Year Plan
(2007-2012). Chapter 6. New Delhi: Oxford University
Press.
UNDP. 2009. India – Urban Poverty Report 2009-
Factsheet. Available at:
http://data.undp.org.in/poverty_reduction/Factsheet_IU
PR_09a.pdf. [Accessed on April 24, 2012].
UN- HABITAT. 2006. 'Water Demand and Management
Strategy and Implementation Plan', UNH Report for
Bhopal, Gwalior and Jabalpur, Water for Asian Cities
Programme, UN-Habitat, New Delhi.
WaterAid. 2006. UN-HABITAT Report on Poverty
Mapping: A Situation Analysis of Poverty Pockets in
Bhopal, Gwalior, Indore and Jabalpur, UN-HABITAT,
New Delhi.
38

6.5 Page 55

▲back to top


Water pollution is adding to India's water woes with
almost 70 per cent of surface water and an
increasing percentage of groundwater being
contaminated by biological as well as chemical,
organic, inorganic and toxic pollutants.37 The
sources of such pollution include point sources
such as industrial effluents and domestic waste,
and non-point sources such as agriculture. The
health implications of poor water quality are
enormous, and water and sanitation related
diseases are responsible for 60 per cent of the
environmental health burden in India (Planning
Commission, 2008). As discussed later, water
pollution is also a serious economic burden. Sector
wise, agriculture still ranks the highest in terms of
overall impact on water quality. CPCB's (2009a)
latest findings reveal 43 out of 88 industrial clusters
in India to be 'critically polluted' and reflect the
increasing level of industrial pollution. The water
resources, especially groundwater reserves, are
also polluted due to natural and anthropogenic
contamination in many regions.
4.1 Microbial Contamination
The presence of pathogenic microorganisms in
drinking water is an extremely important parameter
of water quality given the crucial role water plays in
healthy lives. The world over, unsafe drinking
water, along with poor sanitation and hygiene, are
the main contributors to an estimated four billion
cases of diarrhoeal disease, causing more than 1.5
million deaths, primarily among children under five
years of age (WHO 2011). Although the water
access figures in India show an increasing trend,
access to safe drinking water remains a challenge
in rural areas. About 638 million people in India still
defecate in the open and 67 per cent of Indian
households do not treat their drinking water.38
Likewise, in urban areas water supply pipelines
and open drainage channels running side by side
put the safety of drinking water at stake.39 Surveys
have estimated that over one third of rural ground
water sources in India may be microbiologically
contaminated, much of this contamination is
preventable and proper operation and
maintenance of water sources coupled with safe
sanitation practices (Ministry of Rural
development, DDWS, GOI, 2011)
The CPCB's analysis of water quality monitoring
results from 1995 to 2009 indicates microbial
contamination as the predominant form of pollution
in surface water bodies in India (CPCB, 2009d). It
was observed that nearly 64 per cent of the surface
observations had biochemical oxygen demand
(BOD) less than 3 mg/l, 19 per cent between 3-6
mg/l and 17 per cent above 6 mg/l. This has been
attributed to two main reasons. First, the municipal
authorities are unable to treat the increasing load of
the municipal sewage due to which it may end up
contaminating water bodies. Second, the receiving
water bodies may themselves not have adequate
water available for dilution. This severely limits
water availability for both human as well as
ecosystem consumption. Table 4.1 gives the BOD
values of the top five most polluted water bodies in
India. It must be remembered that according to the
water quality criteria, the level of BOD in water
should not exceed 3mg/l. Many stretches of major
rivers passing through industrial towns and cities
are critically polluted. In the holy city of Haridwar,
the river Ganges has been showing the worrying
trend of increasing BOD values from about 2 mg/l in
2002 to almost 5.5 mg/l in 2008 (ibid.). The major
pathogenic organisms responsible for waterborne
37MoWR (2000) cited in MoEF (2009)
38See http://www.unicef.org/india/wes.html
39See, for example, Bhunia et al. (2009)
39

6.6 Page 56

▲back to top


Table 4.1: Top Five Polluted Water Bodies and the BOD Values
Lake/Tanks/Ponds
Location
Kistrareddypet Tank, Kajipalli Tank, Pedda
Cheruvu, Asani Kunta, Sai Cheruvu and Noor
Mohammad Kunta
Andhra Pradesh
BOD Value (mg/L)
50.0
Durgam Cheruvu
Elangbeel System Pond
City Lake
Gandigudam Tank
Kankoria Lake
Andhra Pradesh
45.0
Assam
42.0
Gujarat
42.0
Andhra Pradesh
38.0
Gujarat
38.0
Source: Data from CPCB (2009c)
diseases in India are bacteria (E. coli, Shigella, V
cholera), viruses (Hepatitis A, Polio Virus, Rota
Virus) and parasites (E. histolytica, Giardia,)
(Khurana and Sen, 2007). Poor waste disposal
facilities also contribute to pollution of water bodies
by means of leaching.
4.2 Water Pollution and Health
Water and health are intricately related. Unsafe
water and poor sanitation contributed 7.5 per cent
of total deaths and 9.4 per cent of total disability-
adjusted life years or DALYs40 in India in 2002
(Prüss et al. 2008). One third of all deaths of all
children under five years of age in India are due to
diarrhoea and pneumonia.41 Many more children
who survive have weakened immune system
because of diarrhoea, pneumonia, malaria, and
worm infestations, and become underweight and
malnourished which has a severe impact on their
learning ability throughout their lives. Water and
sanitation are key barriers to prevent this, including
safe excreta exposure and safe and adequate
water supply coupled with good hygienic practices.
While access to improved drinking water sources in
India has increased over the past decade, the
tremendous adverse impact of unsafe water on
health continues.42 The health impact of chemical
contaminants in water has already been discussed
under section 3.1. Microbial pollution in water is
also responsible for disease burden, especially due
to poor sanitation and hygiene practices. Infectious
diseases linked to water can be categorised as
waterborne, water-related, water-based and water-
washed diseases.43 These pathogenic organisms
are transmitted mostly due to contaminated water,
improper sanitation and poor hygiene practices
exacerbated by large volumes of untreated sewage
generated daily in major cities. In the rural areas,
due to the widespread practice of open defecation
(69 per cent of the rural population, as
discussed in Chapter 2) and poor operation and
maintenance of water sources, microbial
contamination occurs in surface and groundwater
bodies. Also, approximately 74 per cent of the rural
population does not use any water disinfection
method.44 McKenzie and Ray (2004) show that
India looses 90 million days a year due to
waterborne diseases. Poor health due to
inadequate sanitation is also an economic burden.
A recent study conducted by the Water and
Sanitation Programme (WSP) estimates that
inadequate sanitation causes India 'considerable
economic losses' each year equivalent to 6.4 per
cent of India's GDP in 2006, that is, US$53.8 billion
(WSP, 2010) (see figure 4.2). Figure 4.7 compares
this with some economic indicators of the country. It
is noteworthy that the total economic loss due to
inadequate sanitation in 2006 was equivalent to
state income of Tamil Nadu. Out of the total
US$53.8 billion about US$ 38.5 billion (Rs. 1.75
trillion) is lost due to health-related impacts. Figure
4.1 gives the health-related economic impact of
40Combination of years of healthy living lost due to morbidity and mortality.
41India: Country Profile of Maternal, Newborn & Child Survival, April 2010, UNICEF. Available at http://www.childinfo.org/files/maternal/DI
Profile%20-%20India.pdf accessed on 17 February 2012
42WHO/UNICEF cited in Srikanth (2009: 1).
43Ashbolt (2005) cited in Chourey and Prakash (2010).
44NFHS (2005-6) cited in Gopal et al. (2008: 234)
40

6.7 Page 57

▲back to top


inadequate sanitation with respect to diseases. It
also shows that children and poor households bear
the brunt of poor sanitation. More than three-
fourths of the premature mortality-related
economic losses are due to deaths and diseases in
children younger than five. Diarrhoea among these
children accounts for over 47 per cent (US$18
billion) of the total health-related economic
impacts.
Figure 4.1: Distribution of the Health Impact of
Inadequate Sanitation by Disease in India (2006)
Source: WSP (2010)
Figure 4.2: Economic Impact of Inadequate
Sanitation in India: Comparison with some
Economic Indicators
India’s GDP at current Prices
State income of A.P in 2006-07
Total Economic Impacts of
Inadequte Sanitation India
State income of Tamil Nadu
State income of Gujarat in 2006-07
54.5
53.8
53.7
48.3
Source: WSP (2010)
Another area of concern is ensuring safe water
supply during disasters, like floods. As mentioned
in section 1.2, floods occur at regular intervals in
the country. The risk of diarrhoeal disease outbreak
remains high after natural disasters, as seen in the
case of the floods of July-August 2007 leading to an
outbreak of cholera in four districts of Orissa and
killing more than 100 people (SAARC Disaster
Management Center, 2008: 121). In the eastern
regions of India affected by arsenic contamination,
flooding also enhances the rate of exposure among
social and other disadvantaged groups (Khan, et
al. 2003).
4.3 Natural Sources of Water
Contamination
4.3.1 Salinity
Coastal aquifers form a vital source of freshwater
along the 7,000 km long Indian coastline. These
aquifers are vulnerable to intrusion of saltwater
from the sea. The Bureau of Indian Standards (BIS)
standard for total dissolved solids in drinking water
is 500mg/l which can be extended to 2,000mg/l in
case there is no alternate water source. The salt
water intrusion in coastal areas is exacerbated by
concentrated withdrawal of groundwater and
reversal of natural hydraulic gradients. In the
Saurashtra region of Gujarat, a total of 700,120 ha
area, over 1 million people and 32,750 wells were
affected by salinity ingress leading to adverse
social and economic consequences (NWRWS,
2010). Increased salinity has also adversely
impacted agriculture leading to migration (ibid.).
Figure 4.3 graphically represents the top five
salinity affected states in the country, as on 1 April
2011, in terms of percentage of habitations
affected.
The government and non-government agencies
have come together to
introduce programmes
to combat the
833.6 challenges. For e.g. in
Gujarat, Water and
Sanitation Management
Organization (WASMO)
and Coastal Salinity
Prevention Cell (CSPC)
have come together to
launch a special
initiative –Coastal Areas
Drinking Water and
Sanitation Programme
in different coastal
districts.
Figure 4.3: Top Five Salinity Affected States
Rajasthan Kerala Karnataka Orissa
West
Bengal
Percentage of affected habitations to total habitations
Source: Data from DDWS (2011)
41

6.8 Page 58

▲back to top


4.3.2 Iron
The acceptable limit for iron in drinking water is 0.3
mg/l and the permissible limit in the absence of any
alternative source is 1 mg/l. The World Health
Organisation (WHO) does not have any proposed
limit for iron in water since it is not considered a
health concern at levels found in drinking water.
High concentration of iron (>1.0 mg/l) in
groundwater has been observed in more than 0.11
million habitations in the country (CGWB, 2010).
Figure 4.4 graphically represents the top five iron
affected states in the country in terms of
percentage of habitations affected as on 1 April
2011.
Figure 4.4: Top Five Iron Affected States
18.85
Figure 4.5 graphically represents the top five nitrate
affected states in terms of percentage of
habitations affected as on 1 April 2011.
4.3.4 Fluoride
Fluoride contamination affects 150 districts in 15
states. The permissible limit of fluoride in water
according to Indian standards is 1.0 mg/l, which
can be extended to 1.50 mg/l in case no alternative
source of water is available. Studies suggest that
over the years fluorosis has emerged as a major
health problem in rural India.45 Exposure to high
levels of fluoride, which occurs naturally, can lead
to mottling of teeth and, in severe cases, crippling
skeletal fluorosis. Figure 4.6 graphically represents
the top five fluoride affected states in terms of
percentage of habitations affected as on 1 April
2011.
12.98
12.98
10.41
5.24
Figure 4.6: Top Five Fluoride Affected States
Source: Data from DDWS (2011)
8.51
5.23
Assam Bihar Chhattisgarh Kerala Orissa
Percentage of affected habitations to total habitations
Source: Data from DDWS (2011)
4.3.3 Nitrate
Nitrate is a very common constituent in
groundwater, especially in shallow aquifers. The
source is mainly from anthropogenic activities like
dumping of solid waste on land and run-off from the
agricultural fields. The desirable limit of nitrate in
water according to Indian standards is 45 mg/l, with
no relaxation beyond this limit. High concentration
of nitrate in water beyond the permissible limit
many lead to health problems like
methaemoglobinaemia.
Figure 4.5: Top Five Nitrate Affected States
18.85
Percentage of affected
habitations to total
habitations
0.91
0.77
0.42 0.38
Karnataka Rajasthan Maharashtra Gujarat
Kerala
3.1
2.08
0.98
Rajasthan Karnataka Bihar Madhya West
Pradesh Bengal
Percentage of flouride affected
habitations to total habitations
4.3.5 Arsenic
The desirable limit of arsenic in water according to
Indian standards is 0.01 mg/l, while the permissible
limit in the absence of an alternative source is 0.05
mg/l. Skin conditions such as increased
pigmentation and decrease in normal
pigmentation, peripheral neuropathy, skin cancer,
bladder and lung cancers, and peripheral vascular
disease are observed in populations ingesting
arsenic-contaminated drinking water (WHO 2011).
Since the first case of groundwater arsenic
contamination was reported in the year 1983, from
33 affected villages in four districts in West Bengal,
the number of affected villages has increased to
3,417 in 111 blocks in nine districts in West Bengal
alone (Ghosh and Singh, 2009).46 In a joint study
conducted by the Indian Institute of Technology
(IIT), Guwahati, and Public Health Engineering
Source: Data from DDWS (2011)
45To illustrate, Jaganmohan et al. (2010) report high concentration of fluoride in drinking water of Udaygiri mandal in Nellore district in
Andhra Pradesh, ranging from 2.7 ppm to 6.74 ppm. Patel and Bhatt (2008) also observed similar trends in Banaskantha district of
Gujarat.
42

6.9 Page 59

▲back to top


Department (PHED), Assam, 8 per cent of the
samples were found to be above the BIS
permissible level and 30 per cent were above the
WHO permissible limit thus exposing about 0.7
million people to contamination (Borah, 2011).
Figure 4.7 graphically represents the top five
arsenic affected states in terms of percentage of
habitations affected as on 1 April 2011.
Government agencies have undertaken a number
of initiatives to combat the issue of arsenic
contamination. For example, since 2005, the
Government of West Bengal has spent nearly Rs
2,100 crore (Rs 21 billion) on such schemes.
Additionally, a number of research studies have
been conducted to investigate the various facets of
arsenic contamination, like extent, geochemistry,
etc.47
Figure 4.7: Top five Arsenic Affected States
Source: Data from DDWS, April 2011
Figure 4.8: Top Five Water Quality Affected States
in India
Figure 4.8 shows those five states in the country,
based on the percentage of habitations affected,
that are most affected by water quality. Other
pollutants include mercury, uranium, etc., which
Source: Data from DDWS, April 2011
are leached into the water bodies due to excessive
mining in many regions of the country. A detailed
discussion on them is beyond the scope of this
report.
4.4 Anthropogenic Sources of Water
Pollution
4.4.1 Solid Waste Disposal
Annual municipal solid waste generation in India is
estimated to be 1,15,000 million tonnes with the
collection efficiency ranging from 70 to 90 per cent
(in metros) to about 50 per cent (in smaller cities)
(Planning Commission, 2008). There exists a
considerable gap between the waste generated
and waste collected in many cities in India. In the
absence of an effective disposal mechanism, run-
off from open dump sites containing chemicals
contaminates wells and surface water sources of
drinking water. Open dumping also affects proper
drainage of run-off, thus making areas more
susceptible to flooding by blocking the sewerage
systems. The leachate released also contaminates
the groundwater and surface water sources. The
leachate from poorly-managed landfills can also
pollute the water bodies and groundwater with toxic
substances. Another area of concern is the
unchecked disposal of biomedical and other
hazardous wastes into the streams. According to
CPCB (2009d) there are 36,165 hazardous waste
generating industries in the country, generating
62,32,507 MT of hazardous waste every year.
4.4.2 Waste Water
The domestic sector is responsible for most of the
waste water generation in India. Statistics reveal
that the municipal treatment facilities are not
equipped to treat the increasing amount of
domestic sewage. Improper disposal of solid waste
also leads to water contamination in the nearby
water bodies. Out of about 38,000 million l of
sewage generated per day, the treatment
capacity48 exists for only about 12,000 million l per
day (CPCB, 2009c). About 39 per cent of sewage
treatment plants do not conform to the general
standards prescribed under the Environment
(Protection) Rules. Thirty-five of India's
metropolitan cities generate about 15,664 MLD of
sewage while the treatment capacity exists for only
51 per cent, that is, about 8,040 MLD (ibid.). In 498
Class I cities, sewage generation is estimated to be
35,558.12 MLD while the total sewage treatment
capacity is 11,553.68 MLD which is only 32 per cent
of the total sewage generation. The 410 Class II
cities generate close to 2,696.70 MLD of sewage
46The figures are till the year 2008.
47See, for example, Ghosh and Singh (2009).
48It is important to note here that capacity does not mean actual treatment.
43

6.10 Page 60

▲back to top


while the total sewage treatment capacity is only
233.47 MLD (Table 4.2).
4.4.3 Agriculture
According to MoEF (2009), the agricultural sector
has a predominant impact on water quality. Due to
heavy subsidies on chemical pesticides and
fertilisers, there are no incentives for farmers to
limit their overuse, and, as a result, per hectare
consumption of fertilisers has increased from 69.8
kg in 1991-92 to 113.3 kg in 2006-7 (ibid.). About 13
per cent of drinking water in rural areas contains
chemical contaminants including fertilizers run-off,
mainly urea and its decomposition products
(Planning Commission, 2011). In a 2009 study on
the effects of synthetic nitrogen fertiliser on
groundwater pollution in intensive agriculture,
Greenpeace found that 20 per cent of all sampled
wells had nitrate levels above the safety limit (50
mg/l) for drinking water established by the WHO.
Further, the study notes that this nitrate pollution is
directly linked with usage of synthetic nitrogen
fertilisers (Greenpeace, 2009). Other sources
would include human and animal waste and natural
mineral sources.
Some of the well-known health effects of pesticide
exposure include acute poisoning, cancer,
neurological effects, reproductive anomalies,
intrauterine growth retardation, and teratogenic
effects. Fertilisers and pesticides enter the water
supply through run-offs and leaching into the
groundwater table and pose hazards to human,
animal and plant populations. Some of these
substances have been known to bio-accumulate in
certain organisms, leading to an increased risk of
contamination when used for human consumption
and persistence of the chemicals in the
environment over long periods of time. The
suitability of water for human consumption and
other uses is further limited by the decaying organic
matter which releases odorous gases; the partially
decomposed matter accumulates on the riverbed
or lakebed, threatening aquatic life as well. The
recent opposition against endosulfan that led to the
GoI implementing a phased out ban on the harmful
pesticide brought to fore the continued use of
harmful chemicals which are banned by developed
countries or are strictly regulated.
4.4.4 Industrial
Although the industrial sector accounts for only 2
per cent of the annual water withdrawals in India, its
contribution to water pollution, particularly in urban
areas, is considerable. According to a recent
Central Pollution Control Board (CPCB) study, 43
out of 88 industrial clusters in India are 'critically
polluted' while three are 'severely polluted' with
respect to one or more environmental components
(CPCB, 2009b).49 These statistics portray a grim
picture of the status of industrial pollution in India.
Waste water generation from this sector has been
estimated at 55,000 million cu m per day, of which
68.5 million cu m are dumped directly into the local
rivers and streams without prior treatment.50 The
industrial waste water is often contaminated with
highly toxic pollutants which persist in the
environment for long. There have been several
cases in India where industrial effluents being
discharged into the river or stream directly has
adversely affected the lives and livelihoods of the
people living in the vicinity. In one such case, at
Tirupur in Coimbatore, Tamil Nadu, the level of
pollution caused by the effluents discharged by the
textile industry in the Noyyal river were so high that
the state high court had to intervene on behalf of the
farmers. The court ordered the industrial cluster to
switch to zero discharge facilities or close down
(Madhav, 2008). Studies by various civil society
groups have also brought to the fore the plight of
Table 4.2: Summary of Water Supply, Sewage Generation and its Treatment
Category
No. of cities
Population
Total water
supply (in MLD)
Waste water
Generation
(in MLD)
Class-I city
498
14,30,83,804
44,769
35,558.12
Class-II town
410
3,00,18,368
3,324.83
2,696.7
Total
908
25,77,54,640
48,093.88
38,254
Source: CPCB (2009c)
Treatment
Capacity
(in MLD)
11,553.68
233.7
11,787.38
49A moratorium against expansion was imposed on these industrial areas after these findings. However, CSE (2011) reports that since
October 2010, as many as 23 industries have been removed from the moratorium list based on action plans submitted by the respective
states even as they continue to pollute.
50MoWR (2000) cited in MoEF (2009).
44

7 Pages 61-70

▲back to top


7.1 Page 61

▲back to top


people living in the industrial regions suffering from
chronic illnesses due to prolonged exposure to
toxic chemicals. A recent article by Times of India
reports that fluoride discharges from nearby
tanneries have lead to bone deformities in people
of the some regions of Unnao district in Uttar
Pradesh. On an average, at least one member of
each family of the affected village has a bone
deformity (Kurup 2011). There exist many laws as
well as emission standards to minimise the impact
of industrial discharge but it is non-compliance and
poor monitoring that has aggravated the situation.
The industrial water pollution standards in the
country are concentration based, which means that
they measure the concentration of pollution in a
given quantity of water. The result is that an
industry can meet the required standard merely by
diluting the effluent with clean water. While
advocating the 'polluter pays' principle for dealing
with water pollution; the National Water Policy
(NWP) 2002 does not specifically talk about the
extent of the payment. Similarly, there appears to
be no incentive or disincentive for the industries to
undertake reduction of wastewater discharge
Box 4.1: Pollution Hotspots in India
under the current arrangement of water tariff. Most
of the water used in the industrial process is for
cooling or for use in boilers. Even though it is not
contaminated in any form, if released in the
streams, it can alter the temperature and pH levels
thus affecting the aquatic system. Little data exists
in the public domain to conclusively establish the
impact of industrial pollution on various
components of the ecosystem. Reforms of
industrial tariffs to reflect the true price of water
supply and water treatment would help in
regulating industrial water use at the earliest. Box
4.1 gives a compiled account of the pollution
hotspots in the country.
4.5 Summing Up
Water quality issues are immensely important
concerns from human health and ecological status.
The above analysis clearly establishes that water
quality issues in India have reached or even
passed the critical stage. It also reveals that while
increasing access to water is crucial, doing so
without addressing quality issues may prove to be a
Hot-Spot States
Partial Coverage
Widespread
Inland Salinity
Inherent Salinity
Water Logging under surface irrigated
Area
Coastal Salinity
Saline ingress fron tides cyclone and
Tsunami
Sea Water Instrusion
Geogenic
Arsenic
Flouride
Iron
Anthropogenic
Mining
Industrial
Tanneries
Distelliers
Land fill and Garbage dumbs
Agriculture
Poor sanitation and wastewater disposal
Source: Romani (2010) cited in Garduno et al. (2011: 10)
45

7.2 Page 62

▲back to top


futile exercise. Development will elude a society
where people are not healthy, as excessive man
hours are lost due to ill health. Water pollution
caused from household, industrial and agricultural
sectors affects the quality of surface, ground and
coastal waters. Despite investing considerably in
sanitation and river cleaning projects (a Rs 7,000
crore or Rs 70 billion Ganga Cleaning Project has
been approved recently), water quality continues to
deteriorate (CPCB, 2008). As discussed above,
waterborne diseases due to inadequate sanitation
are serious economic impediments for society.
Indeed, Goldman Sachs placed improving
environmental sustainability of water and energy
as one of the top 10 interventions that India needs
to accelerate growth, in order to reach its economic
potential (Goldman Sachs 2008). As is evident from
the gap between sewage generation and sewage
treatment capacities of major cities, there is an
immediate need to build appropriate infrastructure.
There is legislation in India that addresses the
prevention and control of pollution—for example,
the Water Prevention and Control of Pollution) Act
of 1974, Water Cess Act of 1977 (amended in 1988
as the Water (Prevention and Control of Pollution
Cess Act), and the umbrella legislation, the
Environment (Protection) Act or EPA (1986).
Recently, the Right to Information (RTI) has also
been used by activists and people as a potent
legislation to deal with discrepancies in the water
sector. Although the Indian government is working
more proactively on the increasing threat of water
pollution, it will take far more than political will for
these actions to translate into concrete measures
resulting in improved water quality.
References
Bhunia, R., R. Ramakrishnan, Y. Hutin, M.D. and Gupte.
2009. 'Cholera Outbreak Secondary to Contaminated
Pipe Water in an Urban Area, West Bengal, India, 2006',
Indian Journal of Gastroenterology, vol. 28, no. 2, pp. 62-
64. Available at:
http://indianjgastro.com/IJG_pdf/march2009/09_March
_SR2.pdf [accessed on 21 December 2011].
Borah, H.K. 2011. 'Drinking Water Scenario in Assam',
India Water Development Report Multistakeholder
Consultation Workshop, Indian Institute of Technology
(IIT), Guwahati, Assam.
Central Ground Water Board (CGWB). 2010. Ground
Water Quality in Shallow Aquifers in India. Faridabad:
CGWB.
Central Pollution Control Board (CPCB). 2008. 'Status of
Water Quality in India- 2007: Executive Summary',
Central Pollution Control Board, Ministry of Environment
& Forests (MoEF), New Delhi.
Central Pollution Control Board (CPCB). 2009a.
Comprehensive Environmental Assessment of Industrial
Clusters. New Delhi: The Energy and Resources
Institute Press.
Central Pollution Control Board. 2009b. Annual Report:
2008-2009. Delhi: CPCB
Central Pollution Control Board. 2009c. Status of Water
Supply, Wastewater Generation and Treatment in Class-
I Cities and Class-II Towns of India'. Available at:
http://www.cpcb.nic.in/upload/NewItems/NewItem
_153_Foreword.pdf [Accessed on 20 January 2011].
Central Pollution Control Board. 2009d. Status of Water
quality in India-2009. New Delhi; MoEF Central Water
Commission.
Centre for Science and Environment (CSE). 2011.
'Gentle on Critical Pollution'. Available at:
http://www.downtoearth.org.in/content/gentle-critical-
pollution. [Accessed on 10 November].
Chourey, J. and A. Prakash. 2010. 'Good Evidences, Bad
Linkages: A Review of Water and Health in South Asia',
Asian Journal of Water, Environment and Pollution, vol.
7, no. 1, pp. 5-17.
Department of Drinking Water Supply (DDWS). 2011.
Compiled from the online data of National Rural Drinking
Water Programme. See
http://indiawater.gov.in/imisreports/nrdwpmain.aspx
Garduno, H., S. Romani, B. Sengupta, A. Tuinhof, and R.
Davis. 2011. 'India Groundwater Governance: Case
Study', World Bank. Available at:
http://water.worldbank.org/water/sites/worldbank.org.w
ater/files/GWGovernanceIndia.pdf. [Accessed on: 8
November 2011].
Ghosh, N.C. and R.D. Singh. 2009. Ground Water
Arsenic Contamination in India: Vulnerability and Scope
of Remedy', 5th Asian Regional Conference of ICID, 9-11
December 2009, New Delhi Available at:
http://cgwb.gov.in/documents/papers/incidpapers/Pape
r%208%20-%20Ghosh.pdf (accessed on 20 December
2011).
Goldman Sachs. 2008. 'Ten Things for India to Achieve
its 2050 Potential', Global Economics Paper No. 169.
Available at: http://www2.goldmansachs.com/our-
thinking/ brics/brics-reports-pdfs/ten-things-india.pdf
[accessed on: 28 November 2011].
Gopal, S., R. Sarkar, K. Banda, J. Govindarajan, B.B.
Harijan, M.B. Jeyakumar,P. Mitta, M.E. Sadanala,T.
.Selwyn, C.R. Suresh, P. Thomas, R. Kumar,D.
Sevapandian,G. Kang, and V. Balraj, 2009. 'Study of
Water Supply & Sanitation Practices in India Using
Geographic Information Systems: Some Design & Other
Considerations in a Village Setting', Indian Journal of
Medical Research, vol. 129, pp. 233-41.
Greenpeace. 2009. 'Chemical Fertilisers in Our Water:
An Analysis of Nitrates in the Groundwater in Punjab'.
Available at:
http://www.indiawaterportal.org/sites/indiawaterportal.o
rg/files/Chemical_fertilizers_in_our_water-
An_analysis_of_nitrates_in_the_groundwater_in_Punja
b_Greenpeace_2009.pdf. [Accessed on: 8 November
2011].
Jaganmohan, P. Rao Narayan, S.V.L. and Rao
Sambasiva, K.R.S. 2010. 'Prevalence of High Fluoride
46

7.3 Page 63

▲back to top


Concentration in Drinking Water in Nellore District, A.P.,
India. A Biochemical Study to Develop the Relation to
Renal Failures'., in Global Journal of Medical Sciences,
vol. 5, no. 2, pp. 45-48.
Khan M.M.H., Fumio Sakauchi, T. Sonoda, M. Washio,
and Mitsuru Mori. 2003. 'Magnitude of Arsenic Toxicity in
Tube-well Drinking Water in Bangladesh and its Adverse
Effects on Human Health including Cancer: Evidence
from a Review of the Literature', Asian Pacific Journal of
Cancer Prevention, vol. 4, pp. 7-14.
Khurana, I. and R. Sen, R. 2007. 'Drinking water quality in
rural India: Issues and approaches', Water Aid. Available
at:
http://www.corecentre.co.in/Database/Docs/DocFiles/
drinking_water.pdf. [Accessed on 4 February 2011].
Kurup, S. 2011. 'Are We Poisoning Ourselves?' Times of
India: Sunday Times, 9 January 2011, p. 15. Madhav, R.
2008. Tirupur Water Supply and Sanitation Project: An
Impediment to Sustainable Water Management? IELRC
Working Paper: Geneva, IELRC.
McKenzie, D. and I. Ray. 2004. 'Household Water
Delivery Options in Urban and Rural India', Working
Paper No. 224. Stanford Centre for International
Development, Stanford University. Available at:
http://siteresources.worldbank.org/DEC/Resources/
SCID224.pdf [Accessed on 28 February 2011].
Ministry of Environment and Forests (MoEF). 2009.
State of Environment Report, 2009. New Delhi: MoEF.
Ministry of Rural Development, DDWS, GOI (2011).
Letter Dated 2-2-2011 from Government of India No W-
11042/01/2011/Water.
Ministry of Water Resources, 2010,
http://www.wrmin.nic.in/.
NWRWS (2010). 'Narmada, Water Resources, Water
Supply and Kalpsar Department, 2010. Salinity Ingress
Prevention Scheme'. Available at:
h t t p : / / g u j - n w r w s . g u j a r a t . g o v. i n / s h o w p a g e . a s p x ?
contentid=1470&lang=English (last updated 14 March
2011).
Patel, Payal and S.A. Bhatt. 2008. 'Flouride: A Major
Polluting Component of Groundwater in North Gujarat
Region, India', Paper presented at 12th World Lake
Conference – Taal 2007, 28 October– 2 November 2007,
Jaipur, India. Paper available at:
http://wldb.ilec.org.jp/data/ilec/wlc12/B%20-
%20Water%20Quality/B-12.pdf accessed on 17
February 2012.
Planning Commission. 2008. Eleventh five Year Plan
2007-2012 (Vol II Chapter 5). New Delhi: Oxford
University Press.
Planning Commission. 2011. Faster, Sustainable and
More Inclusive Growth-An Approach to the 12th Five
Year Plan. Available at:
http://planningcommission.nic.in/plans/planrel/12appdrf
t/appraoch_12plan.pdf. [Accessed on 1 November
2011].
Prüss-Üstün, A, R. Bos, F. Gore and J. Bartram. 2008.
Safer water, better health: costs, benefits and
sustainability of interventions to protect and promote
health. Geneva: World Health Organization. SAARC
Disaster Management Center. 2008. South Asia Disaster
Report SDMC, 2007. Ch. 11. Available at:
http://saarc-sdmc.nic.in/pdf/publications /sdr/cover.pdf
[Accessed on 17 February 2012].
Srikanth, R. 2009. 'Challenges of Sustainable Water
Quality Management in Rural India', CURRENT Science,
vol. 27, no. 3, pp. 317-25.
Water and Sanitation Programme (WSP). 2010. 'The
Economic Impact of Inadequate Sanitation in India'.
Available at:
http://www.wsp.org /wsp/sites/wsp.org/files/
publications/wsp-esi-india.pdf [Accessed on: 10 April
2011]
Web Sources : WHO. 2011. Guidelines for Drinking
Water Quality, 4th Edition. Geneva: WHO.
47

7.4 Page 64

▲back to top


7.5 Page 65

▲back to top


Any analysis of water resources management is
incomplete without integrating the gender
dimension. This is a key part of the larger equity
discussion on WASH in India which is a crucial
examination of who is gaining access to what
services (see Mudgerikar and Cronin, 2012 and
UNICEF, 2012). Gender issues form one of the
crucial but underestimated aspects of natural
resources management, water being no exception.
According to the Gender and Water Alliance (GWA,
2006: 1), gender refers to the, 'different roles,
rights, and responsibilities of men and women and
the relations between them. Gender does not
simply refer to women or men, but to the way their
qualities, behaviours, and identities are determined
through the process of socialisation.' The
differential roles and responsibilities of woman vis-
à-vis man shape her relation with the environment
quite differently, which in turn governs her
interaction with the surrounding natural resource
base like water. UNESCO's Gender Mainstreaming
and Implementation Framework hold a similar
view, albeit more pragmatic , puts the same in a
more pragmatic way.
Men and women both perform different roles. This
leads to women and men having different
experience, knowledge, talents and needs. Gender
analysis explores these differences so that
policies, programmes and projects can identify and
meet the different needs of men and women.
Gender analysis also facilitates the strategic use of
distinct knowledge and skills possessed by women
and men (Ruprecht, 2003: 17).
It is precisely these differences that make women
an integral part of any natural resource
management intervention and hence the thrust
worldwide on gendered analysis of the same has
gained recognition. The differences in the social
privileges enjoyed by men vis-à-vis women, and
the implicit assumption that women will benefit from
husbands' improved access to water have done
much harm to women's rights to water. Upadhyay
(2005) argues that it is precisely because of these
assumptions that water projects do not focus on the
differential power dynamics between men and
women or recognise the need for equity in water
allocation. The new water reforms aim to usher in
changes in the water sector and these are also
geared to impact women in this process. Apart from
gender differentiation, access to and control over
water is also determined by belongingness to a
certain class or caste (Ahmed et al, 2008). What is
important for us to understand here is how gender
relations interact with material and social
inequalities and how, together, they influence and
determine access to water. The material and social
inequalities are manifested in variety of ways—in
property relations, inequalities of income, state
provisions, rules of access to common social
property, and social status (Crow and Sultana,
2002). Caste and class are a major determining
factor for one's social positioning in society, which,
when combined with the existing gender relations,
influence and determine access and control over
water. Kabeer (1994) defines four key institutions
that produce and maintain social and gender
inequalities: state, market, community and family.
Each of these have rules (how things get done),
resources (what is used and/or produced), people
(who is in/out, who does what), activities (what is
done), and power (who decides, and whose
interests are served), all of which engender social
relations.
49

7.6 Page 66

▲back to top


5.1 Gender and Water Policy Discourse in
India
One of the major changes in the water sector over
the last few decades has been the enhanced thrust
on institutional reforms, including the increasing
recognition of the bottom-up approach to
management as against the techno-centric top-
down one. At the heart of this lies the concept of
greater inclusiveness of all stakeholders, including
women. Hence the greater need of understanding
their differential needs. A need to integrate gender
concerns in the water policy discourse stemmed
from two facts: one, that women are the primary
collectors of water and also responsible for health,
hygiene and sanitation (of which water is an
integral part) at the household level; two, that
historically the above work has been seen as non-
productive and women have not had adequate
representation in decision making around water .
Consequently, the water sector in India became
abuzz with the concepts of 'gender mainstreaming'.
Inclusiveness of women became a mandate for
projects funded by international and state
agencies. At the level of policy formulation, there is
no shortage of rhetorical support for gender
inclusion by official agencies and governments.
Policy makers have used many approaches to
address gender concerns. For example, the
efficiency approach, based on the premise that if
given a chance women can be as efficient in
delivering targets as men, or, in some cases, even
better; the needs approach, advocating the fact
that women have very specific needs related to
water; or the equity approach, which makes a case
for mainstreaming gender concerns in policies to
address equity issues (Cap-Net, SOPPECOM and
WWN, 2007). New reforms and programme
documents relating to water include sections on
women's role in the successful implementation of
any policy/plan and the likely benefits accrued to
them. While in principle there has been an
agreement to mainstream gender issues in water
projects, critics have argued that the issue
becomes rhetorical if not backed by adequate data
collected in a disaggregated manner. Until now,
there is virtually no gender disaggregated data on
water sectors collected by the main international
and state agencies in a uniform way (Seager,
2010). Without support of adequate and reliable
gender disaggregated data, it is difficult to track
changes in gender relations with respect to water in
the different regions of India and, therefore, the
issue becomes either rhetoric or speculative. For
example, Joy and Paranjpe (2005) reported that
the much talked about relationship between
women and traditional water management systems
did not seem to find backing from the literature
available on these systems. In this section, we deal
with the issue at two levels. First, at the grass-roots
level, on how gender disaggregated data will inform
water policies for irrigation as well as drinking water
and the sanitation sector. Second, we focus on a
rather understudied issue of representation of
women professionals in major departments dealing
with water. This issue borders directly on gender in
organisation and broadens the agenda of gender
mainstreaming at not only the grassroots but also
at the level of implementing agencies.
5.2 Gender Disaggregated Data: What
does it mean for Irrigation and Domestic
Water Sector?
5.2.1 Gender in Irrigation Sector
Over the years, the water sector has shifted its
focus from a supply driven sector to one that is
incentive-based and demand driven (Kulkarni,
2007). This in turn has given birth to the concept of
increased stakeholder participation thus giving
prominence to the role of women in agriculture and
the irrigation sector. Many studies have clearly
indicated the linkages between improved access to
irrigation and poverty reduction.51 Thus, women's
greater participation is now regarded as a means to
achieve the dual objectives of achieving efficiency
in irrigation projects and also improving their
conditions, especially in rural India. With the
institutionalisation of one-third representation in
local bodies, women's representation in the water
communities, at least numerically, has certainly
increased.
Box 5.1: Does Decentralised Water Governance
further Gender Justice in India?
In a 2008 study, Kulkarni et al., looked into the
impact of the new institutional water management
regime on women in the two states of Maharashtra
and Gujarat. The study analysed the factors that
ensure the participation or exclusion of women
from water user and management groups. The
research explores that while the introduction of
quotas in the WUAs have ensured women's
representation in meetings, there exist glaring
caste- and economic-based inequalities within
women's representation. Women's representation
is often tokenistic and the benefits accrued to them
are mostly in the form of self-help group (SHG)
activities. The NGOs and CBOs often play the role
of facilitators but fail to overcome the existing
norms of appropriate social behaviour in society
which limits women's effective participation.
Source: SOPPECOM (2008)
Some cases of Participatory Irrigation
Management (PIM) illustrate the example set by
51See, for example,. ADB and IWMI (2004).
50

7.7 Page 67

▲back to top


women in taking management initiatives. In Angul
district in Orissa, 67 per cent of the membership of
the Water User Associations (WUAs) comprises of
women. This was not due to some specific
legislation or order, but rather due to the lack of
interest shown by the male members towards the
formation of the WUAs. The task was thus initiated
by the women who foresaw its benefits (Joy and
Paranjpe, 2005). But some other cases illustrate
that mere visibility in user communities cannot be
understood as successful participation (see Box
5.1). In its research in the WUAs of Madhya
Pradesh and Andhra Pradesh, ADB and IWMI
(2004: 6-7) established that women (along with
poor farmers) were poorly represented in the
WUAs. They were generally present as proxies to
their husbands or to garner government aid. While
studying the Farmer Management of Irrigation
Systems Act, 1997, with reference to Andhra
Pradesh, Madhav (2007: 10) noted that ‘women
along with other indirect beneficiaries, like landless
populations and children, do not have any decision-
making powers.’ Kulkarni (2007) opines that the
reforms, based on principles of cost recovery in the
irrigation sector in the absence of a rights-based
regime over water, can actually do more harm to
women. For example, with the increasing thrust on
treating water as an economic good, and hence on
the pricing and recovery of costs, the use of
irrigation water by women for other small-scale but
crucial activities in terms of household
consumption, cattle rearing and kitchen gardening
for example, may be seen as not important. Indeed,
the Aga Khan Rural Support Programme, which
was involved in six of the 13 PIM pilot projcts in the
state of Gujarat from the 1990s, found that canal
water was being used for six main activities, viz.
irrigation, livestock rearing, washing, bathing,
washing utensils, and building of mud houses.
While women were using water for all these six
purposes, men used it only for two purposes,that is,
irrigation and bathing. It shows that in the context of
WUAs, women's participation should not be
restricted to irrigation alone (Joy and Paranjpe
2005). Women's role as mere members of WUAs
will not do justice to the knowledge they have about
the other aspects of agriculture, such as knowledge
of seeds, traditional crops and so on.
So how does gender disaggregated data help in
taking informed decision bordering on the issue of
gender and irrigation? First, water for irrigation is
directly related with access and control over land.
Gender disaggregated analysis of access to land
for women and men is the first step in
understanding the ownership pattern of a critical
resource such as land which is tied up with another
key resource, water. Second, women's
participation in institutions dealing with irrigation
water, such as the WUA, is important. Gender
disaggregated data of women's participation in
WUAs, collected and analysed at the district and
state levels, will help in understanding important
facets of gender relations and the impact of
women's improved participation in influencing
desired outcomes of a project. A recent study
conducted by Bina Agarwal (2010) dwells on the
issue of women's participation in forestry
institutions by asking the question: Would women's
inclusion in forest governance, undeniably
important for equity, also affect decisions on forest
use and outcomes for conservation and
subsistence? Using data on community forestry
institutions in India and Nepal, Agarwal provides
the history behind women's omission from social
institutions, the barriers that still prohibit their
participation, as well as how these barriers can be
overcome. Agarwal argues that women's
presence, in the right critical mass, makes a
considerable difference to the desired outcomes of
forest governance. These insights are based on
concerted gender disaggregated data, which is
now informing policies for desired change while
providing the status of forest dwellers. Third, many
gender negotiations are conducted at an informal
level and in private and therefore largely ignored by
policy initiatives which look for formal means of
participation. Thus, looking into the informal and
private spheres in which women negotiate their
views is important in order to create a true gender
sensitive policy that will also include this aspect
while formulating policies.52 Box 5.2 presents the
case of a successful women's irrigation group in
Gujarat.
Box 5.2: The Women's Irrigation Group of Jambar,
south Gujarat
Women in Jambar village of Gujarat were trained
by the Aga Khan Rural Support Programme to
operate mechanised pump sets and organise
themselves into management committees to
decide on the water charges, supervise water
distribution, collect water fees from the pump
operator, and deposit the amount in the bank. The
availability of mechanised irrigation enabled them
to add one crop to cultivation. The vegetables and
fruits grown as such brought monetary benefits to
the households. In addition, it translated into
greater decision-making power and visibility for the
women who were earlier neglected in community
decision making.
Source: Koppen, et al. (2001)
5.2.2 Gender in Domestic Water and
Sanitation Sector
Rural and urban women of almost all age groups
are engaged in collection of water for household
needs, including water for livestock. Women
balancing pots of water on their heads while
52Based on telephonic discussions with Seema Kulkarni of SOPPECOM, Pune, 27 April 2011.
51

7.8 Page 68

▲back to top


travelling vast stretches is a common sight in rural
India, as is the serpentine line of women standing in
queues in urban slums to collect water from a single
tap! Indeed, water collection is a responsibility that
primarily rests on women. The average distance
travelled by women every single day in rural and
peri-urban India has been a subject of countless
surveys, and the fact that this indeed affects their
overall health and decreases productive work
hours is established in many research studies.53
The girl child's educational and overall self-
development status suffers a serious setback in a
society where they are considered inferior to the
male child by getting involved in water collection
and other household chores constrained by water
supply. Although the policy discourse has
recognised this role of women, it has not come
without its own peril. Women's role in government
water schemes has largely been reduced to water
collectors while undermining their potential for
involving them in the decision-making process. As
per the NRDWP guidelines, the members in VWSC
should be selected to represent various groups of
society and 50% of which should be women
especially those belonging to SCs, STs and OBCs.
The efforts were made to involve more and more
women in the programmes at a policy level.
However, in reality and on the ground, these
provisions are hard to implement because of strong
gender bias. The technological interventions which
do not take into account the social, economic and
familial constraints of a society with respect to
women, may lead to unfair outcomes for them. For
example, while the general impression is that
introduction of hand pumps have reduced the
burden of women in terms of physical labour,
Narain (2003) reported that the relationship may
not be as simple as that. In one of the examples
from his research in village Mandhana in Haryana,
it was seen that the availability of 24-hour water
supply by hand pumps was accompanied by
change in aspirations of the village men who then
started bathing in their own houses, an activity
which was earlier done at the village pond or johad.
This change increased women's burden, as men
expected them to carry home the water for this
purpose as well. Joshi (2005), while analysing the
success of project SWAJAL for domestic water and
sanitation in rural areas of Uttar Pradesh and
Uttaranchal, found that all the deep-rooted factors
like caste, class and poverty had serious
repercussions for women in all aspects of water
management projects, viz. participation and
decision making, income generation and
empowerment. Similarly, women are primarily
responsible for looking after the health, hygiene
and sanitation in the household. According to Jha,
'Women have, by far, the most important influence
in determining household hygiene practices and in
forming habits of their children'.54
The brunt of inadequate sanitation facilities is
borne more by the women due to the social
insecurities faced by them. In both rural and urban
areas, travelling longer distances in search of
privacy to relieve themselves exposes women to
both lack of security as well as health hazards.
Under the sector reform process, the Total
Sanitation Campaign (TSC) was initiated in April
1999 with one of its mandate being to provide
privacy and dignity to women. The work done by
some NGOs has also demonstrated the benefits
associated with improved sanitation for women. In
one such case, concerning community managed
toilets in Tiruchirappalli, Tamil Nadu, it was seen
that associating women with the project greatly
empowered them (see Box 5.3). There are
important synergies of such interventions with
other programmes and policies. For example, lack
of hygienic toilets and latrines in schools can have a
particularly negative impact on girl's education, as
when faced with such a situation they are more
likely to drop out of school altogether.
Box 5.3: Community Managed Toilet (CMT)
scheme in Tiruchirappalli, Tamil Nadu
The successful implementation of the Community
Managed Toilet (CMT) scheme in Tiruchirappalli
district of Tamil Nadu not only set precedence for
such interventions in the slums of the country but
also demonstrated the interlinkages between
improved sanitation and women's empowerment.
When the onus of management of community
toilets was given to the women, not only did they
deliver the task to the best of their capacity, but they
also used the opportunity for personal and
community development. This case proves that
keeping women at the focus of water and sanitation
related projects not only benefits women in terms of
health and hygiene but also creates for them an
entry point to work for larger goals of community
development.
Source: WaterAid (2008)
This fact will have to be accounted for while looking
at the successful implementation of the recently
legislated right to education. The Swajaldhara
Yojana, launched in December 2002, envisages
that at least one third of village water supply and
sanitation committees should have women
members who get preference in training for repairs
to hand pumps. It also lays down the guidelines for
setting up of Village Water and Sanitation
Committees (VWSC) with at least one third
representation of women. A review of the TSC and
Swajaldhara schemes in 10 districts in Uttar
53See, for example, Seaforth (2001)
54Jha (n.d.) cited in ADB (2009: 20)
52

7.9 Page 69

▲back to top


Pradesh has revealed that in some sample villages
women were using the toilets more than the men,
who still defecated in the open (Chand et al., 2004).
Target 10 of the seventh goal of the MDGs calls
upon countries to halve by 2015 the proportion of
people without sustainable access to safe drinking
water and basic sanitation. However, the lack of
gender disaggregated data makes it difficult to
assess the impact this would have had on the
women. As Joshi noted: 'There is no project
indicator to measure the effectiveness of Dalit
representation in the VWSC or to assess gender in
Dalit representation' (2005: 145). So far, global
commitments made in the area of water and
sanitation (including the MDGs) do not specifically
address the equitable division of power, work,
access to and control of resources between women
and men. The current system to assess global
progress towards reaching the MDGs, through the
Joint Monitoring Programme (JMP), until recently
(2008) did not have any gender indicator for the
water and sanitation goals; one gender-specific
indicator has now been added. This slight
representation underscores how critical it is to
better mainstream gender perspectives into
national and global water and sanitation
(WATSAN) planning and monitoring processes to
ensure that the different needs of women and men
are understood, and that the specific needs and
concerns of women are taken into account
(SOPPECOM, UN-DESA and UNW-DPC, 2008).
In the JMP 2008 report, the data was collected on
the person in a household with primary
responsibility for collecting water (adult male, adult
female, girl, or boy). 'The 2008 database included a
''global' chart on this indicator based on national-
level data for 19 countries which concludes that,
globally, 64 per cent of water collectors are adult
women, another 7 per cent girls. While the JMP
report concludes that ''women shoulder the largest
burden in collecting water' (JMP, 2008: 37), the
actual 19-country database in this report revealed
that in seven (of 19) countries, men were
responsible for a larger share of water collection
than women. The report concludes that ''men
appear to play a larger role in collecting water than
they were previously given credit for' (JMP, 2008:
37). These dual conclusions—that women collect
most water ''globally', but that men in some
countries have a surprisingly prominent role in
water collection–indicate the problems of making
large-scale generalisations on the basis of scant
data' (Seager, 2010 :2). The problem occurs
because there is no uniform gender disaggregated
data on the drinking water sector collected officially
by agencies responsible for data collection and
analysis. Lack of data provides lack of evidence or
status of the relationship between gender and
water, and hence one relies on smaller studies
which cannot be extrapolated to understand larger
gender relations with respect to water.
5.2.3 Gender in Water Bureaucracy in India 55
The efforts to mainstream gender concerns in
water resource management have seen an
emphasis on integrating poor rural women in water
supply schemes and ensuring sharing of benefits
among the different stakeholders. Less emphasis
however has been put on the integration of women
in the design part of the schemes. The water sector
is dominated by male professionals who occupy
important positions, such as engineers and senior
managers. While women's participation in
programmes at the community level is a buzzword
in many projects and policies of the governments of
South Asia, there is little discussion on the issues of
women professionals. This leads us to the following
questions: What is women's contribution in the
whole process of designing and implementing
water programmes? What is the level of
participation of women in the water sector? What
are their concerns and does their presence make
any difference to the gender mainstreaming
agenda? Some of these questions were answered
by a recent study conducted by SaciWATERs,
South Asia Consortium for Interdisciplinary Water
Resources study, in association with SOPPECOM.
The study covered Bangladesh, Nepal, Sri Lanka,
Pakistan (Sindh region) and two states of India
(Maharashtra and Andhra Pradesh). The study
looked at the data of women professionals (WWPs)
in South Asia while interviewing some of the
selected women working at different levels in
governments across South Asia.
In India, the study was conducted in Maharashtra
and Andhra Pradesh, both large states and in some
ways recognised as leaders in water management.
The study discovered that in the irrigation sector 56
in Maharashtra only 7.53 per cent employees were
women, of which a mere 1.93 per cent were
employed as technical staff. The low numbers of
women staff is shown in Figures 4.1 and 4.2 (see in
page no.58) for Maharashtra and Andhra Pradesh
respectively. These are representative charts of
one department showing women in the technical
hierarchy in the MJP57 and the Irrigation and
Command Area Development in Andhra Pradesh.
In all these departments women are not present at
the top-most level. Except in Andhra Pradesh,
women are not even at the superintending
engineers' posts. In Maharashtra, only two women
55This section is based on the study 'Situational Analysis of Women Water Professionals in South Asia'. The study was completed in 2009
and published by SaciWATERs in 2011. See reference SaciWATERs, 2011.
56Five circle offices of the state out of about 35.
53

7.10 Page 70

▲back to top


in the executive engineer's position (of which one
was promoted just as she was about to retire and
the other one is a very dynamic young professional)
are in charge of a division. This clearly indicates
that the water sector does not look beyond
recruitment to engineering posts. And even for the
posts for which women are hired, they are seldom
considered for field-based or site-based work. A
woman's social role, largely seen as a homemaker
in our social setting, gives rise to conflicts between
professional and private spheres and this also
contributes to her decision regarding the choice of
work.
Figure 5.1: WWPs in MJP Technical Hierarchy,
Maharashtra (State-level data)
Tracer
Assistant Draftsman
Draftsman
Junior Engineer
Sectional Engineer
Assistant Engineer
Deputy Engineer
Executive Engineer
Superintending Engineer
Chief Engineer
0
5
10
15
20
25
Number of WWP
Figure 5.2: WWPs in APSIDC Technical Hierarchy,
Andhra Pradesh (State-level data)
Assistant Executive Engineer/
226
Assistant Engineer
Deputy Executive Engineer 12
Executive Engineer 1
Superintendent Engineer 2
Chief Engineer 0
Engineer in Chief 0
0
50 100 150 200 250
Number of WWP
These biases are not restricted to the water sector
alone but they nonetheless have a strong bearing
on the overall way that water is being managed in
the country. A woman may be able to infuse a
different perspective to an issue vis-à-vis a man. In
the above study, too, in Maharashtra, women
professionals noted that there is a difference in the
way men and women employees think and work.58
Most of them reported that they believed that
generally women are more sincere, hardworking,
particularly responsible, non-corrupt, ethical and
sensitive towards an issue than men. As one
professional noted - 'If a woman is in-charge of the
office, the financial transactions are more
transparent. On the other hand, women have not
acquired capacity to take decisions on sites,
because they don't have such exposure'
(SaciWATERs, 2011:107). So what could be the
way forward? First, there is a need for a positively
discriminatory gender policy in the water sector that
not only relates to hiring more women staff but also
retaining them through affirmative action such as
providing gender-specific facilities. An equal policy
alone will not achieve this given the current huge
imbalance. Flexible hours for women, special leave
for childcare and providing childcare facilities in
their office space will go a long way in retaining
women staff. Second, it is true that only increasing
numbers will not make a difference, but once a
critical mass of women water professionals are
generated, it can lead to a change. It therefore
becomes important to bring in a policy of
reservation and positive discrimination over
selection of women staff in government
recruitment, as it is for their political participation.
Maharashtra has introduced such a policy of 30 per
cent reservation in all new recruitments, which is
expected to change the composition of the sector in
the years to come. Third, there is an urgent need for
training and capacity building of men and women
water professionals for gender sensitiveness at
both organisational and project implementation
levels. Lastly, a network of women professionals is
needed that will provide a platform for them to come
together and discuss issues and make policy
initiatives as a collective (see Box 5.4).
Box 5.4: Women's Collective Action and
Sustainable Water Management
The case of Self Employed Women's Association's
(SEWA) women, water and work campaign in
Gujarat demonstrates how collective action by
women can be instrumental in bringing about a
sustainable water management intervention. The
programme combined rehabilitation of piped water
supply and traditional water sources with a micro-
enterprise development program for women
entrepreneurs. Three broad actions were
undertaken at the grassroots level by the women as
a part of this campaign namely, (a) revival and
upgradation of traditional sources of water, (b) roof
rainwater harvesting and (c) SEWA's barefoot
water technicians. It elucidates the significant
impact of such intervention on the lives and
livelihoods of the women and illustrates that
ensuring women's participation in projects linking
environment with livelihoods can bring true
empowerment to them in both social as well as
economic sphere serving as an entry point for rural
poverty alleviation programmes.
Source: Panda (2007)
57Water Supply and Sanitation Department, Maharashtra, India.
58Thirty women engineers were interviewed in Maharashtra.
54

8 Pages 71-80

▲back to top


8.1 Page 71

▲back to top


5.3 Summing Up
Women's representation in the water sector has
come a long way from being gender biased.
Women are now viewed as a disadvantaged group
with respect to access and to decision-making
processes around water. Although a welcome
departure from the earlier approaches, it has failed
to recognise the fact that women can contribute
immensely to the decision-making process by their
vast unique experience, and therefore they should
not only be seen as potential beneficiaries but also
as actors. The gendered inequalities are further
exacerbated by factors like class, caste and
religion , and women are seen as a homogenous
group and not as one divided by caste, poverty,
geography and wealth (Joshi, 2011; Krishnaraj,
2011). A study co-coordinated by SOPPECOM
(2011) in India and Nepal reiterated these facts.
The study clearly showed a class and caste bias in
access to domestic and irrigation water.
This chapter showed how gender inequity in water
access is directly linked with the larger thinking and
action in water sector. Water is still a masculine
subject in terms of its organisation, artefacts and
manifestations. The most important conclusion
which can be drawn from this discussion is that a
dearth of gender disaggregated data is a huge
impediment in the way gender issues are
addressed. In both irrigation and domestic water
sectors, the performance of projects aimed at
addressing equity issues in benefit sharing need to
be assessed based on such data. Same is true for
achieving the MDG targets. The gender bias also
shows in the management regime around water
with the bureaucratic set-up suffering from serious
gender underrepresentation. This under-
representation is at two levels. First, it relates to the
educational choices women make. Second, it
relates to the major constraints that women face
after entering the sector. Challenging the notion
that hard sciences are for men and soft disciplines
for women could be the first step. At another level, a
change in the understanding of women's work too
becomes important in changing the existing belief
systems that determine women's absence in this
sector. Some ways through which women's
presence can be improved include making a
gender policy for water bureaucracy, providing
gender-specific benefits and amenities, training,
capacity building and networking.
References
Agarwal, B. 2010. Gender and Green Governance: The
Political Economy of Women's Presence Within and
Beyond Community Forestry. New Delhi: Oxford
University Press.
Ahmed, S., S. Kulkarni, S. Bhat, C. Datar, Y. Mathur, and
D. Makhwana. 2008. 'Water Rights as Women's Rights?
Assessing the Scope for Women's Empowerment
through Decentralised Water Governance in
Maharashtra and Gujarat '.Available at:
http://www.idrc.ca/uploads /user-
S/12442185011Final_report_ India_Water .pdf
[Accessed on: 14 February 2011].
Asian Development Bank (ADB). 2009. India's Sanitation
for all. How to make it happen? Philippines: ADB.
Asian Development Bank (ADB) and IWMI. 2004. 'Pro-
poor Interventions in Irrigated Agriculture Issues,
Options and Proposed Actions'. Available at:
http://www.adb.org/water/actions/ REG/IWMI-ADB-
India.pdf, [Accessed on: 7 March 2011].
Cap-Net, India, SOPPECOM, Women Water Network
(WWN). 2007. Water for Livelihoods: A Gender
Perspective. (Based on writings of S. Ahmed, S. Arya,
K.J. Joy, S. Kulkarni, S.M. Panda, and S. Paranjape) Ch.
5, pp. 60-76. Pune: Cap-Net, India, SOPPECOM and
WWN.
Chand, D., C. Dey, M. Prakash, and M. Kullappa. 2004.
'Review Report on Total Sanitation Campaign /
Swajaldhara Projects In Uttar Pradesh'. Available at:
http://ddws.nic.in/popups/ rev_up_04.pdf, [Accessed on
8 March 2011].
Crow, Ben and Farhana Sultana. 2002. 'Gender, Class
and Access to Water: Three Cases in a Poor and
Crowded Delta', Society and Natural Resources, vol. 15,
709-24.
Gender and Water Alliance (GWA). 2006. 'Defining
Gender' (Updated on 11 December 2006). Available at:
http://www.genderandwater.org/page/5417 [Accessed
on 10 February 2011].
Joint Monitoring Program (JMP). 2008. Progress in
Drinking-Water and Sanitation: Special Focus on
Sanitation. New York: UN Water.
Joshi, D. 2005. 'Misunderstanding Gender in Water:
Addressing or Reproducing Exclusion',in A. Coles and T.
Wallace (eds), Gender, Water and Development, Ch 8.
Berg Publishers.
Joshi, Deepa. 2011. 'Caste, Gender and the Rhetoric of
Reform in India's Drinking Water Sector'. Economic and
Political Weekly. vol xlvi, no 18, pp. 56-63.
Joy, K.J. and Paranjpe. S. 2005. 'WOMEN AND WATER:
Relationships, Issues, Experiences, Approaches',
Lecture notes provided for the 5th South Asia Training
Programme on Gender, Water and Equity, Kathmandu in
2010 by Cap-Net, GWA, SaciWATERs, SOPPECOM,
UN HABITAT, and WSSCC.
Kabeer, N. 1994. Reversed Realities: Gender
Hierarchies in Development Thought. London: Verso.
Koppen, Barbara van, Rashmi Nagar, and Shilpa
Vasavada. 2001. 'Gender and Irrigation in India. The
Women's Irrigation Group of Jambar, South Gujarat',
Working Paper No. 10, International Water Management
Institute, Colombo, Sri Lanka. Available at:
http://ageconsearch.umn.edu/bitstream/51045/2/WOR
10.pdf [Accessed May 2011].
55

8.2 Page 72

▲back to top


Krishnaraj ,Maithreyi. 2011. 'Women and Water: Issues
of Gender, Caste, Class and Institutions', Economic and
Political Weekly, vol xlvi, no 18, pp. 37-39.
Kulkarni, S. 2007. 'Women and Water Policy: Issues and
Alternatives',in S. Krishna (ed.), Women's Livelihood
Rights: Recasting Citizenship for Development. New
Delhi : Sage Publications.
Madhav, R. 2007. 'Irrigation Reforms in Andhra Pradesh:
Whither the Trajectory of Legal Changes? IELRC
Working Paper-2007-4. Geneva: IELRC.
Mudgerikar, A., Cronin, A.A. 2012. Review of the status of
equity in WASH programming in India, Paper prepared
for The South Asia Sanitation and Hygiene Workshop,
February 2012, Bangladesh
Narain, V. 2003. 'Water Scarcity and Institutional
Adaptation: Lessons from Four Case Studies', in TERI,
Environmental Threats, Vulnerability, and Adaptation:
Case Studies from India, pp 107-20. New Delhi: The
Energy and Resources Institute.
Panda, S. M. 2007. 'Women's Collective Action and
Sustainable Water Management: Case of SEWA's Water
Campaign in Gujarat, India'. Available at:
http://www.capri.cgiar.org/pdf/capriwp61.pdf [Accessed
June 2011].
Piloting the Tool for Assessing Inequities in the Water
Sector in India and Nepal', SOPPECOM, GWA and
SUTRA, Pune, India.
Ruprecht, L (ed.). 2003. UNESCO's Gender
Mainstreaming Implementation Framework (GMIF):
2002-2007. Paris: Bureau of Strategic Planning –Section
for Women and Gender Equality.
SaciWATERs. 2011. 'Situational Analysis of Women
Water Professionals in South Asia', SOPPECOM and
SaciWATERs study, SaciWATERs, India.
Seaforth,W. 2001. `Why Water is a Women's Issue',
Habitat Debate, UNCHS Habitat, vol. 7, no. 1.
Seager, J. 2010. 'Gender and Water: Good Rhetoric, but
it doesn't ''count”', Editorial, Geoforum, vol. 41, nos 1-3.
SOPPECOM. 2008. 'Reforming Water Adding Women:
Does Decentralised Water Governance Further Gender
Justice in India?' Available at:
http://www.soppecom.org/pdf/Policy%20brief%201.pdf,
[Accessed in: April, 2011]
SOPPECOM. 2011. 'Social and Gender Equity Gauge
Social and Gender Equity Gauge: United Nations
Department of Economic and Social Affairs (UN-DESA)
and UN-Water Decade Programme on Capacity
Development (UNW-DPC). 2008. 'Gender
Disaggregated Data on Water and Sanitation', Expert
Group Meeting Report, New York.
UNICEF .2012. Equity in Drinking Water and Sanitation
in India; Perspectives on equity and gender in the WASH
Sector in India; UNICEF WASH India snapshot series;
(unpublished) 6 pages.
Upadhyay, B. 2005. 'Gendered Livelihoods and Multiple
Water Use in North Gujarat', Agriculture and Human
Values, vol. 22, pp. 411-20. Available at:
http://www.springerlink.com/content/f01752771
17638k1/ [Accessed on 23 February 2011].
WaterAid. 2008. Tiruchirappalli Shows the Way:
Community-Municipal Corporation-NGO Partnership for
City-wide Pro-poor Slums' Infrastructure Improvement.
Available at: http://www.wateraid.org/documents/
plugin_documents/tiruchirappalli_shows_the_way.pdf,
[Accessed on February 2011].
56

8.3 Page 73

▲back to top


6.1 Existing Institutional Set-up
The current arrangement to manage water in India
exists at two levels—central government and state
governments. The designated apex body for water
resource management is the union Ministry of
Water Resources (MoWR), at the centre. The
ministry is responsible for the overall development,
conservation and management of water, treating it
as a national resource. This includes formulating
general policies on water resource development
and providing technical assistance to all states in
irrigation, multipurpose projects, groundwater
exploration and exploitation, command area
development, drainage, flood control, water
logging, coastal and riverbank erosion problems,
dam safety, and hydraulic structures for navigation
and hydropower. Additionally, it also oversees the
regulation and development of inter-state rivers.
Various other central ministries also carry out
different functions in the water sector.
Ÿ Urban Water Supply and Sewage Disposal –
Ministry of Urban Development (MoUD)
Ÿ Rural Water Supply and Rural Sanitation –
Ministry of Drinking Water and Sanitation
(MoDWS)
Ÿ Hydro-electric and Thermal Power – Ministry of
Power (MoP)
Ÿ Pollution and Environment Control – Ministry of
Environment and Forests (MoEF)
Besides, the Indian National Committee of
Irrigation and Drainage (INCID) works in close
coordination with its parent organisation, the
International Commission on Irrigation and
Drainage (ICID), to further promote research in
relevant areas. The Ministry of Agriculture and
Cooperation (MoAC) contributes by funding and
implementing watershed focused development
programmes. Water is a state subject and the
governments at the state level are primarily
responsible for its use, conservation and control.
Administratively, the control and responsibility for
development of water and water resources lies with
the state's various departments and corporations:
Ÿ Major and medium irrigation: Irrigation/water
resources departments.
Ÿ Minor irrigation: Water resources departments,
minor irrigation corporations, zilla
parishads/panchayats, and other departments
like agriculture.
Ÿ Urban water supply: Public health/public works
department.
Ÿ Rural water supply: Gram panchayats.
Ÿ Government tube wells: Constructed and
managed by irrigation/water resources
department or by tube well corporations set up
for the purpose.
Ÿ Hydropower: State electricity boards.
6.1.1 Policies and Legislations
The National Water Policy (NWP) for India was
adopted in 1987 and revised in 2002. The policy
focuses on planning and development of water-
based resources in the country through
governance, taking into account the national
perspectives. The emphasis is more on river-based
planning for water use. Drinking water is the main
priority when it comes to allocation of water,
followed by irrigation (agriculture), hydropower,
57

8.4 Page 74

▲back to top


navigation, and industrial or other uses. As
mentioned earlier, water resources development is
a state-governed subject. Thus, all the states in
India are required to formulate their own state water
policies within the ambit of the NWP and
subsequently set up a blueprint for water resources
development.
6.2 Water Governance in Transition
For many centuries, water management in India
has been the prerogative of the government. After
independence, the Government of India (GoI) has
steered the country's water resources rather
aggressively, resulting in the present scenario,
where the scope for surface and groundwater
sources expansion has stagnated. Thus, the
challenge for India now lies in the efficient and
effective management of existing water resources
via a sensible mix of decentralised responsibilities
and authority to local institutions and also providing
large-scale investment to redirect the surplus water
to water deficit areas (James, 2003).
Currently, structural changes are underway in how
water is governed and managed in India in order to
deal more effectively with emerging challenges.
Some of the major challenges include closing water
basins where water allocation is equal to or more
than the available water (surface water); extraction
exceeding recharge (groundwater); rapid
urbanisation and industrialisation which give rise to
new priorities and demand in water use; and
globalisation which influences water policy and
politics (Mollinga and Tucker, 2010). There is also
sustained pressure from various quarters of society
to transform the role of the government from
service provider to facilitator so it can provide the
requisite level of financial and policy support to
communities and community-based institutions,
thus fulfilling services at desired levels on a
sustainable and equitable basis.These processes
are reflected in the Indian government's policy. For
example, the mid-term appraisal of the 10th plan,
the report of the sub-committee of the National
Development Council, and the Eleventh Plan and
its approach paper, besides the NWP 2002 which
showcased the evolution involved in the thought
process on water resources management (ibid.).
Some of these policy changes have been
converted into action through various water sector
reforms.
6.2.1 Water Sector Reforms in India
Almost all the states in India have adopted various
approaches to address new challenges in the water
sector. These approaches or reforms are primarily
meant for enhancing overall efficiency and
effectiveness of water governance. All these
reforms have however been taken on a pilot basis
and their suitability in the Indian context is still
under debate. Few of the major reforms include:
6.2.1.1. National Rural Drinking Water Programme
(NRDWP)
The first major initiative in the country was the
Accelerated Rural Water Supply Programme
(ARWSP), which commenced in the year 1972-73.
To provide impetus to the coverage, a Technology
Mission on Drinking Water was subsequently
launched in 1986. This mission was renamed the
Rajiv Gandhi National Drinking Water Mission in
1991-92. In the year 1999, the Department of
Drinking Water Supply (DDWS) was formed under
the Ministry of Rural Development (MoRD), the
main objective of which was focused on drinking
water and sanitation.
Box 6.1: National Rural Drinking Water Programme
The Rural Water Supply Programme and
Guidelines have been revised into the National
Rural Drinking Water Programme (NRDWP) with
effect from 1 April 2009. It is one of the six
components of the Bharat Nirman programme that
was to be implemented in four years, from 2005–06
to 2008–09 for building rural infrastructure. The
major changes in this new approach have been
with respect to the following:
Ÿ Source sustainability, community managed
programmes and recognition of the gap
between infrastructure created and service
available.
Ÿ Installation of a water source that will not be
considered as the criteria for fully covered
habitation, but adequate water supply received
by all household of the habitations will be the
criteria.
Ÿ Change the lpcd (litres per capita per day)
standard as a means of measuring availability
of water, but look at larger and various
indicators of water security.
Ÿ Focus on ensuring household level drinking
water security through preparation of village
water security plans and household level water
budgeting.
Ÿ Conjunctive use of surface and groundwater
and focus on rainwater harvesting for recharge.
For old and new groundwater schemes,
recharge mechanisms to be made mandatory.
Ÿ Need for social regulation of agricultural water
for meeting the demand for drinking water.
Ÿ Revival of traditional systems of water
conservation and introduction of catchment
protection schemes for surface water.
Ÿ Convergence with the National Rural Health
Mission (NRHM) on aspects of water quality and
health indicators. The guidelines also call for
health-based targets as an improvement in
58

8.5 Page 75

▲back to top


water supply.
Ÿ As a part of ensuring sustainability of sources
and systems, incentivizing good behaviour in
the gram panchayats to create drinking water
security in their jurisdictional areas; Swajal
Gram Purashkar to be launched.
Ÿ Linkage of National Rural Drinking Water
Quality Monitoring & Surveillance Programme
with the recently approved Jalmani guidelines
for implementation of standalone drinking water
purifications systems in rural schools.
Standposts
Tubewells,
hand pumps
Wells,
protected
springs
Unprotected
source, shallow
hand pumps,
canals
Household
connections,
individual and
multiple
Progressive Improvements in the service level as
envisaged by the NRDWP
The first major sector reform project (SRP) was
started the same year. The department was
renamed the Department of Drinking Water and
Sanitation in 2010. Finally, in 2011, it was conferred
the status of a ministry. This ministry is the nodal
department for all activities in the sector, ranging
from overall policy planning, funding and
coordination of programmes focused on drinking
water and sanitation in the country.
The Joint Monitoring Programme for Water Supply
and Sanitation of UNICEF/WHO states that the
level of investment in the water and sanitation
sector in India, although low by international
standards, has increased during the 2000s. There
is a significant increase in the percentage of
Indians with access to improved sources of water,
from 72 per cent (in 1990) to 88 per cent (in 2008). A
key challenge remains, however, in that the local
government institutions responsible for operating
and maintaining the infrastructure usually lack the
capacity and financial resources to execute their
functions effectively (World Bank, 2006).
6.2.1.2 Integrated Watershed Management
Programme (IWMP)
The IWMP is an initiative of the Department of Land
Resources (DoLR) of the MoRD. Other ministries
like the the MoA and MoEF are also involved. Till
April 2008, DoLR was implementing three
watershed programmes, viz. Integrated
Wastelands Development Programme,
Drought Prone Areas Programme, and Desert
Development Programme. Subsequently, during
the Eleventh Plan (2007-12), all these programmes
were brought under a single entity, the IWMP, which
is implemented under the Common Guidelines on
Watershed Development, 2008. The aim of the
programme is towards restoration of the ecological
balance through harnessing, conserving and
developing degraded natural resources like soil,
vegetative cover and water (DoLR, n.d). Up to the
Tenth Five Year plan (2002-7), it has been reported
that nearly 51 Mha on watershed basis has been
developed (Singh et al., n.d).
DoLR is committed to updating scheme guidelines
with periodic inputs from varied institutions
including research organisations, voluntary
organisations, technical committees, workshops
and seminars (ibid.). The modified IWMP (2008
onwards) has adopted a three-tier approach—the
upper topography, which is largely hilly and
forested, treated with support of the forest
department. For slopes, which form part of the
intermediate topography and are situated above
agricultural land, IWMP would address all issues
concerning land treatment by implementing best
possible options, including cropping patterns,
horticulture and agro-forestry. In the lower tier,
consisting of plains and agricultural lands, the
IWMP would be integrated with employment
generating programmes such as the National Rural
Employment Guarantee Scheme (NREGS) (DoLR,
n.d.).
6.2.1.3 Participatory Irrigation Management (PIM)
PIM, an integral part of any systemic reforms, aims
at involving all stakeholders and is acknowledged
as an element of policy. After recognising the need
to formulate a sensible legal framework for PIM, the
MoWR brought out a Model Act in 1998, which was
to be adopted by state legislatures for enacting new
irrigation acts or amending existing acts for
facilitating PIM. Fifteen state governments (Andhra
Pradesh, Assam, Bihar, Chhattisgarh, Goa,
Gujarat, Karnataka, Kerala, Madhya Pradesh,
Maharashtra, Orissa, Rajasthan, Sikkim, Tamil
Nadu, and Uttar Pradesh) have enacted a new PIM
Act or made amendments to their existing ones.
The remaining state governments, including
Punjab, Haryana, Himachal Pradesh, Manipur, and
Arunachal Pradesh are in the process of taking
action (Planning Commission, 2010).
The actual progress in implementing PIM has been
dismal, despite the formation of new acts or
modification of existing ones. Approximately 20 per
cent of the total command area of existing irrigation
projects (13.5 Mha) has been covered till the end of
2007 through approximately 56,934 WUAs.
Studies on the existing PIMs reveal that there are
several potential advantages, including sense of
ownership amongst users which motivates them to
59

8.6 Page 76

▲back to top


use water judiciously. These studies also reveal
that PIM only works under certain enabling
conditions, which has restricted its progress (ibid.).
6.2.1.4 Public Private Partnership
There have been several new developments in the
privatisation of water during the past 10-15 years.
In the year 1991, GoI announced a policy of
opening up the power sector to private players.
Subsequently, hydropower was also opened to
private sector participation. Although hydropower
has been privatised for over fifteen years, it is only
now that we are beginning to witness privatisation
in other areas of the water sector. The process of
privatisation of irrigation is in the initial stages. On
the other side, privatisation of water supply,
especially industrial water supply, is now a reality
and various cases are at different stages of
development and implementation (Dwivedi et al.,
2007).
The Eleventh Five Year Plan document of the
Planning Commission of India emphasises private
sector investments improving infrastructure and
public utility systems through various Public-
Private Partnerships (PPPs). Water supply is an
integral part of this infrastructure sector
development. The government has slowly but
surely initiated the process of distancing itself from
the responsibilities for which it was accountable in
the past, and is instead relying heavily on the
private sector to deliver the service. This is
because the service delivery levels of the
government have been inadequate, due to low
recovery and operational inefficiency levels when
compared to the production costs. It has been
consistently argued that the correct
implementation of the PPP projects will be
beneficial for all (ELRS, 2011).
Some of the few success stories of the PPP model
are the 24X7 water supply schemes of Karnataka
and the waste water treatment plant at Sonia Vihar
in New Delhi. But on the flip side, PPP projects
have also ignored most of the principles of good
governance, viz. public participation and
consultation, transparency, accountability, and
efficiency. The Tirupur Water Supply & Sewerage
Project (Tamil Nadu) and Mysore PPP Project are
two examples. Based on these unfortunate
experiences, serious concerns and questions have
been raised about PPP projects in the water sector
and their ability to deliver services without
interfering with the idea of human right to water.
The debate here is about the state's responsibilities
and obligations to control activities which affect
public interest. It is also debatable that a
fundamental right is a non-negotiable right and no
private entity can alter this in connivance with the
state (ibid.). Further, the water privatisation agenda
in the PPP model needs better scrutiny from the
water pricing perspective. Joy et al (2011),
discusses the water pricing issues in India. The
authors take a mid view of arguing that water is both
social as well as economic god and argues not for a
withdrawal of the state but for a change in its role.
'The provision of water is a service that serves both
functions, a basic service aimed at basic livelihood
needs, and also an economic service for
conspicuous consumption or surplus generation.
Both of these functions also place contradictory
demands on how the service should be provided
and at what charge. A basic service aimed at basic
needs to be provided to all equitably at an
affordable price, including the poorest sections,
has to be subsidised if need be, through cross
subsidy within the sector or across sectors' (ibid:
14-15).
6.2.1.5 Independent Regulatory Authorities
(IRAs)59
In the last few years, India witnessed some novel
changes in the area of water sector regulatory
reforms. The advent of the Independent Regulatory
Authorities or IRAs at the state level are new
mechanisms which are expected to usher in
sweeping fundamental and comprehensive
changes in governance in this sector (Wagle and
Warghade, 2010: 49). The first state to have this
new regulatory entity was Andhra Pradesh, which
formulated the Andhra Pradesh Water Resources
Development Corporation (APWRDC) created
under an act of the same name in 1997. However, it
is Maharashtra that has till date introduced the
most far-reaching institutional reforms in the sector
through the Maharashtra Water Resources
Regulatory Authority (MWRRA) Act 2005. The acts
of some states like Arunachal Pradesh (2006) and
Uttar Pradesh (Uttar Pradesh Water Management
and Regulatory Commission-UPWMRC Act, 2008)
have substantially borrowed from the MWRRA
legislation. The larger states of Madhya Pradesh
and Andhra Pradesh are still awaiting approval of
their pending bills along similar lines as MWRRA.
Rao and Badiger (2010) analysed the
organisational set-up and functioning of the IRA,
which is focused on five prime areas of
governance: (a) tariffs; (b) distribution through
entitlements and allotment; (c) resource planning;
(d) private sector participation; and (e) public
participation.
Water Pricing and Tariff Structures: The proposed
changes in water governance under MWRRA
(GoM, 2005) and UPWMRC (GoUP, 2008) focus
on the empowerment of water regulatory
authorities towards establishing a tariff-based
59This section is based on the analysis of IRAs by Rao and Badiger (2010) and Wagle and Warghade (2010).
60

8.7 Page 77

▲back to top


system, which in turn works on the 'cost recovery'
principle to determine and regulate water tariffs.
While the MWRRA Act restricts the level of
recovery to O&M costs, the UPWMRC Act
recommends, along with the recovery of O&M
costs, the recovery of part of the capital costs (in the
form of depreciation) and the 'cost of subsidy' from
water tariffs. This provision for the recovery of
capital costs would enable higher
commercialisation of water services and would
thus create a favourable environment for
privatisation in the water governance sector.
Water Entitlements and Allotments: The core of the
regulatory framework of the IRA is the creation,
management and regulation of the 'Water
Entitlement System' (WES). Both the UPWMRC
and MWRRA have been empowered through their
respective legislations to determine as well as
regulate water entitlements to various user groups.
Additionally, a framework and criterion has been
developed for water entitlements trading, wherein
the authority can determine the distribution of
various user entitlements. This can further be
'transferred, bartered, bought or sold on annual or
seasonal basis within a market system'.
Water Resources Monitoring, Management and
Planning: The Integrated State Water Plan (ISWP)
is drawn from Integrated Water Resources
Management (IWRM). In the case of the UPWMRC
Act, the government has been given the
responsibility to draft the ISWP and give itself the
powers of approval. However, the MWRRA Act
delegates the power of approval of ISWP to a wide-
ranging committee comprising various ministers.
Thus, the role of MWRRA is restricted to monitoring
IWSP implementation. It is expected that the five
River Basin Agencies (RBA) created in
Maharashtra would prepare basin and sub-basin
level plans for their respective river basins using a
multi-sectoral, participatory approach.
Subsequently, the individual RBA plans would be
integrated into the IWSP. Further, issues of
entitlements, tariffs and prioritising of available
water for equitable distribution is reserved for the
MWRRA. It is in fact a very brave and futuristic step
to have a decentralised river basin approach, which
has been highlighted in MWRRA. While the
planning part should ideally involve government
and citizens, in the case of the UPWMRC the IRA
seems to have the last say on the ISWP, which
might be troublesome as it puts the planning
regime directly under the control of the IRA.
Public Participation: The concept of public
participation is more meaningful when, in the true
sense, it is the public that controls various aspects
of governance. In the case of the IRAs, however,
decision making tends to remain with the
institutions which are inaccessible to the public.
Also, there is no process through which decision
makers can be held accountable following their
disregard for public views and suggestions, if at all,
in their final decisions.
An analysis of the process of formulation of IRA
laws by Wagle and Warghade (2010) indicates that
the laws in themselves are not transparent, not
participatory and not accountable. The credibility of
organisations involved in the formulation is low too.
Owing to these two factors there is always an
uncertainty on the reliability and acceptance of the
IRAs for most of the stakeholders.
6.2.1.6 Groundwater Regulation
The requirement for effective regulation with regard
to groundwater extraction has been recognised.
The MoWR is pursuing all the states and union
territories (UTs) for the enactment of a law on
groundwater. The Model Bill initially circulated
among all states/UTs during 1970, and re-
circulated during 1992, 1996 and 2005, enables the
enactment of a suitable legislation for regulation
and control of groundwater development along the
lines of the Model Bill. 'The Model Bill to Regulate
and Control the Development and Management of
Ground Water was largely ignored by states for
about three decades. It is only over the past fifteen
years that states and UTs have started adopting
groundwater legislation. The states/UTs that have
adopted groundwater legislation are: Andhra
Pradesh, Bihar, Goa, Himachal Pradesh,
Karnataka, Kerala, Maharashtra (with focus on
drinking water), Tamil Nadu, West Bengal;
Chandigarh, Dadra and Nagar Haveli,
Lakshadweep and Pondicherry. Some states, like
Maharashtra and Uttar Pradesh have groundwater
bills that are pending for adoption by the legislative
assembly. In all the states/UTs that have adopted
groundwater legislation, the basic framework is
directly derived from the existing Model Bill. The
very fact of adopting a law related to groundwater
confirms the increasing importance of
groundwater. At the same time, groundwater laws
adopted in recent years are neither adequate nor
satisfactory in large part, because of the
shortcomings in the Model Bill, 2005 highlighted
above.' (Planning Commission, 2011: 4)
6.2.2. Sanitation
Poor sanitation and hygiene are major causes of
poor water quality, as the bacteria from human
excreta contaminate drinking water. Hence,
interventions promoting proper sanitation are very
crucial. Some of the key efforts in the area include:-
6.2.2.1 Total Sanitation Campaign (TSC) for Rural
Areas
The Comprehensive Rural Sanitation Programme
was restructured by the GoI by launching the Total
61

8.8 Page 78

▲back to top


Sanitation Campaign or TSC in 1999. The major
objectives of the TSC include improving the
general quality of life and increasing sanitation
coverage in rural areas by access to toilets for all by
2012 through motivation of communities and
panchayati raj Institutions. This is being done by
promoting sustainable sanitation facilities by
creating awareness and health education.
Individual household latrines, school toilets,
anganwaadi toilets, sanitary complexes and rural
sanitary marts have been taken up under the
scheme. However, the emphasis on achievement
of national and international coverage targets has
led to a situation where there is more focus is on
latrinisation at least in some states. There seems to
be an absence of monitoring of the use of
household latrines, hand washing and other
hygienic practices in some states (WaterAid, 2006)
6.2.2.2 Integrated Low Cost Sanitation Scheme
for Urban Areas:
The Ministry of Housing & Urban Poverty
Alleviation (MoHUPA) has a scheme for
conversion/construction of low cost sanitation units
through sanitary two pit pour-flush latrines with
superstructures and appropriate variations to suit
local conditions (area specific latrines). New
latrines are also constructed where economically
weaker section households have no latrines and
the inhuman practice of defecating in the open in
urban areas exists. The scheme commenced from
1980-81 and was initially implemented through the
Ministry of Home Affairs (MoHA), and subsequently
through the Ministry of Welfare (MoW). The MoUD
implemented the scheme from 1989-90; later, the
scheme was shifted to MoHUPA (erstwhile Ministry
of Urban Employment and Poverty Alleviation). The
scheme guidelines were revised in 2008. This
scheme is on an 'All Town' coverage basis
(MoHUPA, n.d).
6.2.2.2 National Urban Sanitation Policy:
The National Urban Sanitation Policy was
launched by the MoUD in 2008. The ministry also
announced an award plan as a policy initiative to
motivate cities and urban local bodies to achieve
total sanitation. The award, the Nirmal Shahar
Puraskar (Clean Cities Award), has been designed
in the model of the rural sanitation rewards
scheme, and aims to honour cities which achieve
total sanitation. This includes Open Defecation-
Free (ODF) status and 100 per cent safe waste
disposal. The major but positive highlight of the
policy and the award plan is that the focus is not just
on infrastructure development but also on
outcomes and behavioural change. Under this
policy, all the states in the country are required to
develop state sanitation strategies as per the
national guidelines (WSP, n.d.).
6.3 Water and Sanitation as Human Right
Presently, a debate continues to rage on whether or
not water is a right. The parties in favour of 'water as
right' view adequate access to safe water as a
basic individual need, to be treated at par with other
human rights, all of which form an integral part of
the Universal Declaration of Human Rights. The
role of water is irreplaceable. While one can always
argue that even if water were declared a human
right, it would not lead to more availability of water;
it could however institutionalise access to water,
specifically for the poor. Subsequently, if the right is
justified and can be proved to be constitutional,
there is vast scope for it being transformed into a
powerful tool for mobilisation (Ballabh, 2008).
Further, water rights are strongly linked to land
rights. It has also been observed that land rights
largely determine water allocations. Ongoing
efforts to delink land rights from water rights,
although mentioned in the NWP 2002, are yet to be
recognised. Prominent and ongoing social
movements have termed this delinking as
imperative to break the dominance of the rich and
powerful over the poor, by improving access to this
scarce and essential resource. This is because
many livelihoods are dependent on water,
irrespective of the landholding size or ownership
(Rao and Badiger, 2010). See Box 6.2 for an
excerpt on right to water from Ramaswamy Iyer's
alternative water policy for India (Iyer, 2011: 201-
04).
Endorsing this approach, the United Nations
General Assembly adopted a resolution
recognising access to clean water and sanitation
as human rights on 28 July 2010. India was one of
the 122 countries which voted in favour. The
resolution text states its concern that an estimated
884 million people lack access to safe drinking
water and more than 2.6 billion people globally,
constituting 40 per cent of the population, don't
have access to basic sanitation.
Box 6.2: Water as a Right
The right to water needs to be distinguished from
water rights. The right to water relates to the basic
water requirement for life (i e, water for drinking,
cooking, washing and personal hygiene, and the
essential water needs of livestock), whereas 'water
rights' is a term that is generally used in the context
of water for irrigation, industrial or commercial use,
etc; that is, economic uses of water. The right to
water as defined above is a fundamental right by
judicial interpretation. The state has a responsibility
to ensure that this right is not denied to any citizen
or group of citizens. The right to water must include
the rights of access of certain tribal and other
communities to forests, mountains, rivers, etc; that
is, the natural resource base on which they have for
centuries depended for sustenance. Between a
62

8.9 Page 79

▲back to top


fundamental right (life-right) and a non-
fundamental use-right, the former must always
take precedence over the latter; and the exercise of
economic rights by some must not be allowed to
jeopardise the fundamental rights of others. Water-
supply and sanitation are inter-connected. If there
is a right to water, there must also be a right to
decent sanitation.
Source: Iyer (2011)
6.4 Summing up
The water needs in the country have risen
exponentially to an unprecedented scale,
especially in recent times. The demand has
outstripped supply. The solution to the problems in
water across the country lies largely in areas of
effective mechanism for conservation, distribution
and efficient use and management of this resource.
All the states in the country have been initiating
various approaches to address new challenges in
the water sector. Most of these approaches and/or
reforms are focused towards enhancement of
overall efficiency and effectiveness in the area of
water governance. These reforms have been
implemented on a pilot model basis and thus their
scalability and suitability in the context of an entire
region or on a national scale is debatable.
Although there have been varied developments in
water resource management initiatives, the Indian
governance system needs to be strengthened
significantly to achieve the intended goals of social
equity, accessibility and environmental
sustainability. India, as a nation, has probably the
best of all written policies, laws and regulations;
what remains a challenge is the execution. To
create an efficient system and environment,
integration of policies (both in terms of content and
institutions) to guide resource development,
allocation and use, especially with regard to local
level water supply and management, is required.
Coordination is of utmost importance, especially in
the field to limit overlap of responsibilities and
duties of similar field-level bodies. Besides
initiation of policies and their implementation, what
is required most is the demand for effective
monitoring systems for bodies/institutions formed
under the reform process as there are always
uncertainties on the transparency of decision
making and implementation of policies.
References
Ballabh, V. 2008. 'Governance of Water: Issues and
Challenges', in Vishwa Ballabh (ed.), Governance of
Water: Institutional Alternatives and Political Economy,
pp. 3-17. New Delhi: Sage Publications..
Department of Land Resources (DoLR). n.d. 'Integrated
Watershed Management Programme (IWMP)'. Available
at http://dolr.nic.in/iwmp_ main.htm [Accessed on 4
January 2012].
Dwivedi, G., Rehmat and S. Dharmadhikari. 2007.
Water: Private, Limited: Issues in Privatisation,
Corporatisation and Commercialisation of Water Sector
in India. Manthan Adhyayan Kendra.
Environmental Law Research Society (ELRS). 2011.
'Water Supply and Sanitation Law and Policy Reforms in
Karnataka – Equity, Sustainability and Human Rights', 3-
4, January, 2011, Proceedings of a Capacity Building
Workshop organised by ELRS in Bangalore
Iyer, R. 2011. 'National Water Policy: An Alternate Draft
for Consideration', Economic and Political Weekly, vol.
XLVI, nos 26 & 27, pp. 201-14.
James, A.J. 2003. 'Institutional Challenges for Water
Resources Management: India and South Africa. Water,
Households and Rural Livelihoods (WHIRL)', WHIRL
Project Working Paper 7.
Joy K. J., Priya Sangameswaran, A. Latha, Shripad
Dharmadhikary, M. K. Prasad, K. P. Soma, 2011, 'Life,
Livelihoods, Ecosystems, Culture: Entitlements and
Allocation of Water for Competing Uses', (position paper
by the thematic subgroup on Water Entitlements and
Allocations for Livelihoods and Ecosystem Needs),
Pune: Forum for Policy Dialogue on Water Conflicts in
India. Accessed on April 8, 2012 at http://conflicts.
indiawaterportal.org
Ministry of Housing and Urban Poverty Alleviation
(MoHUPA). n.d. 'Integrated Low Cost Sanitation Scheme
Revised Guidelines, 2008', Available at:
http://mhupa.gov.in/w_new/ILCS-GUIDELINES-PLUS-
DPR-FORMAT.pdf [Accessed on: 4 January 2012].
Mollinga P.P. and S.P. Tucker. 2010. 'Changing Water
Governance in India: Taking the Longer View', South
Asian Water Studies, vol. 2, no. 1. Available at:
www.sawasjournal.org. Planning Commission. 2010.
'Water Resources. Mid Term Appraisal for Eleventh Five
Year Plan 2007-2012', pp. 442–68. Available at:
http://planningcommission.gov.in/plans/mta/11th_mta/
MTA.html. [Accessed on March 10, 2011].
Planning Commission. 2011. Draft Model Bill For The
Conservation, Protection And Regulation Of
Groundwater, 2011. Avilable online at
http://planningcommission.nic.in/aboutus/committee/wr
kgrp12/wr/wg_back.pdf. [Accessed on April 21, 2012)
Public Information Bureau (PIB). 2010. 'Enactment and
Implementation of the Model Bill for Ground Water
Legislation'. Available at:
http://www.pib.nic.in/newsite/erelease.aspx?relid=5762
8 [Accessed 11 March 2011].
Rao, D.B. and S. Badiger. 2010. 'Understanding
Emerging Independent Regulatory Frameworks:
Lessons for Reforming Karnataka's Water Governance',
Paper presented at the 5th South Asia Research
Workshop organised by SaciWATERs and RSPN-
Bhutan during 3-5 May 2010 in Thimphu.
Singh, Prem, H.C. Behera and Aradhana Singh. n.d.
'Impact and Effectiveness of Watershed Development
Programmes in India' (Review and Analysis Based on the
63

8.10 Page 80

▲back to top


Studies Conducted by Various Government Agencies
and Other Organisations) Available at
http://dolr.nic.in/dolr/downloads/pdfs/Impact%20and%2
0Effectiveness%20of%20WDP%20by%20LBSNAA.pdf
[Accessed on 4 January 2012].
Wagle, S. and S. Warghade. 2010. 'New Laws
Establishing Independent Regulatory Agencies in the
Indian Water Sector: Long Term Implications for
Governance', South Asian Water Studies, vol. 2, no. 1.
Available at:
www.sawasjournal.org [Accessed on 8 March 2011].
Water and Sanitation Programme (WSP). n.d.
'Government of India Launches New Urban Sanitation
Policy'. http://www.wsp.org/wsp/ node/108 [Accessed
on: 4 January 2012].
WaterAid. 2006. 'Total Sanitation in South Asia: The
Challenges Ahead', Discussion Paper. Available at:
http://www.wateraid.org/documents/plugin_documents
/sacosan_2_reginal_wa_paper.pdf [Accessed on 4
January 2012].
World Bank. 2006. 'India: Development Policy Review'.
Available at:
http://web.worldbank.org/WBSITE/EXTERNAL/COUNT
RIES/SOUTHASIAEXT/0,,contentMDK:20980493~pag
ePK:146736~piPK:146830~theSitePK:223547,00.html
[Accessed on 9 March 2011].
64

9 Pages 81-90

▲back to top


9.1 Page 81

▲back to top


The concerted efforts of government, civil society
and external support agencies in the water sector
have manifested themselves in the form of various
positive cases and examples from across the
country. These endeavours, whether on a small or
large scale, are steps towards achieving the MDGs
or the overarching goal of water for all. India's
regional diversity poses unique challenges for
water resource management and governance.
Each geographical region with its own socio-
economic uniqueness demands water resource
management intervention suitable to the people's
need and, at the same time, offering pragmatic
solutions to the constraints set by local topography.
In some of the most remote areas of the country,
where government interventions have not yet
reached, various non-governmental organisations
(NGOs) are mobilising communities and brining
about developmental changes at the grass-roots
level.
One of the goals of this chapter is to bring forth
cases from the field on successful water
management practices. As part of structuring this
report, a case study from each geographical region
of the country, that, north, south, east, west and
north-east, was documented representing best
practices in water resource management.60 These
cases demonstrate the community level solutions
applied to address various context specific
problems in the study areas. These cases
documents both – small and large scale
interventions. They illustrate the integrated
approach of securing livelihood options through
better water resources management. The cases
were selected based on their uniqueness and
innovation of approach and the fact that they are
successful models for replication.
7. 1 Small-scale Initiatives
7.1.1 Drinking Water and Sanitation Issues in
Bawana Resettlement Colony
As discussed in Chapter 3, access to water and
sanitation is a pressing issue in India's slums.
Achieving the targets of the MDGs will be elusive
until close to 93 million slum dwellers61 are
integrated in the country's drinking water and
sanitation programmes. The case of the Bawana
resettlement colony in New Delhi reflects the
concerns of the people who have been forcefully
evicted on grounds of development. When people
of Yamunapushta in New Delhi were evicted from
their homes and resettled some 35 km away from
the main city, it was done without basic amenities
like drinking water or toilets. The women and young
girls face harassment by attendants in community
public toilets and by the landlords of the nearby
fields who viewed the resettled families as
encroachers and outsiders. It came to the fore that
water and sanitation (WATSAN) is only one of the
issues faced by the resettled population. For
people without secured land rights and medical
facilities, water scarcity and inadequate sanitation
is just another issue. The NGO Jagori intervened
by working with the women groups in Bawana
about various issues like inadequacies in the public
distribution system, domestic violence, WATSAN,
60The initiatives of the Community Based Tank Management Programme in Andhra Pradesh; Jagor's initiative in Delhi's resettlement
colony; the Dong System in Assam; Gram Vikas's efforts in Odisha; and WASMO's work in Gujarat has been documented by the
SaciWATERs team and has been published separately as policy briefs. The information presented here is based on the fieldwork
conducted in 2011 in these locations.
61Ministry of Housing and Urban Poverty Alleviation (MoHUPA), 2011. Available at : http://pib.nic.in/newsite/erelease.aspx?relid=71733
65

9.2 Page 82

▲back to top


etc. In 2009, Jagori undertook an action research
involving the youth and conducted what are known
as safety audits. The aim was to bring forth the
inadequacies in the infrastructure of the resettled
colonies and the existing gender gap while
planning for basic services. They conducted a
Rapid Situation Analysis (RSA) with youth in five
blocks. This was done to analyse the status of the
pipes, drains, toilets, garbage bins, people's
perceptions about these, and how/why women are
affected. Focus group discussions (FGDs) were
also organised with women to develop a deeper
understanding on the issue and complement the
RSA. Mobilised and empowered by Jagori's
intervention the children of Bawana air a
community radio show on the issues of health and
sanitation which is broadcast on All India Radio.
The entire show is conceptualised by the children
who go door to door in the colony asking people
about the issues that are of concern to them and
then prepare the script.
7.1.2 The Dong System: Traditional Water
Management System of the Bodo Community
in Assam
The Indian subcontinent is rife with examples of
community managed traditional water
conservation and harvesting systems. In an effort
to bring forth one such water management system
from the north-east, the case of the dong system
was documented from Baska district, Assam. It
demonstrates how a community organises itself to
manage a crucial resource such as water by
building on social capital. Applying the logic of the
subsidiary principle of governance, this case brings
to light an intuitive solution for water resource
planning and management by reducing service
delivery intermediaries and improving community
welfare. Community participation being the
essence of its existence, the dong system has also
cemented kinship ties for generations. Various
dong committees, spread across a river, work with
mutual understanding and co-operation to
minimise the conflicts associated with a scarce
resource in a precarious terrain. The system
illustrates how communities, through an acquired
understanding of their environment, devise
methods most suitable for indigenous terrain. The
dong system has been evolving around a changing
socio-economic environment. With the people
demanding concretization of bunds and channels
(hitherto done by the communities themselves
using natural material) to reduce the drudgery of
work, there is a scope for more state intervention.
While strengthening the physical components that
make up a dong, it is imperative to conserve the
ethos of this system which binds the community
together though a social fabric of co-operation and
participation.
7.1.3 Community Managed Drinking Water
and Sanitation Programme: Case Studies
from Odisha
Gram Vikas is a rural development organisation
working with the poor and marginalised
communities in Orissa since 1979. Through its
help, the communities have not only been able to
construct their own toilet and bathroom complexes
but also ensure 24x7 water supply. The experience
illustrates the willingness of communities to bring
fundamental changes for rural welfare as well as
act as agents of change. A major achievement of
this intervention has been the paradigm shift in the
attitude of the rural people towards health and
sanitation. In both the study villages–Bahalpur and
Kanamana in Ganjam district–the people noted
that the children are now at the forefront of creating
awareness about environment and health.
Integrating the WATSAN scheme with livelihood
generation activities has furthered the cause of
rural development. The intervention includes many
innovative threads which contribute to its success.
Constructing toilets without a water supply in the
Indian scenario severely compromises the
functionality of the system and leads to enhanced
burden of water collection on women. Gram Vikas
was able to address many problems
simultaneously by providing three taps for different
water uses. The organisation maintains 100 per
cent community participation as a pre-requisite for
initiation of the WATSAN scheme. The 'all or none'
principle of community participation may make the
task difficult but it is by setting such standards that
true empowerment is achieved. Gram Vikas has
been instrumental in mobilising the people, but it
also ensures the sustainability of the system after it
moves out.
7.2 Large-Scale Initiatives
7.2.1 Community-based Tank Management
Programme in Andhra Pradesh
Tank restoration and management issues in
Andhra Pradesh gained attention with the
introduction of the Andhra Pradesh Farmers
Management of Irrigations Systems Act (APFMIS),
1997, under which Water User Associations
(WUAs) were formed for surface irrigation systems
with command area of over 100 acres. Desiltation
of the tanks has been taken up as a major activity
under the programme. Even before government
intervention some local NGOs had mobilised
villagers and initiated tank restoration activities.
Modern Architects of Rural India (MARI), an NGO
operational in Warangal district in Andhra Pradesh,
has been part of these initiatives, which the authors
have visited. Ramachadrapuram, a village in
Warangal district, was studied to observe the
impact of restoring traditional water harvesting
/conservation/ management in the present
66

9.3 Page 83

▲back to top


situation. Prior to this work, water did not stay in the
tank thus making it difficult for farmers to cultivate
crops like paddy. The construction of weirs,
cemented canals and distribution channels
undertaken in this project has resulted in a number
of changes:
Ÿ More than 20 washermen families have
benefitted due to better availability of water
throughout the year.
Ÿ Due to the repair of the tanks and improved
roads (improving access to tanks) the condition
has improved. As against the Rs 1,500-2,000
per person benefit earlier, per head income in
the first year of tank rehabilitation has been
about Rs 4,500 per person.
Ÿ The groundwater table has gone up, and
livestock raising has improved.
Ÿ In 2011, 30 tanks from various project sites were
selected and farmers trained on various
aspects of agri-business.
Ÿ The government aims to train the farmers on
organic farming selecting five farmers from
each tank. So far, about 150 vermicomposting
beds have been constructed covering about 25-
30 villages. Kisan melas are organised under
each tank to provide a platform for government
officials and farmers to interact on issues of
concern.
Ÿ The tank rehabilitation project in
Ramachadrapuram has selectively excluded
women despite their demonstrated ability to
take up management initiatives.
7.2.2 WASMO's Decentralised Demand
Driven Water Supply Model
There has been a widespread thrust on
decentralised water management interventions
across the country. Building on the subsidiary
principle, efforts have been made to bring
communities to the forefront of management of
their own resources, like water. Water and
Sanitation Management Organisation (WASMO)
was established in 2001 in Gujarat with an aim to
achieve a paradigm shift in the role of the state as a
service provider to a facilitator for community action
in self-governance. At present, it works on demand
driven, community managed drinking water
systems in rural Gujarat by facilitating rural
communities to set up and manage their own
drinking water sources. The cases of two villages in
Surendrenagar districts of Gujarat reflect the need
to design the water supply schemes according to
the socio-cultural fabric of the region. Based on the
principle of community participation, WASMO has
been able to provide sustainable water access to
these villages and empower the villagers to
manage the scheme themselves by means of Pani
Samitis. The scheme, through its provision of
household tap connections, has also succeeded in
providing equitable access cutting across class
and caste. In both villages to date, people from
lower castes people are not allowed to enter the
village temples and access water from the same
source as those from the upper castes. The
installation of public standposts or digging of bore
wells has been unable to address equity in drinking
water provision as physical access to these on the
ground is determined by the power relations in
society. It was thus imperative in such communities
to provide equitable access to water by means of
household connections, WASMO's biggest
achievement.
7.2.3 Waste water Reuse in Schools of
Madhya Pradesh
Dhar and Jhabua are two districts of Madhya
Pradesh in the central province of India which
suffers recurrent water quantity and quality
problems. Lack of water is a major reason for low
sanitation coverage in schools here. In many
residential schools in Dhar and Jhabua, limited
availability of freshwater has prompted UNICEF, in
collaboration with the National Environmental
Engineering Research Institute (NEERI) and other
governmental and non-governmental partners, to
explore the use of greywater for appropriate
purposes such as flushing of toilets. A holistic water
management is adopted in these ashram schools
by integrating different water usages and
corresponding quality requirements. In the ashram
schools, the water requirement is about 60-70 l per
student per day as against the drinking/cooking
water requirement of 5 l per day. Considering the
consumptive use of 20-30 per cent, greywater
generation is in the range of 23-35 l per student per
day. The greywater treatment plants have been
constructed by providing treatment techniques
such as screening, equalisation, settling, filtration
and aeration. This simple treatment has resulted in
the use of treated greywater in flushing the toilets
which were otherwise unclean and hence not used
by the students (NEERI-UNICEF, 2007).
7.2.4 Andhra Pradesh Groundwater Bore Well
Irrigation Schemes Project (APWELL)
The project was implemented from 1995 to assist
small and marginal farmers in increasing their
agricultural production through the provision of
groundwater irrigation facilities. The groundwater
irrigation facilities provided by the project brought in
an additional 35,000 acres under irrigation thereby
uplifting about 14,000 small and marginal farming
families, in seven drought-prone districts of Andhra
Pradesh. However, the project faced the
challenges of depletion of groundwater resources
67

9.4 Page 84

▲back to top


that made them think about environmentally sound
interventions than looking only for economic
upliftment of the people. APWELL transformed into
the Andhra Pradesh Farmers Managed
Groundwater Systems (APFMGS) Project in 2003
with support from the Food and Agricultural
Organisation (FAO). APFMGS called for a reversal
of the present trend of over-exploited aquifers. It
backed the traditional methods of water
management with a new approach to governance –
participatory rather than top-down – in empowering
people to develop their own water resources. The
project focused on strengthening local institutions
at the habitation and hydrologic unit level to bring to
centre stage discussions on emerging the water
crisis, especially on groundwater. It offered the
means to increase their knowledge about the
status of their groundwater resources by giving
them the equipment and skills to collect and
analyse rainfall and groundwater data. The project
also facilitates access to information about water
saving techniques, improving agricultural practices
and ways to regulate and manage their own
demand for water. With its innovative approach, the
APFMGS project provides some alternatives for
groundwater management in India.62
7.2.5 Tamil Nadu Water Supplies and
Drainage Board (TWAD) Experience
In the year 2004, a programme was launched by
the Tamil Nadu Rural Water Supply and Sanitation
Programme (TNRWSSP) to bring in institutional
reforms in access to water. The Tamil Nadu Water
Supplies and Drainage Board (TWAD) was created
to supply water to the whole of Tamil Nadu state,
barring Chennai city. The reform was triggered by
the reality of a growing water crisis and the growing
realisation that old technocratic investment
focused bureaucratic solutions was not sufficient to
deal with the crisis. Another contributory factor was
the perception that water engineers were no longer
seen as the sole providers of water, rather they
were to play a role of being 'social engineers' and
'facilitators' of community participation. In order to
meet these challenges, TWAD launched an
ambitious process covering the entire state-wide
department in an exercise to bring about personal
change and institutional transformation. During the
first two years, almost the entire population of rural
water engineers, numbering over 540 and covering
all levels, underwent personal, group and collective
exploration. The idea was to work at three levels:
attitudinal transformation, perspective change and
institutional change. The outcomes were
encouraging. There was a much stronger thrust on
reaching marginalised sections and a shift from
service providers to partners. After the creation of
the TWAD board, a large number of areas were
reached through the increased partnership
between community and engineers of the TWAD
board. Further, the issue surrounding sustainability
of water was addressed, which has helped the
people in getting longer term access to water
(Suresh, 2007).
7.3 Sustainable Water Management Initiative
by Industry
Bajaj Auto Limited, Aurangabad, is at the forefront
of conserving water in its industrial processes,
through the three principles of reduce, reuse and
recycle. This work won the company the CII-GBC
National Award (Within the Fence Category) for
Excellence in Water Management in 2008. The
company modified its water conservation approach
by adding the 3Rs of reduce, reuse and recycle to
the earlier approach of conserve, preserve and
reserve. It followed the approach of using some
innovative projects to achieve its goal. It used
automation of localised water storage systems
wherein about 140 cu m of water per year was
saved by providing a Programmable Logic
Controllers (PLC) controlled auto system.
Eliminating water wastage by providing a timer for
water supply, the company made water available
only during lunch, breakfast and dinner in the hand
washing area thereby saving some 730 cu m per
year. It has constructed rainwater ponds of 7,000
cu m for horticulture purposes thus saving 45,000
cu m water per year. By changing the sludge pit
cleaning frequency from quarterly to yearly, the
company saved 600 cu m water per year. Further,
the installation of a spot cooling system replaced
the old system thus saving 1,500 cu m water per
year. An installation of the drip irrigation system
also saved 150 cu m water per day (CII, 2011).
7.4 Summing up
This chapter documents two kinds of water
conservation and management initiatives—small-
scale community-based water management and
large-scale state-initiated and managed innovative
water management systems. Jagori's initiative in
Delhi's resettlement colony, the dong System in
Assam, and Gram Vikas's efforts in Odisha present
the community-based water management
initiatives. Jagori's initiative in Delhi's resettlement
colony Bawana shows us how advocacy efforts
and an empowerment approach for community
development enables the community in raising its
collective voice for better service delivery. Even
though, in a short term, the services may not
improve, the approach has a long-term effect in
62Bharati Integrated Rural Development Society, 2011. Available at: http://9848.org/birdsorg.net/index.html (accessed on 27 April 2011).
68

9.5 Page 85

▲back to top


strengthening the community to voice their opinion
and make the service provider responsible. The
young children's effort in community radio
broacdcasting has also brought in a level of
confidence in young girls and boys to the extent
that they are now conceptualising the programme
and roping in the service provider to help their
community be served better by the local
authorities. The dong system of Baska district in
Assam demonstrates how a community organises
itself to manage a crucial resource such as water by
building on social capital. Applying the logic of the
subsidiary principle of governance, this case offers
an intuitive solution for water resource planning
and management by reducing service delivery
intermediaries and improving community welfare.
The case of Gram Vikas from Odisha shows how
empowered, communities have not only been able
to construct their own toilets and bathroom
complexes, but also ensure 24x7 water supply. The
experience illustrates the willingness of
communities to bring about fundamental changes
for rural welfare as well as act as agents of change.
Apart from the community-based initiatives, the
large-scale efforts of the government – such as the
community-based tank management programme
and APWELL projects in Andhra Pradesh, the
institutional reform programmes in TWAD and
WASMO, the waste water recycle and reuse
programme in Madhya Pradesh led by UNICEF
and the government of Madhya Pradesh—are
prime examples of best practices in water
management, use and service delivery. The revival
of tanks has brought in multiple benefits to the
farmers and fishermen in rural Andhra Pradesh.
The APWELL programme, which focused on
groundwater irrigation, backed the traditional
methods of water management with a new
approach to governance – participatory rather than
top-down thus empowering people to develop their
own water resources. The waste water reuse
project of UNICEF in two districts of Madhya
Pradesh has explored the use of greywater for
appropriate purposes such as flushing of toilets.
The institutional reform programmes in terms of
creation of WASMO and the TWAD board has lead
to new meaning and greater service delivery for
water supply in Gujarat and Tamil Nadu
respectively.
The efforts by the company Bajaj Auto, for
restoring, recycling and reusing water in
Aurangabad in Maharashtra, is another example of
good practices by a corporate house. All these are
examples of how concerted efforts help improve
the service delivery of water or the conservation of
a precious resource. What is required is a strong
political will to implement a programme with the
right objective and resources.
References
Confederation of Indian Industries (CII). 2011. 'Water
Conservation in Industry: A Case Study of Bajaj Auto -
Aurangabad'. Available at:
http://www.indiawaterportal.org/sites/indiawaterportal.o
rg/files/CII_Excellence_in_Water_Management_2008_
Bajaj_Auto_Limited.pdf. [Accessed on: 7 November
2011].
Indian Academy for Organization Development –
Sumedhas, 23–24 February 2007, Chennai. Available at:
http://sumedhas.org/new3cont/Democratisation%
20of%20Water%20Management.pdf [Accessed on 27
December 2011].
National Environmental Engineering Research Institute
(NEERI)-UNICEF. 2007. 'Greywater Reuse in Rural
Schools: Guidance Manual'. Available at:
http://www.neeri.res.in /pdf/greywater.pdf. [Accessed
on: 10 November 2011].
Suresh V. 2007. 'Democratisation of Water
Management: Institutional Transformation leading to a
Paradigm Shift- The TWAD Experience', Paper
presented at conference on Organization Development
by Design.
69

9.6 Page 86

▲back to top


9.7 Page 87

▲back to top


8.1 Pressures and Drivers of Change
The growing water scarcity and lack of access to
water for millions of India's poor leads to the the
following question: What are the pressures and
drivers of change? Five such pressures and drivers
are identified – (a) demographic and socio-
economic changes; (b) technological development
in agriculture; (c) industrialisation without much
regulation; (d) climate variability; and (e)
governance deficit. Each of these points is
elaborated ahead and also presented
schematically in Figure 8.1.
Figure 8.1: The Drivers of Change in Water
Availability in India
Demographic
and socio-economic
processes
Governance deficit
The pressures and
drivers of change in
water availability in
India
Industrialisation
without regulation
Climate variability
Industrialisation
without regulation
Source: Drawn up from the Multi-Stakeholders' Consultation
Workshops in five regions, November 2011
8.1.1 Demographic and Socio-economic
Drivers
The demographic pressure on land and water has
increased the demand on water vis-à-vis its
availability. Cities are growing and lifestyles
changing, and this puts additional pressure on
water resource availability. This coupled with
income disparity between the rising upper-middle
and middle class and the urban poor in urban
locations results in differential water access and
ownership. While the increased middle and upper
classes in cities are able to buy water for their
continued (read 24X7) water supply, the poor who
live in slum locations, or rural inhabitants, suffer
from both quality and quantity of water supply. In
most urban cities, slum locations are poorly served.
In many cities, increasingly most people fetch
water from peri-urban locations through tankers,
which have become the order of the day. Further,
cities are now producing huge amounts of waste
water which flows (in most cases) directly into the
water bodies and further pollutes the available
freshwater. One of the reasons for this is because
none of the cities in India have a full-fledged system
that treats all the waste that is generated. In the
rural areas, the continued and systematic
destruction of the ecosystem has led to land use
changes, including water harvesting structures and
forest cover decline. Further, the cropping pattern
changes have led to water intensive agriculture in
many locations. There are many drivers to these
shifts in agriculture, including incentive and subsidy
mechanisms such as free power, minimum support
price, fertiliser subsidy, pesticide subsidy, etc. All
these have a compounding effect on water supply.
Many rural areas in India suffer from water quality
and quantity deficit, leading to shortage in water
supply, both for drinking and irrigation.
63This section is based on the five consultation workshops organised to cover the length and breadth of the country in 2011. A total of 159
water professionals representing government offices and civil society attended these workshops. This section represents the outcomes
of the group discussions held during the workshops.
71

9.8 Page 88

▲back to top


8.1.2 Technological Drivers
Agriculture and groundwater, two unique changes
in technology, have increased the pressure on
existing water resources. Changes in agriculture
technology include invention of water intensive
cash crops in the overall framework of the Green
Revolution. This has increased the demand for
water which surface water projects have been
unable to fulfil. An increased demand for water in
agriculture has led to groundwater extraction.
Consequently, the groundwater extraction
technology, combined with lack of a mechanism to
control groundwater access, has led to a secular
decline in groundwater bodies in many locations in
India. Further, it has led to an absolute problem in
sub-surface water flow which had earlier supported
drinking water wells for centuries. The geo-physical
characteristics of resources such as arsenic, iron
and fluoride contaminations have also limited water
resource availability and use.
8.1.3 Industrialisation and Water Use
India is urbanising at a rapid pace. Apart from the
contribution of industries to the economy,
unregulated industrial expansion is also adding to
water pollution and scarcity. Many industries need
water and natural resources to operate. Most of the
time, their water needs are met with groundwater
extraction. Industries also discharge waste, the
nature of which depends on the type of industry.
Untreated or improperly treated waste becomes
pollution, increasing not only private costs but also
social costs. Industries are hardly regulated on
environmental management even though India has
some of the most stringent laws against pollution.
The environmental degradation caused by
industries often tends to become irreversible and
imposes damaging social costs. Industries are
some of the biggest polluters in India and the
ecological and social costs of such unrestrained
pollution and degradation have put a big question
mark on the perceived notion of industrialisation in
India. It has been reported that many areas or
ecosystems are more susceptible to adverse
environmental impact than others; unplanned and
haphazard industrialisation has substantially
increased the risk to the availability of water
through pollution of water bodies. This has resulted
in the diminishing of aquifers near riverbeds and
the worsening of water quality. To control water
extraction and pollution by industries, regulations
and monitoring should be more strict, dynamic and
transparent. The focus should be more on the big
polluters and huge extractors.
8.1.4 Climate Variability
The climate change process has been identified as
one of the components of the drivers of change. It
has been reported that micro-climate change is
increasingly being recognised as a driver of the
changing water scenario in many locations of the
country. Climate variability combines with the
present mismanagement of water and creates
problems, which remain largely unreported. In
many areas, localised droughts are changing the
way water was traditionally managed. Perceptions
are pointing towards an increasing flood situation in
the eastern and north-eastern states, a result of the
climate change process. Though the contours of
climate variability are yet to be understood, this has
been a point for discussion that is leading to water
scarcity and its increased understanding will help in
managing water better.
8.1.5 Governance Deficit
India has an enormous governance deficit when
dealing with changing water scenarios. The
pressures and drivers that stem from demographic,
socio-economic, industrialisation and urbanisation
processes could have been better dealt with, if
there as a sharp vision for governance of water.
Governance of water is divided between the central
and state authorities, with categorisation of rules
and responsibilities, yet it is seen that the overall
sustainable vision for water development,
conservation and management remains missing.
There are a couple of issues that need to be
highlighted here. First, there is a dire need for
convergence of laws and legislations; there exist
too many laws and this in turn dilutes the water
issue. The coordination and synchronisation
between departments/implementers and
regulators is fragmented leading to each
department doing things without much
coordination with other departments, and
sometime at cross purposes. The regulatory
bodies have not been strict in controlling, for
example, appropriation of water bodies, industrial
pollution, etc. Second, there is lack of data
disaggregation and aggregation in important
decision making by the body involved in water
planning. Data is generated by different bodies and
is sometimes contradictory in nature. Overall, there
is a weak political will in finding sustainable
solutions to water problems and this in turn leads to
governance deficit in water. Table 8.1 presents
some of the pressures and drivers, and their effects
and probable solutions.
8.2 Stakeholders' Involvement
Stakeholders' involvement has become a
buzzword in the social development sector. It
envisages the partnership of all actors in the water
sector—state, community, market and civil society.
The term 'partnership' is coined to draw on the
72

9.9 Page 89

▲back to top


Table 8.1: Pressures and Drivers for Water Availability, Effects and Probable Solutions
Pressures and Drivers
Demographic and socio-
economic pressure, Socio-
economic stratification and
inequities resulting in differential
land and water ownership
Effects
Ÿ Increasing demand vis-à-vis
availability, equity gets further
compromised.
Ÿ Increased sewage and waste
generated from urban
areas.Inequity in water
supply—the rich get more
water, the poor less or no
water.
Effects
Ÿ Prioritise local water use for
drinking water and sanitation
use and serve the un-served
on priority.
Ÿ Equitable development.
Ÿ Monitoring water use by
different categories of
consumers and data
disaggregation by classes of
users of water is important.
Ÿ Making minimum basic lifeline
water as a human right.
Ÿ Consumption analysis and
water pricing for high end
users.
Agrarian change and water
intensive agriculture
More water needed for bringing
more area under irrigation.
Ÿ Benchmarking of irrigation
projects considering social and
technical projects.
Ÿ Water efficiency in agriculture.
Agriculture and power subsidy
for irrigation
Groundwater access
Waste and benefits for those
who own land and water.
Ensure that those who are poor
are not denied water access in
the name of increasing efficiency
of water use.
Ÿ Groundwater over-developed
in many locations.
Ÿ Water quality is seriously
affecting human health due to
increased groundwater use.
Ÿ Over-exploitation exacerbating
geogenic contamination.
Ÿ Differential access to
groundwater in agriculture and
for drinking.
Ÿ Groundwater laws to be
implemented in letter and spirit.
Ÿ Groundwater regulation and
stringent laws to check over-
exploitation in urban areas.
Ÿ Disaggregated approach in
managing groundwater
Ÿ Recognise aquifers as
common pool resource
Ÿ Robust legislation needed that
facilitates CPRs and protects
resources
73

9.10 Page 90

▲back to top


Industry and urbanisation
Ÿ Increased demand for industry
and urban areas.
Ÿ Urban water supply-highly
inefficient in distributing water.
Ÿ Aquifers getting diminished
near riverbeds.
Ÿ Worsening water quality.
Ÿ Increased industrial pollution
and waste water generation.
Ÿ Water audit in industry and
urban areas.
Ÿ Aiming for zero water balance
for industry sector.
Ÿ Water quality monitoring-third
party monitoring.
Ÿ Social and technical audits of
water supply.
Ÿ· Cities to have water audit and
become self-sufficient; need for
supply and demand side
measures to be strengthened.
Ÿ Water saved as water created-
conserve water through
proactive laws in urban
locations.
Spatial distribution of
precipitation
Increased variability.
Environment conservation efforts.
Climatic changes owing to
depleting glaciers
Reduced or sudden increase in
water flow thus affecting access
and availability.
Ÿ Proper assessment of climate
change impacts.
Ÿ District level planning for
climate risk reduction.
Ÿ Climate change hotspot areas
to be designated and treated in
a special way to include
climate change impacts.
Governance deficit in dealing with
water
Inequity in water supply and
differential access for major
stakeholders.
Ÿ Convergence of laws and
legislations.
Ÿ Coordination and
synchronisation between
departments/ implementers
and regulators.
Ÿ Regulations and monitoring
should be strict, dynamic and
transparent. Focus should be
more on the big polluters and
huge extractors.
Ÿ Cumulative impact
assessment.
Ÿ Awareness and capacity
building.
Ÿ Political will generation.
Ÿ Central database, regular
updated and public domain.
Source: Drawn up from the Multi-Stakeholders' Consultation Workshops in five regions, November 2011
74

10 Pages 91-100

▲back to top


10.1 Page 91

▲back to top


expertise of various stakeholders' for successful
implementation of a project or programme. Critics
believe that the impetus for a new rhetoric of
partnership has arisen in the wake of free market
liberal democracy's victory over state socialism and
the command economy of the Soviet experiment in
the late 1980s (UNESCO 2005). This section does
not dwell on the origin and definitional issues
surrounding this debate despite acknowledging the
diverse opinions on the same. Instead, it
recognises that each stakeholder can strengthen
water management 'able' and 'allowed to'
participate in the process right from
conceptualisation to actual implementation and
maintenance of water projects. In doing so, if the
state maintains certain safeguards, it would help in
strengthening the participation of sections who
historically did not participate in this process.
Ahead we discuss the role of the major
stakeholders.
8.2.1 Role of the State
The role of the state is recognised in formulating
people-centred policies, ensuring parity, bringing in
regulations, sharing of information, ensuring
accountability for all stakeholders' and inter-
sectoral coordination. The state is largely seen by
many as biased in favour of the rich classes and to
the industries. The current levels of service
provision in many locations do not meet the
minimum rights, and the monitoring of water supply
is done in terms of coverage and not end use. This
leads to inequitable water supply where the
voiceless remain deprived. Water deprivation thus
perpetuates poverty. There is a need to address
government/political/ administrative structures that
deliver facilities on the ground. Increased
involvement is also needed in organisations like the
water resource authorities that deal with water.
Further, there is a dire need for convergence of
different departments dealing with water. At the
moment, there is a serious lack of inter-
departmental coordination thereby leading to
conflict of interest among departments. GOI is
making efforts for convergence with other
stakeholders/departments dealing with water but
significant challenges remain. GOI's efforts are still
on for following participatory approach among the
stakeholders/ various departments at local,
regional and national levels. Despite efforts at
national level, convergence remains elusive. The
state should encourage new innovation and
research that will help planners make important
decisions on the ground. For example, basin-wide
studies are needed, including water budgeting and
village water development plans that converge at
the district, state and regional levels for better water
management. The state could also work on
devolution of power to panchayats so that water-
related decisions are decentralised, while also
building the required capacity necessary to operate
and maintain the systems.
8.2.2 Role of the Market
The market is seen mostly as a profit-making entity
that diverts water for those who can pay more (for
example, industry) and for urban consumption. A
good privatised model that combines the efficiency
and equity principle for water supply is lacking in
India. Therefore, there is an apprehension about
the motives of the private sector in water supply
and management, especially with regard to
drinking water. Under a tight and well defined
regulatory body, the market can play a role in water
treatment, recycling, distribution and management,
especially for water supply in urban locations. The
private sector can also invest in research and
development of appropriate technology for today's
water problems. Another area where market can
play a decisive role is water for industrial use.
Under the differential pricing system based on the
nature of industry and the state, the engagement of
the private sector can be explored for commercial
use with sustainability of the resource as core.
8.2.3 Role of the Community
It is a well recognised fact that there is no such
entity as 'the community'. Communities are divided
on the basis of class, caste, gender and age. In
many parts of India, water access is defined by
one's class and caste position in the community
and discrimination around water access and
control has been reported from many locations. In
this light, the role of community in providing access
to water for drinking and irrigation becomes very
important. However, wherever a community is
more coherent (for example, in tribal areas and
north-eastern India), they can organise themselves
to assert customary rights for water management.
Also, if the community can demonstrate self-
regulation for water management (for example,
Ralegaon Siddhi and Hiwre Bazar in Maharashtra),
it would support people-centred, people-regulated
and people-managed water policies. In the wake of
corporatisation of water, especially in peri-urban
locations, communities have a much stronger role
to play in protecting their water bodies from
indiscriminate pollution and diversion of water
resources for individual profit-making processes.
The community also has to value and get involved
in ownership and management (O&M) of water
sources and stop open defecation through
behavioural change. However, this involves not
only awareness and social mobilisation, but also
responsibility and maturity to look after the precious
water resource for the next generations.
8.2.4 Role of Civil Society
Civil society is an umbrella term which represents
all non-governmental voices. This report brings in
75

10.2 Page 92

▲back to top


non-governmental organisations (NGOs), media,
academicians, and researchers within the ambit of
civil society. The role of civil society is varied and is
looked at from the viewpoint of providing support,
building momentum and supporting movements for
democratisation of water resources in the country
through research, advocacy, and generation of
political will, capacity building and supporting
ground swell for demanding water rights in favour
of those denied the same. The strategies for
achieving each one of the above would be different
for each member of civil society based on the main
objective of their formulation. However, civil society
has the strength to direct positive water policies in
favour of the poor and marginalised especially
where their rights are denied due to the various
nexus that exist around water today. Table 8.2
outlines the roles of each of these actors, as also
their responsibilities.
Table 8.2: The Stakeholders and their Roles and Responsibilities
Stakeholder
Stakeholder
The state (including local governments,
regional authorities, federal and central
agencies) as implementers
Ÿ The state, in partnership with civil society organisations, to raise
awareness and build capacity of the community.
Ÿ Creation and enforcement of strong legislations against
polluters and violators of norms.
Ÿ Bring in provisions of strong partnership with communities,
including devolution of power and authority pertaining to water.
Ÿ In partnership with community and civil society organisations,
determine needs and gaps.
Ÿ The state creates space for the market to function through
deprivation and degradation of water systems.
Ÿ Water metering to be introduced and high end water users
should be charged pro-rata basis (telescopic tariff system).
Ÿ Groundwater access and control needs to be regulated
especially where over-exploitation is reported.
Ÿ Reclaim degenerated water bodies and rejuvenate watersheds
for conservation of water.
Ÿ Support research and think tanks that can support innovative
implementation, policy and regulation.
Ÿ Governance and accountability of officials in water supply,
checking pollution, etc.
Policy makers as initiators of proactive
provisions to protect water rights
Ÿ Recognition of water as a basic human rights and work towards
the framework in which the same can be implemented in letter
and in spirit.
Ÿ Create provisions for ensuring minimum and equitable access to
water for all with an entitlement approach where minimum water
is assured by the state.
Ÿ Work on a framework for better coordination between different
departments dealing with water.
Market
Ÿ Sporadic water supply vs. 24X7 water supply, which paves the
way for creation of formal water markets. This issue needs
further examination.
Ÿ The market can take up the service provider's job under strict
regulation by the state.
Ÿ Use of green and efficient technologies that save water and
ensure water conservation
76

10.3 Page 93

▲back to top


Market
Communities
Water experts and researchers
Ÿ Understand the relationship between investments in water and
its control by a private entity.
Ÿ The market should not be allowed to determine access and
control of water resources.
Ÿ Bottled water industry and private water suppliers need to be
regulated.
Ÿ Water should be addressed by the community and the service
sector (public sector) only, and the market should act in a service
mode.
Ÿ Should assert their rights over natural resources.
Ÿ Should ensure that the available water is distributed without any
bias and to the communities who traditionally do not have
access under the norms of positive discrimination.
Ÿ Should recognise that societies are differentiated by class,
caste, gender and age, and so participation from all sections of
society is necessary for democratic decision making around
water.
Ÿ Should ensure inclusiveness and rights to all.
Ÿ In partnership with the state, community and civil society,
organisations should maintain and compile databases on water-
related issues to support policy making and measure equity and
access.
Ÿ Help government in working for basin-level approaches for
planning and management of water with strong in-built
decentralisation agenda.
Civil society (including NGOs, media,
and people's movements)
Ÿ Build momentum to ensure water is viewed as a basic human
right.
Ÿ Can do proper documentation of best practices.
Ÿ Need to question development, facilitation, inclusive
implementation.
Ÿ Understanding inter-relationships, for example, between
natural resources, water, education, etc.
Ÿ Dealing with corruption, and advocating for good governance.
Ÿ Building capacity of local communities, help creating political
will and helping articulate the demands and interests from
different social groups, especially discriminated groups for
asserting their right over water.
Source: Drawn up from the Multi-Stakeholders' Consultation Workshops in five regions, November 2011
77

10.4 Page 94

▲back to top


8.3 Summing up
This chapter dwells on two specific issues. First,
the pressures and drivers of change in the water
access scenario. Second, the role each major
stakeholder plays in changing the current situation.
More specifically, the role of the state, market,
community and civil society has been discussed in
detail. The process of change in water
management in India has been fivefold. First, there
has been a considerable shift in demography which
has created considerable pressure on land and
water. This is coupled with income disparity, which
has made some groups more powerful than others.
However, the issue of distribution and
management is more prominent than the shift in
demography. This leads to an important question of
protecting the ecosystem. Evidence suggests that
water bodies are being polluted both by domestic
as well as industrial users, without much regulation
and management. The withdrawal of water for
agriculture in a given area is related to shifts in
demography as well as in the way the ecosystem is
managed. This leads to the second point of
technological changes in agriculture. The
increased use of water intensive crops and access
to groundwater in many locations has created an
extra demand on resources. In many locations, due
to overdraft of water, symptoms of arsenic, iron and
fluoride have been reported. Third, the increasing,
unplanned, and largely unregulated
industrialisation in many locations has been
causing environmental hazards due to release of
industrial waste in water bodies. The fourth issue is
of climate variability. Changes in micro-climate
coupled with mismanagement of water are creating
problems for the livelihoods of millions of people
who are directly dependent on agriculture. There is
less evidence but increased perception about this
which needs to be looked into. The fifth issue that
encompasses all borders on the governance deficit
in dealing with the present situation. There is a
feeling that most of these issues can be tackled
with a sharp and forward-looking vision of
governance of water. First, there is a dire need of
convergence of laws and legislations and
synchronisation between various departments
dealing with water. Water has to be looked at from a
more holistic and integrated perspective. Second,
the data generation process in the country is
pointing towards its integration, disaggregation and
consolidation at an aggregate level for policy
makers to be informed about the change processes
and find sustainable solutions.
What are the roles of the different stakeholders in
the changing present scenario? The prime role of
the state is to formulate people-centric policies thus
ensuring parity. Also, to bring in strong directives for
those violate the existing laws and regulations. The
market is seen by many as a profit-making entity
that may compromise on the issue of equity and
sustainability. Under strong state regulations,
markets do play a positive role in water service
delivery, research and development, and also
water-related technological solutions. There is no
single entity known as 'the community'. The
community is divided by socio-economic class,
caste, tribe, age, gender, etc. Models exist for the
community's self-regulation, which needs to be
seen in an overall framework of people-centred
development with more political and financial
powers for the community to implement water-
related projects. The role of civil society becomes
important here as it helps community capacity
building thus enabling community members to
manage resources in a decentralised resource
management framework. Their role in having a
close watch on the water management process is
also important for equitable water distribution and
sustainable management of the resource.
References
UNESCO.(2005. 'Partnerships in Development Practice:
Evidence from Multi-stakeholder ICT4D Partnership
Practice in Africa',. UNESCO Publications for the World
Summit on the Information Society. United Nations
Educational, Scientific and Cultural Organization,
France. Available at:
http://unesdoc.unesco.org/images/0014/001429/14298
2e.pdf [Accessed on 5 October 2011].
78

10.5 Page 95

▲back to top


9.1 Sectoral Gaps and Re-visioning the
Present Framework of Implementation
9.1.1 Key Sectoral Gaps
This section looks at the key gaps in
implementation for three sectors—domestic,
irrigation and industry. Each of these sectors has its
own need for water and is inefficient in delivering
water for all across all sector and as per the basic
requirements. The key gaps as identified for
domestic use are many. India has already achieved
the Millennium Development Goal on drinking
water supply in rural areas. Further, a Strategic
Plan for the rural drinking water and sanitation
sectors has been prepared for 2011-22 with , inter-
alia , the goal of providing 90 % of rural households
with 55 lpcd within or near their premises. However,
despite this progress, water safety and security
remains a key challenge. Community involvement
in a structured process is essential to achieve this,
right from the planning to implementation level (for
example Biswas, 2012). However, the problem is
twofold; on one side, the authorities lack planning,
and the community, too, is not prepared in getting
involved in water supply projects. Wherever the
gaps from both ends have been met, the water
supply projects have been successful. Other
related issues are gaps in technical capacity at the
level of the resource, delivery, distribution and
O&M, lack of information about the policies and
plans, and political interference.
For irrigation systems, the key gap is in choosing
the variety of crop based on the water availability.
Cropping pattern changes that are independent of
water availability is leading to heavy reliance on
groundwater and its indiscriminate exploitation.
Water bodies and river systems are not protected
and are hence leading to decline in local water
availability and pollution due to industries in many
locations. There are policies in place to protect
water resources and the ecosystems but there is
lack of political will to implement the policies in letter
and spirit. Apart from the political will, the social and
economic constraints are one of the major block in
policy-divergent actions. Further, the focus of
agricultural innovation is more on rice and wheat
while dry land agriculture has been neglected.
Water use in agriculture is directly related to choice
of crops and therefore this area needs special
attention. The industrial sector has its own water
requirement but the price of water supplied to
industries does not reflect the environmental value
of conserving water. This is same in agriculture and
domestic sector. Also, there is lack of
implementation of pollution laws which leads to
Table 9.1: Key Sectoral Gaps
Water for domestic use
Water for irrigation
Water for industry
Ÿ Lack of community preparation
and involvement in water supply
projects.
Ÿ Farmers do not follow cropping
practices based on water
availability; heavy reliance on
groundwater for irrigation.
Ÿ Water for industry should be
priced and should reflect the
environmental value of
conserving water.
64This section relies heavily on the framework developed by Prof Amita Shah, Director, Gujarat Institute of Development Studies and
presented as keynote address to the participants of the fifth Multi-Stakeholders' Consultation Workshop for Western Indian Region on 30
September 2011 at Ahmedabad, India. However, the texts in this section are compiled from the discussions that ensued in the five multi-
stakeholders consultation workshops in five regions of India in 2011. The details of the workshop participants are given in Annexure 1.
79

10.6 Page 96

▲back to top


Ÿ Community institutions lacking
capacity to take initiatives at various
levels.
Ÿ Lack of awareness on various
aspects of programmes and policies
among line functionaries and
people.
Ÿ Lack of planning from authorities.
Ÿ Maintenance of water infrastructure
is a serious problem—panchayats
do not have a comprehensive plan to
maintain assets; no proper handover
to GP (no technical support, no
convergence among departments to
give post-project support), lack of
finance to support maintenance
leading to lack of ownership by
community institutions though
recently a Management Devolution
Index has been devised by MDWS to
map this process.
Ÿ Gap in technical capacity to deal with
changing technology and
knowledge.
Ÿ Political interference in prioritisation
and resource allocation.
Ÿ Drinking water source does not
always follow the source
sustainability plan.
Ÿ Lack of proper regulations or
implementation for preventing
indiscriminate exploitation of
groundwater.
Ÿ Productivity per unit of water
consumed is low.
Ÿ Lack of proper protection for
river ecosystems (sand mining
and mineral exploration is a
biggest threat to river
ecosystems) –despite several
conservation laws, the
destruction is rampant
Ÿ Encroachment of water
courses and bodies leading to
less water flow.
Ÿ Lack of political will and human
resources to implement
policies.
Ÿ Gap between potential and
actual area irrigated by
irrigation schemes.
Ÿ Too much reliance on rice and
wheat production system with
less emphasis on dry land
agriculture.
Ÿ Effluents should be
discharged only after
meeting EPA
standards.
Ÿ Recycling and reuse
must be made
mandatory.
Ÿ Stringent laws against
polluting industries.
Ÿ State's priority for
allocating resources
–industry gets priority
over drinking water.
Source: Compiled from five multi-stakeholders consultation workshops held in 2011
industries polluting water in an unchecked fashion.
Table 9.1 summarises the key sectoral gaps.
The issues raised in table 9.2 are being addressed
by the Ministry of Water Resources under "National
Water Mission" through setting up Advisory
Committee and Sub Committees under the
Chairmanship of Minister/ Secretary of Water
Resources as well as by incorporation of
appropriate changes in guidelines of
NRDWP/TSC, Ministry of Drinking Water and
Sanitation for Drinking Water and Sanitation
Sector. Taking this further, Table 9.2 identifies
further gaps at three levels: upstream, which deals
with policy gaps (which deals with water policy);
midstream, which deals with ground-level
implementation; and, downstream, which looks
into the issues from a grass-roots perspective. The
table further identifies who should these key gaps
be addressed to—government, community or
institutions. One of the major gaps identified is
between the policy and its implementation, with
different bodies addressing irrigation, tank
systems, watershed development, pollution, etc.
This calls for an innovative institutional framework,
like the Water Users Associations (WUAs), being
federated into organisations at the micro-
watershed, watershed, sub-basin and river basin
levels. These multi-level institutions emanating
from below may be helpful in taking the issue of
Table 9.2: Key Gaps at Government, Community and Institutional Level in Implementation of 'Water for All'
Levels of gap
Upstream (Policy)
Government
Multiple ministries
(convergence required).
Administrative
constraints/transfers.
Political interference
Community
Demand driven
government policies.
Participation/
representation of
community in policy
framing.
Institutions
Water as common pool
resource.
Multiple demand of water
resource.
80

10.7 Page 97

▲back to top


Midstream
(Implementation)
Disconnect between
policy and
implementation; better
feedback loop and data
consolidation for checking
on implementation.
Slow progress due to civil
strife.
Capacity building and skill
development of youths.
Linkage of communities
with implementers.
Conjunctive use of water.
Selection of NGOs /
CBOs.
Downstream
(Grass-root level)
Policy to reflect on local
context.
Limited involvement of
community in planning.
Involvement of indigenous Communication needs to
peoples and marginalised be in their own language.
people.
Awareness generation/
IEC should precede
implementation.
Indigenous practice of
water conservation.
Source: Compiled from five multi-stakeholders consultation workshops held in 2011
equity and sustainability further if appropriate
decision-making powers are given to them.
9.1.2 Right to Water for Basic Needs and
Livelihood
The framework in which water governance is
operational at the moment looks disintegrated. This
report shows that the present framework for
managing water has not yielded its desired policy
outcomes in terms of supplying water to all and
catering to the needs of the poor and marginalised.
Enormous policies on water seem isolated and not
integrated. Responsibilities for service delivery
have been shifting to local bodies—urban local
bodies or ULBs and panchayati raj institutions or
PRIs. However, most of the time, these local bodies
are unable to manage due to paucity of manpower,
and lack of awareness and understanding of
planning a water resource development and
management activity. In most states, institutions
created for water management at the community
level are not accountable and therefore do not have
any legal identity. They also lack capacity in
merging multiple programmes and schemes. The
question therefore is this: What can be done to
change the situation? Would treating water as a
basic human right change the way we look at water
governance? While there is some recognition of
right to water in international human rights, as well
as in the Indian constitution, at the level of state
legislation and policies in India, different
dimensions of right to water do not get much
support. This is true even of cases like
Maharashtra, where a particular version of rights
(for example, entitlement to water) has been put
forward.
in the context of Participatory Irrigation
Management (PIM). The right to water debate has
to tackle many challenges before it is actualised.
For example, in India, surface water is a public
resource while groundwater is in the private
domain, as per the easement act. Delinking water
from land tenure may be the first step towards
looking at water from a much more equitable lens.
Further, redefinition of needs has to become part of
public debate, including how much water should be
given free, how much should be at an affordable
price, and to whom should this subsidy go? There
has to be stronger disincentive for polluting the
water source which accentuates the scarcity
situation while polluting freshwater resources.
Thus, infrastructure for waste water management
needs urgent intervention. The structure and
mechanism for conflict resolution between the
sector and states need urgent attention. Unless
these concerns are met, the right to water, even if it
is guaranteed, will not bring fundamental change in
the way water is conserved, managed and
delivered.
9.1.3 Convergence of Big Water and Small
Water
The big water refers to the dominant system of
science for providing water through centralised or
corporatized utility purpose with large scale
engineering projects such as dams, pipelines,
sewage systems etc. Small water refers to the
everyday methods of water access, conservation
and use. To ensure water security for all, the five
dimension of water –household, economic, urban
and rural supply, healthy river and clean water
bodies need to work in consonance. However,
each of these dimensions of water supply is met
through small and big water. No single approach to
augment water can work and fulfil obligations of
providing water for all. Therefore convergence of
big and small water systems is essential for
providing water security. This report shows in a very
distinctive way and with support from data that big
and small water is disconnected from each other.
81

10.8 Page 98

▲back to top


Better integration between the big and small water
would be a way to manage water more
systematically and sustainably.
9.1.3 Towards a New Water Vision:
Confluence of Perspectives65
The above discussions show that there are
perspectives on how water should be managed,
and, therefore, there is no one prototype for
managing water. What is needed is a confluence of
perspectives. For example, the rights perspective
focuses on the fundamental or human right to
water, traditional rights of access of communities
(tribal or other) to rivers, lakes, forests, and other
sources of sustenance and livelihoods. The social
justice/equity perspective is concerned with issues
of inequity in urban and rural water and sanitation
services, injustices to the poor and socially
disadvantaged people, forced displacement by
major projects and deficiencies or failures in
resettlement/rehabilitation, inequities in access to
irrigation water in the command areas of projects,
etc. The gender perspective focuses on the burden
on women of fetching water from long distances as
well as managing water in the home, with no voice
in water planning or water management
institutions. The community perspective questions
the right relationship between state and civil
society, the empowerment of people vis-à-vis the
state, the community management of common
pool resources, mobilisation of people for local
water augmentation and management, social
control of water use and sanctions against misuse,
voice in water policy formulation and water
management, etc. The state perspective is
concerned with legislation, policy formulation,
planning, administration, 'governance' at all three
levels, ensuring/enforcing rights, providing or
facilitating or regulating water supply and sanitation
services, preventing or resolving or adjudicating
inter-state/inter-sector/inter-use/inter-area water
disputes, prescribing and enforcing quality
standards, managing water relations with other
countries, ensuring compliance with international
law, and so on. The economic perspective sees
water as economic good subject to market forces,
and argues for water markets, the full economic
pricing of water, the privatisation of water services,
private sector participation in water resource
projects, etc. There are strengths in each of these
perspectives, but as a single and standalone
perspective, they may not do justice to the issue.
The right combination of these perspectives is
context specific; therefore, the fundamental
principle is to have an interdisciplinary perspective
to management of water.
9.2 Key Messages of this Report
After the initial presentation of the major issues
around water and the key issues and gaps in
implementation, this section focuses on the key
messages of this report. Each of these messages
have implications for the existing framework in
which water is managed and an understanding of
this would help in devising a way forward paving the
way for a paradigm shift in water resource
management.
9.2.1 Water Availability and Scarcity66
It is not possible to manage water resources
effectively without a proper estimation of the
availability and use of water. This is where a
serious problem exists not only in India, but also in
other countries regarding reliably measured data
for surface and groundwater availability and use at
the local level. While the central and state
governments have done commendable work in
estimating the availability and use of groundwater
fairly accurately at the block level there remains a
lack of information at the sub-district level. The
estimation of the availability and use of surface
water is still largely based on insufficient data. To
correctly estimate the availability of surface water
we need a much more detailed measurement of
stream flows, precipitation, run-off coefficients and
evapo-transpiration at the watershed level.
Similarly, detailed studies of crop production data
have to be conducted to better estimate the
agricultural water use. At present, approximate
empirical formulae are being used for determining
surface water availability and use. For example,
despite 85 per cent to 93 per cent of the annual flow
of the Brahmaputra (there are no firm estimates)
being contributed by its Indian tributaries, there is
no flow measurement taking place on these
tributaries and the estimates are based only on the
measurement of flow in the main river stem at
different points. The proper estimation of water
availability and use requires a multidisciplinary
approach involving hydrology, geology, agriculture,
remote sensing, sociology, anthropology, etc. In
fact, this has to be done in a campaign mode,
involving people also through the panchayats and
municipal wards. People have to be made aware of
the need for sustainable water management and
the importance of good grass-roots level data
collection to make this possible. The lack of a
comprehensive approach in planning and
mismanagement of water resources in India has
occurred precisely because of this extremely
serious neglect of the need to collect authentic
grass-roots level data on both surface and
groundwater availability and use and sharing it in
65This section relies heavily on, and is inspired by, Iyer (2010).
66The content of this section has been partly contributed by Rahul Banerjee, Dhas Grameen Vikas Kendra, Indore, Madhya Pradesh.
82

10.9 Page 99

▲back to top


the public domain.
In the situation where data on availability of water
has been critiqued and questioned, the data on
water scarcity has also come under the scanner. As
discussed in Chapter 1 on water availability, there
is a dire need to move further from the per capita
water availability calculations as they do not
capture the socio-economic disparities in water
access. Some attempts have been made by the
National Family Health Survey (NFHS) (see the
chapter on Urban Water) to show water access for
the poor in urban slums. Similar work is needed to
decode the water availability information. The
information on groundwater and irrigation is
incomplete. The notions of scarcity (and surplus)
are inherently relative concepts. Something is
always scarce with respect to an assumed notion or
understanding of what is sufficient and there is
nothing inherently or absolutely scarce about any
given quantum. Standards of scarcity therefore are
contingent on subjectively acceptable standards of
sufficiency. Hence, a divergent and context-
dependent interpretation of scarcity is essential for
an assessment of scarcity-induced impacts.67
There is evidence to suggest that in the situation of
scarcity (Ralegan Siddhi and Hiwre Bazar), water
availability for irrigation and domestic purpose
could be managed if certain management
principles are employed. Returning to present
indices for calculating water scarcity and further
disaggregation would help in a better
understanding of water in different agro-ecological
zones of India.
9.2.2 Sectoral Allocation: Where's the
Operational Mechanism?
The three main sectors that consume water are
domestic, irrigation and industry. Apart from
allocating water for each of these sectors, water for
the ecosystem is also gaining currency in recent
debates around water allocation. It is argued that a
minimum environmental flow is needed for the
ecosystem to rejuvenate and that should also form
part of the debate for allocation of water to different
sectors. It was discussed that the allocation
management framework should take into
consideration the cumulative effects of water use
and to guarantee that the water allocation is
equitable for the users and to all sectors.
Allocation limits are set to ensure that water is
allocated to users in quantities that are reasonable
for the intended uses. The aim is to achieve an
acceptable balance between accessibility and
reliability of supply, and to provide a basis to share
the water source as equitably and efficiently as
possible.
The Indian water policy talks about domestic
requirements of water to be considered first while
allocating the resource. However, in practice, this
has hardly been followed as many parts of urban
and rural India are still 'un-served' by formal water
supply systems. Orissa lists 'ecological systems' as
the second priority for consuming water, while in
Maharashtra agriculture is third in priority.
However, the stated priorities and actual usages
are sometime different, as claimed by activists. The
case of Hirakud Dam in Orissa proves this point.
The dam was designed to supply water for
agriculture but research shows that there has been
increasing allocation for industry. In rural India,
water supply is mainly covered via tuebwell
installation while fewer cities have 50 -60 per cent
of areas covered by formal water supply systems.
In large parts of urban areas, people access water
through private tubewells. The same holds true for
industries and agriculture. Therefore, an
operational mechanism for sectoral allocation
based on logic, need and principle of equity seems
missing from the Indian scene. This is largely due to
the inability of the authorities to undertake regional
or basin-level planning based on land and water
availability, thereby creating a democratic space for
negotiation between sector representatives and
those working on water use efficiency in all sectors.
Further, there is a lack of incentive for not polluting
existing water sources by all sectors—industry,
agriculture and domestic users, especially urban
users.
The concept of water for ecosystem needs is
nascent in Indian debates around water
management and utilisation. It has been argued
that the basin-wise ecosystem need can be
calculated taking into account the minimum
environmental flow which is needed for the survival
of the ecosystem. To actualise this, one needs legal
provisions for ensuring minimum water flow
regimes. This concept encompasses many issues,
such as recognition of riparian rights, and has a
strong community base in monitoring that the right
for ecosystem is guaranteed. This understanding
however needs more debate and actualisation
through pilot projects in India, for example, to see
how it will work on the ground. Each of the sectors-
domestic, agriculture, industry and the ecosystem-
needs water. Due to lack of an operational
mechanism, conflicts around water are becoming
the order of the day in India. Water conflicts are
broadly classified into the following seven
categories.68 These are conflicts over equitable
access, competing uses, water quality and
pollution, dams and displacements, privatisation of
water, industrialization and inter-state conflicts.
Each of these conflicts is characterised by a case
attributed to it. Therefore, there is a dire need to
67Key note address by Dr Jasveen Jairath, first Multi-Stakeholders' Consultation Workshop for the southern region, Hyderabad, held on
28 June 2011.
68This classification is by Paranjape and Joy (2011: 44- 55).
83

10.10 Page 100

▲back to top


evolve general guidelines, procedures and
institutions to determine and regulate water use in
an equitable and sustainable manner with better
conflict management mechanisms.
9.2.3 Water Pollution
This report shows that India's rivers receive millions
of litres of sewage, and industrial and agricultural
waste on a daily basis. The most polluting source
for rivers is city sewage and industrial waste
discharge. Presently, only about 10 per cent of the
waste water generated is treated; the rest is
discharged as is into our water bodies. Due to this,
pollutants enter rivers, lakes and the groundwater.
Such water, which ultimately ends up in our
households, is often highly contaminated and
carries disease-causing microbes. Agricultural run-
off, or the water from the fields that drains into
rivers, is another major water pollutant as it
contains fertilisers and pesticides. A recent report
of the Controller and Auditor General (CAG) of
India for the year 2011 contains the results of the
Performance Audit of Water Pollution in India (GoI
2011). The report has been prepared for
submission to the president of India under Article
151 of the Indian constitution. The report contains
the performance audit conducted from July 2010 to
February 2011. It examined the functioning of the
Ministry of Environment and Forests (MoEF),
Central Pollution Control Board (CPCB), Ministry of
Water Resources (MoWR) and Central Ground
Water Board (GCWB) in 25 states. It also examined
the state pollution control boards, state
environment departments, state urban local
bodies, nodal departments and implementing
agencies for the National River Conservation Plan
and the National Lake Conservation Plan and
selected blocks in districts for groundwater. The
sample consisted of 140 river projects, 22 lakes
and 116 groundwater blocks in 25 states. The
report reveals that:
Ÿ Water pollution has not been adequately
addressed in any policy in India, either at the
central or the state level. In the absence of a
specific water pollution policy, which would also
incorporate prevention of pollution, treatment of
polluted water and ecological restoration of
polluted water bodies, government efforts in
these areas would not get the required
emphasis and thrust.
Ÿ States falls short of an ideal situation in
combating pollution through legislation, policy
and implementation. This has repercussions on
implementation of programmes for control of
pollution and their outcomes.
Ÿ There was a paucity of networks for tracking
pollution of rivers, lakes and groundwater, as
there were inadequate monitoring stations and
therefore no real-time monitoring of water
quality was taking place and the data on water
quality had not been disseminated adequately.
Further, the report states that the inventory of water
sources has not been prepared and the overall
status of the quality of water in rivers, lakes and
groundwater has not been adequately assessed in
India. The risks of polluted water to the health of
living organisms and its impact on the environment
have been not been adequately assessed.
Adequate policies, legislations and programmes
have not been formulated and effective institutions
have not been put into place for pollution
prevention, treatment and restoration of polluted
water in rivers, lakes and groundwater. These
programmes have not been planned, implemented
and monitored efficiently and effectively, and the
funds have not been utilised in an efficient and
economic manner to further the aim of reducing
water pollution. Adequate mechanisms have not
been put in place by the government to sustain
measures to tackle water pollution; and
programmes for the control of pollution have not
succeeded in reducing pollution levels in
groundwater and surface water and restoring water
quality. The findings of the present report
corroborate the points mentioned in the
Government of India's report. That the present level
of water pollution in India is like a ticking time bomb
which can explode anytime if left unchecked.
9.2.4 Gender Disaggregated Information
New reforms and programme documents related to
water include sections on women's role in the
successful implementation of water projects and
the likely benefits accrued to them. While there has
been largely an agreement to mainstream gender
issues in water projects, critics have argued that
the issue becomes rhetorical if not backed by
adequate data collected in a disaggregated
manner. Until now, there is virtually no gender
disaggregated data on water sectors collected by
the main international and state agencies in a
uniform way (Seager, 2010). How does gender
disaggregated data help in taking informed
decisions bordering on the issue of gender and
irrigation? First, water for irrigation is directly
related with access and control over land. Gender
disaggregated analysis of access to land for
women and men is the first step to understanding
the ownership pattern of a critical resource such as
land, which is tied up with another important
resource, water. Second, women's participation in
institutions dealing with irrigation water such as the
WUA is important. Gender disaggregated data of
women's participation in WUAs, collected and
analysed at the level of the district and state, will
help in understanding important facets of gender
relations and how their improved participation has
or has not influenced desired outcomes of a
84

11 Pages 101-110

▲back to top


11.1 Page 101

▲back to top


project. A recent study conducted by Bina Agarwal
(2010) dwells on the issue of women's participation
in forestry institutions by asking the question:
Would women's inclusion in forest governance,
undeniably important for equity, also affect
decisions on forest use and outcomes for
conservation and subsistence? Using data on
community forestry institutions in India and Nepal,
Agarwal provides the history behind women's
omission from social institutions, the barriers that
still prohibit their participation, as well as how these
barriers can be overcome. Agarwal argues that
women's presence, in the right critical mass, makes
a considerable difference to the desired outcomes
of forest governance. These insights are based on
concerted gender disaggregated data collected,
which informs policies for desired change while
providing the status. Third, many gender
negotiations are formed at an informal level and in
the private sphere, and are therefore largely
ignored by policy initiatives which look for formal
means of participation. Enquiring into the informal
and private sphere in which women negotiate their
views is therefore important for a true gender
sensitive policy.
9.2.5 Imparting New Vision of Water for
Technocrats through Targeted Capacity
Building Programmes
A generic and longstanding problem in the area of
education in water resource management in India
is the disconnect between university education and
professional requirements. First, the complexity of
existing water resource management demands
integration and interdisciplinarity, education and
research continue to function in a disciplinary
mode. Second, there is competition from some
sectors that provide lucrative job opportunities,
such as the IT sector and oil exploration, which
distracts students from the equally important area
of water management. Third, there is a strongly
pronounced 'silo' mentality, in which engineering
and science education provides little or no
exposure to the social sciences and humanities,
although the professionals so created have to plan,
design and implement technologies, projects and
programmes that have enormous social,
environmental and political ramifications. Most
education targets “sourcing” and“supply” of water
without due consideration to “demand” and
“resource characteristics”; social and
environmental aspects are also ignored. This silo
mentality is largely the result of the over-
specialised structure of college education
prevailing in India. In this context, several initiatives
have emerged over the past decade or so to
specifically address the third challenge mentioned
above, that is, to inject an element of
comprehensiveness into water education in India
(SaciWATERs, 2008). These initiatives include
those attempting to inject more social science into
water engineering, or more water
science/engineering into the social sciences, or
creating entirely standalone Integrated Water
Resources Management (IWRM)-type courses.
Assessing the requirements and demands of
interdisciplinary water professionals would point
towards the level at which support and capacity
building is required.
The need of the hour is to educate water
professionals and especially the engineers working
in departments dealing with domestic water supply
and irrigation with integration skills. Present day
engineers come from this background of
engineering education which is devoid of solving
problems of say everyday water supply. Once
inducted in the department, these engineers have
very limited resources to refresh their knowledge
and acquire new knowledge for water
management. Apart from the issue of the changing
paradigm for water education in India, it was found
that there is a lack of coordinated and concerted
efforts in training the in-service engineers on the
new vision of water management. Most of the
engineers have received training from
government-funded institutes that lack
participatory methodology in imparting key
messages and encouraging participants to
understand the need for training and capacity
building. India's water sector, dominated by
engineers, is set for change. Senior officials have
often enunciated the need for more 'community
involvement' but this has not translated into action
on the ground for various reasons:
Ÿ Lack of training and understanding of social
processes on the part of the engineer-driven
water supply bureaucracy that feels there is no
need for involving people in their work.
Ÿ Lack of adequate understanding among people
of water governance and the technical aspects
of water supply and management. Business-as-
usual scenario will only compound current
water shortages, mismanagement, and lead to
social unrest as poverty and inequality grows.
Ÿ The ingredient of this techno-centric education
entails another fact, that education around
water resources is gender and equity blind while
claiming it as gender and equity neutral. There
are very few courses that make students
understand ground realities that expose them to
the local context. The fact remains that there is
still a long way to go and many boundaries to
cross to achieve a critical mass of education
programmes that have internalised the new
water resource management challenges.
Ÿ Lack of understanding in imparting participatory
methods for training and creating an
environment for debate and participation so that
the problems are put forth without hesitation in
search for a better management practice. Thus,
85

11.2 Page 102

▲back to top


there is a pressing need to expose the water
bureaucracy to social processes, and people to
the technical processes, of water management.
Both need to see 'the other side' and find a
practical way to work together. This will improve
the ability to manage water better, and,
importantly, in the interest of the poor and the
marginalised.
References
Agarwal, B. 2010. Gender and Green Governance: The
Political Economy of Women's Presence Within and
Beyond Community Forestry. New Delhi: Oxford
University Press.
Biswas A. 2012, A Framework for Rural Drinking Water
Quality Management: Collating Experiences from the
Voluntary Sector, Learning Document Issue No. 3,
Arghyam, Bengaluru.
Government of India (GoI). 2011. Water Pollution in
India. Report of the Comptroller and Auditor General of
India. Report no. 21 of 2011-12.
Iyer, R. 2010. 'Approach to a New National Water Policy',
The Hindu, 29 October 2010.
Paranjape, S. and K.J. Joy. 2011. A million revolts in the
making: Understanding water conflicts in India
Infrastructure Report 2011 – Water: Policy and
Performance for Sustainable Development, pp. 44- 55.
IDFC, Oxford University Press.
SaciWATERs. 2008. Strengthening IWRM Education in
South Asia: Which Boundaries to Cross? SaciWATERs.
Available at:
http://www.saciwaters.org/CB/resources/Strengthening
%20IWRM%20in%20South%20Asia.pdf. [Accesed on
April 25, 2012]
Seager, J. 2010. 'Gender and Water: Good Rhetoric, but
it Doesn't ''Count”', Editorial, Geoforum, vol. 41, nos 1-3.
86

11.3 Page 103

▲back to top


ANNEXURE 1
Details of the Participants
(Consultation Workshops)
87

11.4 Page 104

▲back to top


DELHI WORKSHOP – July 20, 2011
88

11.5 Page 105

▲back to top


89

11.6 Page 106

▲back to top


90

11.7 Page 107

▲back to top


91

11.8 Page 108

▲back to top


11.9 Page 109

▲back to top


11.10 Page 110

▲back to top


Water in India: Situation and Prospects
This report attempts to provide a comprehensive analysis of the state of water resource development and
management in India, based on secondary information and consultations with leading experts, government
officials, academicians, activists and grassroot workers. It maps current challenges and suggests feasible
alternatives amidst increasing water scarcity and disenfranchisement of resource bases for the poor and the
marginalised. It aims at achieving a holistic and dynamic understanding of the level of development around
water and looks at the strategic steps required for action. The report encompasses both a depiction of the
state of freshwater resources and potential problems and progress towards identified goals, including
workable solutions. The key messages of the report are the following:
1. New indices are needed to measure available water resources
2. Water demand is far exceeding supply and leading to inter-sectoral conflicts
3. The time bomb of increasing water pollution is ticking
4. To achieve any headway in gender-sensitive policies, data disaggregation is urgently required
5. Reorientation and capacity building required for technocrats for a new vision for water management
SaciWATERs