State of Inidi%27s Population

State of Inidi%27s Population


1 Pages 1-10

▲back to top


1.1 Page 1

▲back to top


State
of India's
Population
Population Foundation of India
New Delhi

1.2 Page 2

▲back to top


3. Reproductive Health Index
6
4.
Population
8
5. Fertility
11
6. Mortality
13
7.
Educational Level
16

1.3 Page 3

▲back to top


Table 1 Human Development Index (HDI) : India & Major States 1995
25
Table 2 Gender related Health Index (GHl) : India and Major States 1995
26
Table 3 Reproductive Health Index (RHI) : India and Major States 1995
27
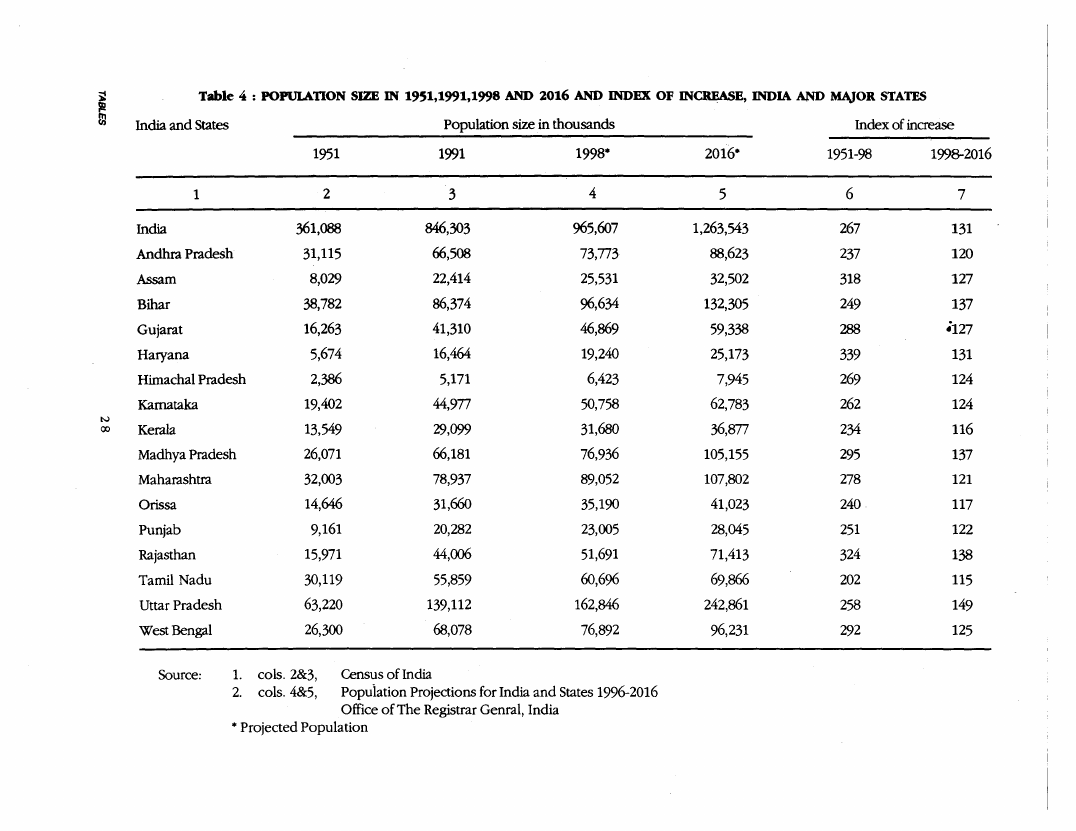
Table 4 Population Size in 1951, 1991, 1998 and 2016 and Index ofIncrease,
28
India and Major States
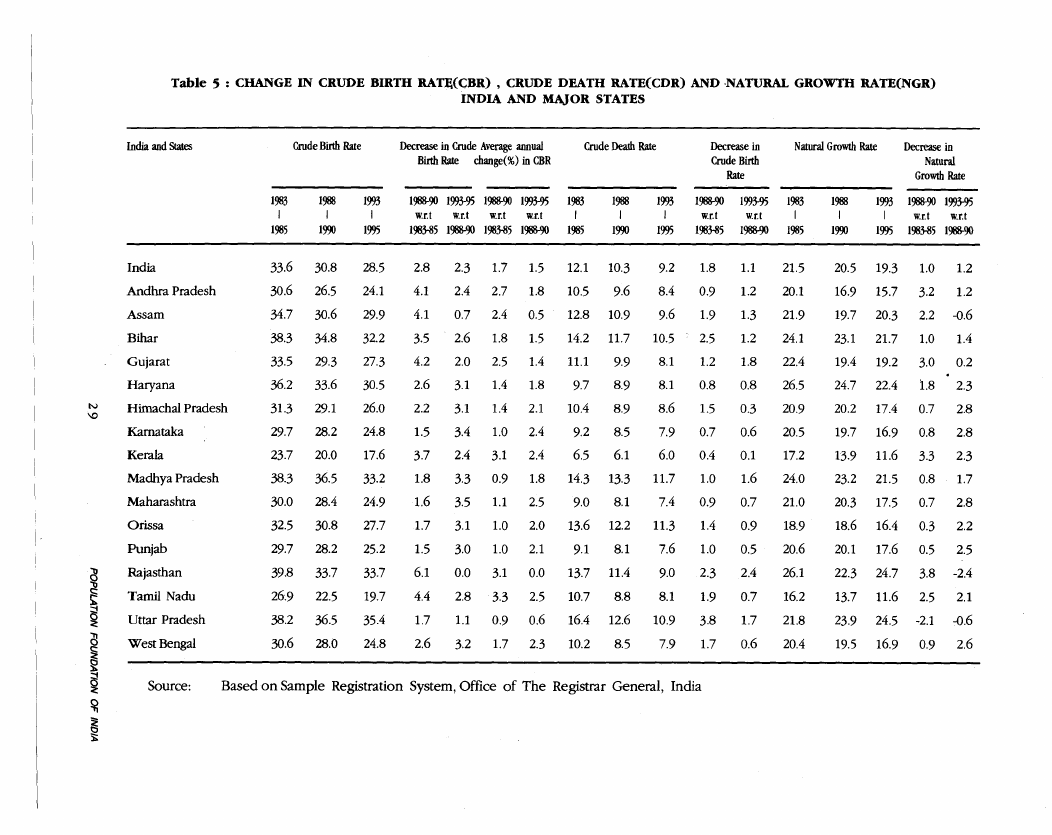
Table 5 Change in Crude Birth Rate (CBR), Crude Death Rate (CDR) and
29
Natural Growth Rate (NGR), India and Major States
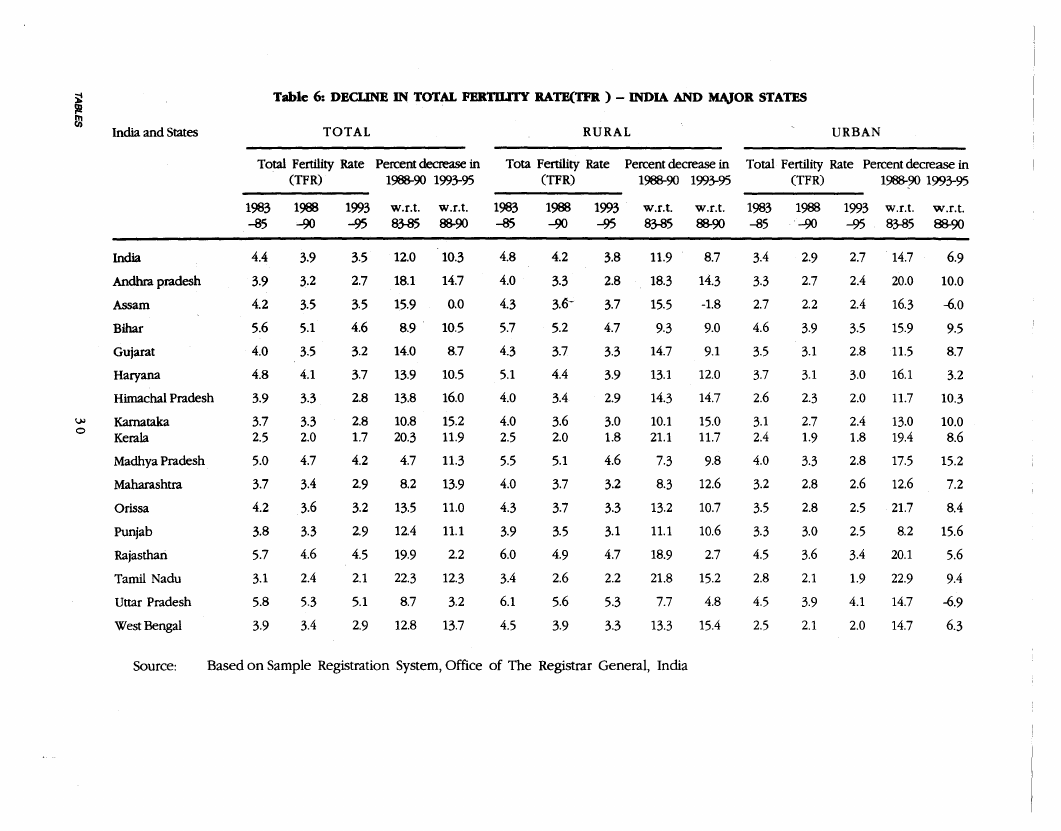
Table 6 Decline in Total Fertility Rate (TFR) - India and Major States
30
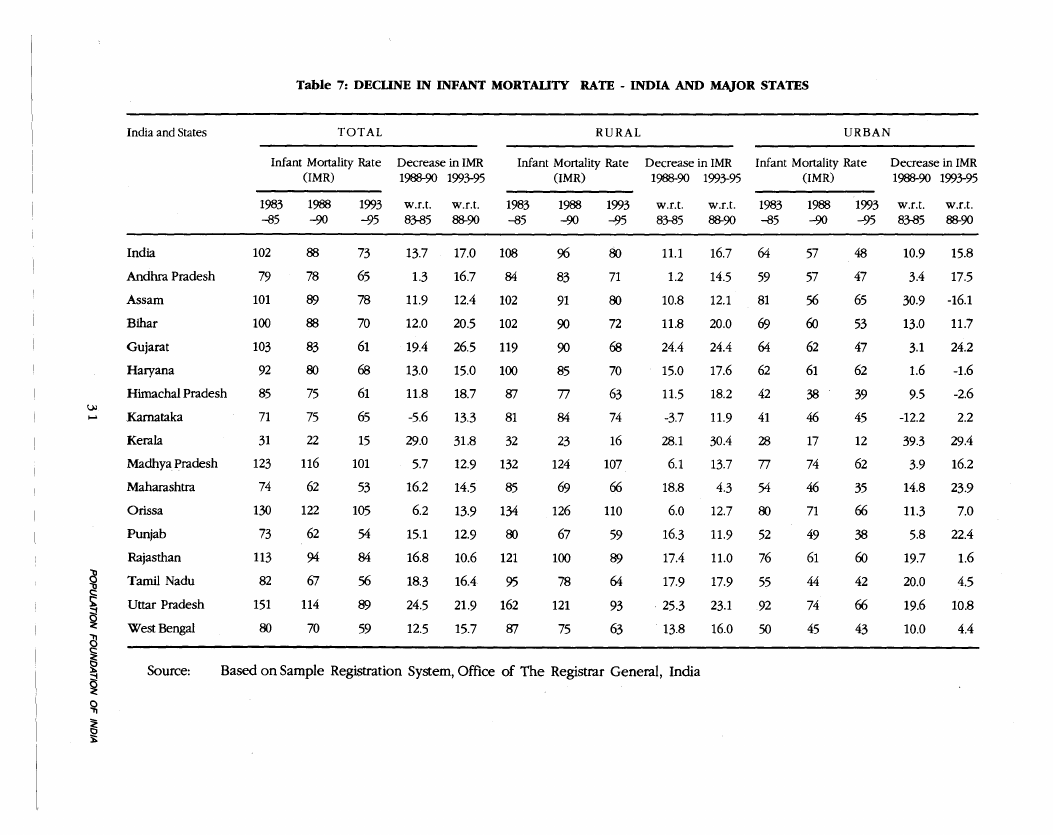
Table 7 Decline in Infant Mortality Rate - India and Major States
31
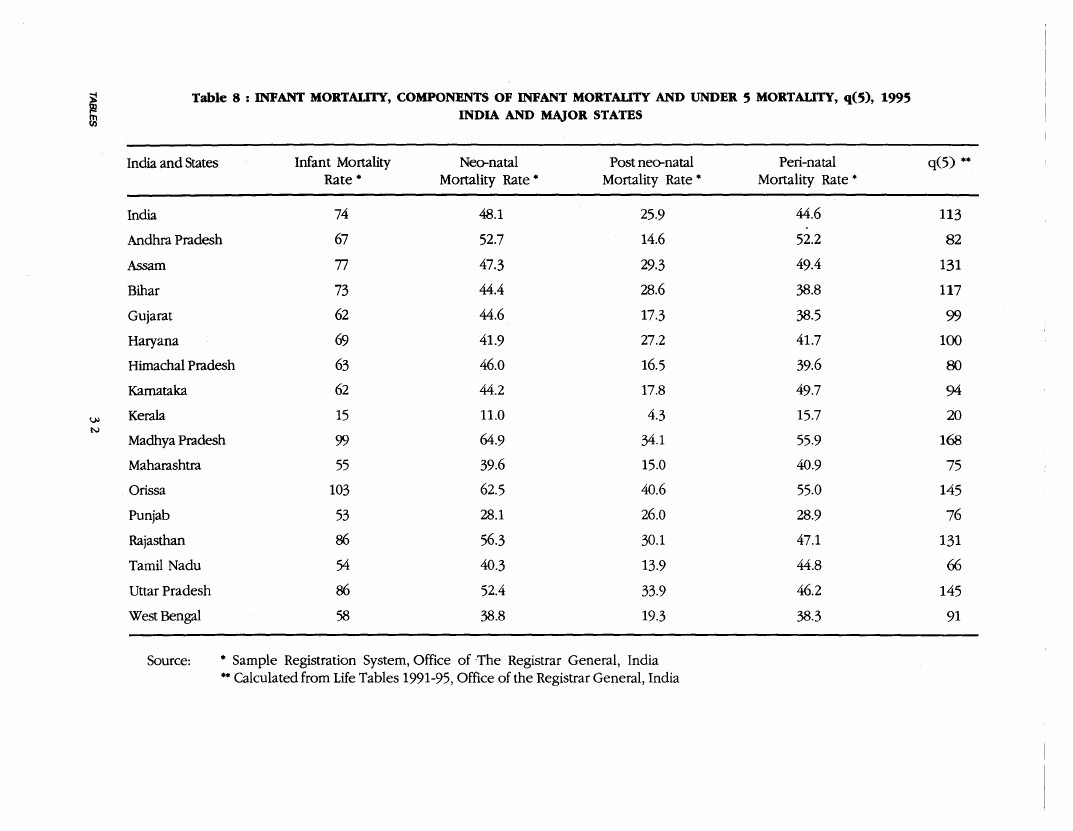
Table 8 Infant Mortality, Components of Infant Mortality and
32
under 5 Mortality, q(5), 1995, India and Major States
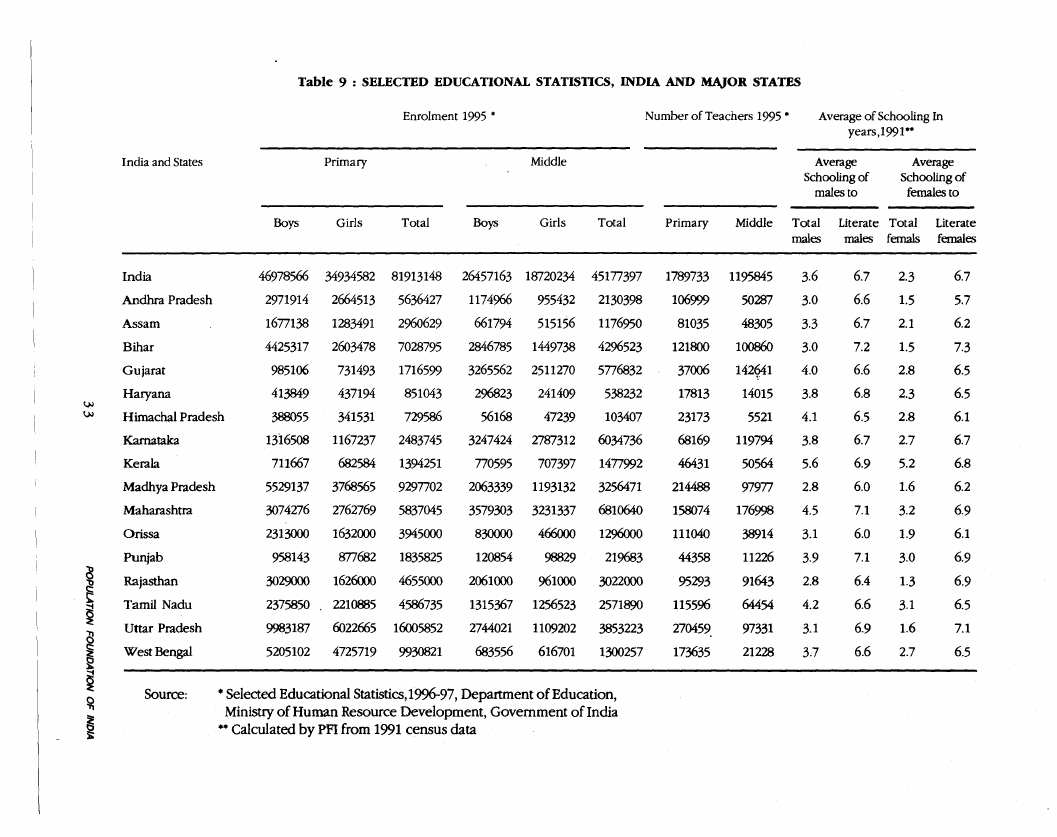
Table 9 Selected Educational Statistics, India and Major States
33
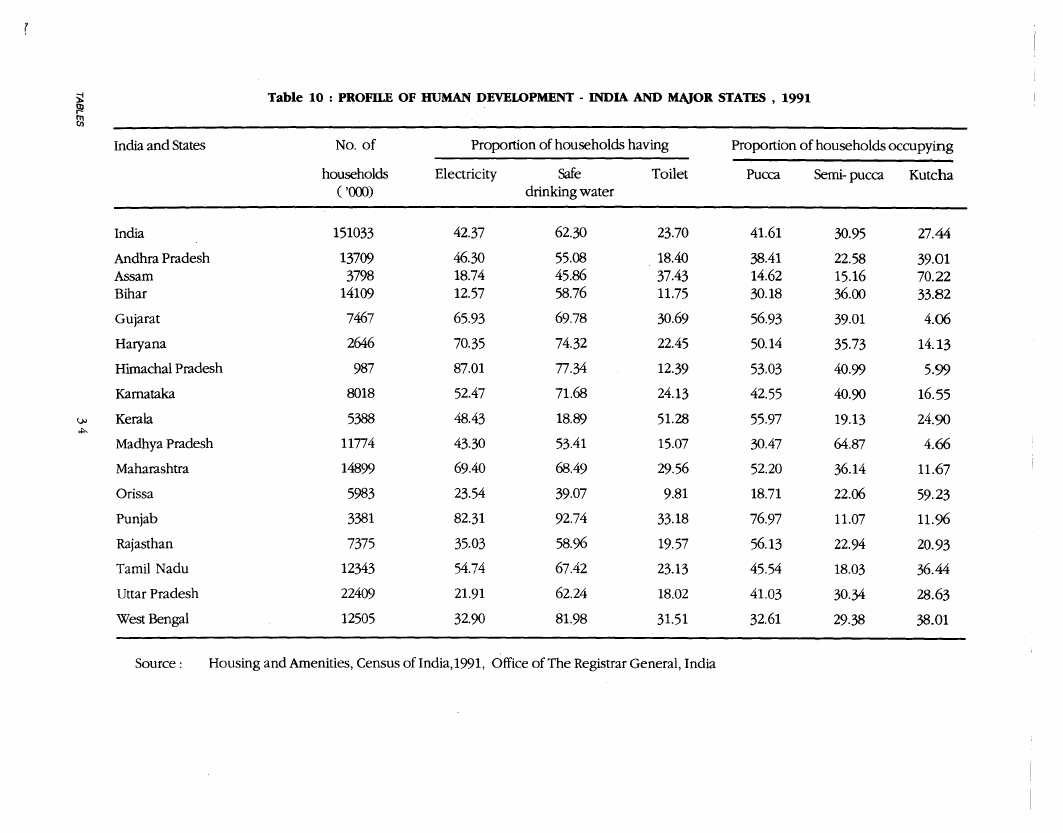
Table 10 Profile of Human Development - India and Major States, 1991
34
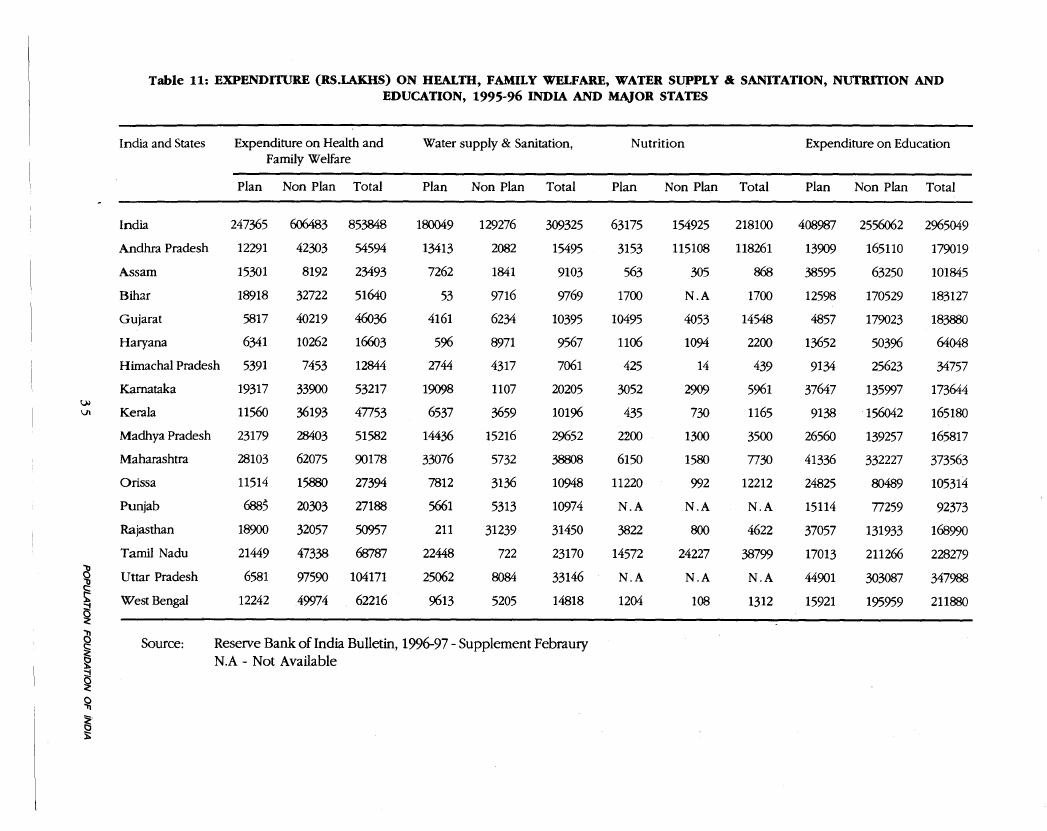
Table 11 Expenditure (Rs.Lakhs) on Health, Family Welfare,
35
Water Supply & Sanitation, Nutrition and Education, 1995-96,
India and Major States
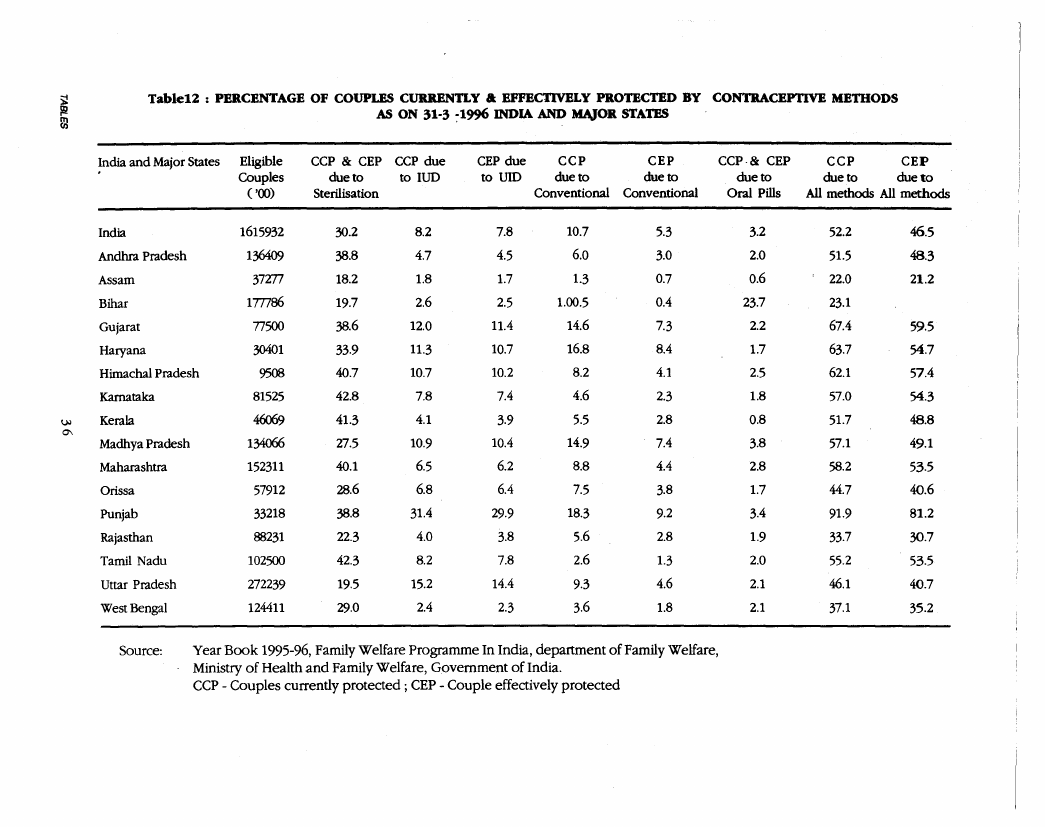
Table12 Percentage of Couples Currently & Effectively Protected by
36
Contraceptive Methods as on 31-3-1996, India and Major States.

1.4 Page 4

▲back to top


Population Foundation of India developed and computed, in 1996, three indices of health and development
viz. Human Development Index (HDI), Gender related Health Index (GHI) and Reproductive Health Index
(RHI), based on the most recent data available at that time.
The Human Development Index (HDI) computed for the major States in India was similar to the one
developed by the United Nations and was based on data available around 1993. It is a composite index combining
the values of three component indices on expectation of life at birth, educational attainment and state domestic
product. The difference from the UN Index is that the 'educational attainment' was measured by a combination
adult literacy rate and middle school enrolment ratio weighted in 2: 1, rather than school enrolment rates at
primary, middle and secondary levels combined with equal weight in the UN Index.
The second index, Gender related Health Index (GHI) is a simple average of three component indices
which measure the male-female gap in education, infant mortality and expectation of life at birth.
The third index Reproductive Health Index (RHI) takes into account the seven factors of total fertility rate,
infant mcrtality rate, life expectancy at birth, educational level, type of medical attention at birth, birth order
and birth interval, first converted into indices and then combined with equal weights. All the indices are in the
scale of 0 to 100, 100 indicating the highest possible development.
The computed values of these three indices at the state level, with data available for 1993, were published by
the Foundation in the form of a 'Wall Chart' entitled "India : Population, Reproductive Health & Human
Development". The Wall Chart became quite popular and was in good demand by many programme personnel,
academic institutions and individual scholars engaged in population, reproductive health and family planning
programmes or research activities.
Encouraged by the responses to the Wall Chart, the Population Foundation of India has decided to publish
every year a booklet entitled "State of India's Population" presenting most recent information on the levels of
fertility, mortality and reproductive health and combining them into indices of HDI, GHI and RHI. This will
facilitate qUick and easy assessment of changes in these indices and their component values across the states and
over time. The present volume is an attempt in this direction. In the computation of indices for the present
volume some minor changes have been introduced from the last one, necessitated by paucity and reliability of
data. These have been explained in the body of the text.
Mr K S Natarajan, Joint Director (Monitoring & Evaluation) in the Foundation undertook the major
responsibility in compiling the reqUired data and making the computations. In the compilation, analysis and
presentation of this report, he was assisted by Dr. Sanjay Kumar, Programme Officer and Mr G.v. Ramachandran,
Jr. Consultant. The 'State of the India's Population' is accompanied by a 'Wall Chart' containing the three index
values at the State level as well as certain other essential population data, in the most recent period, circa 1995.
I hope the 'State of India's Population' as well as the 'Wall Chart' would be useful for programme
administrators, policy makers and research personnel as a ready source of information on population relevant
issues. Any comments and suggestions for further improvement are welcome.
~~
Dr K. SrinIVasan
Executive Director
Population Foundation
of India

1.5 Page 5

▲back to top


1.6 Page 6

▲back to top


1. Human Development Index
In recent years the realisation has grown that
people are the real wealth of a nation. Progress
of a country is measured not only in terms of
income expansion and commodity production but
also in terms of expansion of human capabilities.
Even though countries with higher average income
tend to have higher life expectancies, lower Infant
mortality rates and higher literacy rates, these
associations are far from perfect. Intercountry
comparisons of income variations tend to explain
less than half the variations in life expectancy or
infant mortality rate. This does not mean that
economic growth is not essential for improving
quality of life. How the different segments of the
population share the fruits of economic growth are
equally important to consider. In particular what
the poor get-and how much additional resources
are used to support public services such as primary
health care and basic education are important to
consider.
The Human Development Reports of the UN
in recent years are efforts to focus on the
developments in raising human capabilities in
addition to income. The first report in 1990
introduced a new way of measuring human
development - by combining indices of life
expectancy, educational attainment and income
into a composite human development Index (HDI).
Since no single index can capture all facts of
human development, this index is being reviewed
constantly. Gender Related Development Index
(GDI) which focuses attention on gender disparities
in development is another index added to HDI.
The HDI index is available for India from the
UN reports. Data similar to those used in HDI by
UNDP are available for 16 major states of India.
Using the 1993 data, Population foundation of
India had worked out HDI for the 16 states of
India. The present report bases the index on the
latest data availabl~ for year 1995.This income
variable used in the index at state level is the State
Domestic Product (SDP) which is in terms of
Purchasing Power Padty (PPp$). This is further
adjusted for diminishing utility of higher levels of
income in human development. This is based on
the fact that beyond the limit the income increase
does not have same utility.
The HDI 1995in this report has been computed
at the state level by giving equal weights to three
--component indexes namely
1. expectation of life at birth, for the period 1991-
95;
2. educational attainment of the population based
on enrolment ratios in middle school during
1995 and estimated adult literacy rate (for ages
15+) for year 1995, extrapolated from 1971, 81
& 91 census data; and
3. the purchasing power parity price (PPP$)
adjusted per capita SDP for 1995.
The procedure is same as adopted by U.N.
except that only middle school enrolment is used
instead of weighing primary, middle and tertiary
level enrolment ratio as in the UN Index. This
change is keeping in view the reliability of data
made available for India. The detailed data on each
of the variables and indices at the state level and
sources are furnished in table-I. Computation
procedures are explained in Annexure.
The HDI for India by this method works out
to 45 close to 44.6 reported for year 1994 by U.N.
Human Development Report-1997.
On the basis of the human development index,
U.N. has classified countries into those with high,
medium and low human development countries.
Underthisschemethe high human development states
would consist of those with HDI of 80 or above.
Medium with HDI of 50 to 80 and low with HDI
below 50. India with an index of 45 falls in category
of low HDI. Within India, there is a vast variation

1.7 Page 7

▲back to top


Chart 1
HUMAN DEVELOPMENT INDEX, 1995
Kerala
Maharashtra
Punjab
Tamil Nadu
Himachal Pradesh
Haryana
13
West Bengal
lc
ctisl
Gujarat
Karnataka
~
India
Assam
J\\ndhra Pradesh
Rajasthan
Orissa
Madhya Pradesh
Uttar Pradesh
Bihar
163
57
155
52
51
50
149
49
'46
45
141
141
138
138
37
38
134
0.00 10.00 20.00 30.00 40.00 50.00 60.00 70.00
HOt
BALANCE SHEET OF HUMAN DEVEWPMENT
between states. Kerala with a HDI of 63 is far ahead
of other states. Haryana, Himachal Pradesh. Kerala,
Maharashtra, Punjab and Tamil Nadu would qualify
to be classifiedas medium Human Development states.
Together, about one fourth of Indian population
lives in these six states. All the other major states
would fall under the low human development
category. The states of Bihar, Madhya Pradesh. Orissa,
Rajasthan & Uttar Pradesh. which together constitute
45% of India's population, have, HDI of less than 40.
Ranking by HDI does not always match ranking
by per capita income. Of 16 states of India, their
ranking by HDI is better than ranking by State
Domestic Product in Assam, Himachal Pradesh,
Kerala, Orissa, Tamil Nadu & West Bengal. In respect
of Bihar, Uttar Pradesh., Maharashtra, the ranking
remains the same by both the indices.Andhra Pradesh.,
Gujarat, Haryana, Kamataka, Madhya.Pradesh, Punjab
& Rajasthan have a much poorer ranking by HDI
compared to their SDP. Kerala is a typical case of
significantly higher human development at lower
income. On the other hand states like Punjab &
GUjarat have higher per capita SDP but lower HDI.
A graphic presentation of states by their 1995 HDI
values is given in chart 1.
At the time of Independence, expectation of life
at birth for the country as a whole was around 32
years. This has increased to 60.3 years during 1991-
95. The figures for males and females were 59.7 and
60.9 respectively. The corresponding figures during
1941-51, centred around 1946 were 32.5 and 31.7
years.

1.8 Page 8

▲back to top


2 Infantmortality
At the time of Independence the infant mortality
was estimated to be around 180 per 1000 live births.
This has decreased by more than half to 74 in 1995.
The percentage of literate population aged 5
and above has increased from 18.3 in 1951 to 52.2
in 1991. The corresponding figures for males and
females were 27.2 and 8.9 in 1951 and 64.7 and 39.2
in 1991.
Number of children enrolled in primary school
has increased from 18.7 million in 1951 to more
than 110 million in 1995. The corresponding figures
for males and females are 13.8million and 62.4 million
for males and 4.9 million and 47.9 million for females.
Rapid increase is noticed in female enrolment. At the
middle school level Grade VI to Grade VIII, the
change was more phenomenal for girls; the figures
being 0.53 million and 18.7 million in 1951 and 1995
respectively. For boys the corresponding figures were
only 2.6 million and 26.5 million.

1.9 Page 9

▲back to top


2. Gender Related Health Index
The GHI uses the same variables as HDI and these parameters are same for males and females GDI
attempts to capture the achievements in narrowing would be same as HDI. Ifthere is a ~p between males
gender differentials through the same set of basic and females in the achievements, then the average is
capabilities included in HDI, such as life expectancy, reduced.
educational attainment and income. However the
Gender related development index (GDI) of the
While the UNDP's index uses distribution of
UNDP adjusts the average achievement of each state income between males and females as one of the
in these parameters such as life expectancy at birth, parameters, in view of the difficulty in getting
educational attainment and income for the disparities reliable data on sexwise distribution of SDP, at
in achievement for males and females. Such adjusted disaggragated level, this has been omitted from the
indices are termed 'equally distributed indices'. If index constructed here for the states of India. Since
-
Chart 2
GENDER HEALnI INDEX - 1995
Kerala
Maharashtra
189
'-
65
- Tamil Nadu
Punjab
-- - Himachal Pradesh
- West Bengal
Ul
- Gujarat
1&1
!C
I-'
Ul
- Karnataka
C
C
i!:
- Haryana
- India
- Andhra Pradesh
- Assam
- Bihar
- Rajasthan
- Uttar Pradesh
- Orissa
Madhya Pradesh
164
63
62
162
58
57
154
51
150
150
144
141
41
139
138
50
GHI

1.10 Page 10

▲back to top


this index uses health and educational related
indices, it is termed as Gender Related Health
Index (GHI) instead of GDI. While in the GDI
constructed by UNDP, educational attainment is
used as a measure of development efforts, in GHI,
this is viewed as a proxy for positive health. The
index has been constructed for males and females
and a weighted average used. The weight is such
that if the Gender equality is higher, the index is
higher. If there is.-grossdiscrimination against any
sex, then the index will be lower. The index is
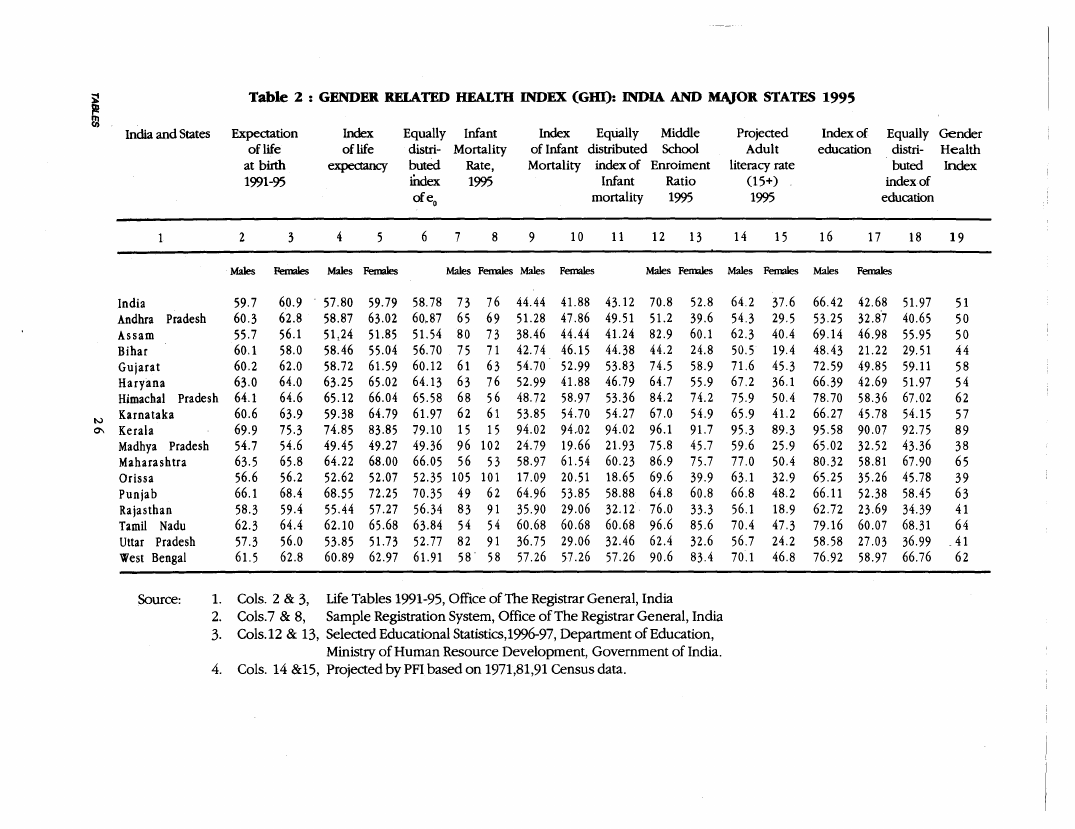
measured in a scale of 0 to 100. Table 2 presents
the index and the sources of data.
There is considerable variation between states
of India. Kerala leads with a GHI of 89. Madhya
Pradesh & Orissa with indices of 38 & 39 are at
the low end. The low position of these two states
is due to the high Infant mortality rate values in
the range of 100. Bihar, Rajasthan & Uttar Pradesh.
also have low GHIvalues of 44, 41 & 41 respectively.
Himachal Pradesh, Mahashtra, Punjab, Tamil Nadu
and West Bengal have higher indices though these
states are stillfar behind Kerala.Gujarat& Karnataka
have similarvalues, with Haryana following closely.
Andhra Pradesh & Assam have indices of 50. A
graphic presentation of GHI values at the state
level is presented in Chart 2.
Analysing the individual components of the
index we find that the equally distributed index
of eoo varies from 79.1 in Kerala to 49.4 in Madhya
Pradesh giving a range of 29.7. The index ofInfant
mortality rate varies from 94.0 in Kerala to 18.6 in
Orissa, a variation of 75.4 points. The index of
education also varies sharply between states, the
range being 63.2 (92.7-29.5). Thus the variations
in infant mortality & educational levels seems to
be major contributors for the variation between
states. If the gaps infant mortality rates and
educational levels are reduced, the variation in
GHI would reduce sharply. Both of these factors
would require investments in social sectors.

2 Pages 11-20

▲back to top


2.1 Page 11

▲back to top


3. Reproductive Health Index
'Reproductive Health is a state of complete physical, mental and social being
and not merely the absence of disease or infirmities in all matters relating
to the reproductive system and to its functions and processes'
Reproductive Health is a crucial part of general
health and is central to human development.
According to above definition, reproductive health
implies that people have the capability to reproduce
and the freedom to decide if, when and how often
to do. Implidt in the above is the access to appropriate
health care services that will enable woman to go
through pregnancy and child birth safely and provide
the.couple with the best chance of having a healthy
infant.
Chart 3
REPRODUCTIVE REALm INDEX - 1995
Kerala
80
Tamil Nadu
164
Punjab
159
Himachal Pradesh
158
Gujarat
55
Maharashtra
CJ)
w
!;(
Karnataka
~<
0~
West Bengal
Haryana
54
151
48
46
Andhra Pradesh
144
India
42
Orissa
39
Assam
39
Rajasthan
31
Madhya Pradesh
130
Bihar
130
Uttar Pradesh
29

2.2 Page 12

▲back to top


To measure the status of various states of India
on reproductivehealth,an index has been constructed
based on reliable data available annually. After
examining available data, the following seven
parameters have been identified to measure
reproductive health. These are
i. Total Fertility Rate (TFR),
ii. Age specific fertility rate in the age group 15-
19 (ASFR15-19), to represent teen age fertility,
Hi. The proportion of higher order births i.e.
order 4 and above (B4+),
iv. Percentage couples effectively protected by
contraceptives (sterilisation),
v. Perinatal mortality rate (PNMR),
vi. Proportion of births receiving skilled attention
(SKAB)at the time of delivery and
vii. Educational attainment of women (EAW).
While the first one relates to the total burden
of child bearing, the second variable ASFR15-19
gives an idea of the extent of fertility In the teen
ages. High fertilityin this age group is a contributory
factor for higher maternal and Infant mortality. The
next two measures reflect extent and impact of
contraception i.e. the ability to decide on control
of fertility. PNMR and SKABmeasure the extent
and impact of the quality of delivery services.
Lower PNMRis known to be due to better physical
and mental health of mother during pregnancy and
delivery.The seventhvariableeducation is recognised
to have direct influence on the women's ability to
access and utilise the health care facilitiesfor herself
and her family.There are a number of other factors
such as childlessness,female mortality and maternal
mortality which one would like
to include in the index. Unfortunately reliable
data on these items are not available on a regular
basis.
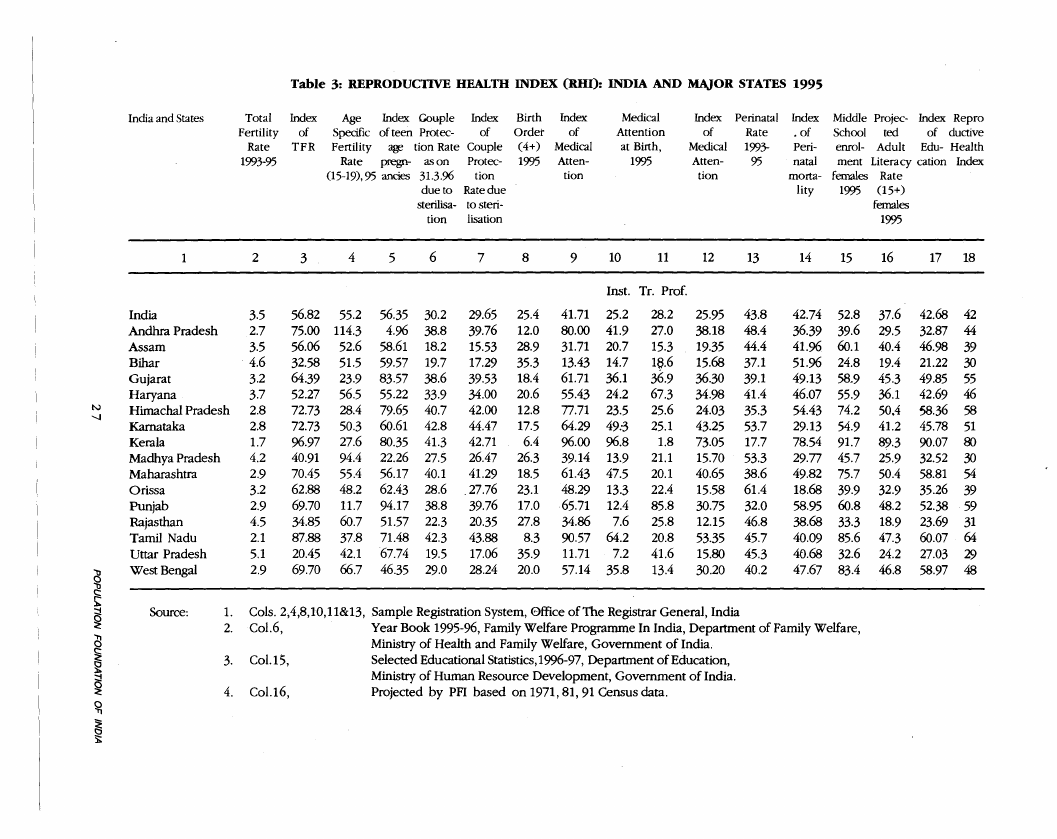
Based on above seven parameters Reproductive
Health Index (RHO has been computed. Table 3
gives the data, the indices for components and the
composite RHI. These indices are on a scale 0 to
100. The RHI is highest for Kerala and lowest for
Uttar Pradesh, followed closely by Bihar and
Rajasthan. A graphic presentation of the states
based on the RHI values is given in chart 3.
Based on the component indices of the RHI,
Uttar Pradesh ranks lowest in TFR Contraceptive
protection rate due to sterilisation and birth order.
Bihar ranks lowest in index of educational
attainment. Rajasthan is seen to have the lowest
index of skilled medical attention at delivery. Very
high perinatal mortality rate in Orissa is a reflection
of the lower nutritional status and ANC facilities
in that state. Very high age specific fertility rate
(15-19) in Andhra Pradesh results in low index of
teen age pregnancies for that state. On the other
hand very high index based on ASFR(15-19) for
Punjab is a reflection of the relatively higher age
at marriage and low fertility of women in the age
group 15-19 in Punjab probably due to better
contraceptives. Kerala though ranks first among
the states in over all index, ranks way behind
Punjab in ASFR15-19 index.

2.3 Page 13

▲back to top


4. Population
The population of India has been estimated at
970.9 million as on 1st July 1998 showing an
increase of more· than 124 million since the last
census conducted in 1991. In 1947, when India
attained Independence, the population of India
was around 342 million. Since then, 639 million
have been added to the population of India. In
the last 20 years, alone another 342 million have
been added to the population of India. As per the
estimates of Sample Registration System of the
office of the Registrar General of India, the
population of India is increasing at present at a
rate of 17 million per year. In other words, the last
100 million has been added in less than six years.
It may be recalled that before Independence, it
took 42 years to add 100 million. Since 1951,when
the first Census in independent India was
conducted, about 600 million have been added to
the population of India. The first 100 million was
added in 12.5 years, the second 100 million in 9.3
years, the third 100 million in 7.6 years, the fourth
100 million in 6.4 years, the fifth and sixth 100
million in 5.8 years. Since 1951, when the first
Census of Independent India was conducted the
population of India has multiplied by 267%. The
increase has been the highest in Assam (318%),
Haryana (329%), Rajasthan (324%) and least in
Tamil Nadu (202%).
Projected Population
It has been estimated by the Technical Working
Group on Population Projections appointed by
Planning Commission that by 2016 India's
population would go up to 1263 million (Chart 4)
Le. by another 31%.While the population of states
of Kerala, orissa and Tamil Nadu will increase by
15% to 19% during 1998-2016, that of states of
Bihar,MadhyaPradesh, Rajasthanand UttarPradesh
would increase by over 40%,the highest anticipated
Chart 4
POPULATION OF INDIA, 1951-2016
1,300,000
1,263,543
1,100,000
§
c: 900,000
.2
1ai.
~ 700,000
965,607
300,000
1951
1991
Years

2.4 Page 14

▲back to top


increase being in Uttar Pradesh with 55%. UP's
population will cross a mind boggling figure of
242.8 million by 2016. (See Table - 4).
The urban population of India has been estimated
at 268.8 million as on 1st March, 1998. The 1991
census figure was 217.2 million. It has been projected
to increase to 425 million in 2016, or an increase of
208 million during a period of 25 years 1991-2016.
In other words the urban population would almost
double in 25 years. The annual addition to urban
population would be around 8.05 million. This would
put a severe constraipt on infrastructure facilitiessuch
as housing, water supply, sanitation and
transportation. Around 2/3 of this urban population
lived in about 132 class I cities with population of
1,00,000 and above in 1991.Further majority of the
population of class I cities live in 23 million plus
cities. In these cities the pressure of population would
be mounting.
Birth Rate, Death Rate
and Rate of Natural Increase
Births, deaths, immigration and emigration are
the four components of population change. The excess
of births over deaths, called natural increase is an
important measure in understanding population
change over time. The simplest and most common
measure of natality of a population is the Crude Birth
Ratewhich is expressed as the ratio of annual number
of births per 1000 mid year population. It is an
important component to study the population change
but is not very accurate if one wants to study the
various components of process of change. As the
name itself indicates, it is a crude measure affected by
the age, sex, marital status distribution of the
population as also the fertility rates of married
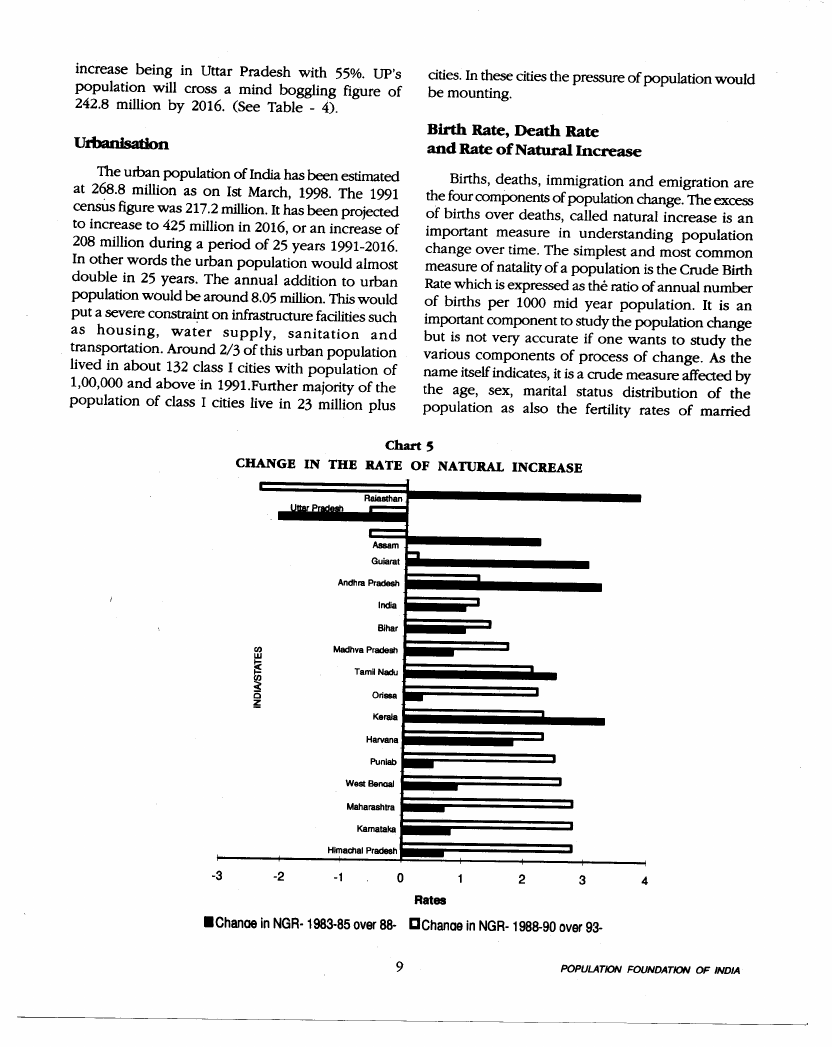
Chart 5
CHANGE IN THE RATE OF NATURAL INCREASE
--., Ralasthan
Assam
Guiarat
Andhra Pradesh
Indla
Bihar
lewine
~
~0
Madhva Pradesh
TamiiNadu
Orissa
-
Kerala
-Harvana
Puniab
West BenoaJ
Maharashtra
Kamataka
Himachal Pradesh
Rates
• Chance in NGR·1983·85 over 88· CChanae in NGR- 1988-90 over 93-

2.5 Page 15

▲back to top


population. The difference between crude birth and
crude death rate determines the natural growth rate
of the population.
The India both CBRand CDRhave been declining.
While CBRdeclined by 2.3 points (from 30.8 to 28.5)
between 1988-90 and 1993-95, the decline was less
compared to previous 5 years both in absolute and
relative terms (see Table 5). Barring Rajasthan, in all
other states, CBR has declined during the last
quinquennium. In Andra Pradesh, Assam, Bihar,
Gujarat, Kerala, Tamil Nadu and UttarPradesh though
CBR has declined, the decline in the recent period
seems smaller than that of the previous quinquennium
both in absolute and relative terms. Even though
CBRhas declined less in Kerala and Tamil Nadu, this
is to be expected as these states have already reached
replacement fertility. In Haryana, Himachal Pradesh,
Karnataka, Madhya Pradesh, Maharashtra, Orissa,
Punjab and West Bengal, the CBRhas declined faster
during the quinquennium.
In Rajasthan CBR has remained constant, but
CDR has declined faster during the d~cade resulting
in an increase in natural growth rate during the recent
quinquennium from 22.3 to 24.7. Of the other five
states namely Andhra Pradesh, Bihar, Assam, Gujarat
and Uttar Pradesh where CBR decline has lost its
momentum, in Assam and Uttar Pradesh the decline
in birth rate is less than the decline in death rate. As
a result the rate of natural increase has gone up. In
the other three states, the birth rate decline though
smaller than previous five years, has been more than
decline in death rate, resulting in decline in natural
increase rate. Chart 5 presents the change in rate
natural increase in the recent five years 0988-90 over
1993-95) and the previous five years 0983-85 over
1988-90). A positive sign indicates decrease in NGR
while a negative sign indicates increase in NGR. In
Assam, Rajasthan and Uttar Pradesh NGR has
increased in last 5years. In Uttar Pradesh the increase
was noticed in previous five years also.
Of the remaining eight states where decline in
birth rate has accelerated during the recent
quinquennium, the rate of natural increase is falling
rapidly. Madhya Pradesh, long classified as a BIMARU
state seems to be reducing its rate of natural increase.
Whether it will continue its decline in the future
needs to be watched.

2.6 Page 16

▲back to top


5. Fertility
Total Fertility rate is a measure of the "completed
family size" Le. the average number of children women
will bear in their life time, if the current fertility
trends continue. It is a refined, age-sex adjusted measure
of fertility which can be used to compare the fertility
performances of different population groups or
different areas.
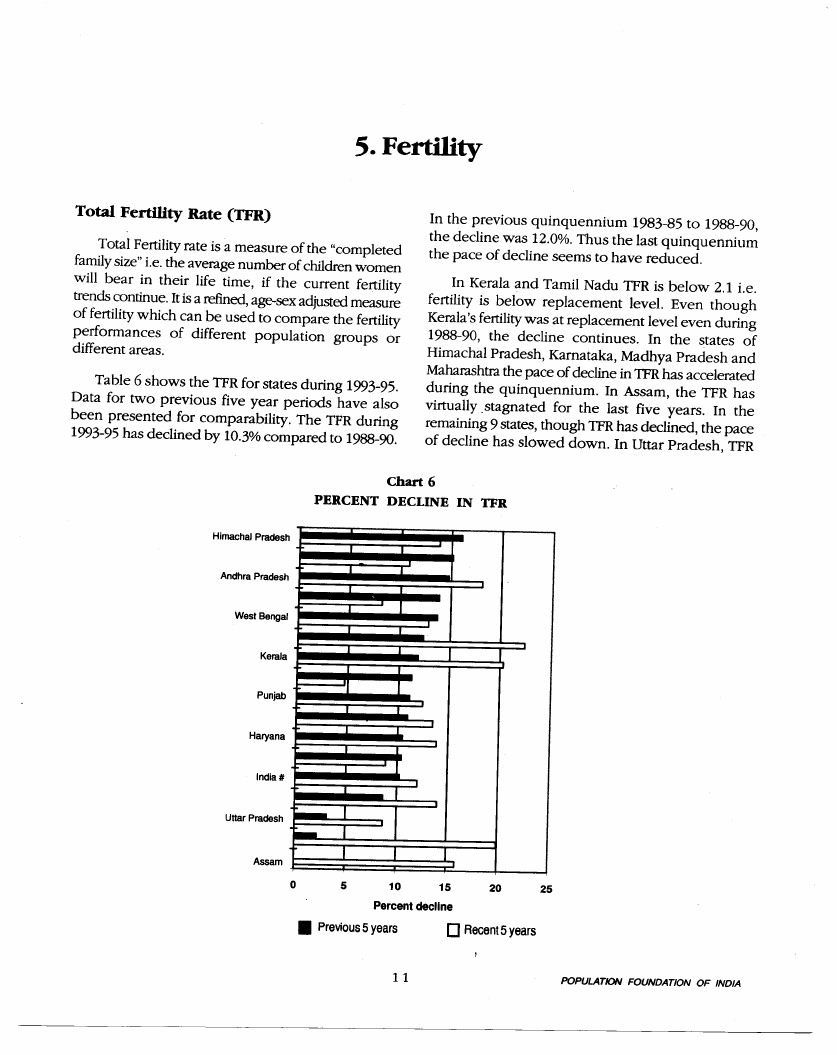
Table 6 shows the TFR for states during 1993-95.
Data for two previous five year periods have also
been presented for comparability. The TFR during
1993-95 has declined by 10.3% compared to 1988-90.
In the previous quinquennium 1983-85 to 1988-90,
the decline was 12.0%. Thus the last quinquennium
the pace of decline seems to have reduced.
In Kerala and Tamil Nadu TFR is below 2.1 Le.
fertility is below replacement level. Even though
Kerala's fertility was at replacement level even during
1988-90, the decline continues. In the states of
Himachal Pradesh, Karnataka, Madhya Pradesh and
Maharashtra the pace of decline in TFR has accelerated
during the quinquennium. In Assam, the TFR has
virtually.stagnated for the last five years. In the
remaining 9 states, though TFR has declined, the pace
of decline has slowed down. In Uttar Pradesh, TFR
Chart 6
PERCENT DECLINE IN TFR
I
I
I
I
I
I
I
,
I
I
I
I
I
I
I
I
I
------ I
I
I I
I
J
J
I

2.7 Page 17

▲back to top


is highest at 5.1, followed by Bihar and Rajasthan at
4.5.
Rural urban break-up of the TFRshows that even
in urban areas the rate of decline in TFRhas slowed
down considerably. While the TFRin rural and urban
areas of Kerala and Tamil Nadu are near replacement
level, the fertility in urban areas of Himachal Pradesh
and West Bengal are also below replacement level.
Surprisingly in the urban areas of Maharashtra which
contains the major metropolis of Bombay and Pune,
the TFR is still above replacement level. While the
urban TFR has declined in all states, in Assam and
Uttar Pradesh, it has increased during last five years.
Punjab is the only state where fertility decline has
accelerated during the last quinquennium.
While the rural TFR has declined during the last
5 years, the pace of decline seems to be petering out
in most of the states: Karnataka, Madhya Pradesh,
Maharashtra and West Bengal are the four states where
pace of decline has accelerated.
In short, the TFR figures released by SRSfor the
recent periods seem to indicate that fertilityis declining
but at a slower pace.
One of the important indicators to measure the
reproductive health of the women is the age specific
fertility rate in the age group 15-19; (ASFR 15-19)
defined as births per 1000 women in this age group
15-19.Pregnancies in this age group are usually termed
"Teenage Pregnancies". If this is high, the country
most probably has early marriage, high maternal
mortality and high infant mortality. In view of its
importance this has been accepted by U.N as one of
the indicators to monitor reproductive health.
Statewise data on ASFR 15-19 (see Table 3)
indicates that it is the lowest in Punjab. Even in
Kerala which has a relatively very high age at
marriage, the ASFR 05-19) is 27.6. In Madhya
Pradesh roughly one among eleven women in this
age group give birth to a child. The teenage
pregnancies are extra ordinarily high in Andhra
Pradesh being 114.3. Surprisingly even in other
backward states like Bihar, Rajasthan and Uttar
Pradesh, teenage pregnancies are not that high. The
traditional practice of 'Gauna' or cohabitating with
husband at a date much later than legal marriage may
be one of the reasons for'the low ASFRin these states
compared to Andhra Pradesh.

2.8 Page 18

▲back to top


6. Mortality
"It shall be the policy of the state to provide adequate services to children both before and after
birth and through theperiod of growth, to ensure theirfull physical, mental and social development.
The state shall increase the scope of such services so that within a reasonable time all children
in the country enjoy optimum conditions for their balanced growth"
- National Policy for Children 1974
The commitment made in the above National
policy, which flows directly from the directive
principles of Article 39 of the Constitution of India,
got further momentum when Govt. of India
endorsed all the Child survival goals for the year
2000 agreed by the World Summit for children in
1990. The convention on the Rights of child 1992
of which India was a signatory further enunciated
the child's right as right to survival, right to
protection, right to development and the right to
participation.
Of these rights the most important one is the
right to survival of the child. Infant mortality and
mortality below age 5 are two important measures
which help to monitor the progress in this direction.
Perinatal mortality rate i.e. number of still births
plus deaths during the first week of life, to total
number of live and still births, is another useful
indicator which directly reflects on the health care
of mother at pregnancy and at delivery.
In India the infant death rate is very high being
72 per 1000 live births in 1996. Out of an estimated
8.26 million infant deaths occurring in the world,
roughly 1.86 million or 22.5% occurs in India.
China whose population is approximately 30%
above India's population and has an Infant mortality
rate of 37 accounts for less than half of infant
deaths in India.
Levels of Infant Mortality Rate
Infant mortality rate varies from a low figure
of 14 in Kerala to a high 97 in Madhya Pradesh (Table
7). It is also very high in the states of Orissa, Rajasthan
and Uttar Pradesh. Published figures for Bihar indicate
that it is almost dose to national average. The states
of Bihar, Madhya Pradesh, Orissa, Rajasthan and Uttar
Pradesh which account for 43.7% of India's population
account for 60% of infant deaths. At the other extreme
is Kerala with 3.3% of India's population contributing
to onlv, 0.4% of infant deaths of India.
DecUne in Infant Mortality Rate
Though the levels of infant mortality rate are
high, the last decade has witnessed continuous
decline in the rate. In the last 5 years the pace of
decline has accelerated compared to the previous
5 years, both in rural and urban areas. Such an
acceleration is noticed in most of the states. Despite
the declining trend noticed, the absolute level of
infant mortality rate continues to remain high even
in urban areas of India. Since health facilities and
personnel are generally believed to be concentrated
in urban areas, the persistent urban high infant
mortality rate suggests the need for a different
approach to reduce infant mortality rate in urban
areas. Special programmes of mother and child
health for slum populations, such as provision of
better ante-natal and post-natal care and
hospitalisation facilities at the time of delivery are
some possible directions in which we have to
move. Adequate nutrition for pregnant woman and
children, safe drinking water and sanitation,
particularly in slum areas would also need to be
emphasised if the infant mortality rate in urban
areas are to be reduced.

2.9 Page 19

▲back to top


PerinataJ,Neonatai
and Post Neonatal Mortality
Because of the very high levels of mortality in the
first few hours, days and weeks of life and the
differences in the cause of deaths at earlier and
later stages of infancy, it is customary to break down
the conventional infant mortality rate into rates
covering first month or so (neonatal) and the remaining
months of the year (post neonatal).
The mortality in the first week of birth is often
due to causes different from those causing deaths
later in the first month of life. This mortality is
much more direct measure of the quality of maternal
services such as identifying and monitoring high
risk pregnancies, providing such woman special
care at the time of delivery.
At the national level perinatal mortality rate is
43.8 per thousand births. It varies from 61.4 in Orissa
to 17.7 in Kerala (See Table 8). The fact that Kerala's
perinatal mortality is more than Infant mortality rate
seems very significant. This is because the still birth
rate is still high in Kerala relative to its infant mortality
rate. When still births are added to the number of
deaths in first week, the resultant perinatal mortality
rate seems significant. In future Kerala's infant
mortality rate can be brought down only by reducing
the still births. and this should be the priority for
Kerala's MCH programme.
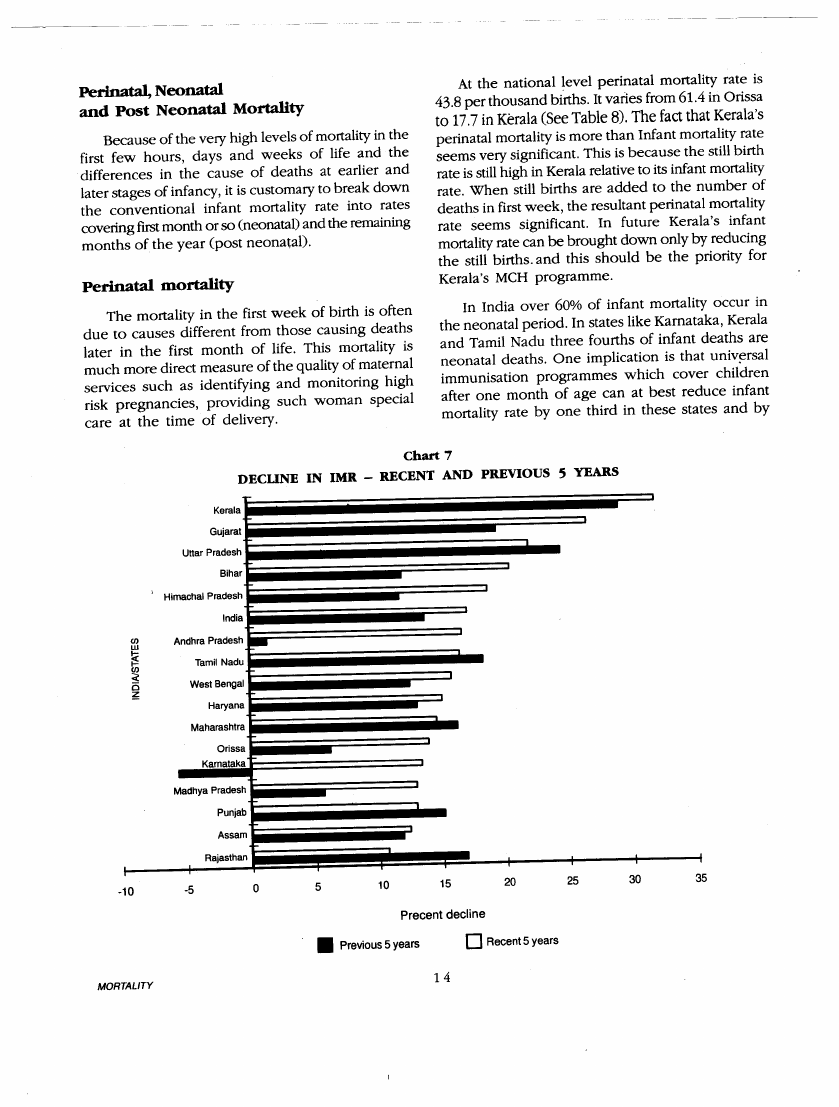
In India over 60% of infant mortality occur in
the neonatal period. In states like Karnataka, Kerala
and Tamil Nadu three fourths of infant deaths are
neonatal deaths. One implication is that univ~rsal
immunisation programmes which cover children
after one month of age can at best reduce infant
mortality rate by one third in these states and by
Chart 7
DECUNE IN IMR - RECENT AND PREVIOUS 5 YEARS
Kerala
Gujarat
Uttar Pradesh
Bihar
I
Himachal Pradesh
India
ewn
!cc
~ Andhra Pradesh
eI-n'
Tamil Nadu
;;C
0~
West Bengal
Haryana
Maharashtra
Orissa
Karnataka
Madhya Pradesh
Punjab
Assam
Rajasthan
,
,
.
,

2.10 Page 20

▲back to top


40% at national level. To reduce the infant mortality
rate further it is essential that quality of ante-natal and
post natal services are provided to all pregnant women
anQ mothers. IT immunisation, combating anaemia
among mothers, provision for safe delivery and peri-
natal care are the important measures by which infant
mortality rate can be reduced in future, below a level
of 40 at national level.
mortality. In Bihar, Gujarat, Haryana, Punjab and
West Bengal also female child mortality is higher than
the males. Only in the four southern states of Andhra
Pradesh, Kamataka, Kerala, Tamil Nadu and the state
of Himachal Pradesh in the north, the female child
mortality is lower than male mortality. In Orissa also
the differences are insignificant.
While infant mortality has been traditionally
considered as a sensitive indicator of child mortality,
in recent years under five mortality i.e. number of
deaths below age five per 1000 live births has been
increasingly used to monitor the goals of improving
child health. The causes underlying the mortality
of children under five are different from those of
infant mortality. Malnutrition, exposure to infectious
and parasite diseases due to unhygienic and
insanitary conditions, lack of child care and
at~ention, accidents are some of the· important
factors contributing to high child mortality. This
again is the age group where gender differentials
begin to emerge significantly.
The q(5) has declined from an estimated level
of 282 per 1000 live births in 1960 to 161 in 1983
and to 113 during 1991-95, centred at 1993. Even
today one in nine live births do not live to celebrate
their 5th birthday. While only 20 per 1000 live
births die before age 5 in Kerala, the mortality rate
is more than eight times this value in Madhya
Pradesh, Assam, Orissa, Rajasthan and Uttar Pradesh.
Even though q(5) is very high in Assam and Orissa,
the male female differentials are not significant. In
Madhya Pradesh, Rajasthan and Uttar Pradesh female
children are exposed to significantly higher risk of
The average life span of a child born in India has
increased from 32.1 years during the decade 1941-51,
centred around 1946 to 57.3 years during 81-91 and
to 60.3 years during 1991-95. This increase is largely
attributable to various programmes of public health
and control of communicable diseases.
Kerala has a life expectancy of 72.9 years followed
by Punjab with 67.2 years. Madhya Pradesh with a
life expectancy of 54.7 years is at the other end of the
spectrum. Himachal Pradesh and Maharashtra are close
to 65 years.
The female life expectancy is 60.9 years against
59.7 years for males. During the fifty year period
1930-1980, female life expectancy was behind that
of males. This trend has changed during the 80's
& 90's. Even now in the states of Bihar, Madhya
Pradesh, Orissa, Rajasthan and Uttar Pradesh, female
life expectancy is lower than that of males. Of
these, except in Orissa, child mortality is higher
for females than males. The life expectancy in the
urban areas is higher than the rural areas,by about
six years at the national level. In the state of Bihar,
Madhya Pradesh, Rajasthan and Uttar Pradesh the
rural urban differentials are still higher. In Gujarat,
Kerala, Maharashtra, Punjab the rural-urban
differentials are relatively less, probably due
to better spread of health infrastructure and
better provisions for road transport and
communication.

3 Pages 21-30

▲back to top


3.1 Page 21

▲back to top


7. Educational Level
"The state shall endeavour to provide within a period of ten years from the
commencement of this Constitution, for free and compulsory education for
all children until they complete the age of 14 years. "
- Constitution of India (1950) Article 45
While the constitution has directed the state to
make all out efforts to achieve the goal in 10 years,
the goal is still far away, 48 years after the adoption
of the constitution of India. While 18.7 million 03.8
million boys and 4.9 million girls) were enrolled in
primary schools in 1951, the number has gone up by
six times in 1996 to 1l0A million (62.5 boys and 47.9
million girls). Children in primary school are usually
in the age group 6-10. Primary school gross enrolment
ratios calculated as the ratio of children enrolled in
classes I to V to children aged 6-10, has gone upto
98.6% in case of boys and 81.8% in case of girls. In
the middle school (VI to VIII), the corresponding
figures are 70.8% and 52:8% respectively. However
the primary school enrolment figures are notorious
for their inaccuracies. Often these are more than 100
for many states. Not all children who attend the
classes I to V are in age group 6-10. In rural areas often
children above 10 years are also enrolled in classes 1-
V. In urban areas children below 6 years are enrolled
in schools. Drop out rates are also very high in primary
stage. It is for this reason that the enrolment ratio at
middle school level (classes VI to VIII)have been used
in this report.
Among the major states the middle school
enrolment ratio is highest in Tamil Nadu for males
and in Kerala for females being 96.6% and 91.7%
respectively (Table 9). In Kerala and West Bengal
the enrolment ratio for males is over 90%. The
enrolment ratio is only 44.2% for males and 24.8%
for females in Bihar. In Rajasthan and Uttar Pradesh
one in three girls are enrolled in classes VI to VIII,
slightly better than Bihar.
Adult literacy Rate
The adult literacy rate is defined as literacy rate
in population aged 15 and above. The rate is very
low in India being only 48.2% in 1991. In other
words every alternate adult Indian is illiterate.
Genderwise the disparities are very high. While 61.6%
of adult males were literate, only 33.7% of adult
females were literate. By 1995, it is estimated that
adult literacy rate would have crossed 50% mark.
Thus for the first time in Indian history, there will
be more literates than illiterates in the adult population.
As in case of other parameters, wide disparities
exist between states in adult literacy rate. Kerala
with 92.2% adult literacy rate and Rajasthan with
only 38.3% literate are at two extreme ends.
Maharashtra with an estimated 64.2% literates in
1995 is way behind Kerala. Surprisingly the small
hilly state of Himachal Pradesh is very close to
Maharashtra with 63.3% literates.
Number of literates is estimated to have
increased from around 251.5 million in 1991 to
293.9 million in 1995, showing an increase of 51.4
million. Simultaneously the number of illiterates
has also increased from 270 million in 1991 to 276
million in 1996, 106 million males and 170 million
females.This constitutes roughly 1/3rd of world's
illiterates.
Wide disparities are noticed between males
and females. While at national level, female adult
literacy rate of 37.6% is more than half of male
adult literacy rate of 64:22%, in Rajasthan the gap
is the largest. Only slightly over 18% of females
are literate.

3.2 Page 22

▲back to top


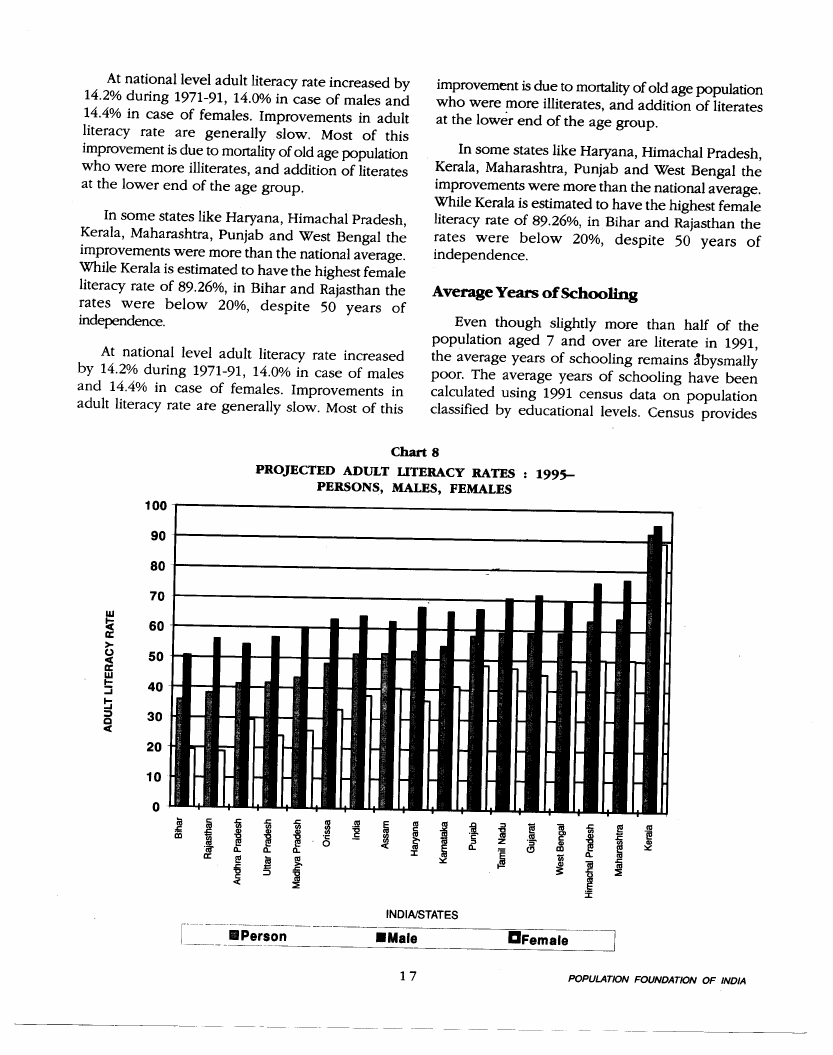
At national level adult literacy rate increased by
14.2% during 1971-91, 14.0% in case of males and
14.4% in case of females. Improvements in adult
literacy rate are generally slow. Most of this
improvement is due to mortality of old age population
who were more illiterates, and addition of literates
at the lower end of the age group.
In some states like Haryana, Himachal Pradesh,
Kerala, Maharashtra, Punjab and West Bengal the
improvements were more than the national average.
While Kerala is estimated to have the highest female
literacy rate of 89.260/0,in Bihar and Rajasthan the
rates were below 20%, despite SO years of
independence.
At national level adult literacy rate increased
by 14.2% during 1971-91, 14.0% in case of males
and 14.4% in case of females. Improvements in
adult literacy rate are generally slow. Most of this
improvement is due to mortality of old age population
who were more illiterates, and addition of literates
at the lower end of the age group.
In some states like Haryana, Himachal Pradesh,
Kerala, Maharashtra, Punjab and West Bengal the
improvements were more than the national average.
While Kerala is estimated to have the highest female
literacy rate of 89.26%, in Bihar and Rajasthan the
rates were below 20%, despite SO years of
independence.
Even though slightly more than half of the
population aged 7 and over are literate in 1991,
the average years of schooling remains :!bysmally
poor. The average years of schooling have been
calculated using 1991 census data on population
classified by educational levels. Census provides
Chart 8
PROJECTED ADULT UTERACY RATES
PERSONS, MALES, FEMALES
1995-
30
20
10
0
lil
&;
CD
tai ~
~
Q.
a:
.Ic!!
"ct:I
<
.c
III
~
Q.
lil
:=::l
.c
III
~
~
'C
0
.!!l
~
Q.
.~c
i
:E
~
~
III
~
:r:
i~
::>
Q.
:~.c
::>
i
Z
~
li!
.ISII '
(!)
1g\\1>
CIl
CD
"0
~
.c
III
~
Q.
1.c\\1
~
-~;j
:E
III
1!!
:C.cIl
:.r~:
INDIA/STATES
_Male

3.3 Page 23

▲back to top


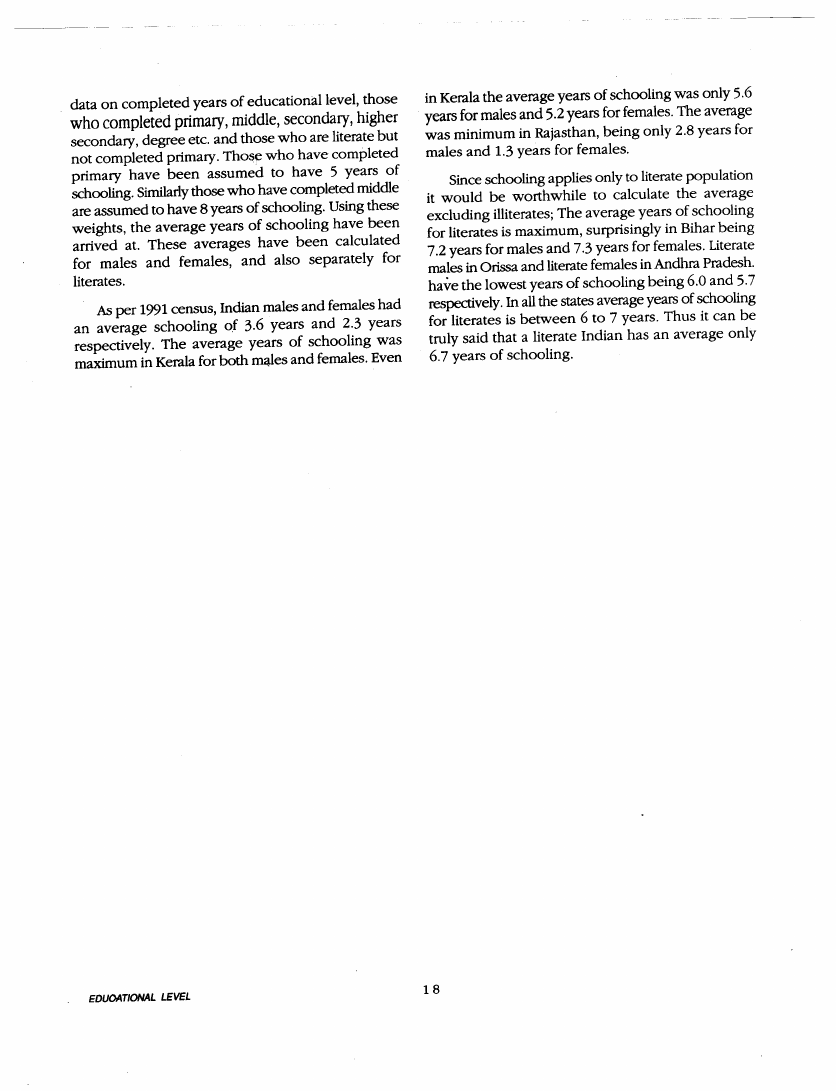
data on completed years of educational level, those
who completed primary, middle, secondary, higher
secondary, degree etc. and those who are literate but
not completed primary. Tho~e who have completed
primary have been assumed to have 5 years of
schooling. Similarlythose who have completed middle
are assumed to have 8 years of schooling. Using these
weights, the average years of schooling have been
arrived at. These averages have been calculated
for males and females, and also separately for
literates.
As per 1991census, Indian males and females had
an average schooling of 3.6 years and 2.3 years
respectively. The average years of schooling was
maximum in Kerala for both m~es and females. Even
in Kerala the average years of schooling was only 5.6
years for males and 5.2 years for females. The average
was minimum in Rajasthan, being only 2.8 years for
males and 1.3 years for females.
Since schooling applies only to literate population
it would be worthwhile to calculate the average
excluding illiterates; The average years of schooling
for literates is maximum, surprisingly in Bihar being
7.2 years for males and 7.3 years for females. Literate
males in Orissa and literate females in Andhra Pradesh.
have the lowest years of schooling being 6.0 and 5.7
respectively.In allthe states average years of schooling
for literates is between 6 to 7 years. Thus it can be
truly said that a literate Indian has an average only
6.7 years of schooling.

3.4 Page 24

▲back to top


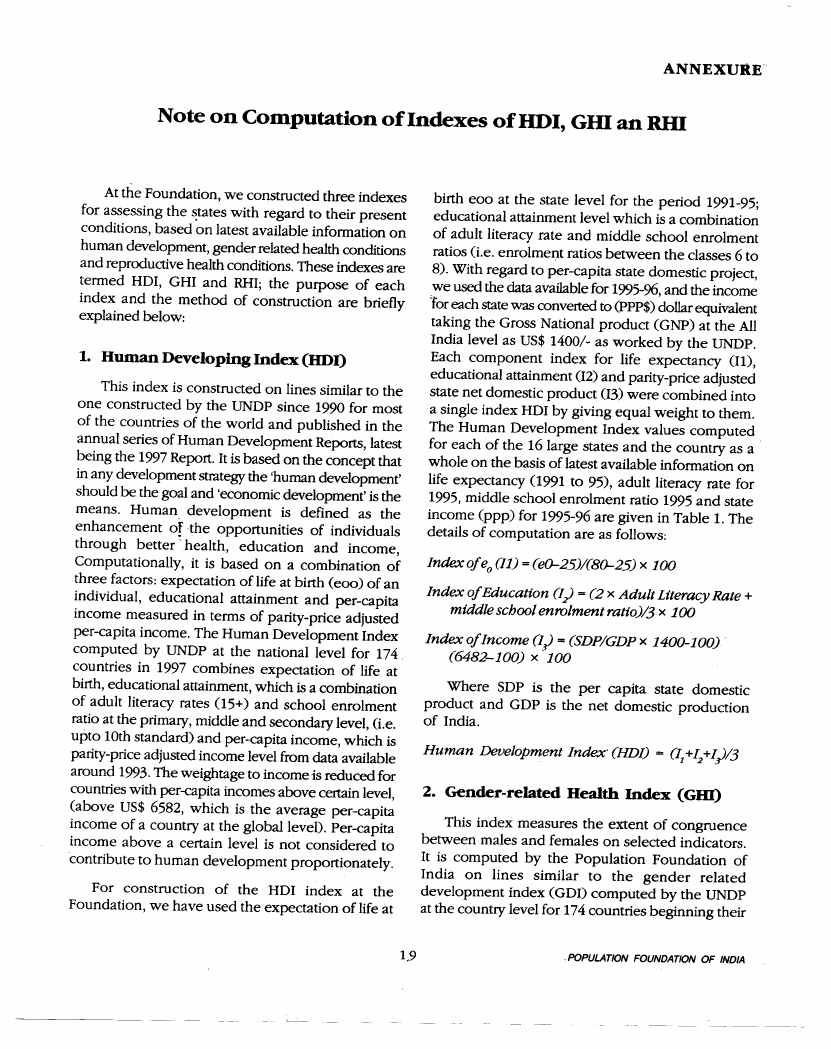
Note on Computation of Indexes ofHDI, Gill an RHI
At the Foundation, we constructed three indexes
for assessing the ~tates with regard to their present
conditions, based on latest available information on
human development, gender related health conditions
and reproductive health conditions. These indexes are
termed HDI, GHI and RHI; the purpose of each
index and the method of construction are briefly
explained below:
This index is constructed on lines similar to the
one constructed by the UNDP since 1990 for most
of the countries of the world and published in the
annual series of Human Development Reports, latest
being the 1997 Report. It is based on the concept that
in any development strategy the 'human development'
should be the goal and 'economic development' is the
means. Human development is defined as the
enhancement of the opportunities of individuals
through better 'health, education and income,
Computationally, it is based on a combination of
three factors: expectation of life at birth (eoo) of an
individual, educational attainment and per-capita
income measured in terms of parity-price adjusted
per-capita income. The Human Development Index
computed by UNDP at the national level for 174
countries in 1997 combines expectation of life at
birth, educational attainment, which is a combination
of adult literacy rates 05+) and school enrolment
ratio at the primary, middle and secondary level, (Le.
upto 10th standard) and per-capita income, which is
parity-price adjusted income level from data available
around 1993.The weightage to income is reduced for
countries with per-eapita incomes above certain level,
(above US$ 6582, which is the average per-capita
income of a country at the globalleveO. Per-capita
income above a certain level is not considered to
contribute to human development proportionately.
For construction of the HDI index at the
Foundation, we have used the expectation of life at
birth eoo at the state level for the period 1991-95;
educational attainment level which is a combination
of adult literacy rate and middle school enrolment
ratios (Le. enrolment ratios between the classes 6 to
8). With regard to per-capita state domestic project,
we used the data available for 1995-96,and the income
'foreach state was converted to (Ppp$) dollar equivalent
taking the Gross National product (GNP) at the All
India level as US$ 1400/- as worked by the UNDP.
Each component index for life expectancy (1),
educational attainment (2) and parity-price adjusted
state net domestic product (3) were combined into
a single index HDI by giving equal weight to them.
The Human Development Index values computed
for each of the 16 large states and the country as a
whole on the basis of latest available information on
life expectancy 0991 to 95), adult literacy rate for
1995, middle school enrolment ratio 1995 and state
income (ppp) for 1995-96 are given in Table 1. The
details of computation are as follows:
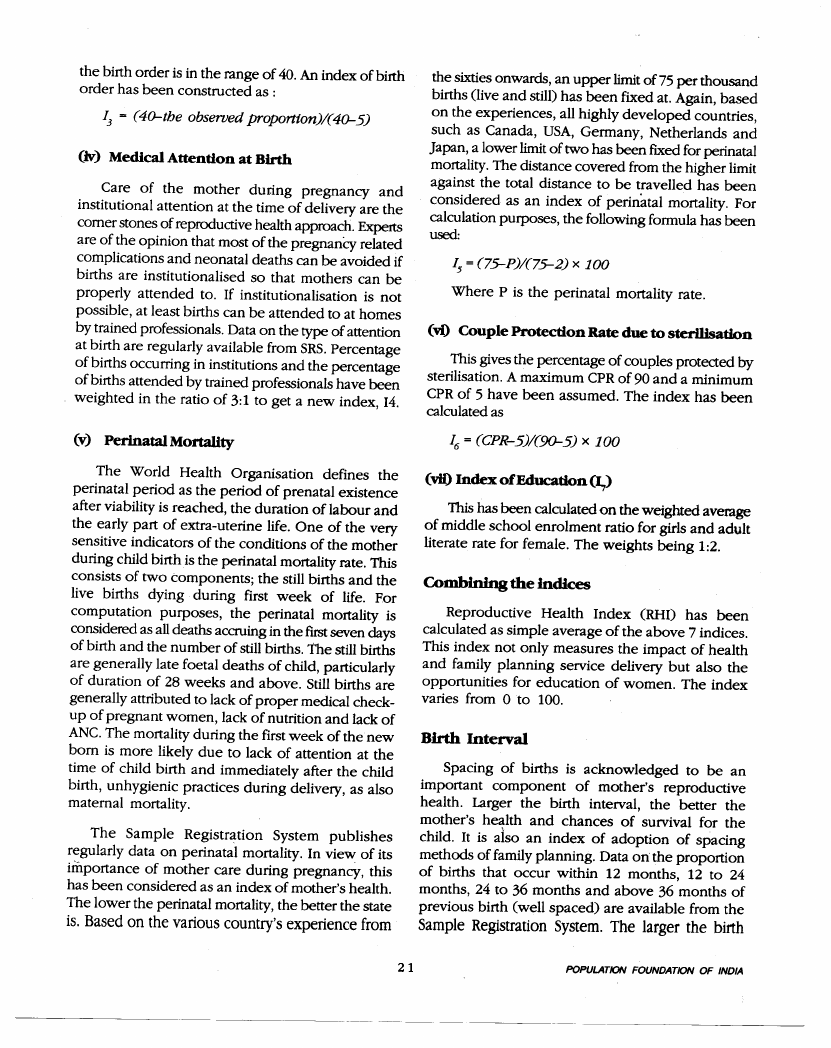
Index of eo (11) = (eG-25)/(8G-25) x 100
Index of Education (1) = (2 x Adult Literacy Rate +
middle school enrolment ratio)/3 x 100
Index of Income (1) = (SDP/GDP x 1400-100)'
(6482-100) x 100
Where SOP is the per capita state domestic
product and GDP is the net domestic production
of India.
This index measures the extent of congruence
between males and females on selected indicators.
It is computed by the Population Foundation of
India on lines similar to the gender related
development index (GOO computed by the UNDP
at the country level for 174 countries beginning their

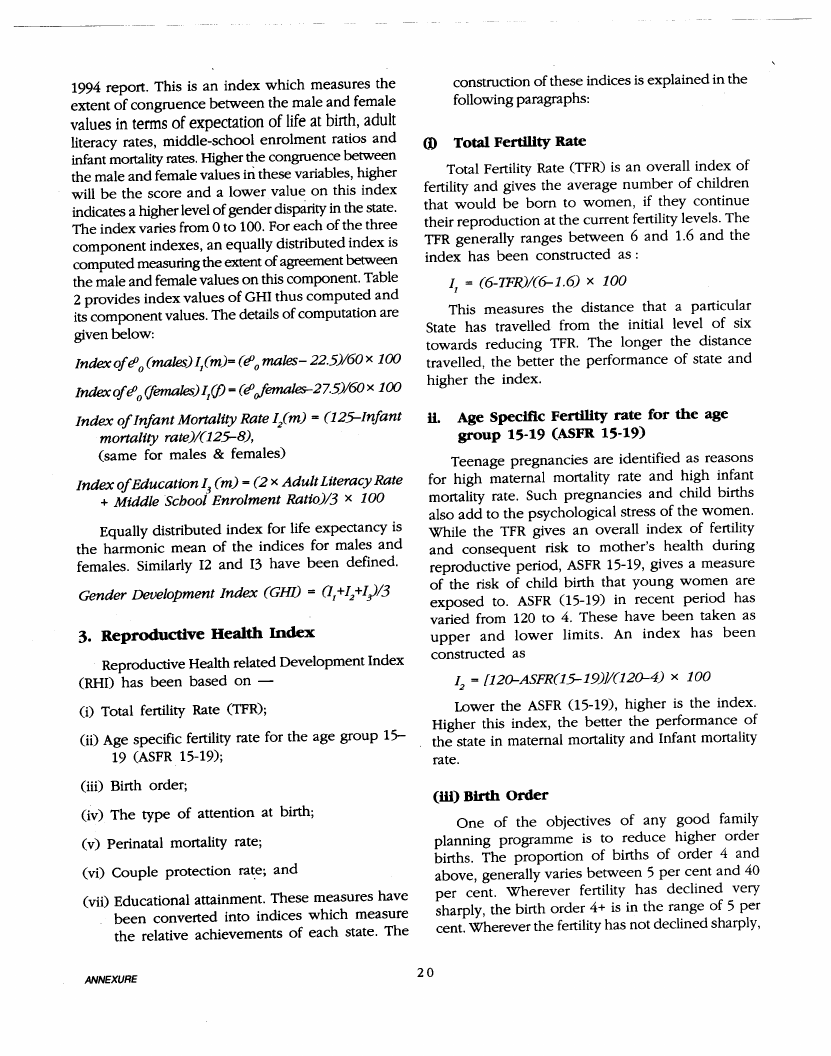
3.5 Page 25

▲back to top


1994 report. This is an index which measures the
extent of congruence between the male and female
values in terms of expectation of life at birth, adult
literacy rates, middle-school enrolment ratios and
infant mortality rates. Higher the congruence between
the male and female values in these variables, higher
will be the score and a lower value on this index
indicates a higher level of gender disparity in the state.
The index varies from 0 to 100. For each of the three
component indexes, an equally distributed index is
computed measuring the extent of agreement between
the male and female values on this component. Table
2 provides index values of GHI thus computed and
its component values. The details of computation are
given below:
Index of (/J0 (males) 1/m)= ((/J 0 males- 22.5)/60 x 100
Index of (/Jo (females)It(fJ = ((/Ja!emales-27.5)/60 x 100
Index of Infant Mortality Rate II m) = (J 2~Infant
mortality rate)/(J2~8),
(same for males & females)
Index of Education 13(m) = (2 x Adult Literacy Rate
+ Middle School Enrolment Ratio)/3 x 100
Equally distributed index for life expectancy is
the harmonic mean of the indices for males and
females. Similarly 12 and 13 have been defined.
Gender Development Index (GHI) = (It+12+/)/3
Reproductive Health related Development Index
(RHO has been based on -
CO Total fertility Rate (TFR);
(ii) Age specific fertility rate for the age group 15-
19 (ASFR 15-19);
(iii) Birth order;
(iv) The type of attention at birth;
(v) Perinatal mortality rate;
(vi) Couple protection rate; and
(vii) Educational attainment. These measures have
been converted into indices which measure
the relative achievements of each state. The
construction of these indices is explained in the
follOWing paragraphs:
CD Total Fertility Rate
Total Fertility Rate (TFR) is an overall index of
fertility and gives the average number of children
that would be born to women, if they continue
their reproduction at the current fertility levels. The
TFR generally ranges between 6 and 1.6 and the
index has been constructed as:
It = (6-TFR)/(6-1.6) x 100
This measures the distance that a particular
State has travelled from the initial level of six
towards reducing TFR. The longer the distance
travelled, the better the performance of state and
higher the index.
if. Age Specific Fertility rate for the age
group 15-19 (ASFR 15-19)
Teenage pregnancies are identified as reasons
for high maternal mortality rate and high infant
mortality rate. Such pregnancies and child births
also add to the psychological stress of the women.
While the TFR gives an overall index of fertility
and consequent risk to mother's health during
reproductive period, ASFR 15-19, gives a measure
of the risk of child birth that young women are
exposed to. ASFR 05-19) in recent period has
varied from 120 to 4. These have been taken as
upper and lower limits. An index has been
constructed as
1 = [12o-ASFR(J~19)}/(J2o-4) x 100
2
Lower the ASFR 05-19), higher is the index.
Higher this index, the better the performance of
the state in maternal mortality and Infant mortality
rate.
(ill) Birth Order
One of the objectives of any good family
planning programme is to reduce higher order
births. The proportion of births of order 4 and
above, generally varies between 5 per cent and 40
per cent. Wherever fertility has declined very
sharply, the birth order 4+ is in the range of 5 per
cent. Wherever the fertility has not declined sharply,

3.6 Page 26

▲back to top


the birth order is in the range of 40. An index of birth
order has been constructed as :
Care of the mother during pregnancy and
institutional attention at the time of delivery are the
comer stones of reproductive health approach. Experts
are of the opinion that most of the pregnanCy related
complications and neonatal deaths can be avoided if
births are institutionalised so that mothers can be
properly attended to. If institutionalisation is not
possible, at least births can be attended to at homes
by trained professionals. Data on the type of attention
at birth are regularly available from SRS.Percentage
of births occurring in institutions and the percentage
of births attended by trained professionals have been
weighted in the ratio of 3:1 to get a new index, 14.
the sixties onwards, an upper limitof 7S per thousand
births (live and still) has been fixed at. Again, based
on the experiences, all highly developed countries,
such as Canada, USA, Germany, Netherlands and
Japan, a lower limit of two has been ftxed for perinatal
mortality. The distance covered from the higher limit
against the total distance to be travelled has been
considered as an index of perinatal mortality. For
calculation purposes, the following formula has been
used:
1= (75-P)/(75-2) x 100
5
Where P is the perinatal mortality rate.
(~ Couple Protection Rate due to sterllisadon
This gives the percentage of couples protected by
sterilisation. A maximum CPR of 90 and a minimum
CPR of S have been assumed. The index has been
calculated as
The World Health Organisation defines the
perinatal period as the period of prenatal existence
after viability is reached, the duration of labour and
the early part of extra-uterine life. One of the very
sensitive indicators of the conditions of the mother
during child birth is the perinatal mortality rate. This
consists of two components; the still births and the
live births dying during first week of life. For
computation purposes, the perinatal mortality is
considered as all deaths accruing in the ftrstseven days
of birth and the number of still births. The still births
are generally late foetal deaths of child, particularly
of duration of 28 weeks and above. Still births are
generally attributed to lack of proper medical check-
up of pregnant women, lack of nutrition and lack of
ANC.The mortality during the first week of the new
born is more likely due to lack of attention at the
time of child birth and immediately after the child
birth, unhygienic practices during delivery, as also
maternal mortality.
The Sample Registration System publishes
regularly data on perinatal mortality. In view of its
importance of mother care during pregnancy, this
has been considered as an index of mother's health.
The lower the perinatal mortality, the better the state
is. Based on the various country's experience from
(vii) Index ofEducadon (I.,)
This has been calculated on the weighted average
of middle school enrolment ratio for girls and adult
literate rate for female. The weights being 1:2.
Reproductive Health Index (RHO has been
calculated as simple average of the above 7 indices.
This index not only measures the impact of health
and family planning service delivery but also the
opportunities for education of women. The index
varies from 0 to 100.
Spacing of births is acknowledged to be an
important component of mother's reproductive
health. Larger the birth interval, the better the
mother's health and chances of survival for the
child. It is also an index of adoption of spacing
methods of family planning. Data on the proportion
of births that occur within 12 months, 12 to 24
months, 24 to 36 months and above 36 months of
previous birth (well spaced) are available from the
Sample Registration System. The larger the birth

3.7 Page 27

▲back to top


INDIA
BIHAR
RAJASTHAN
UITAR PRADESH
WEST BENGAL
1993
1995
1993
1995
1993
1995
1993
1995
1993
1995
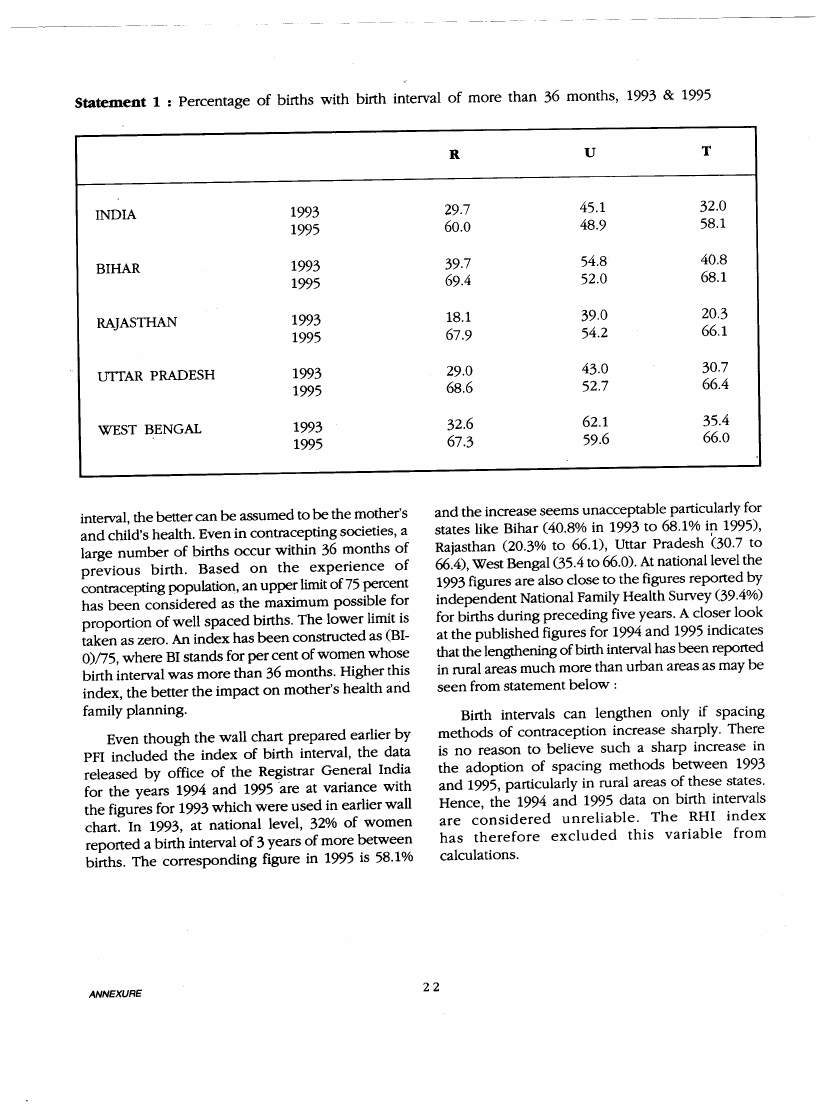
29.7
45.1
32.0
60.0
48.9
58.1
39.7
54.8
40.8
69.4
52.0
68.1
18.1
39.0
20.3
67.9
54.2
66.1
29.0
43.0
30.7
68.6
52.7
66.4
32.6
62.1
35.4
67.3
59.6
66.0
intetval, the better can be assumed to be the mother's
and child's health. Even in contracepting societies, a
large number of births occur within 36 months of
previous birth. Based on the experience of
contracepting population, an upper limitof 75 percent
has been considered as the maximum possible for
proportion of well spaced births. The lower limit is
taken as zero. An index has been constructed as (BI-
0)n5, where BI stands for per cent of women whose
birth intetval was more than 36 months. Higher this
index, the better the impact on mother's health and
family planning.
Even though the wall chart prepared earlier by
PFI included the index of birth intetval, the data
released by office of the Registrar General India
for the years 1994 and 1995 'are at variance with
the figures for 1993 which were used in earlier wall
chart. In 1993, at national level, 32% of women
reported a birth intetval of 3 years of more between
births. The corresponding figure in 1995 is 58.1%
and the increase seems unacceptable particularly for
states like Bihar (40.8% in 1993 to 68.1% in 1995),
Rajasthan (20.3% to 66.1), Uttar Pradesh (30.7 to
66.4), West Bengal (35.4 to 66.0). At national level the
1993 figures are also close to the figures reported by
independent National Family Health Sutvey (39.4%)
for births during preceding five years. A closer look
at the published figures for 1994 and 1995 indicates
that the lengthening of birth intetval has been reported
in rural areas much more than urban areas as may be
seen from statement below:
Birth intetvals can lengthen only if spacing
methods of contraception increase sharply. There
is no reason to believe such a sharp increase in
the adoption of spacing methods between 1993
and 1995, particularly in rural areas of these states.
Hence, the 1994 and 1995 data on birth intetvals
are considered unreliable. The RHI index
has therefore excluded this variable from
calculations.

3.8 Page 28

▲back to top


TABLES

3.9 Page 29

▲back to top


3.10 Page 30

▲back to top


Table 1 : HUMAN DEVELOPMENT INDEX( IIDI)- INDIA & MAJOR STATES 1995
India and States Expectation Index of life
of life at birth expectancy
1991-95
Middle
School
Enrolment
Ratio, 1995
Projected
Adult
Literacy Rate
05+) 1995
Index of
Education
Per
Capita
SOP,
1995-96
Index of Human
SDP Development
Index
(HDI)
1
2
3
4
5
6
7
8
9
Persons
Persons
Persons
India
60.3
Andhra Pradesh
61.8
Assam
55.7
Bihar
59.3
Gujarat
61.0
Haryana
63.4
Himachal Pradesh 64.5
IV
Kamataka
62.5
V\\
Kerala
72.9
Madhya Pradesh
54.7
Maharashtra
64.8
Orissa
56.5
Punjab
67.2
Rajasthan
59.1
Tamil Nadu
63.3
Uttar Pradesh
56.8
West Bengal
62.1
58.79
61.34
51.22
57.12
60.07
64.07
65.81
62.50
79.85
49.56
66.29
52.52
70.40
56.84
63.88
52.98
61.78
62.3
45.6
71.8
35.5
67.2
60.7
79.3
61.1
93.9
61.8
81.6
54.9
62.9
56.2
91.2
.49.0
87.1
51.5
41.4
51.9
35.9
59.0
52.8
63.3
54.4
92:2
43.5
64.2
48.2
58.0
38.3'
59.0
41.8
59.1
55.10
9578
20.37
45
42.79
8615
18.16
41
58.50
6192
12.61
41
35.78
4097
7.82
34
61.74
11036
23.71
49
55.41
13770
29.97
50
68.63
8747
18.47
51
56.65
9004
19.06
46
92.80
49.57
8324
17.50
63
6518
13.36
37
70.02
15244
33.35
57
50.42
6079
12.36
38
59.66
15504
33.94
55
44.24
6958
14.37
38
69.73
9868
21.03
52
44.17
5983
12.14
36
68.44
7851
16.41
49
~
~
§
Source:
1. Col. 2, Life Tables 1991-95, Office of The Registrar General, India
2. Col. 4, Selected Educational Statistics,1996-97, Department of Education, Ministry of Human Resource
~
Development, Government of India.
~
!Z
3. Col. 5, Projected by PFI based on 1971,81,91 Census data.
=:!
4. Col. 7, Economic Survey 1997-98, Ministry Of Finance, Government of India.
~
~
~
tsoj

4 Pages 31-40

▲back to top


4.1 Page 31

▲back to top


~
Table 2 : GENDER RELATED REALm INDEX (GHI): INDIA AND MAJOR STATES 1995
IR
m
India and States Expectation
Index Equally Infant
Index EqUally Middle
Projected
Index of Equally Gender
of life
of life distri- Mortality of Infant distributed School
Adult
education distri- Health
at birth
expectancy buted Rate, Mortality index of Enroiment literacy rate
buted Index
1991-95
ffidex 1995
Infant Ratio
05+)
index of
of eo
mortality 1995
1995
education
1
2
3
4
5
67 8 9
10 11 12 13 14 15 16
17 18 19
Males Females Males Females
Males Females Males Ferna1es Males Females
India
59.7
Andhra Pradesh 60.3
Assam
55.7
Bihar
60.1
Gujarat
60.2
Haryana
63.0
Himachal Pradesh 64.1
N Karnataka
60.6
0\\ Kerala
69.9
Madhya Pradesh 54.7
Maharashtra
63.5
Orissa
56.6
Punjab
66.1
Rajasthan
58.3
Tamil Nadu
62.3
Uttar Pradesh
57.3
West Bengal
61.5
60.9 . 57.80 59.79 58.78 73 76 44.44 41.88 43.12 70.8 52.8 64.2 37.6 66.42 42.68 51. 97 51
62.8 58.87 63.02 60.87 65 69 51.28 47.86 49.51 51.2 39.6 54.3 29.5 53.25 32.87 40.65 50
56.1 51,24 51.85 51.54 80 73 38.46 44.44 41.24 82.9 60.1 62.3 40.4 69.14 46.98 55.95 50
58.0 58.46 55.04 56.70 75 71 42.74 46.15 44.38 44.2 24.8 50.5 19.4 48.43 21.22 29.51 44
62.0 58.72 61.59 60.12 61 63 54.70 52.99 53.83 74.5 58.9 71.6 45.3 72.59 49.85 59.11 58
64.0 63.25 65.02 64.13 63 76 52.99 41.88 46.79 64.7 55.9 67.2 36.1 66.39 42.69 51.97 54
64.6 65.12 66.04 65.58 68 56 48.72 58.97 53.36 84.2 74.2 75.9 50.4 78.70 58.36 67.02 62
63.9 59.38 64.79 61.97 62 61 53.85 54.70 54.27 67.0 54.9 65.9 41.2 66.27 45.78 54.15 57
75.3 74.85 83.85 79.10 15 15 94.02 94 ..02 94.02 96.1 91.7 95.3 89.3 95.58 90.07 92.75 89
54.6 49.45 49.27 49.36 96 102 24.79 19.66 21.93 75.8 45.7 59.6 25.9 65.02 32.52 43.36 38
65.8 64.22 68.00 66.05 56 53 58.97 61.54 60.23 86.9 75.7 77.0 50.4 80.32 58.81 67.90 65
56.2 52.62 52.07 52.35 105 101 17.09 20.51 18.65 69.6 39.9 63.1 32.9 65.25 35.26 45.78 39
68.4 68.55 72.25 70.35 49 62 64.96 53.85 58.88 64.8 60.8 66.8 48.2 66.11 52.38 58.45 63
59.4 55.44 57.27 56.34 83 91 35.90 29.06 32.12 76.0 33.3 56.1 18.9 62.72 23.69 34.39 41
64.4 62.10 65.68 63.84 54 54 60.68 60.68 60.68 96.6 85.6 70.4 47.3 79.16 60.07 68.31 64
56.0 53.85 51.73 52.77 82 91 36.75 29.06 32.46 62.4 32.6 56.7 24.2 58.58 27.03 36.99 _41
62.8 60.89 62.97 61.91 58· 58 57.26 57.26 57.26 90.6 83.4 70.1 46.8 76.92 58.97 66.76 62
Source:
1. Cols. 2 & 3, Life Tables 1991-95, Office of The Registrar General, India
2. Cols.7 & 8, Sample Registration System, Office of The Registrar General, India
3. Cols.12 & 13, Selected Educational Statistics,1996-97, Department of Education,
Ministry of Human Resource Development, Government of India.
4. Cols. 14 &15, Projected byPFI based on 1971,81,91 Census data.

4.2 Page 32

▲back to top


India and States
Table 3: REPRODUCTIVE HEALm INDEX (RHI): INDIA AND MAJOR STATES 1995
Total
Fertility
Rate
1993-95
Index
of
TFR
Age Index Gouple Index
Specific of teen Protec-
of
Fertility ~ tion Rate Couple
Rate pregn- as on Protec-
(15-19),95 andes 31.3.96 tion
due to Rate due
sterilisa - to steri-
tion lisation
Birth
Ordet
(4+)
1995
Index
of
Medical
Atten-
tion
Medical
Attention
at Birth,
1995
Index
of
Medical
Atten-
tion
Perinatal
Rate
1993-
95
Index
. of
Peri-
natal
morta-
lity
Middle Projec-
School ted
enrol- Adult
ment Literacy
females Rate
1995 05+)
females
1995
Index Repro
of duetive
Edu- Health
cation Index
1
2
3
4
5
6
7
8
9
10
11
12
13
14 15 16
17 18
Inst. Tr. Prof.
India
35
56.82 55.2 56.35 30.2 29.65 25.4 41.71 25.2 28.2 25.95 43.8 42.74 52.8 37.6 42.68 42
Andhra Pradesh
2.7 75.00 114.3 4.96 38.8 39.76 12.0 80.00 41.9 27.0 38.18 48.4 36.39 39.6 295 32.87 44
Assam
3.5 56.06 52.6 58.61 18.2 1553 28.9 31.71 20.7 15.3 19.35 44.4 41.96 60.1 40.4 46.98 39
Bihar
4.6 32.58 51.5 59.57 19.7 17.29 35.3 13.43 14.7 1~.6 15.68 37.1 51.96 24.8 19.4 21.22 30
Gujarat
3.2 64.39 23.9 8357 38.6 3953 18.4 61.71 36.1 36.9 36.30 39.1 49.13 58.9 45.3 49.85 55
Haryana
3.7 52.27 565 55.22 33.9 34.00 20.6 55.43 24.2 67.3 34.98 41.4 46.07 55.9 36.1 42.69 46
N .....• Himachal Pradesh 2.8 72.73 28.4 79.65 40.7 42.00 12.8 77.71 23.5 25.6 24.03 35.3 54.43 74.2 50,4 58.36 58
Kamataka
2.8 72.73 50.3 60.61 42.8 44.47 175 64.29 49:3 25.1 43.25 53.7 29.13 54.9 41.2 45.78 51
Kerala
1.7 96.97 27.6 80.35 41.3 42.71 6.4 96.00 96.8
1.8 73.05 17.7 7854 91.7 89.3 90.07 80
Madhya Pradesh
4.2 40.91 94.4 22.26 275 26.47 26.3 39.14 13.9 21.1 15.70 53.3 29.77 45.7 25.9 3252 30
Maharashtra
2.9 70.45 55.4 56.17 40.1 41.29 18.5 61.43 475 20.1 40.65 38.6 49.82 75.7 50.4 58.81 54
Orissa
3.2 62.88 48.2 62.43 28.6 .27.76 23.1 48.29 13.3 22.4 1558 61.4 18.68 39.9 32.9 35.26 39
Punjab
2.9 69.70 11.7 94.17 38.8 39.76 17.0 65.71 12.4 85.8 30.75 32.0 58.95 60.8 48.2 52.38 59
Rajasthan
45 34.85 60.7 51.57 22.3 20.35 27.8 34.86 7.6 25.8 12.15 46.8 38.68 33.3 18.9 23.69 31
Tamil Nadu
2.1 87.88 37.8 71.48 42.3 43.88 8.3 90.57 64.2 20.8 53.35 45.7 40.09 85.6 47.3 60.07 64
Uttar Pradesh
5.1 20.45 42.1 67.74 195 17.06 35.9 11.71 7.2 41.6 15.80 45.3 40.68 32.6 24.2 27.03 29
West Bengal
2.9 69.70 66.7 46.35 29.0 28.24 20.0 57.14 35.8 13.4 30.20 40.2 47.67 83.4 46.8 58.97 48
~
~
:::!
Source:
1. Cols. 2,4,8,10,11&13, Sample Registration System, 0ffice of The Registrar General, India
~
2. Col.6,
Year Book 1995-96, Family Welfare Programme In India, Department of Family Welfare,
(g
Ministry of Health and Family Welfare, Government of India.
~
~
5~
3. Co1.15,
4. Co1.16,
Selected Educational Statistics, 1996-97, Department of Education,
Ministry of Human Resource Development, Government of India.
Projected by PFI based on 1971,81, 91 Census data.
~
~1::1
);

4.3 Page 33

▲back to top


l~Q
Table 4 : POPUlATION SIZE IN 1951,1991,1998 AND 2016 AND INDEX OF INCREASE,INDIA AND MAJORSTATES
Dl India and States
Population size in thousands
Index of increase
1951
1991
1998-
2016-
1951-98
1998-2016
1
India
Andhra Pradesh
Assam
Bihar
Gujarat
Haryana
Himachal Pradesh
Kamataka
N
CIJ
Kerala
Madhya Pradesh
Maharashtra
Orissa
Punjab
Rajasthan
Tamil Nadu
Uttar Pradesh
West Bengal
2
,361,088
31,115
8,029
38,782
16,263
5,674
2,386
19,402
13,549
26,071
32,003
14,646
9,161
15,971
30,119
63,220
26,300
3
846,303
66,508
22,414
86,374
41,310
16,464
5,171
44,977
29,099
66,181
78,937
31,660
20,282
44,006
55,859
139,112
68,078
4
965,607
73,773
25,531
96,634
46,869
19,240
6,423
50,758
31,680
76,936
89,052
35,190
23,005
51,691
60,696
162,846
76,892
5
1,263,543
88,623
32,502
132,305
59,338
25,173
7,945
62,783
36,877
105,155
107,802
41,023
28,045
71,413
69,866
242,861
96,231
6
7
267
131
237
120
318
127
249
137
288
.127
339
131
269
124
262
124
234
116
295
137
278
121
240
117
251
122
324
138
202
115
258
149
292
125
Source:
1. eals.2&3,
Census of India
2. eals.4&5, Popuiation Projections for India and States 1996-2016
Office of The Registrar Genral, India
- Projected Population

4.4 Page 34

▲back to top


Table 5 : CHANGE IN CRUDE BIRTH RATl;(CBR) , CRUDE DEATH RATE(CDR) AND -NATURAL GROWTH RATE(NGR)
INDIA AND MAJOR STATES
India and States
CrudeBirth Rate
Decrease in Crude Averageannual
Birth Rate change(%) in CBR
Crude Death Rate
1983 1988 1993 1988-90 1993-95 1988-90 1993-95 1983 1988 1993
I
I
I
w.r.! w.r.! w.r.! w.r.! I
I
I
1985
1990 1995
1983-85 1988-90 1983-85 1988-90 1985 1990 1995
Decrease in
Crude Birth
Rate
1988-90 1993-95
w.r.! w.r.!
1983-85 1988-90
NaturalGrowthRate
Decrease in
Natural
GrowthRate
--
1983 1988 1993 1988-90 1993-95
I
I
I w.r.! w.r.!
1985 1990 1995 1983-85 1988-90
India
33.6 30.8 285
2.8 2.3 1.7 15 12.1 10.3 9.2 1.8 1.1 21.5
Andhra Pradesh
30.6 265
24.1
4.1 2.4 2.7 1.8 105
9.6
8.4 0.9 1.2 20.1
Assam
34.7 30.6 29.9 4.1 0.7 2.4 05 12.8 10.9 9.6 1.9 1.3 21.9
Bihar
38.3 34.8 32.2
35
2.6 1.8 1.5 14.2 11.7 105
25
1.2 24.1
Gujarat
335 29.3 27.3 4.2 2.0 25 1.4 11.1 9.9 8.1 1.2 1.8 22.4
Haryana
36.2 33.6 305
2.6 3.1 1.4 1.8
9.7 8.9
8.1 0.8 0.8 265
IV
Himachal Pradesh
\\0
Karnataka
31.3 29.1 26.0
29.7 28.2 24.8
2.2 3.1 1.4 2.1 10.4 8.9
1.5 3.4 1.0 2.4
9.2 85
8.6 1.5 0.3 20.9
7.9 0.7 0.6 205
Kerala
23.7 20.0 17.6
3.7 2.4 3.1 2.4
65
6.1
6.0 0.4 0.1
17.2
Madhya Pradesh
38.3 365
33.2
1.8 3.3 0.9 1.8 14.3 13.3 11.7 1.0 1.6 24.0
Maharashtra
30.0 28.4 24.9
1.6 35 1.1 25
9.0 8.1
7.4 0.9 0.7 21.0
Orissa
325 30.8 27.7
1.7 3.1 1.0 2.0 13.6 12.2 11.3 1.4 0.9 18.9
Punjab
29.7 28.2 25.2
15 3.0 1.0 2.1
9.1 8.1
7.6 1.0 05
20.6
Rajasthan
~
~
Tamil Nadu
§ Uttar Pradesh
39.8 33.7 33.7
26.9 225 19.7
38.2 365 35.4
6.1 0.0 3.1 0.0 13.7 11.4
9.0 2.3 2.4 26.1
4.4 2.8 3.3 25 10.7 8.8
8.1 1.9 0.7
16.2
1.7 1.1 0.9 0.6 16.4 12.6 10.9 3.8 1.7 21.8
<s West Bengal
~
~
§
Source:
30.6 28.0 24.8
2.6 3.2 1.7 2.3 10.2 85
7.9 1.7 0.6 20.4
Based on Sample Registration System, Office of The Registrar General, India
~
:i!
tj
);;
205 19.3 1.0 1.2
16.9 15.7 3.2 1.2
19.7 20.3 2.2 -0.6
23.1 21.7 1.0 1.4
19.4 19.2 3.0 0.2
24.7 22.4 1.8 2.3
20.2 17.4 0.7 2.8
19.7 16.9 0.8 2.8
13.9 11.6 3.3 2.3
23.2 21.5 0.8 1.7
20.3 175 0.7 2.8
18.6 16.4 0.3 2.2
20.1 17.6 05 25
22.3 24.7 3.8 -2.4
13.7 11.6 25 2.1
23.9 245 -2.1 -0.6
195 16.9 0.9 2.6

4.5 Page 35

▲back to top


~
III
m
India and States
India
Andhra pradesh
Assam
Bihar
Gujarat
Haryana
Himachal Pradesh
\\,)J
Kamataka
0
Kerala
Madhya Pradesh
Maharashtra
Orissa
Punjab
Rajasthan
Tamil Nadu
Uttar Pradesh
West Bengal
Table 6: DECLINE IN TOTAL FERTDJTY RATE(TFR ) - INDIA AND MAJOR STATES
TOTAL
RURAL
URBAN
Total Fertility Rate Percent decrease in Tota Fertility Rate Percent decrease in Total Fertility Rate Percent decrease in
(TFR)
1988-90 1993-95
(TFR)
1988-90 1993-95
(TFR)
1988-~ 1993-95
1983 1988 1993 w.r.t. w.r.t. 1983 1988 1993 w.r.t. w.r.t. 1983 1988 1993 w.r.t. w.r.t.
-85 -90
-95 83-85 ~9O
-85
-90 -95 83-85 ~
-85 -90 -95 83-85 88-90
4.4
3.9
3.5 12.0 10.3
4.8
4.2
3.8 11.9
8.7
3.4
2.9
2.7 14.7
6.9
3.9 3.2
2.7 18.1 14.7
4.0
3.3
2.8 18.3 14.3
3.3
2.7
2.4 20.0 10.0
4.2 3.5
3.5 15.9 0.0
4.3
3.6-
3.7
15.5 -1.8
2.7
2.2
2.4 16.3 -6.0
5.6 5.1
4.6
8.9 10.5
5.7
5.2
4.7
9.3 9.0 4.6 3.9 3.5 15.9 9.5
4.0 3.5
3.2 14.0 8.7
4.3
3.7
3.3 14.7 9.1 3.5 3.1 2.8 11.5 8.7
4.8 4.1
3.7 13.9 10.5
5.1
4.4
3.9 13.1 12.0 3.7 3.1 3.0 16.1 3.2
3.9 3.3
2.8 13.8 16.0
4.0
3.4
2.9 14.3 14.7 2.6 2.3 2.0 11.7 10.3
3.7 3.3
2.8 10.8 15.2
4.0
3.6
3.0 10.1 15.0 3.1 2.7 2.4 13.0 10.0
2.5 2.0
1.7 20.3 11.9
2.5
2.0
1.8 21.1 11.7
2.4
1.9
1.8 19.4
8.6
5.0 4.7
4.2 4.7 11.3
5.5
5.1
4.6
7.3 9.8 4.0 3.3 2.8 17.5 15.2
3.7
3.4
2.9 8.2 13.9
4.0
3.7
3.2
8.3 12.6 3.2 2.8 2.6 12.6 7.2
4.2 3.6
3.2 13.5 11.0
4.3
3.7
3.3 13.2 10.7
3.5
2.8
2.5 21.7
8.4
3.8 3.3
2.9 12.4 11.1
3.9
3.5
3.1 11.1 10.6
3.3
3.0
2.5
8.2 15.6
5.7 4.6
4.5 19.9 2.2
6.0
4.9
4.7 18.9
2.7
4.5
3.6
3.4 20.1
5.6
3.1
2.4
2.1 22.3 12.3
3.4
2.6
2.2 21.8 15.2
2.8
2.1
1.9 22.9
9.4
5.8 5.3
5.1 8.7 3.2
6.1
5.6
5.3
7.7
4.8
4.5
3.9
4.1 14.7 -6.9
3.9 3.4
2.9 12.8 13.7
4.5
3.9
3.3 13.3 15.4
2.5
2.1
2.0 14.7
6.3
Source: Based on Sample Registration System, Office of The Registrar General, India

4.6 Page 36

▲back to top


Table 7: DECliNE IN INFANT MORTAUTY RATE - INDIA AND MAJOR STATES
India and States
TOTAL
RURAL
URBAN
Infant Mortality Rate Decrease in IMR
(IMR)
1988-90 1993-95
1983
~5
1988
-90
1993 w.r.t. w.r.t.
-95 83-85 88-90
Infant Mortality Rate Decrease in IMR Infant Mortality Rate
(IMR)
1988-90 1993-95
(IMR)
Decrease in IMR
1988-90 1993-95
1983
~5
1988
-90
1993
-95
w.r.t.
83-85
W.r.t.
88-90
1983
~5
1988
-90
1993 w.r.t. w.r.t.
-95 83-85 88-90
India
102
88
73
13.7 17.0 108
96
00
11.1 16.7 64
57
48
10.9 15.8
Andhra Pradesh
79
78
65
1.3 16.7 84
83
71
1.2 145 59
57
47
3.4 175
Assam
101
89
78
11.9 12.4 102
91
00
10.8 12.1 81
56
65
30.9 -16.1
Bihar
100
88
70
12.0 205 102
90
72
11.8 20.0 69
60
53
13.0 11.7
Gujarat
103
83
61
19.4 26.5 119
90
68
24.4 24.4 64
62
47
3.1 24.2
Haryana
92
00
68
13.0 15.0 100
85
70
15.0 17.6 62
61
62
1.6 -1.6
Himachal Pradesh
85
75
61
11.8 18.7 87
77
63
11.5 18.2 42
38
39
95
-2.6
....\\.)..l
Karnataka
71
75
65
-5.6 13.3 81
84
74
-3.7 11.9 41
46
45
-12.2
2.2
Kerala
31
22
15
29.0 31.8
32
23
16
28.1 30.4 28
17
12
39.3 29.4
Madhya Pradesh
123 116
101
5.7 12.9 132
124
107
6.1 13.7 77
74
62
3.9 16.2
Maharashtra
74
62
53
16.2 14.5 85
69
66
18.8
4.3 54
46
35
14.8 23.9
Orissa
130 122
105
6.2 13.9 134
126
110
6.0 12.7 00
71
66
11.3
7.0
Punjab
73
62
54
15.1 12.9 00
67
59
16.3 11.9 52
49
38
5.8 22.4
Rajasthan
113
94
84
16.8 10.6 121
100
89
17.4 11.0 76
61
60
19.7
1.6
~
Tamil Nadu
82
67
56
18.3 16.4
95
78
64
17.9 17.9 55
44
42
20.0
4.5
~
::!
Uttar Pradesh
151 114
89
245 21.9 162
121
93
. 25.3 23.1 92
74
66
19.6 10.8
~
West Bengal
(3
00
70
59
12.5 15.7 87
75
63
13.8 16.0 50
45
43
10.0
4.4
~
~
::!
Source:
Based on Sample Registration System, Office of The Registrar General, India
~
~
~
tj
~

4.7 Page 37

▲back to top


~
Table 8 : INFANT MORTAUTY, COMPONENTS OF INFANT MORTAUTY AND UNDER 5 MORTAUTY, q(5), 1995
l!1
m
INDIA AND MAJOR STATES
India and States
India
Andhra Pradesh
Assam
Bihar
Gujarat
Haryana
Himachal Pradesh
Karnataka
<..»
Kerala
N
Madhya Pradesh
Maharashtra
Orissa
Punjab
Rajasthan
Tamil Nadu
Uttar Pradesh
West Bengal
Infant Mortality
Rate •
74
67
77
73
62
69
63
62
15
99
55
103
53
86
54
86
58
Neo-natal
Mortality Rate·
48.1
52.7
47.3
44.4
44.6
41.9
46.0
44.2
11.0
64.9
39.6
625
28.1
56.3
40.3
52.4
38.8
Post neo-natal
Mortality Rate·
25.9
14.6
29.3
28.6
17.3
27.2
165
17.8
4.3
34.1
15.0
40.6
26.0
30.1
13.9
33.9
19.3
Peri-natal
Mortality Rate·
44.6
52.2
49.4
38.8
385
41.7
39.6
49.7
15.7
55.9
40.9
55.0
28.9
47.1
44.8
46.2
38.3
q(5) ••
113
82
131
117
99
100
80
94
20
168
75
145
76
131
66
145
91
Source:
• Sample Registration System, Office of -The Registrar General, India
•• Calculated from Life Tables 1991-95, Office of the Registrar General, India

4.8 Page 38

▲back to top


India and States
Table 9 : SELECTED EDUCATIONAL STATISTICS, INDIA AND MAJOR STATES
Primary
Boys
Girls
Enrolment 1995 *
-
Total
Boys
Middle
Girls
Number of Teachers 1995 *
Average of Schooling In
years,1991**
Average
Schooling of
males to
Average
Schooling of
females to
Total
Primary
Middle Total Literate Total Literate
males males femals females
India
46978566 34934582 81913148 26457163 18720234 45177397 1789733 1195845 3.6
6.7 2.3
6.7
Andhra Pradesh
2971914 2664513 5636427 1174966 955432 2130398
106999
50287 3.0
6.6
1.5
5.7
Assam
Bihar
Gujarat
Haryana
\\,).l
\\,).l
Himachal Pradesh
1677138 1283491 2960629
661794 515156 1176950
81035
48305 3.3
6.7 2.1
6.2
4425317 2603478 7028795 2846785 1449738 4296523
121800 100860 3.0
7.2 1.5
7.3
985106 731493 1716599 3265562 2511270 5776832
37006 142941 4.0
6.6 2.8
6.5
413849 437194 851043
296823 241409 538232
17813
14015 3.8
6.8 2.3
6.5
388055 341531 729586
56168
47239
103407
23173
5521 4.1
6.5 2.8
6.1
Karnataka
1316508 1167237 2483745 3247424 2787312 6034736
68169 119794 3.8
6.7 2.7
6.7
Kerala
711667 682584 1394251
770595 707397 1477992
46431
50564 5.6
6.9 5.2
6.8
Madhya Pradesh
5529137 3768565 9297702 2063339 1193132 3256471
214488
97977
2.8
6.0 1.6
6.2
Maharashtra
3074276 2762769 5837045 3579303 3231337 6810640
158074 176998 4.5
7.1 3.2
6.9
Orissa
2313000 1632000 3945000
830000 466000 1296000
111040
38914 3.1
6.0 1.9
6.1
Punjab
958143 877682 1835825
120854
98829 219683
44358
11226 3.9
7.1 3.0
6.9
~ Rajasthan
3029000 1626000 4655000 2061000 961000 3022000
95293
91643 2.8
6.4 1.3
6.9
~
§
Tamil Nadu
2375850 2210885 4586735 1315367 1256523 2571890
115596
64454 4.2
6.6 3.1
65
8
§~:l"
Uttar Pradesh
West Bengal
9983187 6022665 16005852 2744021 1109202 3853223
270459
97331 3.1
6.9
1.6
7.1
5205102 4725719 9930821
683556 616701 1300257
173635
21228 3.7
6.6 2.7
6.5
Source: • Selected Educational Statistics, 1996-97, Department of Education,
~
~
Ministry of Human Resource Development, Government of India
tsoj
•• Calculated by PFI from 1991 census data

4.9 Page 39

▲back to top


~
:;2
rn
India and States
India
Andhra Pradesh
Assam
Bihar
Gujarat
Haryana
HnnachalPradesh
Kamataka
VJ Kerala
""-
Madhya Pradesh
Maharashtra
Orissa
Punjab
Rajasthan
Tamil Nadu
Uttar Pradesh
West Bengal
Table 10 : PROFILE OF HUMAN DEVEWPMENT - INDIA AND MAJOR STATES , 1991
No. of
households
( '000)
151033
13709
3798
14109
7467
2646
987
8018
5388
11774
14899
5983
3381
7375
12343
22409
12505
Proportion of households having
Electricity
Safe
- drinking water
Toilet
42.37
46.30
18.74
1257
62.30
55.08
45.86
58.76
23.70
18.40
37.43
11.75
65.93
70.35
87.01
52.47
48.43
43.30
69.40
2354
82.31
35.03
54.74
21.91
32.90
69.78
74.32
77.34
71.68
18.89
53.41
68.49
39.07
92.74
58.96
67.42
62.24
81.98
30.69
22.45
12.39
24.13
51.28
15.07
2956
9.81
33.18
1957
23.13
18.02
31.51
Proportion of households occupying
Pucca
Semi-pucca Kutcha
41.61
38.41
14.62
30.18
56.93
50.14
53.03
4255
55.97
30.47
52.20
18.71
76.97
56.13
4554
41.03
32.61
30.95
2258
15.16
36.00
39.01
35.73
40.99
40.90
19.13
64.87
36.14
22.06
11.07
22.94
18.03
30.34
29.38
27.44
39.01
70.22
33.82
4.06
14.13
5.99
16.55
24.90
4.66
11.67
59.23
11.96
20.93
36.44
28.63
38.01
Source: Housing and Amenities, Census of India, 1991, Office of The Registrar General, India

4.10 Page 40

▲back to top


Table 11: EXPENDITIJRE (RS.LAKHS) ON HEALTH, FAMILY WELFARE, WATER SUPPLY &: SANITATION, NUTRITION AND
EDUCATION, 1995-96 INDIA AND MAJOR STATES
India and States
Expenditure on Health and
Family Welfare
Plan Non Plan Total
Water supply & Sanitation,
Plan Non Plan Total
Nutrition
Plan Non Plan Total
Expenditure on Education
Plan Non Plan Total
India
247365 606483 853848 180049 129276 309325 63175 154925 218100 408987 2556062 2965049
Andhra Pradesh 12291 42303 54594
13413
2082
15495 3153 115108 118261 13909 165110 179019
Assam
15301 8192 23493
7262
1841
9103
563
305
868 38595 63250 101845
Bihar
18918 32722 51640
53 9716
9769 1700
N.A
1700 12598 170529 183127
Gujarat
5817 40219 46036
4161 6234 10395 10495
4053 14548 4857 179023 183880
Haryana
6341 10262 16603
596 8971
9567 1106
1094 2200 13652 50396 64048
Himachal Pradesh 5391 7453 12844
2744 4317
7061
425
14
439
9134
25623 34757
Kamataka
\\.).J
Vl
Kerala
19317
11560
33900
36193
53217
47753
19098
6537
1107 20205 3052
3659 10196
435
2909
5961 37647 135997 173644
730
1165
9138 ·156042 165180
Madhya Pradesh 23179 28403 51582 14436 15216 29652 2200
1300 3500 26560 139257 165817
Maharashtra
28103 62075 90178 33076 5732 38808 6150
1580 7730 41336 332227 373563
Orissa
11514 15880 27394
7812
3136
10948 11220
992 12212 24825 80489 105314
Punjab
688) 20303 27188
5661
5313
10974 N.A
N.A
N.A 15114 77259 92373
Rajasthan
18900 32057 50957
211 31239 31450 3822
800 4622 37057 131933 168990
Tamil Nadu
21449 47338 68787 22448
722 23170 14572 24227 38799 17013 211266 228279
~ Uttar Pradesh
6581 97590 104171
25062
8084
33146
N.A
~
:::!
West Bengal
~
12242 49974 62216
9613
5205
14818 1204
<s
~
Source: Resetve Bank of India Bulletin, 1996-97 - Supplement Febraury
~
N.A - Not Available
:::!
~
~
~.
sl:;:j
N.A
N.A 44901 303087 347988
108 1312 15921 195959 211880

5 Pages 41-50

▲back to top


5.1 Page 41

▲back to top


~
Table12 : PERCENTAGE OF COUPLES CUIUlENTLY a: EFFECTIVELY PROTECTED BY CONTRACEPTIVE METHODS
l!i!
m
AS ON 31-3 71996 INDIA AND MAJOR STATES
.India and Major States
Eligible
Couples
('00)
CCP & CEP CCP due
due to
to IUD
Sterilisation
CEP due CCP
CEP
to DID due to
due to
Conventional Conventional
CCP·& CEP
CCP
CEP
due to
due to
due to
Oral Pills All methods All methods
India
1615932
30.2
8.2
7.8
10.7
5.3
Andhra Pradesh
136409
38.8
4.7
45
6.0
3.0
Assam
Bihar
37277
18.2
1.8
1.7
1.3
0.7
1m86
19.7
2.6
25
1.00.5
0.4
GUjarat
Haryana
77500
38.6
12.0
11.4
14.6
7.3
30401
33.9
11.3
10.7
16.8
8.4
Himachal Pradesh
9508
40.7
10.7
10.2
8.2
4.1
Karnataka
81525
42.8
7.8
7.4
4.6
2.3
\\.JO
Kerala
46069
41.3
4.1
3.9
55
2.8
0\\
Madhya Pradesh
134066
275
10.9
10.4
14.9
7.4
Maharashtra
152311
40.1
65
6.2
8.8
4.4
Orissa
57912
28.6
6.8
6.4
7.5
3.8
Punjab
33218
38.8
31.4
29.9
18.3
9.2
Rajasthan
88231
22.3
4.0
3.8
5.6
2.8
Tamil Nadu
102500
42.3
8.2
7.8
2.6
1.3
Uttar Pradesh
West Bengal
272239
195
15.2
14.4
9.3
4.6
124411
29.0
2.4
2.3
3.6
1.8
3.2
52.2
46.5
2.0
515
48.3
0.6
22.0
21.2
23.7
23.1
2.2
67.4
59.5
1.7
63.7
54.7
25
62.1
57.4
1.8
57.0
54.3
0.8
51.7
48.8
3.8
57.1
49.1
2.8
58.2
535
1.7
44.7
40.6
3.4
91.9
81.2
1.9
33.7
30.7
2.0
55.2
53.5
2.1
46.1
40.7
2.1
37.1
35.2
Source:
Year Book 1995-96, Family Welfare Programme In India, department of Family Welfare,
Ministry of Health and Family Welfare, Government of India.
CCP - Couples currently protected; CEP - Couple effectively protected

5.2 Page 42

▲back to top


The Population Foundation of India (formerly known as the Family
Planning Foundation) came into being in 1970 and has ever since been in
the forefront of non-governmental efforts to check the runaway growth
of the population of the country and establish a balance between resource,
. environment and population.
The Foundation was established by a dedicated group industrialists
and population activists led by Bharat Ratna, the late Mr JRD Tata who
guided it as the Founder Chairman until his death in 1993. At present Dr
Bharat Ram, eminent industrialist, is the Chairman and Dr K. Srinivasan,
well known Demographer, is the Executive Director.
The Founding Fathers believed that a movement of social
development such as family planning should not and cannot remain the
sole concern of the government and it ought to be supported and
supplemented by private voluntary enterprises. The Foundation has,
therefore, always worked in close co-operation and coordination with
official agencies and programmes. In its independent role, it has tried to
guide and influence the national population policy and to seIVe as a catalytic
agent to promote programmes at different levels directed towards the
ultimate goal of population stabilisation.