Demography of the Nation

Demography of the Nation


1 Pages 1-10

▲back to top


1.1 Page 1

▲back to top


DelDography
of the Nation
POPULATION FOUNDATION OF INDIA
8-28, Qutab Institutional Area, New Delhi -110 016

1.2 Page 2

▲back to top


The article "Demography of the Nation' was prepared by Dr. K. Srinivasan,
Executive Director, Population Foundation of India for publication in the book
"India's 50 years of Independence' to be brought by Centre for Policy Research,
New Delhi.
This booIcIetpublished In August 1997 by :
Mr. H.P. Nagpal
secretary & Treasurer
POPULATION FOUNDATION OF INDIA
8-28, Qutab Institutional Area. "'DelhI--110 016
Phones: 6867083, 6867080. 6867081, 868181
Fax: 91-11-6852766

1.3 Page 3

▲back to top


Contents:
I. Introduction
t
II. 'Population Size & Growth
2
III. .Future Prospects
5
(a) Size
(b). Political Implications
(c) Age Pattern Changes
N. Urbanisation
12
V. Adverse Sex Ratio
14
VI. Fertility: Current Levels &. Future Tr~ds
15
(a) Adverse Sex Ratio
(b) Total Fertility Rate
VII.Mortality
19
(a) Crude Death Rate
(b) Infant Mortality Rate
(c) Expectation of Life
VIII. Reproductive Health Conditions
25
(a) Literacy
(b) Contraceptive Use
(c) Unmet need for family planning
(d) Teenage Pregnancies
(e) High Maternal Mortality
(f) Low proportion of deliveries attented by trained
professionals
(g) Poorly spaced Births
(h). Higher Order Birth (4+)

1.4 Page 4

▲back to top


IX. Human Development
X. Gender Related Health Index
XI. Summary & Conclusions
References
Tables
Table-I
Table-2
Table-?
Table-8
Table-9
Demographic Trends: India (190) ••1996) .
Population Size, Sex Ratio and Growth in IIldia
& selected States
Yearby which TFR of'2.1 will be realized for
selected states
Number of Parliament Seats at Present and
likely number in future (if freezing is lifted)
Pop~~ation in,the a&e groups 0-14, IS-59 aDd 60+
in Jh4la and selected states.
Fertility and Mortality: India and States .;
Current & Projected for 2016.
Reproductive Health Measures : India & Sp.tes
Demographic Trends : India (1901-1996)
Gender Related Health Index: IOdie&: Large States-1993
Author of this paper Dr K. Srinivasan, Executive Director, Population
Foundation ofIndia, wishes to acknowledge the assistance in complilation
and analysis of data rendered by Dr. S. Rajaram, Research Associate in
the Foundation.

1.5 Page 5

▲back to top


I. IDtrod~ctioD
-Since her independence in 1947, the demographic situation in India has
undergone vast changes that can be a justification for hope and
simultaneously a-reason for despair. The demographic transition which
any underdeveloped country experiences in the processes of modemization
and developmeat fix)mthe initial levels of 'high birth rate-high death rate'
to ·tiDal levels of 'low birth rate-low death rate" passixlg through the
intamediate tnmsitionstages of 'high birth rate-low death rate' in which
the society experiences very high rates of population growth leading to
population explosion, as such, has also occurred in India. India's cUrrent
large population is not to be viewed as a historically unique experience;
all developed societies have· gone through this phase of population
explosion before achieving low and manageable rates of growth. However
the transition from 'high birth and death rates' to 'low birth and death
rates' in many- parts of India seem to be taking a much longer time
compared to the experiences in many other developing countries since
the sixties' and in many States of India during the same-period. Further
-we do not seem to be using to our advantage the knowledge and
experiences that have been gained by man:y-developing countries in the
past two decades and two or three states in our own country, which have
successfully achieved the demographic transition, to hasten the
demographic transition in the rest of the country.
-
Ironically, India was the first country to reali2Jethe adverse effects .of rapid
population growth on social and economic development, formulate an official
population policy and launch a natiollal program of family planning as early
as 19Sa. as a part of the first five y~ plan (1951-56). The policies and
prqgJal1lS pursued in the developmental and population fronts, dwing the
past forty five years, thrqQ&bthe series offiye-year developmental plans and

1.6 Page 6

▲back to top


family planning programs, though lop-sided and carried heavy concerns
and poor implementation on the population front, have indeed had good
impact in some of the states as Kerala, Tamil Nadu, Goa and the southern
states in general. In these states other developmental programs have also
been implemented more successfully, possibly because of higher literacy
levels and ability of these states to implement national programs more
efficiently; but they had very limited impact on the population scenario in
the large northern Hindi speaking states of Bihar, Madhya Pradesh,
Rajasthan and Uttar Pradesh and Orissa in the east.
We will examine in some detail the current scenario, the changes that can
be expected in the near future and the policy strategies that will be helpful
in the acceleration of demographic transition in the more backward states.
India's population is rapidly heading towards the billion mark. Its base is
really exploding. As of March 1996 the population of the country has
been estimated at 934.2 million, by the Registrar General ofIndia on the
basis of the 1991 census figures and the birth and death rate figures
available for the subsequent years from the Sample Registration System
(Registrar General, India 1996). Since the beginning of the century, in
1901, when the population of the country within its present boundaries
was enumerated at 238.4 million, the population has increased by
695.8 million in 95 years until 1996; more than 80% of this increase (573.1
million) came after 1951, and 56% of this century's addition
(386.1 million) has come during the 25 year period 1971-1996. What
India has added during 1971-1996 to her population (386.1 million), if it
were to be a separate country, it would be the third largest country in the
world, next only to China and India, and more than the population of
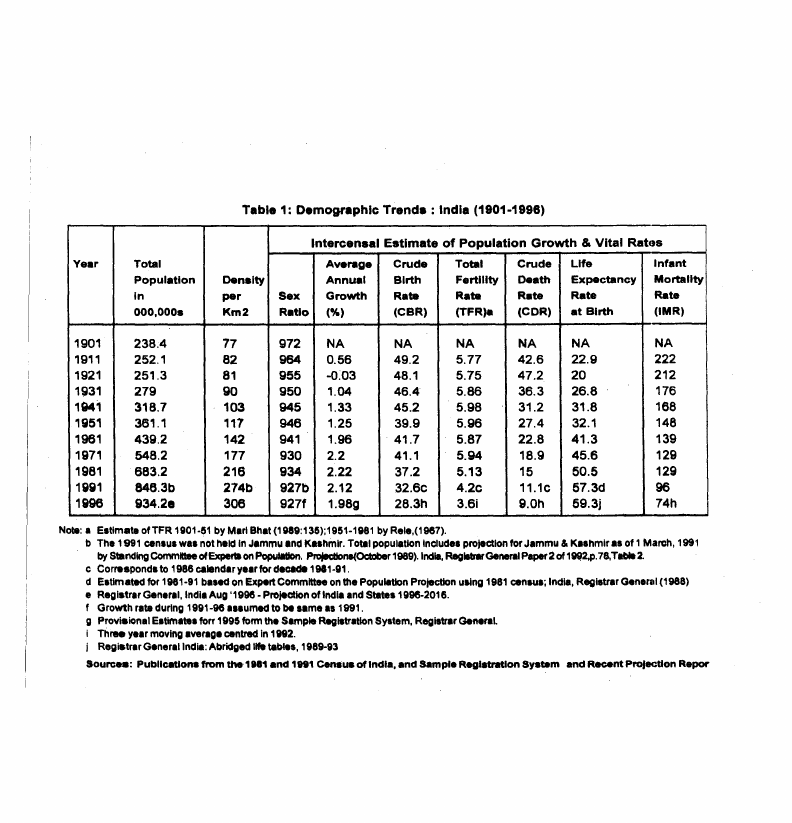
India in 1951. Table 1provides the details of the population size, annual
growth rate, and sex ratios and basic measures of fertility and mortality
during different periods of time in the past from 1901 until 1996.

1.7 Page 7

▲back to top


'.•.•••
;
W
--1---------:-- --~+.
i.. !" i"
.,.riOd
The net additions to the nati~n's population are continuing to rise year
after year. This spiraling rise in '1lopWation can be gauged from the fact
that while before independence the addition of 100 million people in its
existing boundaries took 42 years, after 1951 the first 1ao million people
were added in 12.5 years, the second 100 million in 9.3 years, the third
100 millionin 7.6 years, the fourth 1()()million in 6;4 years, the fifth in 5.8
and the sixth in 5.2 years. The time taken to add a 100 million people in
this cotmtry has been reduced to less than half the time it took immediately
after irldependence. During the recent fifteen year period 1981-96, 250.9
million have been added compared tojust 123.0 million during the first
half of the cmtury.Againillustratively what India has added during the
1981-1996"period is more than the population of the United States of
America in 1990, and the addeQ .population. if considered asa separate
country would be the fifth lwgest in the world.
Among the states, the largest population is in Uttar Pradesh with an
estimated 156.7 million in 1996 and the smallest is Sikkim with a
population of 0.49 million. The state of UP has a population size that is

1.8 Page 8

▲back to top


exceeded only by four other countries of the world (excluding India):
China, USA, Indonesia, and Brazil. There are enormous variations among
the states not only in terms of population size but also in terms of density.
socio-economic conditions, cultural practices, social norms regarding
marriage, status of women in society, efficiency of state governance and
many other factors that influence the health seeking behavior and conditions
of the population, especially the reproductive health of women and health
and survival status of the female child and acceptance offamily planning.
In terms of growth rates, during the period 1991-96, the population
increased at an annual rate of 1.98%, as compared to 2.12% during
1981-91 and 2.22% during 1971-81, which was the highest growth rate
ever experienced in the country as a whole. In the pre-independence period,
1901-1951, the average annual growth rate was only 0.83%. Although
the growth rates have begun to record. moderate declines from 1976 (
1971-81), the growth rate for 1994 is estimated at 1.94% per year being
the difference of a birth rate of 28.6 and a death rate of 9.2 per 1000
population. This growth rate of 1.9% per year is very high and when
allowed to persist has the potential to double the population, to 1868
million in 36 years.
India's population problem is thus not only its large size but the persistent
high rates of growth. The picture seems different when we consider the
states separately. During the decade 1981-1991, Kerala, Tamil Nadu, and
Goa registered growth rates of 13.98, 14.94, and 15.96% respectively,
far lower than the national average of 23.58. These states have also
recorded a substantial decline in the growth rate as compared to earlier
decades. On the other hand, among the large Hindi-speaking states of
Uttar Pradesh, Bihar, Madhya Pradesh and Rajasthan (euphemistically
referred to in Hindi as bimaru or 'sick' states), the growth rate continues
to be quite high with decadal increases during 1981-91 of25.48, 23.54,
26.84 and 28.44% respectively.

1.9 Page 9

▲back to top


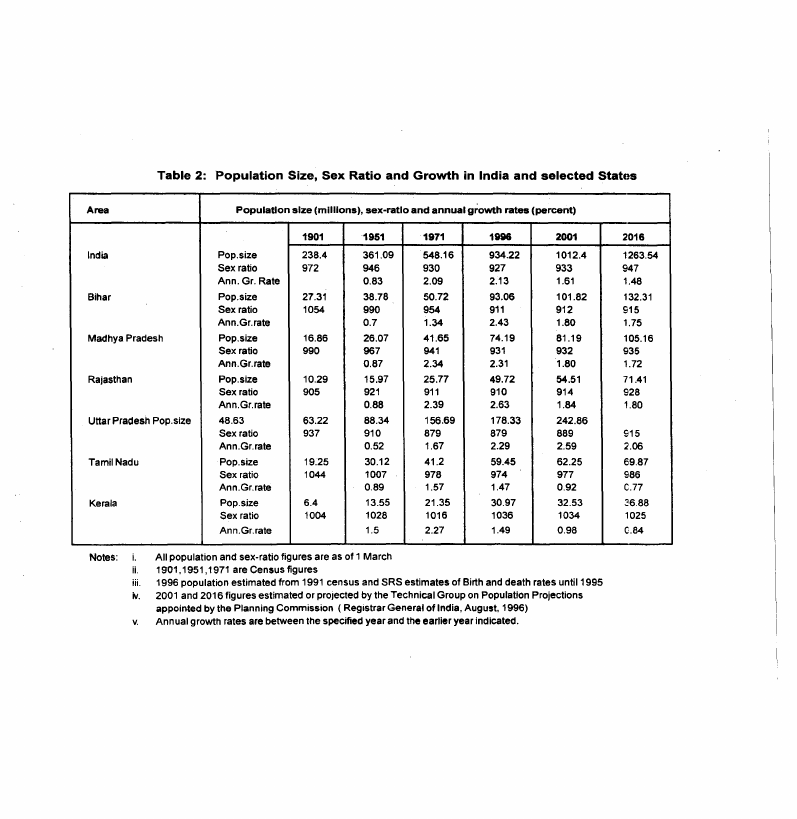
Recently projections for the future size of the population for the country
as a whole and at the state level have been made under the most plausible
sets of assumptions on the future course of fertility, mortality and migration
by a Technical Group constituted by the Planning Commission under the
Chairmanship of the Registrar General of India (August 1996). The
projected figures extracted from this report for the years 2001 and 2016
for selected states and the country as a whole are furnished in
Table 2.
The population of the country as a whole is projected to be 1012.4 million
by the year 2001; 1094.1 million by 2006; 1178.9 million by 2011 and
1263.5 million by 2016. The population that is expected to be added to
India in the next 20 year period 1996 to 2016 is329.3 million, more than
the total added during the previous two decades of 1971-91 (which was
298.1 million) and almost equal to the population ofIndia at the time of
independence. This huge expected rise in the population of the country
will take place inspite of substantial reductions in fertility rates in the
future years, when many states would have reached the replacement levels
of fertility .
More than half of this addition of329 million during 1996-2016 (54%)
will come from just the four states; Uttar Pradesh (86.2 Million), Bihar
(39.3 million), Madhya Pradesh (31 million) and Rajasthan (21.7 million).
In the coming years a higher and higher proportion of the additions to
India's population will be coming from these four states. On the other
hand the states of Kerala and Tamil Nadu which constitute together 9.7%
of the population of the country in 1996 will be contributing only 17.2
million or 5.2% ofnation's additions during 1996-2016.
This continued increase in the population ofIndia, expecJ.pd in the future
years, will be due to two factt>rs; firstly the population momentum factor
which is due to an increase in the proportion of women in the reproductive

1.10 Page 10

▲back to top


years of age, 15 to 49 (who are already born in a high fertility regime of
the past), swelling up the ranks of potential mothers and secondly due to
slow pace of decline in marital fertility not sufficient to offset the pace of
increase in the number· of mothers. This is an important factor for the
large Hindi speaking states, due to which, UP's population is expected to
grow, by the year 2016, to 226.6 million, more than the population of ,
India in 1901 and more than that of U.S.A in 1990 with no comparable
resources for development. The combined population of the four states
in 2016, will be almost equal to the population ofIndia as whole in 1971.
The figures are frightening indeed.
The future population increase in terms of growth rates rather than
numbers, are expected to be at 1.51, 1.46, 1.45 and 1.39% per year during
the quinquennia 1996-2001,2001-06,2006-11 and 2011-16 compared
to rates of 2.17 and 1.98% in recent periods of 1971-1991 and 1991-96.
Though these could be considered as substantial reductions in the growth
rates in the future rates, any growth rate over 1% per year is still to be
considered as unduly high for India with a population base of over 1000
million and continuing to grow. These high rates are expected to occur
inspite of substantial declines in fertility assumed in the coming years,
with many of the states reaching the replacement level of TFR of 2.1
achieved by 2016.
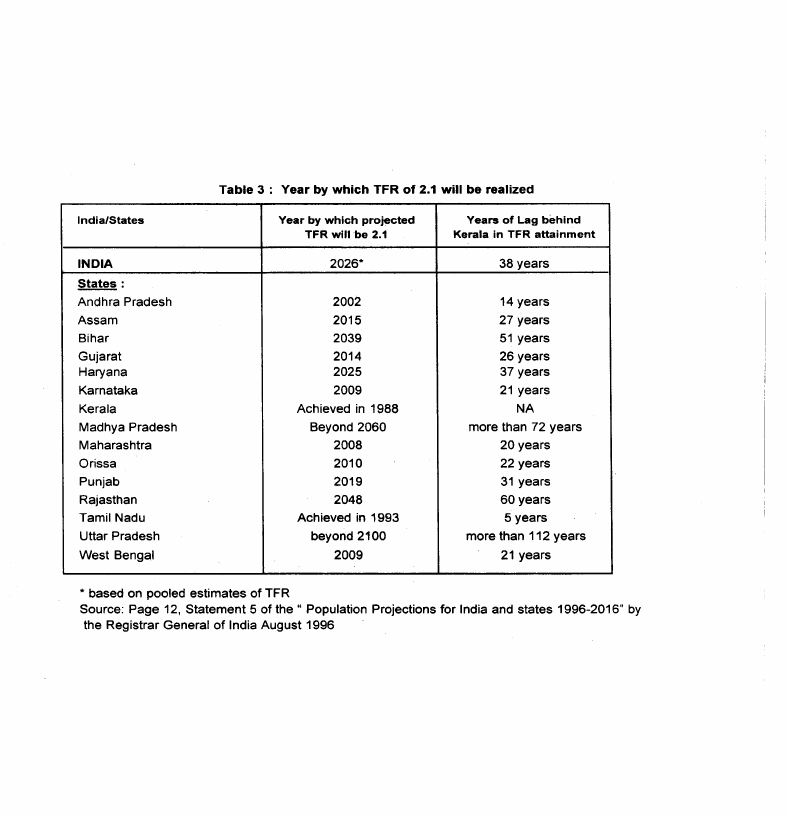
However, according to the projections of the Technical Group, the large
Hindi speaking states are not expected to reach the replacement levels of
fertility before 2040; Bihar by 2039; Rajasthanby 2048; Madhya Pradesh
after 2061 and Uttar Pradesh after 2100.
b) Political Implications
The political and socio-economic implications of the persistence of
such high growth rates in the Hindi belt is mind boggling and the
apathy of the leadership to this fundamental problem is appalling. The
widening demographic diversity of In4ia's population, especially
between the southern and the northern states, are yet to be fully realized.

2 Pages 11-20

▲back to top


2.1 Page 11

▲back to top


Present and Future Number of Parliament Seats
if freezing is lifted
~; uelh1
Goa
1
II 2
Aruna. A"adesh
1
11 2
~laya
1
II 2
Mmipur
1
II 2
Jarrrru Kashmr" ~56
HrTBc. A"adesh !iiI:
VVestBengal
Utar A"adesh
Tamilledu
Rajasthan
S
J!
AJnjab
rn
O"issa
Miharashtra
M3dhya A"adesh
Kerala
Karnataka
Haryana
_10
Gujarat
Bihar
Assam
Andhra A"adesh
31
30
""
12
13
18
21
18
20
27
28
11
28
28
14
14
42
42
39
47
48
44
40
39
42
58
54
02016
• Existing
81>
At the political level, with the universal adult franchise guaranteed to
every citizen above 18 years of age, the states that have a higher rate of
population growth will have proportionately a larger number of
representative in Indian Parliament. States with higher growth rates will

2.2 Page 12

▲back to top


tend to have an increasingly greateuepresentation in Parliament and hence
a hetter political leverage compared to the states which have a slower
rate of growth of population. Indian leaders were aware of this problem
and seem to have resolved it very wisely, by a Constitutional Amendment
and with an Act of Parliament in 1977, by which the number of
representatives to the Parliament from each state was frozen at the 1971
census level and such a freeze willbe in vogue until 2000. The constitution
42nd Amendment Act 1976, section 15, has specifically been made to ensure
that those states that do well in family planning programs and control
their growth rates are not penalized by reduction in their representation
to the Parliament. This amendment is applicable only upto 2000. As the
law stands at present, from the year 2001 the figures of 200 1 census can
become the basis for reallocation of number of seats to Parliament from
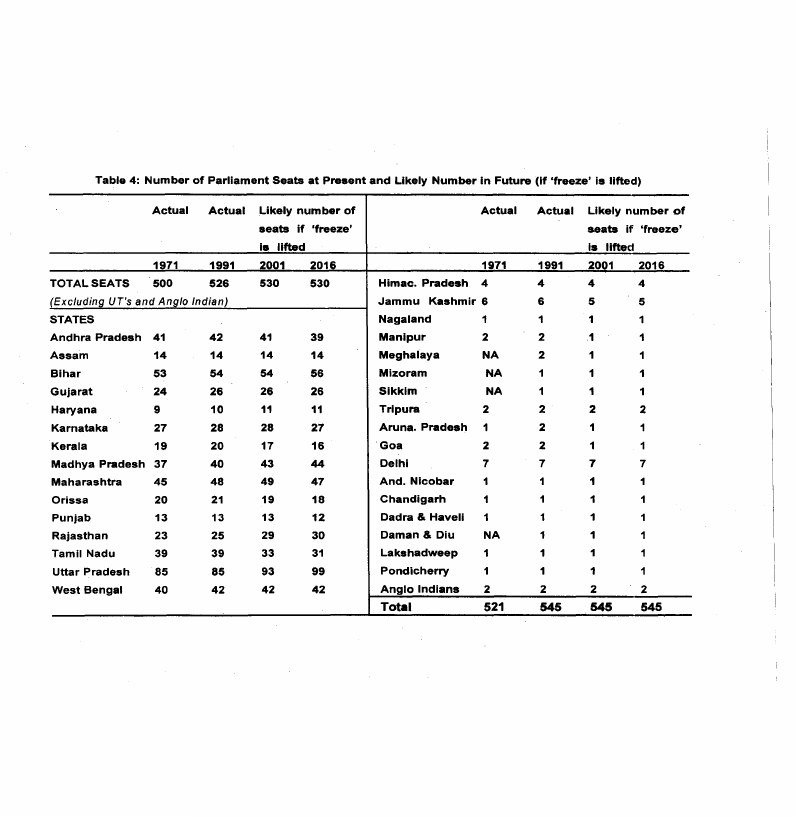
each of the states. If this is done UP is expected to gain 8 seats from 85 to
93, Rajasthan 4 seats from 25 to 29, Madhya Pradesh by 3 seats from 40
to 43 and Haryana by 1 seat from 10 to 11. On the other hand the states
that have been relatively successful in family planning programs will lose
their representation in Parliament Tamil Nadu by 6 seats from 39 to 33,
Kerala by 4 seats from 21 to 17, Andhra Pradesh by 1 seat from 42 to 41,
and Manipur by one seat from 2 to 1. By the year 2016, the states of Uttar
Pradesh, Rajasthan, Madhya Pradesh and Bihar will gain by 14, 5,4 and
2 seats respectively and the states of Tamil Nadu, Kerala, Andhra Pradesh
and Kamataka will loose by 8, 4, 3 and 1 seats respectively, compared
to the 1991 levels. Table 4 gives the distribution of seats for lower
house of the Parliament (Lok Sabha) at present and how things will
change if the present freeze is lifted by the year 2000 and the censuses
of 200 I and 2011 are to form the- basis of political representation in
the Parliament. In the current context of a still widening growth
differentials among the states as revealed by the 1991 census and the
recent projections by the Technical Group ofthe Planning Commission,
there is an urgent need for the continuation of the 1977 freeze on the
representation to Parliament from different states for atleast another
20 years or until the growth differentials narrow down whereby

2.3 Page 13

▲back to top


replacement levels of fertility is realized in every. large state. This is a
necessary political expediency not only to encourage accelerated
demographic transition in the large Hindi speaking states but aJso to
preserve the national integrity and not penalize the states that have
successfully implemented the natiooal population policies and achieved
lower levels of population growdl rates as stipulated in the various
developmental plans.
c) Age Pattern chaages
Due to demographic forces. which are beyond inftueoce of any public
policy, the age distribution of the Dation~s population in the oomiDg yat'S .
will change in the direction of ccmibubog to higbee fertility by ioaeasiog
the number of women in reproducbve~(15-49~ iDcaasetbe propodioo
of population in the productive ages (15-59) and in the olda- ages ( 60+).
All the states wi1l experience these phenomena to varying degree; but·
with regard to populatiOll of cbiIdrm (6- t 4 ages~ while some slates that
have experienced a substantial dedines in fertility in the past lWDld reconf
a decline in the number and propodioo of childn:o., mmeodlers would be
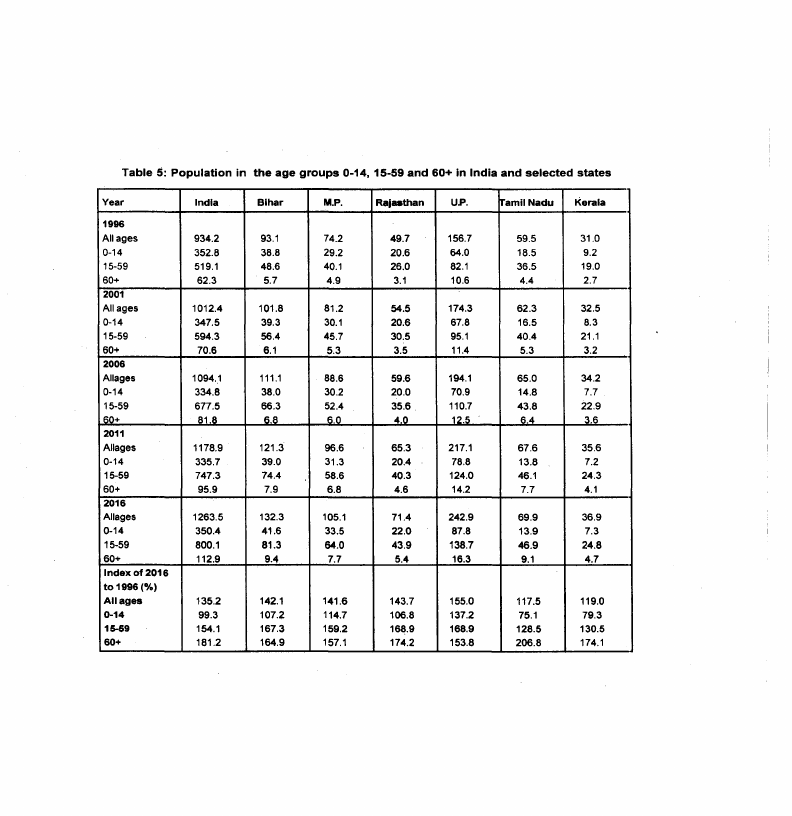
experiencing a continued lliaease in this age group. Table 2 gives die
projected figures in broad age groups fo£ India and selected smres which
are discussed below.
(1) WOOlen in the Rep•.•••••• e Ap (15-49)
The female population in reproductive ages in the ClOUIIby as a whole
will increase from 221.6 million in 1996 to 333.7 million in 2016. In
numerical terms about 5.6 million females per yCl£ is added to 1his age
group. Among the four states ofBihar~ Madhya ~
Rajasthan md
Uttar Pradesh, the increment is maximum b:' U .P. tOUowed by Rajasdaan
As a consequence, added efforts on the reproductive health and child
health care would have to be geared up in these four ates fixcootroIIing
the fertility. The female popuIabon in dDs age group in the states of Tamil
Nadu and Kerala also will increase by about 20 per cent from tbe 1996.
level. ( see Table 5 for details)

2.4 Page 14

▲back to top


An estimate of the future population in ages 0 to 14 is essential for planning
of the resources to be allocated for child health care, primary and middle
school education. Planning for the training of number of medical and
paramedical workers and school teachers and schools needed will be
dependent on such projections. In India as a whole the population in the
age group 0-14 is likely to decline from 352.8 million to 350.4 million
between 1996 and 2016. While the child population at national level is.
likely to decline, in the four northern states of Bihar, Madhya Pradesh,
Rajasthan and Uttar Pradesh it will increase by 32.3 million. The state of
U.P. alone would contribute an increase of about 23.8 million. The
population in this age group in the year 2016 will be 37 per cent more
than that in the year 1996. However, the increment is about 7 per cent in
case of Bihar and Rajasthan and 15 per cent in Madhya Pradesh. Thus,
the problem of controlling fertility seems to be urgent in these four states,
especially in UP. Hence these four states may require additional resources
in the areas of family planning and child care services and schooling of
children. However the proble~ seems to be completely different in case
of the southern states of Kerala and Tamil Nadu. The child population in
these states will decrease by 21 and 25 per cent respectively in the next 20
years. This trend may have a big impact in the quality of child care services
and education. It is also possible that some people who are employed in
primary schools may lose their jobs because of closure of some schools
for want of children. However the population in the working ages in these
states would continue to increase in the coming years. This aspect is
discussed in the next section. (see Table 5 for details)
(3) Population in Working Ages15~59
The age group 15-59 is considered to be the economically productive
ages. A study of the number and proportion of population in the age
group 15-59 is essential for the planning of programs of secondary and
higher education and employment. Economic development of the country

2.5 Page 15

▲back to top


is largely dependent on the quality of human resources in this age group
and the producti vity of their economic acti vity. Also the population in the
age groups 0 to 14 and 60+ are largely dependent on this age group. The
population in this age group is likely to increase from 519.1 million in·
1996 to 800.1 million in 2016 indicating an increase of about 14.05 million
jobs per year. In India there will be more supply of work force in the
coming years than employment opportunities and this requires careful
planning for generating atleast for 7 million a year. The population in the
working ages in the states of Bihar, Madhya Pradesh, Rajasthan and Uttar
Pradesh will continue to grow faster than in the states ofKerala and Tamil
Nadu. In the four northern states the population in this age group will
grow by about 65 per cent, where as it will grow only about 29 per cent
in the southern states of Kerala and Tamil Nadu. These four larger states
requires generation of more employment opportunities in the coming years
than the states of Kerala and Tamil Nadu (see Table 5 for details). In
other words the demand for jobs will be more in case of these four states.
Also because ofthe changing age structure, the employment opportunities
may decline in some sectors in the southern states.
Throughout the world the number and proportion of the aged population
(age 60+) is increasing because of the combined effects of increasing
longevity and declining fertility. The aged are increasingly becoming a
more visible and influential section of the society, in terms of their political
leverage, social activism and economic and health demands. Though
population aging is already a major problem for most of the developed
countries in the world, it is rapidly emerging as a major social and economic
issue in developing countries, as well. Although mortality and migration
can have an impact on the process of population aging, the principal
determinant of aging up to the present has been fertility behavior.
The population aged 60 and above is generally used as an indicator of
the aging of the population. It is important to note that the population
in this age group will increase very rapidly in the next twenty years. In

2.6 Page 16

▲back to top


India as a whole, the number of old age population will increase from
62.3 million to 112.9 million. In other words about 2.5 million people will
be added every year to this category. Thus old age security will be an
emerging issue in the coming decades. The old age population in the
states of Bihar. Madhya Pradesh, Rajasthan and Uttar Pradesh will increase
from 5.7 to 9.4 million, 4.9 to 7.7 million, 3.1 to 504 million and 10.6 to
16.3 million respectively. (see Table 5 for details)
A study of the process of urbanization in India since the beginning of this
century reveals a steady increase in the size of its urban population, the
number of urban centers, and the level of urbanization since 1911, and a
rapid rise since 1951. From 1951 to 1991, the urban Indian population
more than tripled from 62.4 to 217.2 million. The number of urban centers
(town and urban agglomerations) swelled from 2,843 in 1951 to 3,768 in
1991. The proportion of population living in urban areas (level of
urbanization) increased from 17.3% in 1951 to 26.1 % in 1991. The annual
rate of growth of the urban population during 1981-91 was 3.09 percent,
slightly less than in the previous two decades, 1971-81 (3.83%) and 1961-
71 (3.21%). Thus, it appears that the pace of increase in the urban
population has been slowing in recent years.
Towns are classified into six population size classed by the census as
follows:
Class I: Population of 100,000 or more
Class II: Population between 50,000-99,999
Class III: Population between 20,000-49,999
Class IV: Population between 10,000-19,999
Class V: Population between 5,000-9,999
Class VI: Population below 5,000

2.7 Page 17

▲back to top


Trends in the growth of population in these six categories of urban areas
reveal that the lion's share of urban increase in population since 1981 has
been in Class I towns. The proportion of the Indian urban population
living in Class I towns is steadily growing toward two-thirds of the total.
The two small size classes (below 10,000 population) have experienced a
net loss of population during the decade 1981-91. In 1981, India had 12
a million-plus cities with total population of 42.1 million and accounting
for 6.2% of the country's population. By 1991, the number of million-
plus cities had nearly doubled to 23, with a total population of70. 7 million
and 8.4 percent of the Indian population. Thus the urbanization process
in India has essentially been the growth oflarge towns and metropolitan
cities at the cost of smaller towns and urban centers. While the pace of
urbanization in the country as a whole has been slowing down, the pace
ofmetropolitanizm has been accelerating.
According to the recent projections by the Technical Group on Population
Projections (August 1996), the percentage of population living in urban
areas is likely to increase from about 27.2 per cent in 1996 to 33.7 per
cent in 2016. In numerical terms, population living in urban areas would
increase from an estimated 254 million in 1996 to 425 million in 2016, an
increase of 171 million or an addition of 8.05 million per year to the urban
population ofindia. This rapidly rising urban population would exert severe
constraints on the infrastructure facilities in the major metropolis,
particularly on housing, water supply, sanitation and transportation. The
present projection does not take into account the increased urbanization
likely to occur due to higher economic growth due to industrialization.
The projections of urban population have been based purely on an
extrapolation of the past trends. Increased economic activity with GDP
growth rate averaging more than 5 per cent estimated after 1991 census
(and more than 7 per cent during last three years) is likely to accelerate
the investments in urban areas and attract more and more rural poor to
the urban centers. Thus, the urban projection given in the Report should
be taken as a minimum level likely to be reached.
/

2.8 Page 18

▲back to top


India shares a distinctive feature of the South Asian and Chinese
popuialions with regard to the sex ratio, with a centuries-old deficit of
females to males-the opposite in the case of non-Asian countries. In India
the deficit of females is largely attributed to women's lower status in
society which has contributed to their higher mortality in all ages up to
45. Of more serious concern to the country is that the sex ratio, defmed
as the number of females per 1000 males, has been declining almost
consistently over the decades, except for a small improvement in 1981.
The sex ratio, computed to be 972 in the 1901 census, declined steadily
to 930 by 1971, rose marginally to 934 by 1981, but declined subsequently
to 927 in the 1991 census. Even in Tamil Nadu it has declined from 1044
in 1901 to 1001 in 1951 and to 974 in 1991 (see Table 2). In many states,
especially the large Hindi-speaking ones, the decline in the sex ratio was
substantial between 1981 and 1991. For example, in Bihar it fell from 946
to 911, and in Uttar Pradesh from an already quite low figure of 885 in
1981 it fell to 879 in 1991. A sex ratio of 879 is considered as an alarmingly
low level by any standards, national or international. Surprisingly, even
Maharashtra, considered one of the most progressive states in the country
with better status for women recorded a sex ratio of 934 in 1991 as
compared to 937 in 1981. Only Kerala has had a favorable female sex
ratio throughout this century (with 1,036 females per 1000 males in 1991).
This is followed by Himachal Pradesh with a sex ratio of 976. Thus, the
Indian population, except for Kerala, has had a deficit of females to
males throughout the century. Women's lower status in Indian society
contributes to their low age at marriage, lower literacy, higher fertility,
high mortality levels during the reproductive ages and to lower sex
ratio. However the decline in the sex ratio during 1981 and 1991 is a
bit surprising since during this period the expectation oflife of females
increased more than that of males. There is a serious debate in the
demographic circles that there could have a higher degree of
undercount of females in the 1991 census than in the 1981 census
becalls~ of serious political disturbances before the census in March 1991.

2.9 Page 19

▲back to top


However, in the coming years, the sex ratio is expected to become more
and more favorable to females because ofthe relatively larger rise in the
expectation of life of females compared to males. The Technical Group
on Population projections has projected the sex ratio to increase to 933
by 2001 and 947 by 2016 (Table 2).
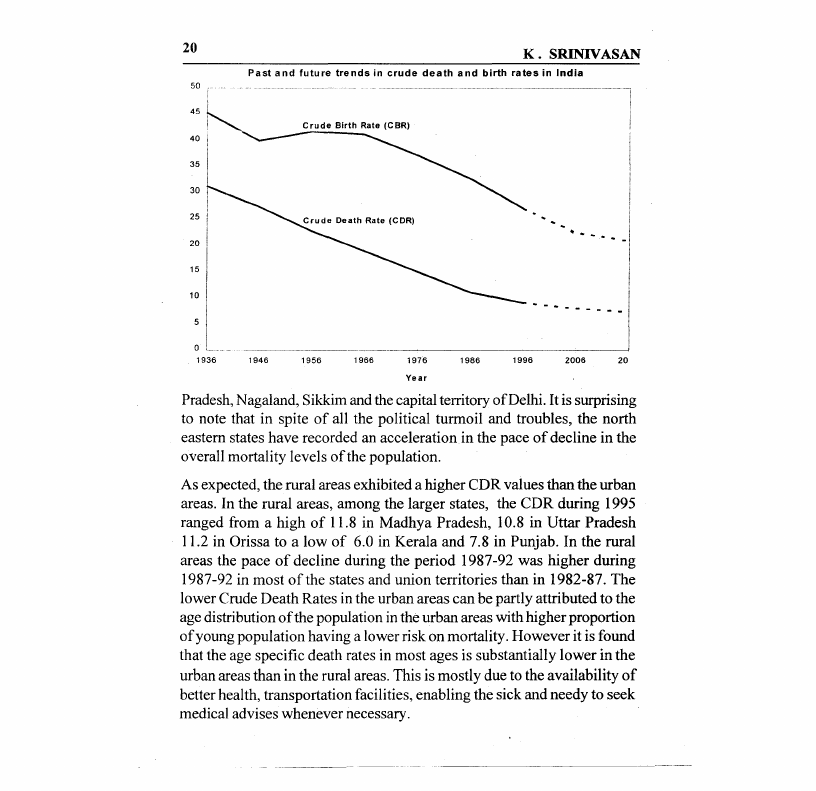
a) Crude Birth Rate
India is in a state of rapid fertility transition with the 'pace of decline
accelerating in the recent years. The pace of decline varies from state to
state and the experiences of Goa, Tamil Nadu and Kerala indicate that
CBR values can go much below replacement level offertility. The rural-
urban differentials in fertility tend to narrow down as fertility declines. In
Kerala, Tamil Nadu and Goa the rural-urban rates are almost the same.
There is greater homogeneity inthe CBR values in urban areas compared
to the rural areas. Surprisingly, among the larger high fertility states in the
north, Bihar exhibits relatively a very rapid decline in the CBR values
during the past five years, mainly because of relatively greater acceptance
offamily planning methods.
The Crude Birth Rate (CBR) is strictly not a measure offertility since it is
affected by the structural changes-the age-sex-marital status distributions
of the population in addition to the fertility rates of married women.
However it is the most important component of population growth in the
country, since the difference of the Crude Birth Rate and the Crude Death
Rate determines the natural growth rates in the population. In the country
as a whole the Crude Birth Rate has declined from 41.7 during the period
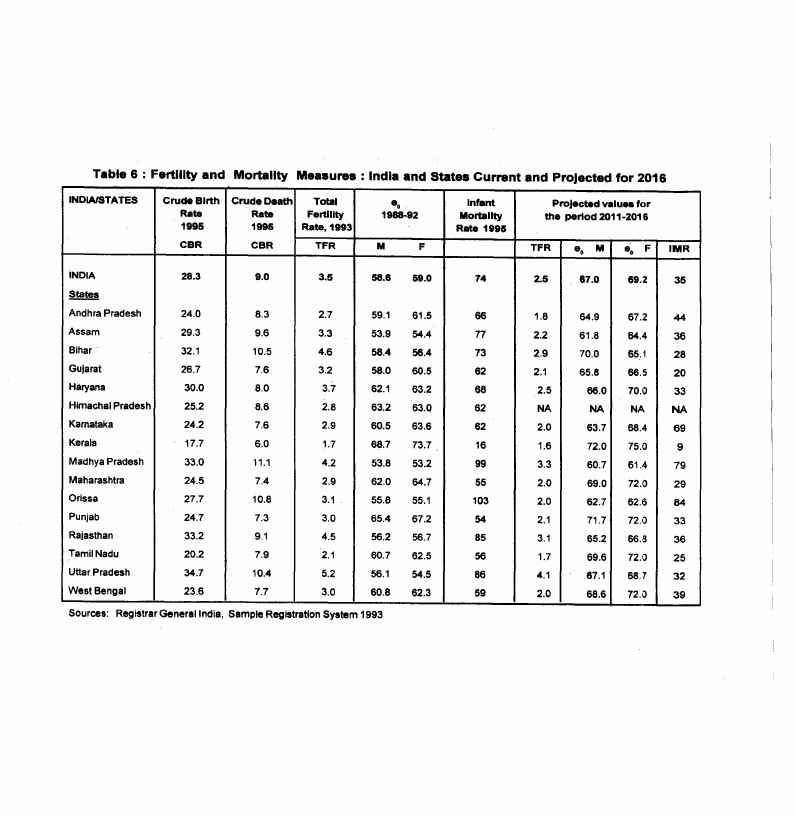
1951-61 to 28.3 in 1995 (SRS Bulletin, 1997). Among the larger states,
in 1995, it has varied from the high levels of 34.7 in UP, 33.2 in
Rajasthan, 33.0 in Madhya Pradesh and 32.1 in Bihar to the low levels
of 17.7 in Kerala and 20.2 in Tamil Nadu. The states of Andhra Pradesh and

2.10 Page 20

▲back to top


Karnataka with the levels of 24.0 and 24.2 are fast progressing to
replacement levels of fertility (Refer Table 6). Extrapolating the trends in
fertility observed during the period 1982-1992 into the future years, the
Technical Group on Population Projections recently appointed by the
Planning Commission has projected the CBR for the country as whole at
21.4 during the period 2011-2016, ranging from a level of29.8 in U.P.
and 26.4 in Rajasthan to low rates (below replacement levels) of 13.5 in
Kerala and 14.2 in Karnataka.
However, an analysis of recent trends in CBR values reveals that the pace
of decline has accelerated since the 'eighties and higher during the five
year period 1987-92 compared to 1982-1987. The annual per cent decline
in CBR was 1.9 in the latter period compared to 1.1 in the earlier period,
almost a 90 per cent increase, in the pace of decline. Though the faster
pace of decline is noticed in almost all states and Union Territories, it is
very rapid, at more than 3 per cent per year, during 1987-92 in Andhra
Pradesh, Kerala, Goa, Nagaland and Sikkim. However it is slow at less
than 1 per cent per year in Rajasthan and UP. Thus there is a possibility
that fertility may decline swiftly even in those states where fertility is
currently high, if proper political and service delivery and supporting
programs are implemented.
The Total Fertility Rate (TFR) is considered to be a refined and reliable
measure of fertility in a population. It is independent of the age-sex
structure of a population and measures the average number of children a
woman will give birth to in her life time if she is subjected to the age
specific fertility schedules observed in the population and there is no
mortality until the end of reproductive span. From Table 6 it can be seen
that for 1993, the TFR for the country as a whole was 3.5, ranging from
the high rates of 5.2 in UP, 4.5 in Rajasthan, 4.6 in Bihar and 4.2 in
Madhya Pradesh to the low and below replacement rates of 1.7 in Kerala
and2.1 in Tamil Nadu. We can see that the TFR of an average woman in
UP is currently more than three times that of an average woman in Kerala.

3 Pages 21-30

▲back to top


3.1 Page 21

▲back to top


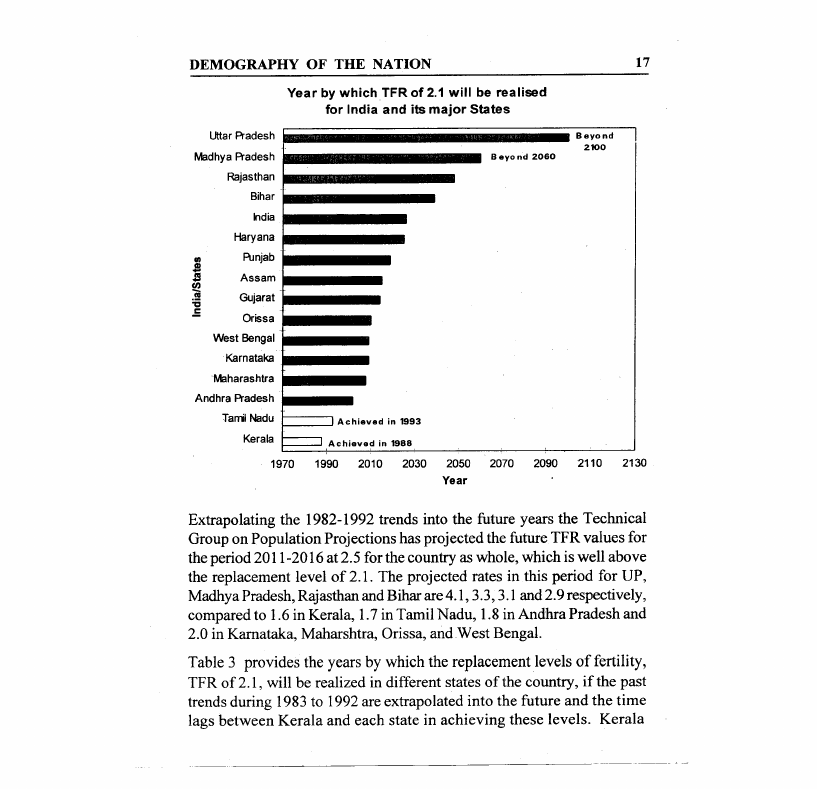
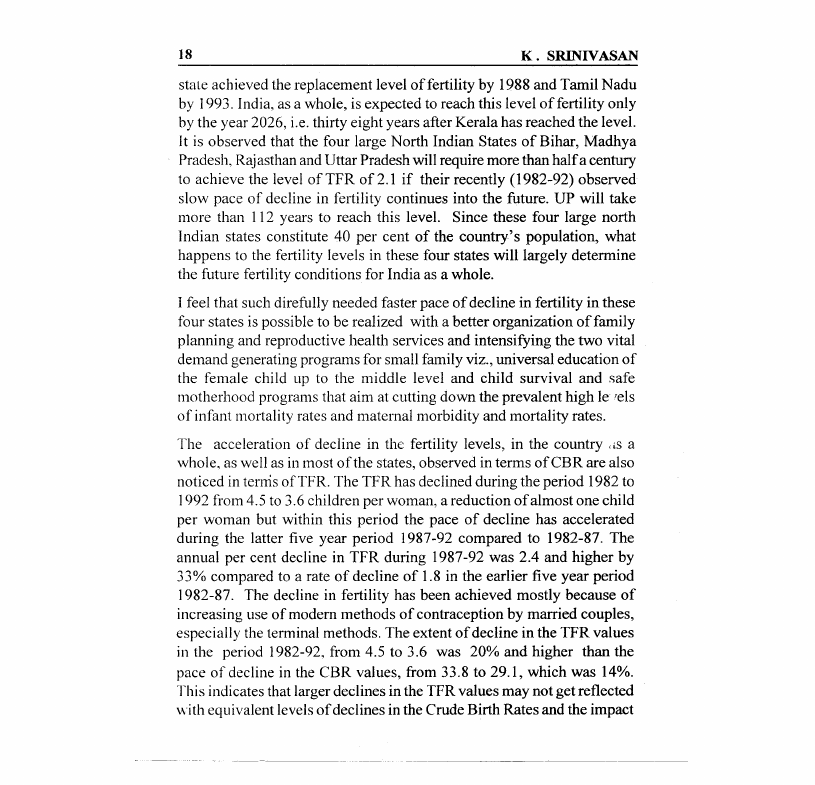
Year by which TFR of 2.1 will be realised
for India and its major States
Uttar Pradesh
Madhya Pradesh
Rajasthan
Bihar
India
Haryana
Punjab
Assam
Gujarat
Orissa
West Bengal
Karnataka
Maharashtra
Andhra Pradesh
Beyond 2060
Beyond
2100
1970
I Achieved in 1993
Achieved in 1988
1990 2010 2030 2050
Year
2070
2090 2110
2130
Extrapolating the 1982-1992 trends into the future years the Technical
Group on Population Projections has projected the future TFR values for
the period 2011-2016 at 2.5 for the country as whole, which is well above
the replacement level of 2.1. The projected rates in this period for UP,
Madhya Pradesh, Rajasthan and Bihar are 4.1, 3.3, 3.1 and 2.9 respectively,
compared to 1.6 in Kerala, 1.7 in Tamil N adu, 1.8 in Andhra Pradesh and
2.0 in Karnataka, Maharshtra, Orissa, and West Bengal.
Table 3 provides the years by which the replacement levels of fertility,
TFR of 2.1, will be realized in different states of the country, if the past
trends during 1983 to 1992 are extrapolated into the future and the time
lags between Kerala and each state in achieving these levels. Kerala

3.2 Page 22

▲back to top


stale achieved the replacement level of fertility by 1988 and Tamil Nadu
by 1993. India, as a whole, is expected to reach this level of fertility only
by the year 2026, i.e. thirty eight years after Kerala has reached the level.
It is observed that the four large North Indian States of Bihar, Madhya
Pradesh, Rajasthan and Uttar Pradesh will require more than half a century
to achieve the level of TFR of 2.1 if their recently (1982-92) observed
slow pace of decline in feliility continues into the future. UP will take
more than 112 years to reach this level. Since these four large north
Indian states constitute 40 per cent of the country's population, what
happens to the feliility levels in these four states will largely determine
the future fertility conditions for India as a whole.
I feel that such direfully needed faster pace of decline in fertility in these
four states is possible to be realized with a better organization of family
planning and reproductive health services and intensifying the two vital
demand generating programs for small family viz., universal education of
the female child up to the middle level and child survival and safe
motherhood programs that aim at cutting down the prevalent high Ie rels
of infant mortality rates and maternal morbidity and mortality rates.
The acceleration of decline in the fertility levels, in the country ,is a
whole, as well as in most ofthe states, observed in terms ofCBR are also
noticed in tenris ofTFR. The TFR has declined during the period 1982 to
1992 from 4.5 to 3.6 children per woman, a reduction of almost one child
per woman but within this period the pace of decline has accelerated
during the latter five year period 1987-92 compared to 1982-87. The
annual per cent decline in TFR during 1987-92 was 2.4 and higher by
33% compared to a rate of decline of 1.8 in the earlier five year period
1982-87. The decline in fertility has been achieved mostly because of
increasing use of modern methods of contraception by married couples,
especially the terminal methods. The extent of decline in the TFR values
in the period 1982-92, from 4.5 to 3.6 was 20% and higher than the
pace of decline in the CBR values, from 33.8 to 29.1, which was 14%.
This indicates that larger declines in the TFR values may not get reflected
with equivalent levels of declines in the Crude Birth Rates and the impact

3.3 Page 23

▲back to top


will always be lower in the coming 20 years. This is because of the
unfavorable age structure of the population in the country, with increasingly
larger proportions ofthe population coming into reproductive ages; even
substantial reductions in the fertility levels of women may not get reflected
in the Crude Birth Rate to the same extent. There may be sluggish changes
in the Crude Birth Rates and in the population growth rates in the coming
years because of changes in the age structure of the population. This
factor called the 'population momentum factor' tends to push up the
CBR values even while there is some decline in the TFR values. Unless
there is a sharp and swift decline in the fertility levels as has happened in
Tamil Nadu or Kerala, in the states of UP, Bihar, Madhya Pradesh and
Rajasthan the population growth may be difficult to be contained in the
coming years in the country.
The Crude Death Rates (CDR) in India have declined from 27.4 during
the decade 1941-51 to 9.0 in 1995 (SRS Bulletin 1997). After a period
of slow down in the pace of decline in the death rates in the late '70s and
early '80s, the pace of decline in the CDR values have shown an
acceleration during the period 1987-92 compared to the earlier five year
period. The annual per cent of decline in CDR during the period 1987-
1992 was 2.4 per cent per year, one third more than in the earlier five year
period 1982-87, at 1.8 per cent. There seems to be an acceleration in the
pace of decline in the Crude Death Rate since 1987 in most of the states
and union territories.
In 1995, the CDR ranged from a high of 11.1 in Madhya Pradesh, 10.8 in
Orissa, 10.5 in Bihar and 10.4 in Uttar Pradesh to a low of 6.0 in Kerala
and 7.4 in Maharashtra. State wise analysis of pace of decline during
1987-92 indicates that the states that recorded a very high pace of
decline in CDR values of more than 5% per year during 1987-1992 are
Arunachal Pradesh, Nagaland, Sikkim and the capital territory of Delhi. It is

3.4 Page 24

▲back to top


50 ,
"'-45 i
40 i
35 I
I
o
1936
Pradesh, Nagaland, Sikkim and the capital territory of Delhi. It is surprising
to note that in spite of all the political turmoil and troubles, the north
eastern states have recorded an acceleration in the pace of decline in the
overall mortality levels of the population.
As expected, the rural areas exhibited a higher CDR values than the urban
areas. In the rural areas, among the larger states, the CDR during 1995
ranged from a high of 11.8 in Madhya Pradesh, 10.8 in Uttar Pradesh
11.2 in Orissa to a low of 6.0 in Kerala and 7.8 in Punjab. In the rural
areas the pace of decline during the period 1987-92 was higher during
1987-92 in most of the states and union territories than in 1982-87. The
lower Crude Death Rates in the urban areas can be partly attributed to the
age distribution of the population in the urban areas with higher proportion
of young population having a lower risk on mortality. However it is found
that the age specific death rates in most ages is substantially lower in the
urban areas than in the rural areas. This is mostly due to the availability of
better health, transportation facilities, enabling the sick and needy to seek
medical advises whenever necessary.

3.5 Page 25

▲back to top


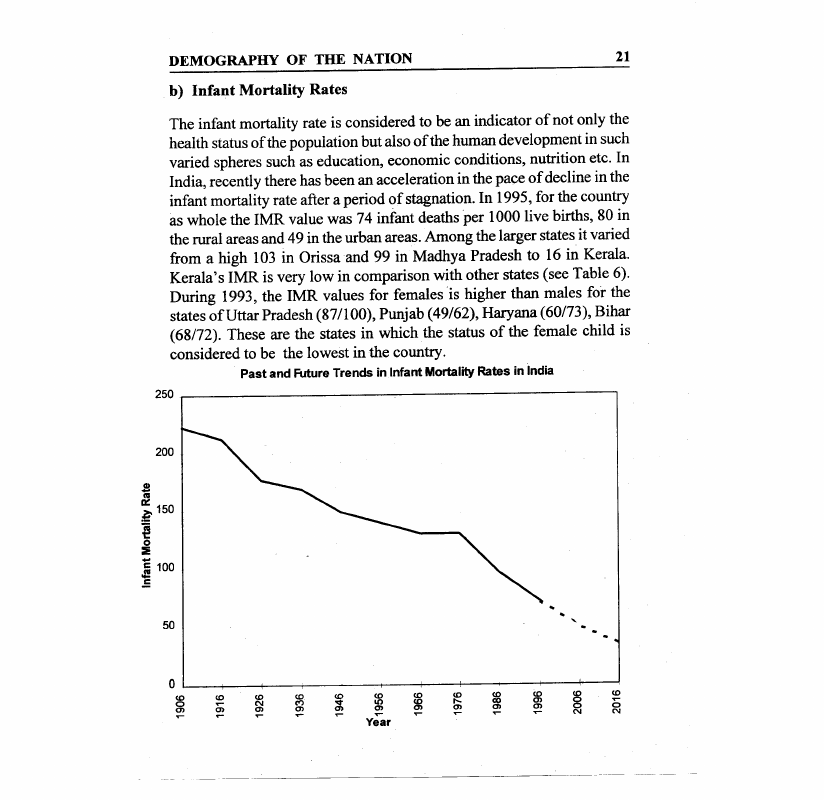
The infant mortality rate is considered to be an indicator of not only the
health status of the population but also of the human development in such
varied spheres such as education, economic conditions, nutrition etc. In
India, recently there has been an acceleration in the pace of decline in the
infant mortality rate after a period of stagnation. In 1995, for the country
as whole the IMR value was 74 infant deaths per 1000 live births, 80 in
the rural areas and 49 in the urban areas. Among the larger states it varied
from a high 103 in Orissa and 99 in Madhya Pradesh to 16 in Kerala.
Kerala's IMR is very low in comparison with other states (see Table 6).
During 1993, the IMR values for females is higher than males fOf the
states of Uttar Pradesh (87/100), Punjab (49/62), Haryana (60/73), Bihar
(68/72). These are the states in which the status of the female child is
considered to be the lowest in the country.
Past and Future Trends in Infant Mortality Rates in India
200
.1!l
III
0:: 150
~
~
•..0
:liE
c: 100
.J5!
50
.. .. ....
0
(I)
e0 •.n..
(I)
C•.D..
(I)
eN •.n..
(I)
C")
e•.n..
(..I,).
e•.n..
(I)
1e.•n0..
(I)
e(.•In.).
(,.I.).
e.•n..
(I)
IeX.n.).
(I)
ee•.nn..
(I)
0
0
N
(.I.).
0
N
Year

3.6 Page 26

▲back to top


However, in recent years IMR is declining at a fairly rapid pace, at 3.6 per
cent per year during 1987-92 compared to 2.2 per cent during the earlier
five year period, 1982-87. This acceleration in the pace of decline in IMR
values is noticed in most of the states and during 1987-92; it is quite
high. at more than 5 per cent per year, in the states of Bihar (5.8 per cent),
Gujarat (6.7 per cent), Kerala (9.3 per cent), Tamil Nadu (5.2 per cent),
U.P.(5.0 per cent) and quite low at less than 2 per cent in states of
Karnataka (0.5 per cent), M.P. (1.8 per cent), Orissa (1.3 per cent) and
West Bengal (1.3 per cent). At the all India level the pace of decline in
IMR values is same for males and females in both the quinquennial periods.
As expected the rural-urban differentials indicate a much lower infant
mortality rate, in the urban areas, almost 40 per cent lower, than in the
rural areas. The pace of decline in both rural and urban areas is significantly
higher during the period 1987-92 compared to 1982-87. In all the states
rural rates are significantly higher than the urban rates. But the differentials
tend to narrow down as the level of infant mortality declines. For exantple
in Orissa, the rural infant mortality rate in 1992 was 121, compared tr the
urban level of72 (a difference of 49 points) while in Kerala which has the
lowest level of infant mortality rate the rural rate is 16 compared to the
urban rate of 12 (a difference of only 4 points). In 1994 the rural ra1e in
the country was 79 infant deaths per 1000 new births ranging from high
of 105 in Madhya Pradesh to a low of 16 in Kerala. In urban areas the rate
was 51 in the country as a whole ranging from 71 from Uttar Pradesh to
a low of 14 in Kerala.
An average life span of a child born in India has increased over the past
four decades from 32.1 years during 1941-51 to 57.3 years during
1981-91, and to 59.4 years during 1989-93. This increase is largely
attributable to the implementation of various programs of public health

3.7 Page 27

▲back to top


and control of communicable diseases after independence in 1947. During
the 1980s the expectation of life has increased to 55.5 years in 1983, to
57.7 in 1988 and to 59.3 in 1991. (See Tables 1 &9). These estimates are
based on the life tables computed from the data collected through the
Sample Registration System providing age specific death rates for the
quinquennium 1980-84, 1985-89 and 1989-93 by the Registrar General
ofIndia. During the recent period 1988-90, the life span increased by half
a year per year compared to 0.4 year per year during the earlier period
1983-88. This acceleration in the pace of increase in life expectancy in
the recent years since 1988, compared to the earlier five year period 1983-
88 has been noticed in most of the larger states in the country.
Among the states, in 1991 (average during 1989-93), the expectation of
life of over 65 years has been observed in Kerala (71.8 years) and Punjab
(66.4 years). Expectation of life below 60 years has been observed in
Assam (54.9years), Bihar (58.4 years) Rajasthan (57.9 years) and Uttar
Pradesh (55.8 years). While more than 0.5 years rise in expectation oflife
per year during 1983 to 1988 has been observed only in four states viz,
Himachal Pradesh, Tamil Nadu, Uttar Pradesh and West Bengal, such an
increase was observed in 11 out of 17 larger states during the period
1988-90, indicating an acceleration in the pace of rise in life expectancy
in recent years.
Given the same level of nutrition, health care and education it has been
observed world over that women live longer than men and the age specific
death rates for women are significantly lower at every age compared to
men. In recent years the gap between the expectation of life of females
and males has been widening in most of the developed countries. The
women live 7-10 years longer than men. In India in 1991 the expectation
oflife for female is only marginally higher than males, 59.7 compared to
59.0. The female expectation oflife was actually lower than the males in
Bihar, Himachal Pradesh, Madhya Pradesh, Orissa and Uttar Pradesh.
These are also the states in which status of women and especially the
female child has been found to be considerably lower than the males.

3.8 Page 28

▲back to top


Comparison of the expectation oflife in rural and urban areas indicate
the familiar pattern of rural longevity being lower than the urban, both
for men and women. In 1990 for India as a whole there is a very
striking difference of almost 7 years, the longevity of rural population
at 57.4 years compared to 64.1 in urban areas. In most of the urban
areas including in those states where the status of women is quite low
as the large north Indian states, the expectation of life of females is
higher than the males in the urban areas. In 1990, the gender disparity
in life expectancy, expressed as a percentage of female to male life
expectancy, was less than 100 only for the state of Rajasthan at 99.7
in the urban areas. Contrary to general expectations, the sex ratio of
life expectancy tilts in favor of females in'rural areas of Rajasthan at
100.5. The gender ratios in the rural and urban areas for 1990 in the
large north Indian States of Bihar, M.P., UP,HP artdOrissa where
levels of urbanization are quite low, generally tends to reduce the
gender bias against females. The health care and nutritional levels of
the females are generally better off in the urban areas than in the rural
areas.
In 1990 the urban expectation of life ranged from a high of 72.3 in
Kerala, 66.4 in West Bengal and 66.2 in Tamil Nadu and 66.3 in
Haryana to a low of 61.9 in Madhya Pradesh .and60.1 in Uttar Pradesh.
There is greater homogeneity in the expectation oflife at birth in the
urban areas of different states in the country with the coefficient of
variation of only 27 per cent. On the other hand there is a considerable
degree of variation in the rural populations among the states with the
expectation of life ranging from high of70.9 in Keralato 52.0 in Madhya
Pradesh and 53.5 .in Assam. However the pace of increase in the
expectationoflife is higher in the ruralareasat 0.6years per year compared
to only 0.3 years per year In the urban areas. There appears to be a
considerable degree of heterogeneity in the provision of health services
and nutritional status ofthe population in the rural areas compared to the
urban areas. The urban popui~tion in all the states in the country are
more homogeneous in these aspects than the rural populations.

3.9 Page 29

▲back to top


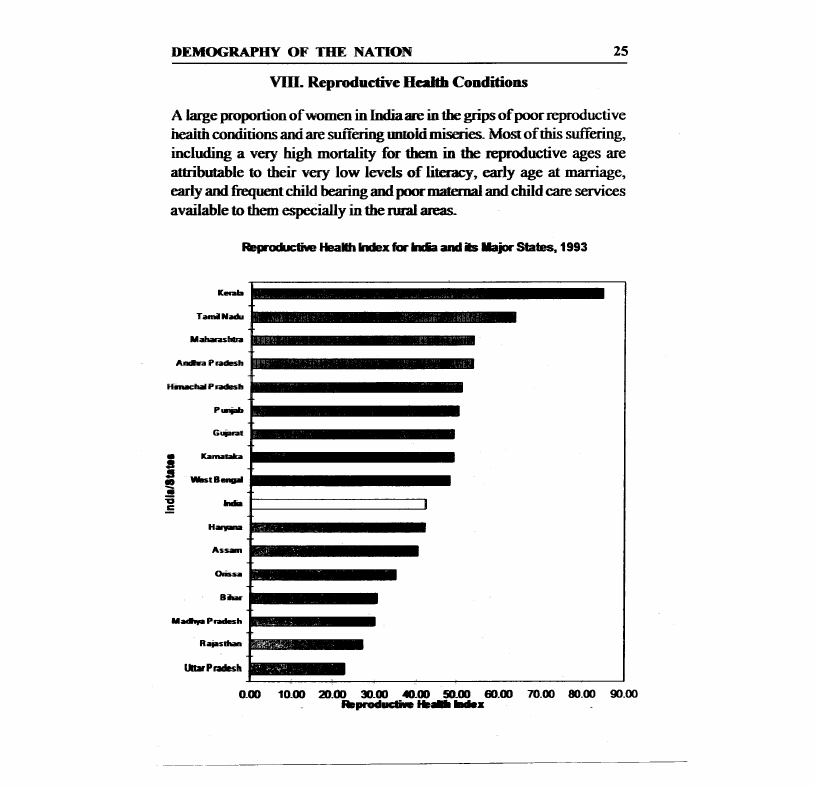
A large proportion of women in India are in the grips of poor reproductive
heaith conditions and are sunering unroidmiseries. Most of this suffering,
including a very high mortality for them in the reproductive ages are
attributable to their very low levels of literacy, early age at marriage,
early and frequent child bearing and poor maternal and child care services
available to them especially in the rural areas.
;
! Wlst B••••••
Ii
.iEi
I
0.00
.
10.00 2IlOO 3IlOO 40.00 50.00 60.00 70.00 80.00 90.00
Raproduclhe lit •••••••

3.10 Page 30

▲back to top


The adult literacy rate among women aged 15 and above was reported at
33. Y% in 1991 census and as such about two in three adult women are
illiterate in the country. This works out to about 190 million women aged
15 and above illiterate in the year 1996. This is the largest pool of illiterate
women present in any country in the world andit does not speak well of
our achievements even after 50 years of independence. The adult literacy
rates vary from the highest level of 81% in Kerala to low of 17.5% in
Rajasthan. All the four Hindi speaking states have female adult literacy
rates less than 25%. With 8 out of 10 adult women remaining illiterate in
these four states, the health services will have an uphill task of motivating
the women to avail of modem health facilities including contraceptive
services. (See Tables 8)
b) Contraceptive use
The percentage of eligible couples effectively protected (CEP) by any
modem contraception has increased significantly for all India and for all
the states although the pace is more rapid in some compared to others.
For the country as a whole the increase is by 30.3 percentage points from
13.2 in 1972 to 43.5 in 1993. The annual rate of increase in CEP values
during the 1980s is substantially higher than in the earlier decade (1.90
per cent compared to 1.05 per cent). The average annual increase in CEP
values during 1982-92 was more than in 1972-82 in most states barring
the states of West Bengal, Assam and Meghalaya. A net addition of over
2% per year considered to be a remarkable achievement has been realized
in the northern states of Haryana, HP, Gujarat, Punjab, UP, the southern
states of Kerala, Kamataka and Tamil Nadu and the Union Territories of
Andaman and Nicobar Islands, Dadra and Nagar Haveli and Pondichery
for the time period 1982-92. Among the states, the maximum CEP value
for the year 1992 is observed for Punjab (73.6%). This appears unrealistic
in view of the fact that the state is not showing a concomitant decline in
TFR which was a high 3.1 for the year 1992. The CEP value for the year
1993 has gone down slightly form the 1992 level. There is a discrepancy

4 Pages 31-40

▲back to top


4.1 Page 31

▲back to top


between increase in contraceptive use and decline in fertility in many states.
Surprisingly even UP has shown an increase of 22.1 percentage points be
attributed partly to errors and biases in the CEP values and partly to
differentials in the fertility potentials of acceptors and non-acceptors.
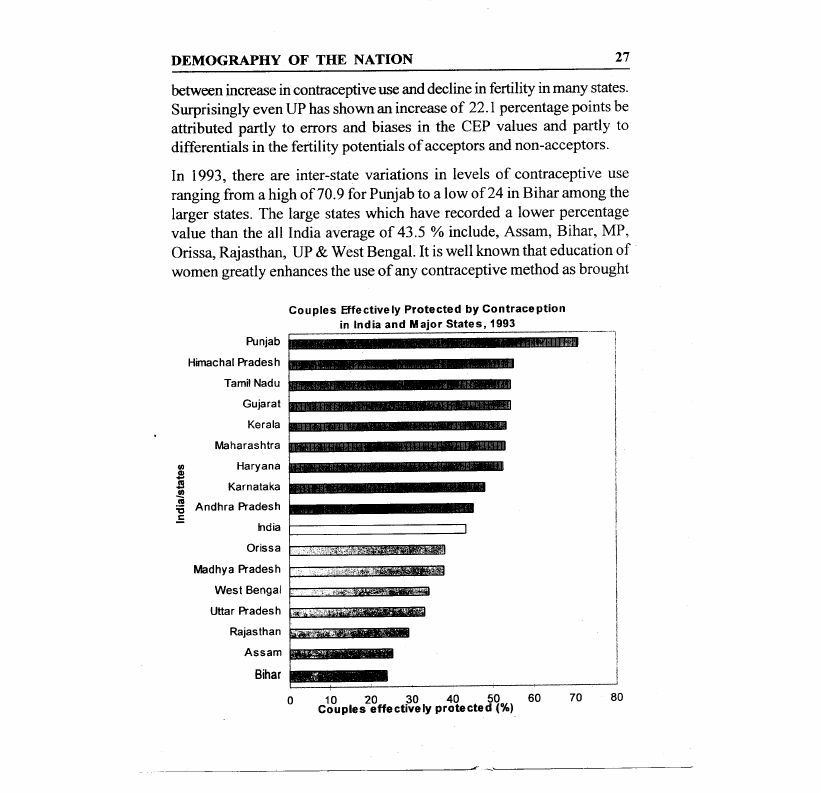
In 1993, there are inter-state variations in levels of contraceptive use
ranging from a high of70.9 for Punjab to a low of24 in Bihar among the
larger states. The large states which have recorded a lower percentage
value than the all India average of 43.5 % include, Assam, Bihar, MP,
Orissa, Rajasthan, UP & West Bengal. It is well known that education of
women greatly enhances the use of any contraceptive method as brought
Couples Effectively Protected by Contraception
in India and Major States, 1993
Punjab
Himachal Pradesh
Tamil Nadu
Gujarat
Kerala
Maharashtra
.I$II
Haryana
.l!l
III
Karnataka
:cIi Andhra Pradesh
.5
India
Orissa
Madhya Pradesh
West Bengal
Uttar Pradesh
Rajasthan
Assam
Bihar
10 20 30 40 50 60
Couples effectively protected (%)

4.2 Page 32

▲back to top


K . SRINIVASAN
out by the National Family Health Survey conducted during 1992-93 (lIPS,
1993). Education levels are divided into four mutually exclusive categories
of illiterate, literate less than middle, middle complete and high school
and above. There appears to be a marked increase in the use of
contraception as one transcends from illiterate to literate category. Beyond
that for the other two categories, there is a marginal increase at the level
of All India although the same trend is not witnessed for all the states. A
notable exception is Kerala where a considerably high percentage of eligible
illiterate women are also reported usingany method of contraception and
the percentage actually declines as one moves to the other three categories
of educational levels.
The National Family Health Survey (NFHS) has compiled data on the
extent of unmet need for family planning among currently married women
in the reproductive ages. A woman is considered to have an unmet need
for limitation of family, if she has reported as not wanting an additional
child at all at the time of the survey and she is not using any method of
family planning; and she is considered to have an unmet need for spac :ng,
if she does not want the next child for another two years but still not using
any spacing method to protect herself from unwanted pregnancy.
The details of the procedures adopted in the computation of the unmet
need for spacing, limitation and total unmet need can be had from the
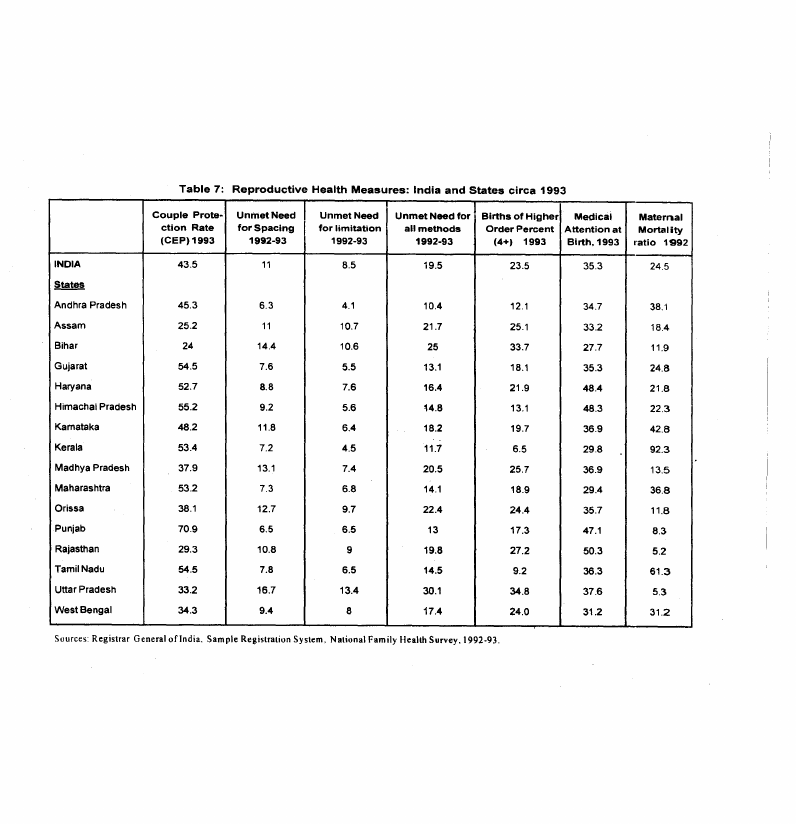
NFHS Survey Report, 1992-1993 (lIPS 1995). Table 7 provides the
estimates of unmet needs for spacing and limitation for the major states
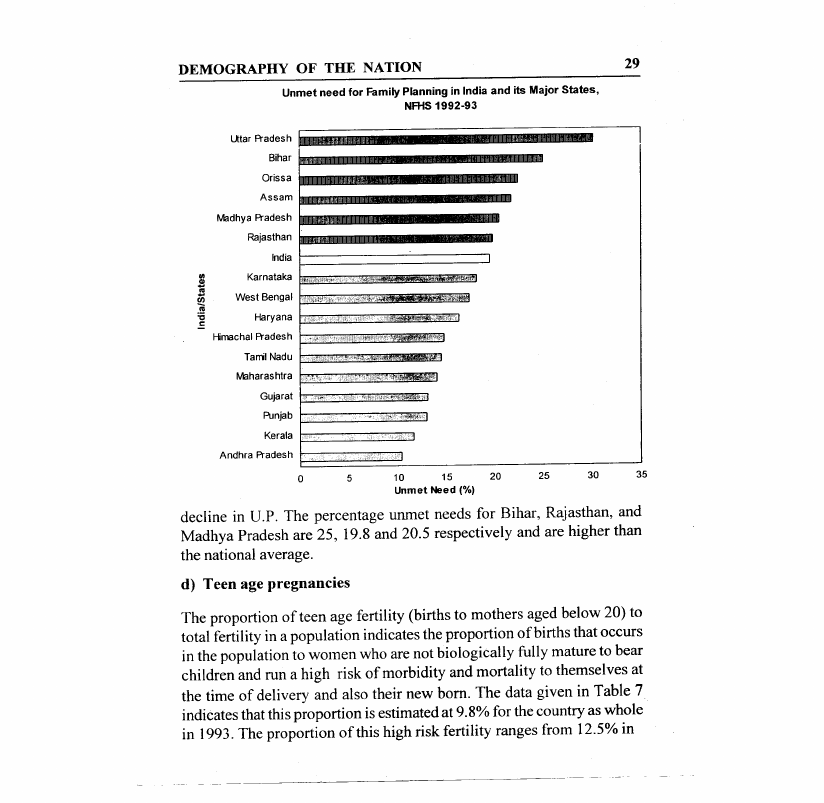
as computed from the survey. For the country as whole, the total unmet
need for family planning is 19.5%, with 11% for spacing and 8.5% for
limitation. The unmet need is maximum in the state ofU.P. at 30.1 % and
minimum in Andhra Pradesh at 10.4%. This is an interesting finding,
implying that inspite of the low levels of female literacy and higher
preference for male children in U.P., there is almost 30% unmet need for
family planning and organization of good quality services and meeting
the existing unmet need for family planning would go a long way in fertility

4.3 Page 33

▲back to top


Unmet need for Family Planning in India and its Major States,
NFHS 1992-93
Uttar A"adesh !lInIHHIUIM1II!IlIlIfflmIUlIOO"i1i.W'
Bihar
Orissa
Assam
Madhya A"adesh
Rajasthan
India
~III
Karnataka
.f!
Ul
West Bengal
(;j
i.5:
Haryana
Himachal A"adesh
Tamil Nadu
Maharashtra
GUjarat
Punjab
:,:,'ii";;
Kerala
Andhra A"adesh
,;; ii'l
10
15
20
Unmet Need (%1
decline in U.P. The percentage unmet needs for Bihar, Rajasthan, and
Madhya Pradesh are 25, 19.8 and 20.5 respectively and are higher than
the national average.
d) Teen age pregnancies
The proportion of teen age fertility (births to mothers aged below 20) to
total fertility in a population indicates the proportion of births that occurs
in the population to women who are not biologically fully mature to bear
children and run a high risk of morbidity and mortality to themselves at
the time of delivery and also their new born. The data given in Table 7
indicates that this proportion is estimated at 9.8% for the country as whole
in 1993. The proportion of this high risk fertility ranges from 12.5% in

4.4 Page 34

▲back to top


Madhya Pradesh, 12.9% in West Bengal, and 22.2% in Andhra Pradesh
to 5.9% in Kerala, 6.9% in UP. and 3.7% in Punjab. It is surprising that
Andhra Pradesh has a very high proportion of births, almost one-fifth,
among teen agel'Swhile the proportion is very low in Uttar Pradesh. Where
the TFR is high, as in Uttar Pradesh, while the proportion of teen age
fertility to TFR may be lower, the percentage of women of this age group
exposed to this risk may be high. Detailed analysis of data on teen age
fertility reveals that there are strong rural-urban differentials in this
category of high-risk births, with rural women exhibiting significantly
higher proportion of fertility before the age of20, compared to the urban
women.
Current understanding of maternal mortality in India - levels, causes and
patterns - is at best incomplete and unsatisfactory in contrast to infant
mortality, for which estimates are available at regular intervals from
Registrar General ofIndia. There is no good system for collecting maternal
mortality data on a routine basis. Yet it is clear, even from the existing
inadequate data, that maternal mortality rates and ratios in India are quite
high. It is estimated that India, which has only about 15 per cent of the
world's population, accounts for over 20 per cent of the world's maternal
deaths. (Defined as the number of maternal deaths per 10,000 live births)
The maternal mortality ratios (MMR) for the rural areas can be estimated
by using the data available in the annual reports of Survey of Causes of
Death published by the office of the Registrar General, India, on the
proportion of death due to different causes in selected samples of rural
only. According to their estimates, MMR for All India is estimated to be
453 deaths per 100,000 live births, which is somewhat higher than the
NFHS estimate of 437 deaths, for the year 1992. The inter-state
differentials are startling with a lowest value of 87 deaths for Kerala and
an alarmingly high of738 deaths for Orissa. The other states which revealed
a strikingly high level ofMMR are M.P., UP, Rajasthan, Assam and Bihar.
(Table 7)

4.5 Page 35

▲back to top


The NFHS estimate of 43 7 for MMR is however lower than estimates
for earliest periods, namely community based estimates which were
derived from small number of maternal deaths; in limited areas.
Although the available data are not adequate to support firm
conclusions, the maternal mortality rate and ratio should have been
declining over time with falling birth rates and decline in the number
of births to high risk married women at young age (below 20) and
older age. Given the current levels fertility and mortality in India, a
maternal mortality ratio of 437 per hundred thousand live births, results
in a maternal mortality rate of about 55 maternal deaths per hundred
thousands women of reproductive age. This level of maternal mortality
also means that about 15 per cent of all deaths of women of child
bearing age are maternal deaths. For a comparison, it is found that the
niatemal mortality ratios in Europe are on the order of 10 per hundred
tlwusands live births or about 2% of Indian levels. Because of- the
greater likelihood of Indian women becoming pregnant, combined
with a greater likelihood that she will die once she becomes pregnant,
the average Indian women is almost 50 times more likely to die of a
maternity related cause than her sisters in the industrial world.
f) Low proportion of deliveries attended by trained
professionals
The Sample Registration System (SRS) compiles and publishes data on
the type of attendants at the deliveries that occurred each year in the
selected sample on villages and urban blocks. These data facilitate
computation of perCentage of live births attended to by skilled personnel
either in institutions or at home. Considering only the percentage of
deliveries at institutions in 1993, we find that this proportion remains still
WlaCCep1:ab1loyw, inspite of expansion of maternal and child health facilities
throughout the country (Registrar General, 1995). At the national level
only 24.5% of the deliveries in 1993 took place in medical institutions

4.6 Page 36

▲back to top


and this proportion varied from 92-3% in Kerala to low of 5.2% in
Rajasthan, 5.3% in U _P.and surprisingly a low of 8.3% in Pun,iab. Bihar
has reported a higher proportion of institutional deliveries 11.CJOIO than
Punjab.
In 1993 the proportion of deliveries receiving skilledattmtion varied from
a high of98 percent in Kerala, 85.3 percent in Haryanaand 11.1 percent
in Tamil Nadu to alowof33.2 per cent in Uttar Pradesh, 24.6 per cent in
Rajasthan, 29.2 per cent in Orissa, 21.6 per cent in Madhya Pradesh, 21.5
per cent in Bihar and 30.3 per cent in Assam. There is a high correlation
between the level of infant mortality, U-5 mortality and expectation of
life at birth and the simple indicator of proportion of deliveries attended
to by trained professionals, either in institutions or at home.. Though in all
the states this proportion of women receiving skilled attention at the time
of delivery has been increasing, the pace of change is quite slow in the
states of Bihar, Madhya Pradesh, Rajastbanand Uttar PIadeshand Orissa
.where less than one third of the deliveries are aUended to by skilled persons.
As expected the conditions in rural areas are far worse off than in urban
areas. In the rural areas only around 40 percent of all deliveries have
received skilled attention at the time of delivery compared to 84 pen:ent
in the urban areas in 1992. In rural areas this propodion has nmged among
the states very widely from high of96.1 pen:ent in Keralaand 95.1 pen:ent
in Punjab to a low of 25 percent or less in the s1ates of Uttar Pradesh,
Rajasthan, Orissa, Madhya Pradesh, Bihar and Assam.. The inters1ate
variation in the availability of basic health care services is very large in
rural areas as compared to the variation in the urban areas among the
states. In urban areas, the proportion of deliveries atteneJed to by skilled
persons has ranged from over 99% in"KeraIa and Punjab to a low of 62.8
percent in Bihar and 63.3 percent in Orissa.. In urban areas. insIitutional
facilities for delivery are available in all districts in the coon1Iy and serves

4.7 Page 37

▲back to top


as a homogenizing factor in the percentage of women receiving skilled
attention among the different states. However, in rural area the availability
of such facilities is not uniform around the state and hence even in the
provision of domiciliary care by trained birth attendants varies considerable
from state to state.
Important among fertility related factors contributing to an increased risk
of maternal and infant mortality are mother's age at thetim~ of birth, the
interval between births and the order of a birth. Each of these factors is
associated with a high risk of mortality for mother and child and together
they compound the'risk." In terms of the impact of each of the factors on
decline in maternal mortality and of infant mortality, it is observed that
higher order births, of order 4 and above, carry significantly higher relative
risks compared to the other two' factors viz. poor spacing or births to
younger or older women (below age 18 or above 35) (lIPS, 1995).
Many studies within India and abroad (NFHS, 1995) have revealed that
children born with in a short interval from the earlier birth especially within
24 months, run a risk of neo-natal and post neo-natal mortality rates and
such deliveries carry a higher risk ~o the survival of the mother as well.
Poor spacing depletes the health of the mother and contributes to increased
maternal morbidity and mortality. In India for the country as a whole,
from the data published by Registrar General on the basis of Data compiled
in the Sample Registration System (RGI, 1995), it is really distressing to
note that in 1993 more than one third of all births of order two and above
(35.3 percent) have occurred within 24 months ofthe earlier birth (Table
7). This percentage has declined from 38.5 percentage points in 1990 to
35.3 in 1993. But the pace of decline has been very slow. In India
mothers seem to give births in rapid succession even under conditions
of rapid fertility decline as evident in the state ofKerala which has the
lowest fertility rate ofthe country where almost 30 percent of mothers
who have their second or higher order births in 1993 were poorly
spaced with the birth occurring within 24 months of the earlier child.

4.8 Page 38

▲back to top


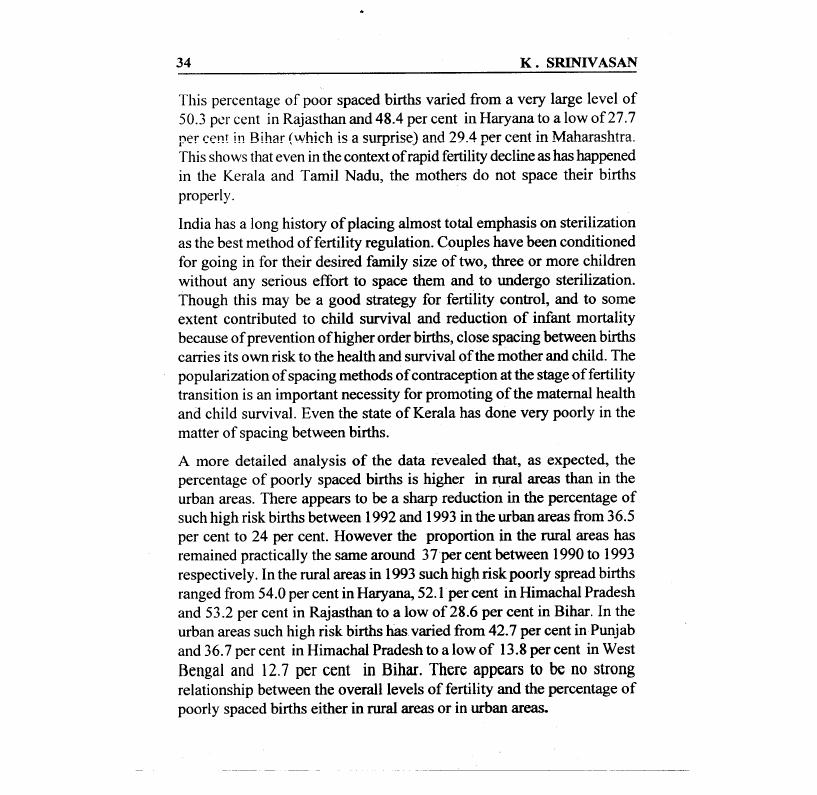
This percentage of poor spaced births varied from a very large level of
50.3 per cent in Rajasthan and 48.4 per cent in Haryana to a low of27. 7
per cent in Bihar (which is a surprise) and 29.4 per cent in Maharashtra.
This shows that even in the context of rapid fertility decline as has happened
in the Kerala and Tamil Nadu, the mothers do not space their births
properly.
India has a long history of placing almost total emphasis on sterilization
as the best method of fertility regulation. Couples have been conditioned
for going in for their desired family size of two, three or more children
without any serious effort to space them and to undergo sterilization.
Though this may be a good strategy for fertility control, and to some
extent contributed to child survival and reduction of infant mortality
because of prevention of higher order births, close spacing between births
carries its own risk to the health and survival of the mother and child. The
popularization of spacing methods of contraception at the stage of fertility
transition is an important necessity for promoting of the maternal health
and child survival. Even the state of Kerala has done very poorly in the
matter of spacing between births.
A more detailed analysis of the data revealed that, as expected, the
percentage of poorly spaced births is higher in rural areas than in the
urban areas. There appears to be a sharp reduction in the percentage of
such high risk births between 1992 and 1993 in the urban areas from 36.5
per cent to 24 per cent. However the proportion in the rural areas has
remained practically the same around 37 per cent between 1990 to 1993
respectively. In the rural areas in 1993 such high risk poorly spread births
ranged from 54.0 per cent in Haryana, 52.1 per cent in Himachal Pradesh
and 53.2 per cent in Rajasthan to a low of28.6 per cent in Bihar. In the
urban areas such high risk births has varied from 42.7 per cent in Punjab
and 36.7 per cent in Himachal Pradesh to a low of 13.8 per cent in West
Bengal and 12.7 per cent in Bihar. There appears to be no strong
relationship between the overall levels of fertility and the percentage of
poorly spaced births either in rural areas or in urban areas.

4.9 Page 39

▲back to top


DEMOGRAPHY OF THE NATION
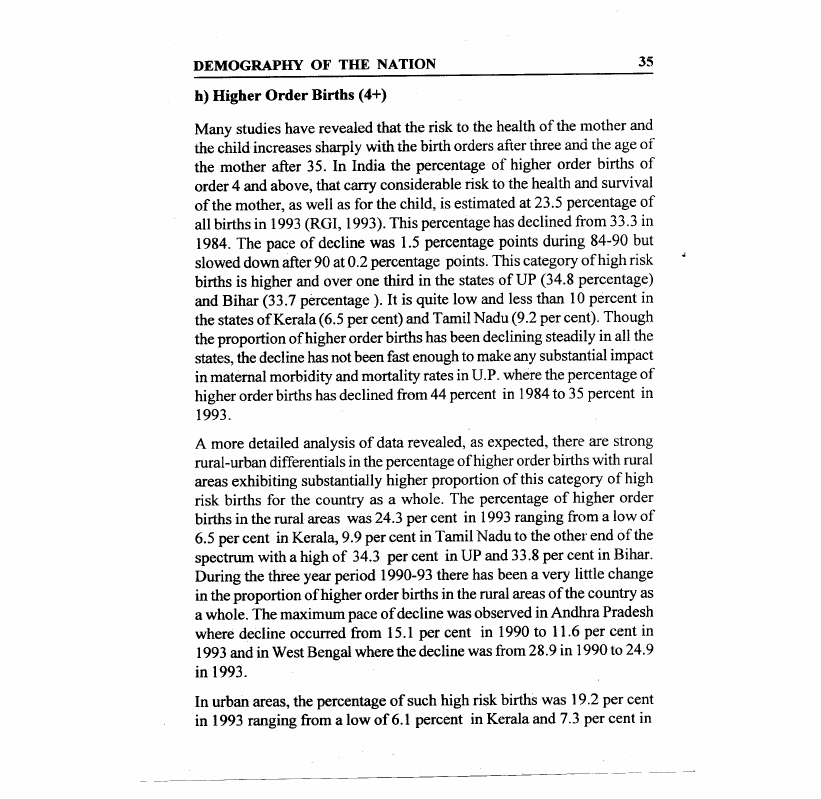
h) Higher Order Births (4+)
Many studies have revealed that the risk to the health of the mother and
the child increases sharply with the birth orders after three and the age of
the mother after 35. In India the percentage of higher order births of
order 4 and above, that carry considerable risk to the health and survival
of the mother, as well as for the child, is estimated at 23.5 percentage of
all births in 1993 (RGI, 1993). This percentage has declined from 33.3 in
1984. The pace of decline was 1.5 percentage points during 84-90 but
slowed down after 90 at 0.2 percentage points. This category of high risk
births is higher and over one third in the states of UP (34.8 percentage)
and Bihar (33.7 percentage ). It is quite low and less than 10 percent in
the states ofKerala (6.5 per cent) and Tamil Nadu (9.2 per cent). Though
the proportion of higher order births has been declining steadily in all the
states, the decline has not been fast enough to make any substantial impact
in maternal morbidity and mortality rates in u.P. where the percentage of
higher order births has declined from 44 percent in 1984 to 35 percent in
1993.
A more detailed analysis of data revealed, as expected, there are strong
rural-urban differentials in the percentage of higher order births with rural
areas exhibiting substantially higher proportion of this category of high
risk births for the country as a whole. The percentage of higher order
births in the rural areas was 24.3 per cent in 1993 ranging from a low of
6.5 per cent in Kerala, 9.9 per cent in Tamil Nadu to the other end ofthe
spectrum with a high of 34.3 per cent in UP and 33.8 per cent in Bihar.
During the three year period 1990-93 there has been a very little change
in the proportion of higher order births in the rural areas of the country as
a whole. The maximum pace of decline was observed in Andhra Pradesh
where decline occurred from 15.1 per cent in 1990 to 11.6 per cent in
1993 and in West Bengal where the decline was from 28.9 in 1990 to 24.9
in 1993.
In urban areas, the percentage of such high risk births was 19.2 per cent
in 1993 ranging from a low of 6.1 percent in Kerala and 7.3 per cent in

4.10 Page 40

▲back to top


Tamil Nadu to a high of37.9 percent in UP and 30.8 per cent in Bihar.
Compared to large Hindi speaking states of the north the other states
have recorded substantially lower percentage of higher order births. It
has been corroborated by studies that relative risk to a life of the mother
at the birth of the child of four and above is almost 10 times more than the
birth of the second or third child even after controlling for her socio-
economic conditions.
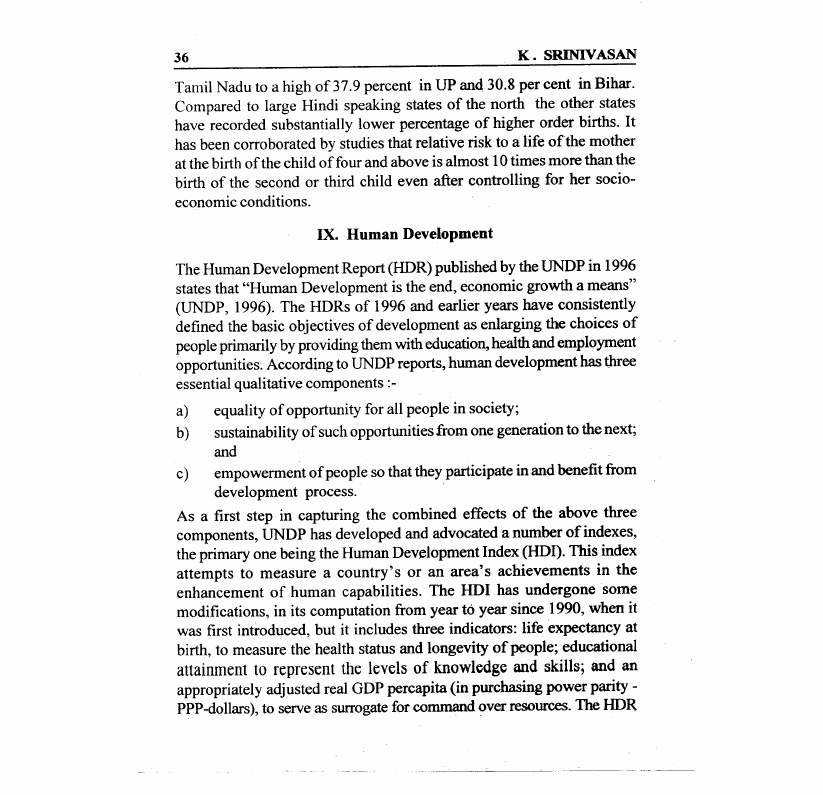
The Human Development Report (HDR) published by the UNDP in 1996
states that "Human Development is the end, economic growth a means"
(UNDP, 1996). The HDRs of 1996 and earlier years have consistently
defined the basic objectives of development as enlarging the choices of
people primarily by providing them with education, health and employment
opportunities~ According to UNDP reports, human development has three
essential qualitative components :-
a) equality of opportunity for all people in society;
b) sustainability of such opportunities from one generation to the next;
and
c) empowerment of people so that they participate in and benefit from
development process.
As a first step in capturing the combined effects of the above three
components, UNDP has developed and advocated a number of indexes,
the primary one being the Human Dev~lopment Index (HDI). This index
attempts to measure a country's or an area's achievements in the
enhancement of human capabilities. The HDIhas undergone some
modifications, in its computation from year t6 year since 1990, when it
was first introduced, but it includes three indicators: life expectancy at
birth, to measure the health status and longevity of people; educational
attainment to represent the levels of knowledge and skills; and an
appropriately adjusted real GDP percapita (in purchasing power parity-
PPP-dollars), to serve as surrogate for command over resources. The HDR

5 Pages 41-50

▲back to top


5.1 Page 41

▲back to top


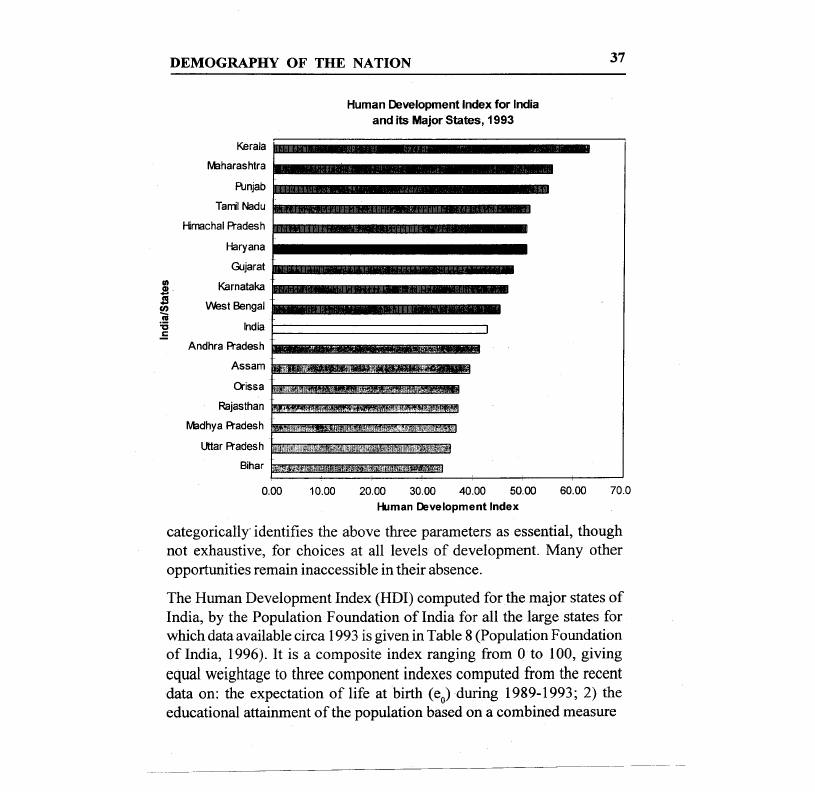
Human Development Index for India
and its Major States, 1993
Kerala
Maharashtra
A.mjab
Taml Nadu
Hirrachal A"adesh
Haryana
Gujarat
.eIII
Karnataka
S
west Bengal
:~s
.5
India
Andhra A"adesh
Assam
Orissa
~, Rajasthan
Madhya A"adesh
Uttar A"ades h
Bihar
0.00 10.00 20.00 30.00 40.00 50.00 60.00 70.0
Human Development Index
categorically identifies the above three parameters as essential, though
not exhaustive, for choices at all levels of development. Many other
opportunities remain inaccessible in their absence.
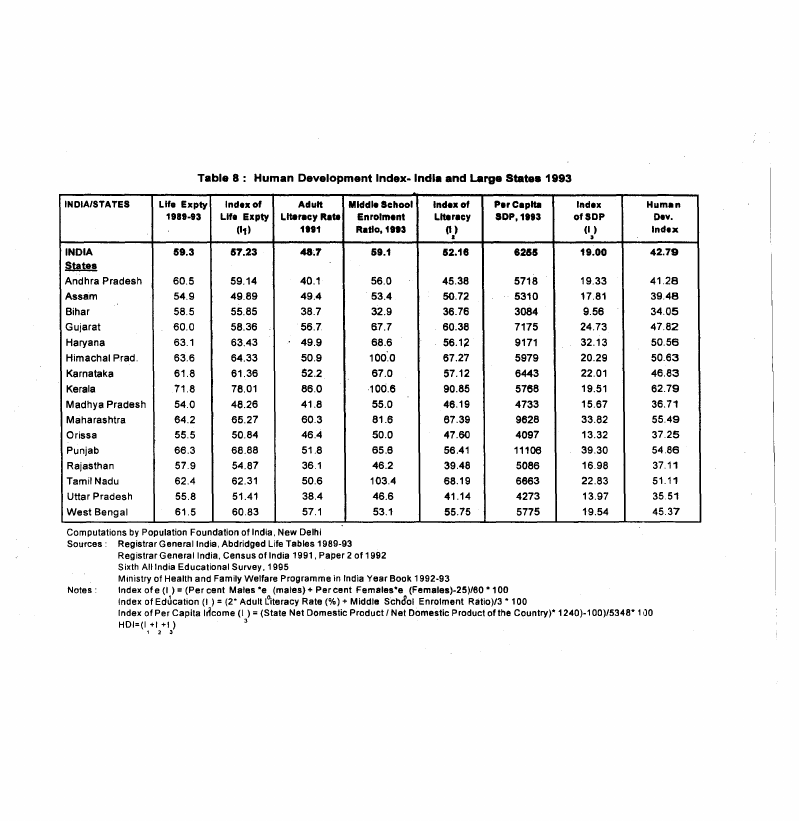
The Human Development Index (HDI) computed forthe major states of
India, by the Population Foundation of India for all the large states for
which data available circa 1993 is given in Table 8 (Population Foundation
of India, 1996). It is a composite index ranging from a to 100, giving
equal weightage to three component indexes computed from the recent
data on: the expectation of life at birth (eo) during 1989-1993; 2) the
educational attainment of the population based on a combined measure

5.2 Page 42

▲back to top


of the adult literacy levels in 1991 and the enrollment ratio in middle
school in 1993; and 3) the purchasing power parity price adj usted percapita
net state domestic product for 1993 measured in dollar terms. The
procedures for the computation of HDI are identical to the procedures
used in the UNOP report of 1996, excepting for school enrollment ratio.
While the UNOP used the enrollment ratio for primary, secondary and
tertiary levels, in this analysis was used the enrollment ratio only for the
middle schoolleve1 for which the data were most reliable.
The HOI for India as whole by this modification turned out to be 43 on a
o to 100 scale, and close to the level of 44 given in the 1996 UNDP
Report. India, with an HDI value of 43 ranks quite low in the comity of
nations, with a rank of 135 among 174 countries studied by the UNDP,
based on data for 1992, and published in their 1996 Report. There is a
good deal of variation in the HDI values across the states. Kerala with an
HOI value of 63 ranks highest among the states. In the international
scene, its HOI rank would place it at 105 and above China and Egypt
(with an HDI of61). The lowest HDI values were observed in Bihar with
a value of 34 and Uttar Pradesh (36) and these values are comparable to
the HDI value of Nepal (33) given in the 1996 HDR. These states will be
ranked 150 and 151 at the international level. The states with HDI score
of 50 and above are Haryana, Himachal Pradesh, Kerala, Maharashtra,
Punjab and Tamil Nadu. The states having scores below 40 are the large
Hindi speaking states of the north: Bihar, Madhya Pradesh, Rajasthan
and Uttar Pradesh.
As already mentioned, HDI is an equally weighted index of three
components: index of life expectancy, index of educational attainment
and index of parity adjusted percapita income. In these three components,
the range of variation (in a score of 0 to 100) is from a maximum of 78 in
Kerala to a minimum in Madhya Pradesh for life expectancy; from a
maximum of91 in Kerala to 37 in Bihar in terms of educational attainment
and from a maximum of 39 in Punjab to a minimum of lOin Bihar for
parity price adjusted income. Thus the variability is higher in terms of
educational attainments than in the case of life expectancy or per capita

5.3 Page 43

▲back to top


income. These data reinforce the need to achieve parity among the states
in terms of educational attainment i.e., adult literacy and educational
enrollments as the priority item in human development, ranking higher
than health and income. The correlation coefficient of HDI with the
contraceptive protection rate and total fertility rate in 1994, taking the
state as the unit of analysis were +.78 and -0.77 respectively, and
statistically significant implying that efforts at human development will
have a significant payoff in terms of increased contraceptive use and
reductions in fertility. The Human development Index is the measure of
overall levels of human development in the society and does not measure
the gender disparities that exist particularly in education. This is captured
by the Gender-related Health Index( GHI) which is discussed next.
About half the population in India is comprised of women and any
developmental process and program in which women do not actively
participate and fruits from which are not shared equitably are neither
sustainable nor desirable. As the Human Development Report points out
'development if not engendered is indeed endangered'. The Gerder-related
Health Index (GHI) developed at the Population Foundation ofIndiais a
measure of the gender inequalities in the state, in selected health and
education-related parameters. On the mortality front the indicators oflife
expectancy at birth (eo) and the infant mortality rate (IMR) have been
used and in the direction of social well being, educational attainment has
been included. It is constructed in such a way that the higher the index,
the higher is the gender equality. If there is no discrimination against the
female at the familial and societal levels, then at any given level of overall
mortality in a population, females live longer than males and the infant
mortality rates are lower for the female infants than for the males.
This is a biological gift endowed on the female sex.
If there had been equality of opportunity for education for the two
sexes, then there should not have been any difference in the educational
attainment of females and males. The index compares the disparity

5.4 Page 44

▲back to top


Kerala
Maharashtra
Tamil Nadu
Punjab
Himachal Pradesh
GUjarat
West Bengal
1/1
Karnataka
S
,£!I
..!!?
Haryana
III
:0
.5
Andhra Pradesh
India
Assam
Bihar
Rajasthan
Uttar Pradesh
Madhya Pradesh
Orissa
0.00 10.00 20.00 30.00 40.00 50.00 60.00 70.00 80.00 90.0
Gender Health Index
between the male and the female values of eo' IMR, and educational
attainment and computes an 'equally distributed index' on each of these
three parameters and combines them into a composite index by assigning
equal weights to them. The method of computation of the index is identical
to the one used by the UNDP in their 1996 HDR for the construction
of Gender-related Development index (GDI). While GDI uses the
parameters of eo' IMR and the share of the earned income between the
two sexes. the last part has become extremely difficult to compute in

5.5 Page 45

▲back to top


the Indian situation in view of the fact that a large number of women in
the rural areas are engaged in the agricultural sector on in family enterprise
without any monetary income and hence, their contribution to the economy
has been grossly underestimated. Therefore we omitted an income based
index and instead used educational attainment as proxy for positive health
as the third parameter and called the index the gender-related Health Index
(GHI). The index is measured in 0 to 100 scale; the higher the score the
higher is the gender equity. The details of the computation can be had
from United Nations (1997). The GHI values are given in Table 9.
There are considerable state level disparities in this index also, as observed
in HDI. As expected, Kerala leads the gender equity in health with a
score of 88 and the minimum is noticed in the state of Orissa with a score
of34. Bihar, Madhya Pradesh, Rajasthan and Uttar ·Pradesh all have scores
of 44 or less. Since this index is based on gender disparities and not on
levels as such, it is worth reiterating that females are at greater disadvantage
in these states, irrespective of their economic conditions. Among the
southern states Andhra Pradesh has the lowest GHI score of 50 and among
the northern states Punjab has the highest score of61.
Ifwe study the equity indexes of the three component parameters ofGHI
separately, we find that on the gender equity in expectation oflife at birth,
the highest score is in Kerala (78) and the lowest is in Madhya Pradesh
(48). On the parameter of infant mortality rate, the maximum score is
again. in Kerala 96 and the minimum is in Orissa at 9. On the index of
education the maximum gender equity score is again in Kerala at 91 and
the minimum is at Bihar, 28. Thus we see that the largest inter-state
differences is observed on the parameters of infant mortality rate with a
range of variation of87 in a 100 point scale. The discriminatory care given
to the female infant immediately after birth is a direct reflection of the
gender biases prevalent in the society, and the resolution of this problem
is a major task of social reformers committed to the breaking away from
the age old customs operating against the female child. Kerala seems
to be uniquely placed with a very high score compared to all other

5.6 Page 46

▲back to top


states in each of the three component parameters of Human Development
Index (HOI) and Gender-related Health Index ( GHI). The Correlation
Coefficients of Contraceptive Protection Rate and TFR with GDI are
+0.65 and -0.77 respectively, and statistically significant. This indicates
that reduction in gender disparities in health and education (implied in
increase in GOI values) will contribute to increased use of contraceptive
and reduction in fertility.
From the foregoing discussions, we can conclude that future levels and
trends in the fertility of the large Hindi speaking states oflndia will largely
determine the population size, growth, structure, distribution and many
related issues for the nation as a whole in the coming years. Fertility levels
in most of the other states have already reached replacement levels or
would be doing so in the coming decade. The projections on future course
of fertility in the large Hindi speaking states given by the Registrar General,
as an extrapolation of the past trends during 1983-92, is very depressing
and the state ofU.P. may not reach the level even by 2100. There is an
imminent need to plan and implement appropriate policies and programmes
to reduce the fertility levels in these states.
The most important proximate determinant of fertility is the use of modem
methods of contraception. In the states of UP, Bihar, Rajasthan and MP,
the increase in contraceptive use in the past 15 years has been much slower
than the rest of the country. The current use in Bihar is 24% compared to
45% in the country as a whole. There is a need to increase the level and
effectiveness of contraceptive use in these states as rapidly as possible. In
this aspect there is a confusing situation that has cropped up since 1994
with the family planning prgramme in the country and this cofusion is
contributing to further delays in the effective implementation of family
planning programmes in these states. The confusion or dilemma is
partly attributable to international developments and partly national.

5.7 Page 47

▲back to top


The International Conference on Population and Development (ICPD),
recently held in Cairo in 1994 has recommended in its Programme of
Action that family planning programmes in developing countries should
not be viewed as policy interVention measures for manipulating the fertility
levels of the population at the macro level. They have recommended that
family planning programmes should be viewed as an integral part of the
programmes aimed at improving wormen's rights, women's health,
reproductive health, and gender equity. It is recommended that women's
rights with regard to their family size and spacing of children should be
respected and should not be manipulated by policy measures with a need
to achieve contraceptive targets. India is a signatory to the Programme
of Action adopted at Cairo and has abolished contraceptive targets in its
national family planning programme from 1st April 1996.
There is also growing movement from women's organizations that family
planning programme in the country has overly targetted on women, with
75% of the current contraceptive prevalence attributable to female
sterilizations. They claim that women are manipulated by the programme
to achieve macro level fertility level goals. Hence abolition of any targtes
on family planning acceptors is also welcomed by the women's groups.
The recent experiences on contraceptive acceptance, after the introduction
of" target- free approach" in the states ofVP, Bihar, Rajasthan and MP
during the past nine months from 1st April 1996 to 31st December 1996,is
very disappointing for e.g. in V.P., with the acceptance levels less than
50% of the corresponding period in the last year when targets were in
vogue. On the other hand such a drastic change in acceptance has not
occurred in the southern states. Thus while the need for rapid increase in
contraceptive use and reduction in the fertility levels is the highest in the
four states, the policies and programmes are tending to slow down any
efforts in this direction. There is thus a danger that abolition of targets on
acceptors offamily planning methods may have a rebound effect in reducing
family planning acceptance and increasing fertility. One important rationale
for abolition of family planning targets is that in the absence of any
ljuantitaive pressures for recruitment of numbers on acceptors. the quality

5.8 Page 48

▲back to top


of services including followup care would improve and ultimately the
number of accptors would increase. This is to be tested out empirically.
The reproductive health approach to family planning, which is the new
paradigm recommended by ICPD at Cairo and adopted by India, unless
planned and implemented with due regard for family planning services
has a potential danger of relegating family planning services to the
background. In trying to implement a variety of services including
education for adoloscent boys and girls, treatment of STDs, cancer
detection services for women before they reach the menoupausal ages, in
addition to conventional maternal and child health services, without any
additional increase in the budget provision for family welfare under which
all these services are supposed to be covered, can certainly be expected
to reduce the importance of family planning. This danger seems to be
real.
Fortunately, there is substantial tmIllet need for family planning in the
country, which can be readily met by the programme. The NFHS has
revealed that in the country as a whole, 20% of married women in the
reproductive ages have reported an unmet need for family palnning; 11%
a need for limitation in the sense that they do not want any more children
and another 9% of the couples a need to space, but both the groups not
using any modem methods of contraception. The extent ofunmet need is
higher in the states ofU.P (30%), Bihar ( 25%), Madhya Pradesh( 21%)
and Rajasthan (20%) than the national average, which is a welcome sign
for programmes for increasing contaraceptive use in these states. The
family planning progra.miTIecan build programme related targets on number
of acceptors to be recruited on the basis of the number of couples who .
have unmet need for family planning at the village level and use the same
as targets to be realised by peripheral workers. In other words, the targets
can be built from below rather than being imposed from above. This has
to be seriously attempted in selected states.
An approach that can be recommended to meet the unmet needs of family
planning and generate further needs for spacing and limitation in the new
pardigm is th~ 'birth-based' approach (Srinivasan and Freymann, 1989;

5.9 Page 49

▲back to top


Srinivasan and Rajaram, 1997). In this approach efforts are to be made
to identify all pregnant women in the areas to be served by the peripheral
workers and provide ante-natal , natal and post natal care services to
them including contraceptive serviecs. Here the target is coverage of all
currently pregnant women and recently delivered mothers.
Such an approach will form an essential component of the reproductive
health program, in which every pregnant woman in the population is
contacted before the second trimester of pregnancy and is followed up
with essential ante-natal care services including physical check-up,
immunization, nutrition supplementation etc; provided with a skilled
attention at the time of delivery either at home or in an institution and
post-natal and infant care services are rendered after delivery to the mother
and child. Contraceptive services are offered to such women as part of
the post-natal care services to facilitate proper spacing of births so that
the women's health is restored after maternal depletion as well as the
child's growth and nutrition are assured. The mother is advised for proper
spacing between births and avoid childbearing in high risk stages of their
life i.e., at ages and in their life cycle when the risk to their health is
minimum and the survival chances of the child is quite high. In short, the
mothers are advised against 'too-early - too frequent - and too many'
children as a part of protecting their reproductive health. The 'birth-based
approach' is essentially same as the post-partumapproach traditionally
advocated in the family planning programme in developing countries with
the main difference that all women who have recently delivered children
irrespective of place of delivery are followed up with post-natal care and
contraceptive services. There is selective targeting of the programme to
currently pregnant women (CPW) and recently delivered mothers (RDM)
rather on all eligible couples with wife in the age range 15-44 as in the
conventional family planning programme.
In this 'birth-based approach', since the target group to be served will be
pregnant women and recently delivered mothers the contraceptive services
programme will be geared to meet the needs ,of spacing and limitation of
this group of mothers. In India, the peripheral female health worker, the

5.10 Page 50

▲back to top


Auxiliary Nurse Mid-wife (ANM), is the key functionary involved in
reproductive health and family planning programmes and usually serves a
population of 5000. In this population, there will be approximately 120
CPWand 160 ROM at any time assuming a crude birth rate of32 in the
population. In the 'birth-based strategy', services are needed to be
provided to these 280 women and their children and as soon as the basic
services are provided to them they can be considered to have graduated
from the minimum service list and the new entrants added on. In the
conventional approach to family planning, the services are expected to be
provided to all the currently married women in the reproductive ages,
which will number about 800. Thus the 'birth-based approach' is
practically more feasible from the point of view ofthe work-load of the
peripheral workers.
Earlier studies on the impact of 'birth-based approach' to family planning
programme revealed that the recently delivered mothers are self-selected
for high fertility not only in the past but also in the future and providing
contraceptive services to them will have a greater impact on fertility. A
given duration of couple-years of contraceptive use will prevent more
( 20 to 30% more) births when adopted by recently delivered mothers
(after they have resumed menstruation) than when used by a random
sample of currently married women in the reproductive periods of their
life. Acceptance of contraceptive methods among the recently delivered
mothers is Iikely to be higher because the extent and intensity of need for
spacing and limitation are likely to be higher among them. Since such
women are self selected for higher fertility, the impact on fertility of a
given duration of contraceptive use will be higher. There is a need for
shifting of target setting from the earlier focus on the achievement of
nationally stipulated fertility reduction goals to a focus on the coverage
and quality of MCH services and responsiveness to consumer demand.
Such a family planning programme will be more humane and while meeting
the contraceptive needs ofthe most needy group of women in a population,
\\vill have also a higher impact on fertility and consistent with the new
paradigm shift in the approach to family planning.

6 Pages 51-60

▲back to top


6.1 Page 51

▲back to top


International hlstitute for Population Sciences (1995); India: National Family Health
Survey 1992-93, Mumbai.
Mari Bhat, P.N. (1989); Mortality and Fertility in India, 1881-1961 : A Reassessment.
In :Tim P. Dyson (ed.), India's Historical Demography: Studies in Famine, Disease
and Society. London: Curzon Press; Riverdale, MD.
Ministry of Health and Family Welfare (1995); Family Welfare Programme in India:
Year Book 1992-93; Department of Family Welfare, New Delhi.
National Council of Educational Research and Training (1995); Sixth All India Edu-
cational Survey.
Population Foundation of India (1996); India: Population, Reproductive Health and
Human Development, Wall Chart; New DeIhi
Registrar General, India (1992); Census of India 1991, Final Population Totals: Brief
Analysis of Primary Census Abstract, India; Paper 2 of 1993. New Delhi
Registrar General, India (1995); "Sample Registration System: Fertility and Mortal-
ity Indicators 1993", New Delhi.
Registrar General, India (1996); "Population in Projections for India and States 1996-
2016", New Delhi
Census of India 1991; "Report of the Technical Census on Population Projection
Constituted by the Planning Commission ", August I996, New Delhi
Registrar General, India (1997); "Sample Registration Bulletin 1995" Vol. 31, No.1,
January; New Delhi
Srinivasan K, and Freymann M. W (1989); "Need for a Reorientation of Family Plan-
ning Program Strategies in Developing Countries: A Case for Birth-Based Approach,"
in K Srinivasan and S Mukerji, eds., Dynamics of Population and Family Welfare.
Himalaya Publishing House, Bombay.
Srinivasan, K and Rajaram, S (1997); "Birth-based approach to Family Planning: An
Empirical Justification in India", The Journal of Health and Population in Develop-
ing Countries, University of North Carolina, Chapel Hill, (forthcoming in Volume I,
No.1)
United Nations Development Programme (1996); Human Development Report, Ox-
ford University Press, New York.
United Nations (1995); Summary of the Program of Action of the International Con-
ference on Population and Development, New York.
United Nations System in India (1997); India towards Population and Development
Goals, Oxford University Press, Delhi

6.2 Page 52

▲back to top


Year
Total
Population
In
OOO,OOOs
Density
per
Km2
Intercensal estimate of Population Growth & Vital Rates
Sex
Ratio
Average
Annual
Growth
(%)
Crude
Birth
Rata
(CBR)
Total
Fertility
Rate
(TFR)a
Crude
Death
Rate
(CDR)
Life
Expectancy
Rate
at Birth
Infant
Mortality
Rate
(IMR)
1901
238.4
77
972 NA
NA
NA
NA
NA
NA
1911
252.1
82
964 0.56
49.2
5.77
42.6
22.9
222
1921
251.3
81
955 -0;03
48.1
5.75
47.2
20
212
1931
279
90
950 1.04
46.4
5.86
36.3 26.8
176
1rM1
318.7
103
945 1.33
45.2
5.98
31.2
31.8
168
1951
361.1
117
946 1.25
39.9
5.96
27.4
32.1
148
1961
439.2
142
941 . 1.96
41.7
5.87
22.8
41.3
139
1971
548.2
177
930 2.2
41.1
5.94
18.9 45.6
129
1981
683.2
216
934 2.22
37.2
5.13
15
50.5
129
1991
846.3b
274b 927b 2.12
32.6c
4.2c
11.1c 57.3d
96
1996
934.2.
306
927f 1.98g
28.3h
3.6i
9.0h
59.3j
74h
Note: a Estimate ofTFR 1901-51 by Marl Bhat (1919:135);1951-1981 by Rele,(1967).
b The 1991 census was not held In Jammu and Kashmir. Totel population Includes projection for Jammu & Kaahmlr as of 1 March, 1991
by StandlngCorM1I11ee ofExpeltl on Popu/IIIon, ProjedIons(Oetober 1989). India, RegIlltlwGeneral Paper 2 of 11K!2,p.78T, atlIlt 2.
c: Corresponds to 1986 calendar year for deCIde 1911-91.
d Estimated for 1981-91 based on Expert Committee on the Population Projection ullng 1981 cansua; India, Registrar General (1988)
e Registrar General, India Aug '1996 - Projection oflndia and States 1996-2016.
f Growth rate during 1991-98 asaumed to be same a. 1991.
g Provisional estimates forr 1995 form the Sample Registration System, Reglatrar General.
i Three year moving average centred In 1992.
i Registrar Generallndls: Abridged life tebles, 1989-93
Source.: Publications from the 1•• 1 end 1"1 eenSU8 of Indle, end sample Reglstrlltlon Syat8m end R_nt Projection Rapar

6.3 Page 53

▲back to top


Area
Population size (millions), sex-ratio and annual g;owth rates (percent)
India
Bihar
Madhya Pradesh
Rajasthan
Uttar Pradesh Pop. size
Tamil Nadu
Kerala
Pop. size
Sex ratio
Ann. Gr. Rate
Pop. size
Sex ratio
Ann.Gr.rate
Pop.size
Sex ratio
Ann.Gr.rate
Pop.size
Sex ratio
Ann.Gr.rate
48.63
Sex ratio
Ann.Gr.rate
Pop. size
Sex ratio
Ann.Gr.rate
Pop. size
Sex ratio
Ann.Gr.rate
1901
238.4
972
27.31
1054
16.86
990
10.29
905
63.22
937
19.25
1044
6.4
1004
1951
361.09
946
0.83
38.78
990
0.7
26.07
967
0.87
15.97
921
0.88
88.34
910
0.52
30.12
1007
0.89
13.55
1028
1.5
1971
548.16
930
2.09
50.72
954
1.34
41.65
941
2.34
25.77
911
2.39
156.69
879
1.67
41.2
978
1.57
21.35
1016
2.27
19.
934.22
927
2.13
93.06
911
2.43
74.19
931
2.31
49.72
910
2.63
178.33
879
2.29
59.45
974
1.47
30.97
1036
1.49
2001
1012.4
933
1.61
101.82
912
1.80
81.19
932
1.80
54.51
914
1.84
242.86
889
2.59
62.25
977
0.92
32.53
1034
0.98
Notes:
i. All population and sex-ratio figures are as of 1 March
ii. 1901,1951,1971 are Census figures
iii. 1996 population estimated from 1991 census and SRS estimates of Birth and death rates until 1995
ill. 2001 and 2016 figures estimated or proJected by the Technical Group on Population Projections
appointed by the Planning Commission (Registrar General of India, August, 1996)
v. Annual growth rates are between the specified year and the earlier year indicated.
2016
1263.54
947
1.48
132.31
915
1.75
105.16
935
1.72
71.41
928
1.80
915
2.06
69.87
986
C.77
36.88
1025
0.84

6.4 Page 54

▲back to top


India/States
INDIA
States:
Andhra Pradesh
Assam
Bihar
Gujarat
Haryana
Karnataka
Kerala
Madhya Pradesh
Maharashtra
Orissa
Punjab
Rajasthan
Tamil Nadu
Uttar Pradesh
West Bengal
Year by which projected
TFR will be 2.1
2026*
2002
2015
2039
2014
2025
2009
Achieved in 1988
Beyond 2060
2008
2010
2019
2048
Achieved in 1993
beyond 2100
2009
Years of Lag behind
Kerala in TFR attainment
38 years
14 years
27 years
51 years
26 years
37 years
21 years
NA
more than 72 years
20 years
22 years
31 years
60 years
5 years
more than 112 years
21 years
* based on pooled estimates of TFR
Source: Page 12, Statement 5 of the" Population Projections for India and states 1996-2016" by
the Registrar General of India August 1996

6.5 Page 55

▲back to top


Actual
Actual
1971
1991
TOTAL SEATS
500
526
(Excluding UT's and Anglo Indian)
STATES
Andhra Pradesh 41
42
Assam
14
14
Bihar
53
54
Gujarat
24
26
Haryana
9
10
Karnataka
27
28
Kerala
19
20
Madhya Pradesh 37
40
Maharashtra
45
48
Orissa
20
21
Punjab
13
13
Rajasthan
23
25
Tamil Nadu
39
39
Uttar Pradesh
85
85
West Bengal
40
42
Likely number of
seats if 'freeze'
I. lifted
2001
2016
530
530
41
39
14
14
54
56
26
26
11
11
28
27
17
16
43
44
49
47
19
18
13
12
29
30
33
31
93
99
42
42
.
Actual
1971
Himac. Pradesh 4
Jammu Kashmir 6
Nagaland
1
Manlpur
2
Meghalaya
NA
Mizoram
NA
Sikklm
NA
Trlpura
2
Aruna. Pradesh 1
·Goa
2
Deihl
7
And. Nicobar
1
Chandigarh
1
Dadra & Havell 1
Daman & Diu
NA
Lakshadweep
1
Pondicherry
1
Anglo Indians
2
Tom I
521
Actual
1991
4
6
1
2
2
1
1
2
2
2
7
1
1
1
1
1
1
2
545
Likely number of
seats if 'freeze'
Is lifted
2001
2016
4
4
5
5
1
1
1
1
1
1
1
1
1
1
2
2
1
1
1
1
7
7
1
1
1
1
1
1
1
1
1
1
1
1
2
2
545 545

6.6 Page 56

▲back to top


Year
1996
All ages
0-14
15-59
60+
2001
All ages
0-14
15-59
60+
2006
AIIages
0-14
15-59
160+
2011
Allages
0-14
15-59
60+
2016
Allages
0-14
15-59
60+
Index of 2016
to 1996 (%)
All ages
0-14
15-69
60+
India
934.2
352.8
519.1
62.3
1012.4
347.5
594.3
70.6
1094 ..1
334.8
677.5
81.8
1178.9
335.7
747.3
95.9
1263.5
350.4
800.1
112.9
135.2
99.3
154.1
181.2
Bihar
93.1
38.8
48.6
5.7
101.8
39.3
56.4
6.1
111.1
38.0
66.3
6.8
121.3
39.0
74.4
7.9
132.3
41.6
81.3
9.4
142.1
107.2
167.3
164.9
M.P.
74.2
29.2
40.1
4.9
81.2
30.1
45.7
5.3
88.6
30.2
52.4
6.n
96.6
31.3
58.6
6.8
105.1
33.5
64.0
7.7
Ral_than
49.7
20.6
26.0
3.1
54.5
20.6
30.5
3.5
59.6
20.0
35.6
40
65.3
20.4
40.3
4.6
71.4
22.0
43.9
5.4
UP.
amiiNadu
156.7
64.0
82.1
10.6
174.3
67.8
95.1
11.4
194.1
70.9
110.7
12.5 .
217.1
78.8
124.0
14.2
242.9
87.8
138.7
16.3
59.5
18.5
36.5
4.4
62.3
16.5
40.4
5.3
65.0
14.8
43.8
6.4
67.6
13.8
46.1
7.7
69.9
13.9
46.9
9.1
Keraia
31.0
9.2
19.0
2.7
32.5
8.3
21.1
3.2
34.2
7.7
22.9
36
35.6
7.2
24.3
4.1
36.9
7.3
24.8
4.7
141.6
114.7
159.2
157.1
143.7
106.8
168.9
174.2
155.0
137.2
168.9
153.8
117.5
75.1
128.5
206.8
119.0
79.3
130.5
174.1

6.7 Page 57

▲back to top


INDIAISTATES
Crude Birth
Rate
1996
CBR
Crude Death
Rate
1996
Total
Fertility
Rate,1993
CBR
TFR
INDIA
States
Andhra Pradesh
Assam
Bihar
Gujarat
Haryana
Himachal Pradesh
Kamataka
Kerala
Madhya Pradesh
Maharashtra
Orissa
Punjab
Rajasthan
Tamil Nadu
Uttar Pradesh
West Bengal
28.3
24.0
29.3
32.1
26.7
30.0
25.2
24.2
17.7
33.0
24.5
27.7
24.7
33.2
20.2
34.7
23.6
9.0
3.5
8.3
2.7
9.6
3.3
10.5
4.6
7.6
3.2
8.0
3.7
8.6
2.8
7.6
2.9
6.0
1.7
11.1
4.2
7.4
2.9
10.8
3.1
7.3
3.0
9.1
4.5
7.9
2.1
10.4
5.2
7.7
3.0
eo
1988-92
M
F
58.6 59.0
59.1
53.9
58.4
58.0
62.1
63.2
60.5
68.7
53.8
62.0
55.8
65.4
56.2
60.7
56.1
60.8
61.5
54.4
56.4
60.5
63.2
63.0
63.6
73.7
53.2
64.7
55.1
67.2
56.7
62.5
54.5
62.3
Infant
Mortality
Rate 1995
74
66
n
73
62
68
62
62
16
99
55
103
54
85
56
86
59
Projected values for
the period 2011-2016
TFR
eo M eo F IMR
2.5
87.0
69.2
36
1.8
64.9
67.2
44
2.2
61.8
64.4
36
2.9
70.0
65.1
28
2.1
65.8
66.5
20
2.5
66.0 70.0
33
NA
NA
NA
NA
2.0
63.7 68.4
69
1.6
72.0 75.0
9
3.3
60.7 61.4
79
2.0
69.0 72.0
29
2.0
62.7 62.6
84
2.1
71.7 72.0
33
3.1
65.2 66.8
36
1.7
69.6 72.0
25
4.1
67.1 68.7
32
2.0
68.6 72.0
39

6.8 Page 58

▲back to top


Couple Prote-
ction Rate
(CEP) 1993
UnmetNeed
for Spacing
1992-93
INDIA
States
Andhra Pradesh
Assam
Bihar
Gujarat
Haryana
Himachal Pradesh
Kamataka
Kerala
Madhya Pradesh
Maharashtra
Orissa
Punjab
Rajasthan
Tamil Nadu
Uttar Pradesh
West Bengal
43.5
45.3
25.2
24
54.5
52.7
55.2
48.2
53.4
37.9
53.2
38.1
70.9
29.3
54.5
33.2
34.3
11
6.3
11
14.4
7.6
8.8
9.2
11.8
7.2
13.1
7.3
12.7
6.5
10.8
7.8
16.7
9.4
UnmetNeed
for limitation
1992-93
8.5
Unmet Need for
all methods
1992-93
Births of Higher Medical
Order Percent Attention at
(4+) 1993 Birth, 1993
Maternal
Mortality
ratio 1992
19.5
23.5
35.3
24.5
4.1
10.7
10.6
5.5
7.6
5.6
6.4
4.5
7.4
6.8
9.7
6.5
9
6.5
13.4
8
10.4
21.7
25
13.1
16.4
14.8
18.2
11.7
20.5
14.1
22.4
13
19.8
14.5
30.1
17.4
12.1
25.1
33.7
18.1
21.9
13.1
19.7
6.5
25.7
18.9
24.4
17.3
27.2
9.2
34.8
24.0
34.7
33.2
27.7
35.3
48.4
48.3
36.9
29.8
36.9
29.4
35.7
47.1
50.3
36.3
37.6
31.2
38.1
18.4
11.9
24.8
21.8
22.3
42.8
92.3
13.5
36.8
11.8
8.3
5.2
61.3
5.3
31.2

6.9 Page 59

▲back to top


INDIA/STATES
Life Expty
1981-93
Indnof
Life Expty
(11)
Adult
Middle School
Literacy Rata Enrolment
1991
Ratio. fll3
INDIA
States
Andhra Pradesh
Assam
Bihar
Gujarat
Haryana
Himachal Prado
Karnataka
Kerala
Madhya Pradesh
Maharashtra
Orissa
Punjab
Rajasthan
Tamil Nadu
Uttar Pradesh
West Bengal
59.3
60.5
54.9
58.5
60.0
63.1
63.6
61.8
71.8
54.0
64.2
55.5
66.3
57.9
62.4
55.8
61.5
57.23
59.14
49.89
55.85
58.36
63.43
64.33
61.36
78.01
48.26
65.27
50.84
68.88
54.87
62.31
51.41
60.83
48,7
40.1
49.4
38.7
56.7.
49.9
50.9
52.2
86.0
41.8
60.3
46.4
51.8
36.1
50.6
38.4
57.1
59.1
56.0
53.4
32.9
67.7
68.6
100:0
67.0
100.6
55.0
81.6
50.0
65.6
46.2
103.4
46.6
53.1
Index of
L"'racy
(I)
I
52.18
45.38
50.72
36.76
60.38
56.1;2
67.27
57.12
90.85
46.19
67.39
47.60
56.41
39.48
68.19
41.14
55.75
Par Cap'"
SDP,1993
8255
5718
5310
3084
7175
9171
5979
6443
5768
4733
9628
4097
11106
5086
6663
4273
5775
Index
of SOP
(I)
19.00
19.33
17.81
9.56
24.73
32.13
20.29
22.01
19.51
15.67
33.82
13.32
39.30
16.98
22.83
13.97
19.54
Human
Dev.
Index
42.79
41.28
39.48
34.05
47.82
50.56
50.63
46.83
62.79
36.71
55.49
3725
5486
37.11
51.11
3551
45.37
Computations by Population Foundation of India, New Delhi
Sources: Registrar General India, Abdridged Life Tables 1989-93
Registrar General India, Census of India 1991, Paper 2 of 1992
Sixth All India Educational Survey, 1995
Ministry of Health and Family Welfare Programme in India Year Book 1992-93
Notes: Index ofe (I) = (Percent Males'e (males) + Percent Females"e (Femates)-25)/60 "100
Index of Education (I) = (2' Adult t:'iteracy Rate (%) + Middle Schcl'ol Enrolment Ratio)/3" 100
Index of Per Capita l.fcome (I ) = (State Net Domestic Product / Net Domestic Product ofthe Country)" 1240)-100)/5348" 1(JO
HDI=(I +1+1)
3
12 3

6.10 Page 60

▲back to top


INDIA/STATES
Expectation of
Life at Birth,
1989-113
Male. Female.
Index of Life
Expectancy
Male. Female.
Equally
DI.trlbuted
Index of
eo (11)
Adult Literacy
Rate
(15+) 1991
Male. Female.
Middle School
Enrolment
Ratio 1993
M.le. Fem.'es
Index of
EQually Olstrl-
Education buted Index of
Eclucation (12)
Males Females
INDIA
59
59.7
61
54
57
62.4 33.9
69.62 47.91
65
39
49
Slates;
Andhra Pradesh
59.5 61.5
62
57
59
52.4 27.3
58.3
39.89
54
31
40
Assam
54.6 55.3
54
46
50
62.4 33.9
57.9
48.59
61
39
48
Bihar
59.7 57.2
62
50
55
55.3 18.2
45.43 19.86
52
19
28
Gujarat
59
61.1
61
56
58
70.4 41.8
78.33 56.73
73
47
57
Haryana
62.5 63.7
67
60
64
64.3
27
77.82 58.36
69
37
50
Himachal Pradesh 63.6 63.6
69
60
64
64.4 35.5
115.9 85.58
82
52
64
Karnalaka
60.2 63.5
63
60
61
65.3 37.7
74.23 59.31
68
45
54
Kerala
68.8 74.7
77
79
78
91.7 80.6
100.6 100.48
95
87
91
Madhya Pradesh
54.1 53.8
53
44
48
56.6 24.3
69.38 39.43
61
29
40
Maharashtra
63
65.4
68
63
65
74.4 44.2
89.69 72.96
79
54
65
Orissa
55.7 55.3
55
46
50
62.5
29
61.78 38.65
62
32
43
Punjab
65.2 67.6
71
67
69
60.5 41.8
69.94 60.97
64
48
55
Rajasthan
57.4 58.5
58
52
55
52.7 17.5
67.82
23.4
58
19
30
Tamil Nadu
61.4 63.4
65
60
62
65
35.8
113.5 92.74
81
55
66
Uttar Pradesh
56.5 55.1
57
46
51
53.6 20.6
60.46 31.29
56
24
35
Westeengal
60.8 62.3
64
58
61
69.3 42.8
60.62 45.17
66
44
53
Computation by Population Foundation of India, New Delhi
Sources: Registrar General India, Sample Registration System, 1993
Registrar General India, Census of India 1991, Paper 2 of 1992
Registrar General India, Abdriged Life Tales 1989-93
Sixth All India Educational Survey (1995)
Notes: Index of eo(males)=«eo of males-22.5)/60)"1 00: Index of eo(females)-«eo offemales·27 .5)/60"100)
Index of infant mortality = «125-IMR)/(125-8»"1 00 (Same for males and females)
Index of education = (2" Adult literacy rate+Middle school enrolment ratiO)/3"100 (Same for males and females)
I" I, and 13are the equally distributed indexes and are the harmonic mean ofthe indexes for males and females, weighted in
proportion of 1991 census population.
.

7 Pages 61-70

▲back to top


7.1 Page 61

▲back to top


India/States
Infant Mortality Rate. 1993
Index of Infant Mortality
Males
Females
Males
Females
Equally Dlstrl"
buted Index of
IMR (13)
Gender Hea Ith Index
INDIA
73
75
44
43
44
50
~
Andhra Pradesh
70
57
47
58
52
50
Assam
81
81
38
38
38
45
Bihar
68
72
49
45
47
44
Gujarat
58
58
57
57
57
58
Haryana
60
73
56
44
50
54
Himachal Pradesh
72
53
45
62
52
60
Kamataka
69
66
48
50
49
55
Kerala
16
10
93
98
96
88
Madhya Pradesh
106
106
16
16
16
35
Maharashtra
50
50
64
64
64
65
Orissa
118
101
6
21
9
34
Punjab
49
62
65
54
59
61
Rajasthan
82
81
37
38
37
41
Tamil Nadu
57
56
58
59
59
62
Uttar Pradesh
87
100
32
21
26
37
West Bengal
57
59
58
56
57
57
Computation by Population Foundation of India, New Delhi
Sources: Registrar General India, Sample Registration System, 1993
Registrar General India, Census of India 1991, Paper 2 of 1992
Registrar General India, Abdriged Life Tales 1989-93
Sixth All India Educational Survey (1995)
Notes:
Index of eO (males)-«eO of ma'es·22,5)/BO)"100; Index of eO (femalel)-«eO of fema'es-27,5)/BO"100)
= Index of Infant mortality «125-IMR)/(125-8))"100 (Same for males and femalel)
= Index of education (2" Adult literacy rate+Mlddle school enrolment ratlo)/3"100 (Same for ma'es and femalel)
11, 12 and 13ara the equally distributed Indexes and ara the harmonic mean of the Indexes for males and females, walghted IPropon,on of 1991
census population