Bihar Population in New Miillennium

Bihar Population in New Miillennium


1 Pages 1-10

▲back to top


1.1 Page 1

▲back to top


1.2 Page 2

▲back to top


1.3 Page 3

▲back to top


Bihar
Population in the New Millennium
(Concerns and Challenges in Planned Parenthood)
Population Foundation of India
Regional Resource Centre

1.4 Page 4

▲back to top


2007
Population Foundation of India
Regional Resource Centre
Guidance:
A R Nanda
Almas Ali
Kumudha Aruldas
Sharmila Neogi
Contributors:
Sanjit Nayak
Sudipta Mukhopadhyay
Sanjeev Jha
Archana Choudhary
Matish Kumar

1.5 Page 5

▲back to top


3 BIHAR: POPULATION IN THE NEW MILLENNIUM
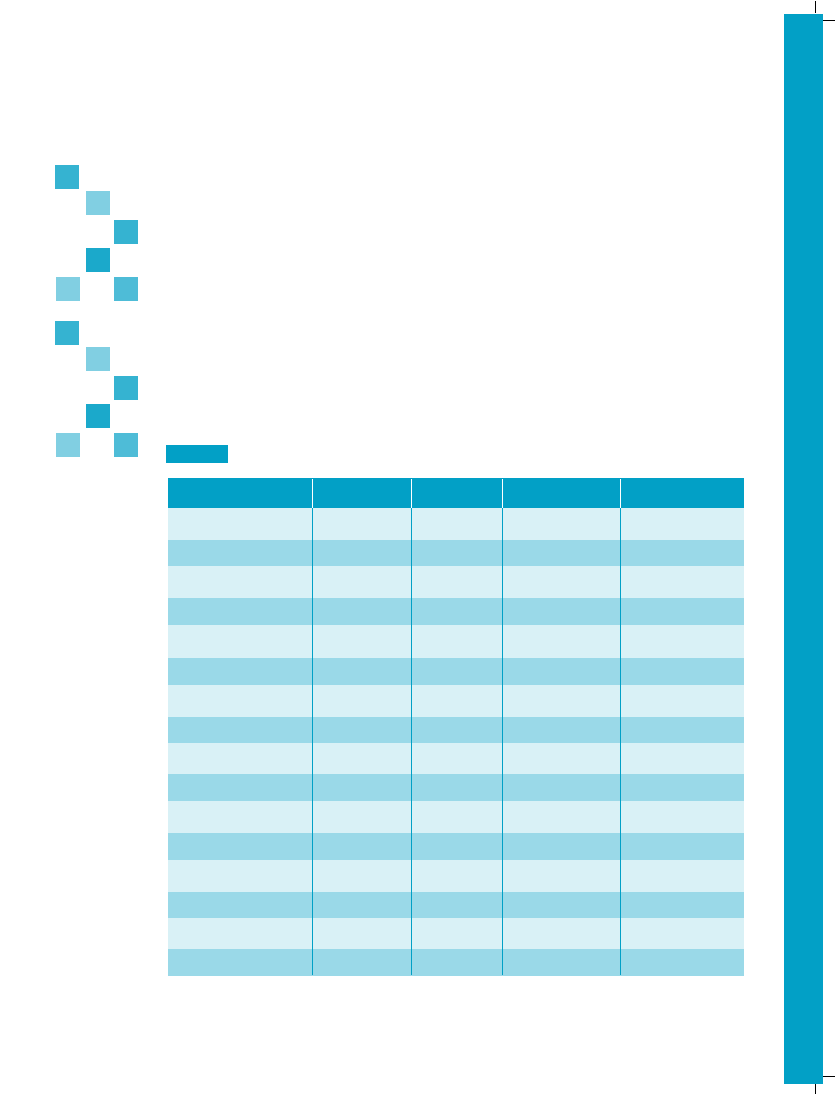
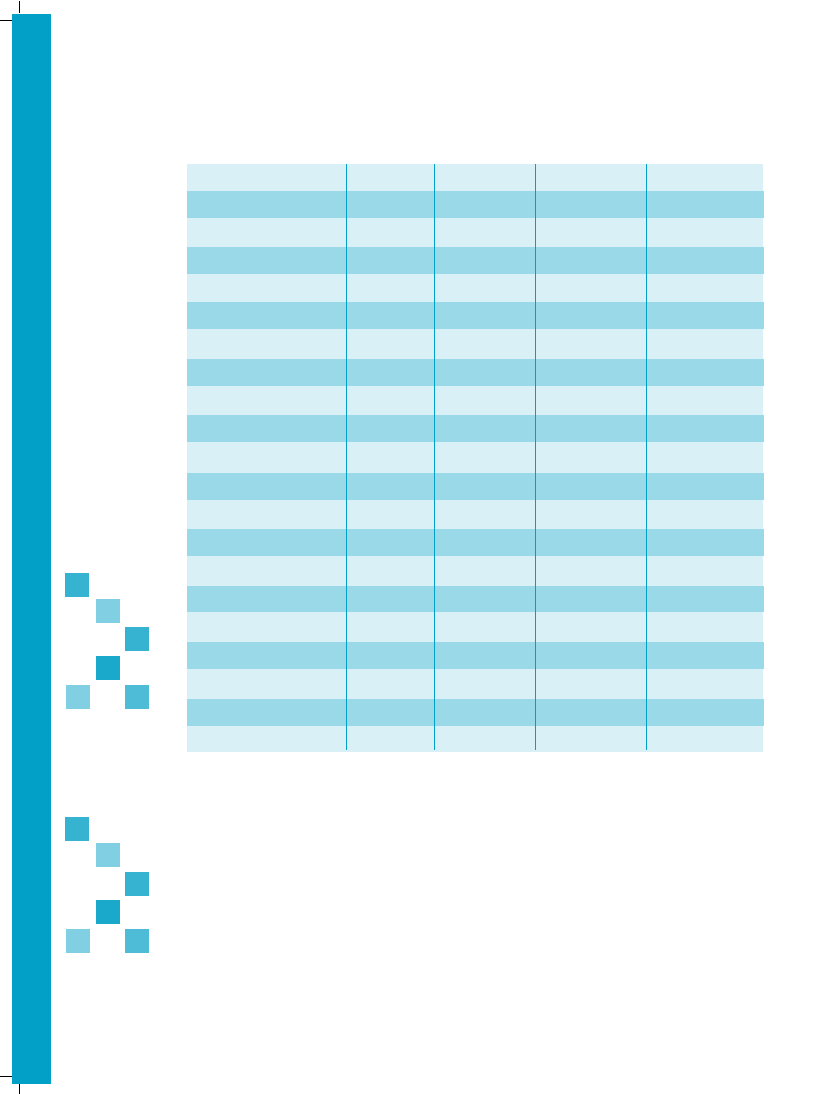
Bihar at a Glance
Area in sq kms
Revenue Divisions
Districts
Sub-Divisions
Community Development Blocks
Towns
Villages
Inhabited Villages
Gram Panchayats
Municipal Corporations
Municipalities
Nagar Panchayats
Police Stations
Population Total (2001)
Males
Females
Rural (per cent)
Urban (per cent)
Scheduled Castes (per cent)
Scheduled Tribes (per cent)
Decadal Growth Rate (per cent) 1991-2001
Density of Population (per sq km), 2001
Overall Sex-Ratio, 2001
Sex-Ratio (0-6 years), 2001
Total Literacy (per cent)
Female Literacy
Total Work Participation Rate
Female Work Participation Rate
People Living below Poverty Line (per cent)
Per Capita Income (in Rupees)
Human Development Index (HDI)
Value
Rank
Social Development Index (SDI)
Urban
Value
Rank
Rural
Value
Rank
Infant Mortality Rate (IMR), SRS - 2005
Crude Birth Rate (CBR), SRS-2005
Crude Death Rate (CDR), SRS-2005
Total Fertility Rate (TFR), NFHS-III
Life Expectancy at Birth, 2000
Maternal Mortality Ratio, SRS Census 2002 - 2004
Community Health Centres (CHCs)
Primary Health Centres (PHCs)
Sub Centres
94,163
9
38
101
533
130
45,098
39,015
9032
7
42
73
853
82,998,509
43,243,795
39,754,714
89.5
10.5
15.7
0.9
28.62
881
919
942
47
33.57
33.7
18.8
41.4
6719
0.267
15
27.10
19
16.13
20
61
30.4
8.1
4
60.8
371
70
1641
8858

1.6 Page 6

▲back to top


4 BIHAR: POPULATION IN THE NEW MILLENNIUM
Background
"In the new millennium, nations will be judged by the well-being of their peoples; by levels of
health, nutrition and education; by the civil and political liberties enjoyed by their citizens; by the
protection guaranteed to children and by provisions made for the vulnerable and the disadvantaged.
The vast numbers of the people of India can be its greatest asset if they are provided with the means
to lead healthy and economically productive lives"—National Population Policy, 2000.
At the beginning of the Christian era, nearly 2,000 years ago world population was estimated to
be around 250 million. On October 12, 1999 the world population became 6 billion. It is expected
to reach 8 billion by 2025. About three-fourth of the world's population live in the developing
countries. Although in terms of population, USA ranks third in the world after India, there is a
yawning gap of 746 million between the populations of these two countries.
Figure 1: Comparison of population of select countries with the world, 2006
India
Source: World Population Data Sheet, Population Reference Bureau, 2006
According to 2001 Census, India
with a population of 1,028,737,436
(102.9 crore) is the most populous
country in the world, after China.
Globally, India constitutes 16.9%
of world population and 2.4% of
the global land area. The density
of population per square kilometer
in India is 267. Currently (2006),
India's population is estimated at
111.2 crore.
Three countries in South East Asian Region, i.e. India (16.87%), Indonesia (3.49%) and
Bangladesh (2.13%) are among the ten most populous countries of the world. If the current trend
continues India may overtake China in 2045, to become the most populous country in the world.
While global population has increased threefold during this century from 2 billion to 6 billion, the
population of India has increased nearly five times from 238 million to 1 billion in the same period.
India's current annual increase in population of 15.5 million is large enough to neutralize efforts to
conserve its resource endowment and environment.
The large size of the population in the reproductive age group (estimated contribution 58%) is
a cause of concern. An addition of 417.2 million between 1991 and 2016 is anticipated despite
substantial reduction in family size in different states, including those, which have already achieved
replacement levels of Total Fertility Rate (TFR). It is imperative that the reproductive age group
adopts without delay or exception the small family norm for the reason that the 45% of population
increase is contributed by births above two children per family.

1.7 Page 7

▲back to top


5 BIHAR: POPULATION IN THE NEW MILLENNIUM
Higher fertility is due to unmet need for contraception (estimated contribution 20%). India has
168 million eligible couples of which just 44% are currently effectively protected. Urgent steps are
required to make contraception more widely available, accessible, and affordable.
In India, over 50% of girls marry below the age of 18 years, the minimum legal age of marriage.
This results in a typical reproductive pattern of too early, too frequent and too many. Around 33% births
occur at intervals of less than 24 months between children, which also results in high Infant Mortality
Rate (IMR).
The five states of India, namely Bihar, Madhya Pradesh, Orissa, Rajasthan and Uttar Pradesh that
currently constitute nearly 44% of the total population of India are projected to comprise 48% of the
total population in 2016. In other words these states alone will contribute an anticipated 55% increase
during the period 1996-2016. Demographic outcomes in these states will determine the timing and
size of population at which India achieves population stabilisation.
Figure 2: Five most populous states in India, 2001 Figure 3: Percentage of state to total population of India
Source: Census of India, Registrar General of India, New Delhi.
National Rural Health Mission States
Although several Indian states have done remarkably well in population stabilisation and provision
of reproductive and child health services, what makes the Indian performance look mediocre in
international ranking is the extremely slow progress made in a few large, northern states. The
population of Empowered Action Group (EAG) states, now National Rural Health Mission (NRHM)
states, grew five-folds during 1991-2001 as compared to the four-fold growth of the national
population. Total fertility rate in these states is a whole one birth higher than the all-India average.
Infant mortality rate is one-and-half-times higher than at the all-India level. In these states, less than
half of women get an antenatal check up during pregnancy, one-fourth of the deliveries are attended
by health professionals, one-fifth of the children are fully immunised, and one-third of married women
of reproductive ages are using contraception.
The reason for this striking regional contrast is complex and deep-rooted. On the one hand, high
rates of poverty, illiteracy and low autonomy of women lead to poor knowledge and low demand for

1.8 Page 8

▲back to top


6 BIHAR: POPULATION IN THE NEW MILLENNIUM
reproductive and child health services. On the other hand, poor infrastructure and bad governance
compound the problem. Bridging the gap would require raising public awareness, sensitizing
administrators and encouraging the involvement of private sector in the delivery of services.
The Government of India (GoI) has begun to focus attention on eighteen states under NRHM
where the programme performance is poor. Bihar is one of them where the performance is
particularly poor.
Bihar's Unique Growth Rate
Bihar is the third most populous state in the country. According to 2001 census, the total
population of Bihar is 82,998,509 persons consisting of 43,243,795 males and the 39,754,714
females. The population of Bihar in 1991 was 64,530,554 as compared to 846,421,039 of India. The
state ranked 5th in 1991 as compared to 3rd rank in 2001 after Uttar Pradesh and Maharashtra. The
state has predominantly rural characteristics of population as 89.5% of the total population (i.e.
74,316,709) resides in rural areas and 10.5% of the total population in urban areas (i.e. 8,681,800).
During the last decade Bihar is the only State where the growth rate has increased (which was
23.38 during 1981-91 to 28.62 during 1991-2001), which was higher than that of national average
of 21.54. All other states have shown a drop in the decadal growth rate from the previous decade.
Bihar ranks 10th in growth rate in 2001 as compared to 26th in 1991. It added a population equal
to that of Australia which is 18 million. The decadal (1991-2001) growth rate of the state was 28.62,
which is five-point increase when compared to 1981-1991 decadal growth rate. Annual average
exponential growth rate, which was 2.10 during 1981-91, increased to 2.50 during 1991-2001.
Figure 4: Decadal Growth Rate of Bihar and India
Source: Census of India, Registrar General of India, New Delhi

1.9 Page 9

▲back to top


7 BIHAR: POPULATION IN THE NEW MILLENNIUM
Bihar's Key Indicators
Table 1: Comparison of Key Fertility Indicators of Bihar, NFHS I, II and III
Fertility Indicators
Total Fertility Rate (TFR)
Women age 15-19 who were already mothers
or pregnant at the time of the Survey (%)
Median age at first birth for women age 25-49
Married women with 2 living children wanting
No more children (%)
Two sons (%)
One son, one daughter (%)
Two daughters (%)
Source: International Institute for Population Sciences, Mumbai
NFHS-I
(1992-93)
4.00
N.A.
NFHS-II
(1998-99)
3.7
N.A.
NFHS-III
(2005-06)
4.00
25.0
N.A.
N.A.
18.9
18.7
41.8
60.2
N.A.
N.A.
N.A.
58.8
77.4
43.7
67.5
10.8
20.0
At current fertility levels, women will have an average of 4 children each throughout their child
bearing years. Although the TFR has declined by half a child between NFHS-I and II, it has increased
during NFHS III by half to 4, and it still remains high and far from replacement levels.
The distribution of births by birth order is yet another way to view fertility. According to
NFHS-II, 23 per cent of births are first-order births, 22 per cent are second order births, 17 per cent
are third-order births, and 37 per cent are of order four or higher.
Figure 6:
Comparison of Total Fertility Rate
of Bihar and India
Figure 7:
Comparison of Birth Order
Three and Above in Bihar
Source: International Institute for Population Sciences, Mumbai

1.10 Page 10

▲back to top


8 BIHAR: POPULATION IN THE NEW MILLENNIUM
As per NFHS-II, the birth order three and above is 54.7%, compared to 56.8% in NFHS-III
(provisional). The highest proportion of births to mothers age 15-19 years are of order one, by
contrast, the highest proportion of births to mothers age 30-49 years are of an order four or higher.
The proportions of birth of order four or higher are relatively large for illiterate women, Muslim
women, and scheduled-caste and scheduled-tribe women.
Table 2: Comparison of Current use of Family Planning Methods in Bihar
Family Planning
NFHS-II (1998-99)
Current Use
Any method (%)
23.5
Any modern method (%)
21.6
Female sterilization (%)
18.5
Male sterilization (%)
1.0
IUD (%)
0.6
Pill (%)
0.8
Condom (%)
0.6
Unmet need for family planning
Total unmet need (%)
25.7
For spacing (%)
13.1
For limiting (%)
12.5
Source: International Institute for Population Sciences, Mumbai
NFHS-III (2005-06)
34.1
28.8
23.8
0.6
0.6
1.3
2.3
23.1
10.7
12.4
Figure 8:
Current Use of Family
Planning Methods in Bihar
Figure 9:
Comparison of Total Unmet Need
between NFHS-II and III
Source: International Institute for Population Sciences, Mumbai

2 Pages 11-20

▲back to top


2.1 Page 11

▲back to top


9 BIHAR: POPULATION IN THE NEW MILLENNIUM
Lack of knowledge of contraceptive methods is a major obstacle to their use. Female sterilization
is the most widely known method of contraception in Bihar, followed by male sterilization. There is
large difference in knowledge of spacing methods by residence. Although knowledge of these spacing
methods is lower than knowledge of sterilization, these results suggest that knowledge of spacing
methods has grown since NFHS-I. At the time of NHFS-I, only 57% of currently married women
knew about pills, 44% knew about IUDs and 55% knew about condoms. NFHS-II shows that the best
known spacing method is the pill, which is known to 75% of currently married women, followed by
condom (64%), and then the IUD (59%).
Bihar's Population Projection
Table 3: Projected Population Characteristics of Bihar
Indicators
2001
Population (000')
Total
82999
Male
43244
Female
39755
Sex Ratio
919
Population density (sq km)
881
Population by broad age groups (000')
18 years and above
43041
0-14
34949
15-59
43515
60+
4534
Population Proportion (per cent)
0-14
42.1
15-59
52.4
15-49 (female population)
47.0
60+
5.5
Median Age (years)
19.11
Dependency Ratio
Young (0-14)
80.3
Old (60+)
104
Total (Young and old)
907
Source: Registrar General of India, New Delhi
2006 2011 2016
2021 2026
90752
47165
43586
924
964
97720
50640
47080
930
1038
103908
53676
50231
936
1103
109431
56341
53091
942
1162
113947
58409
55437
949
1209
49447
3461
50151
5740
57499
33191
57536
6993
65984
30944
64438
8525
73538
29816
69250
10365
79591
28347
73007
12493
38.4
55.3
49.0
60.3
20.14
34.0
58.9
51.9
7.2
22.11
29.8
62.0
54.4
8.2
24.22
27.2
63.3
54.7
9.5
26.58
24.9
64.1
54.9
11.0
29.05
695
577
480
114
122
132
810
698
613
431
388
150
171
580
559

2.2 Page 12

▲back to top


10 BIHAR: POPULATION IN THE NEW MILLENNIUM
Table 4: Projected Demographic Characteristics of Bihar
Indicators
2001-05
Population Growth Rate
1.8
Crude Birth Rate
27.5
Crude Death Rate
6.9
Infant Mortality Rate
55.5
Under 5 Mortality Rate
81.6
Total Fertility Rate
3.9
Life Expectancy of Males
65.6
Life Expectancy of Females
64.7
Source: Registrar General of India, New Delhi
2006-10
1.5
24.2
6.7
50.0
73.5
3.3
67.1
66.7
2011-15
1.2
21.6
6.6
44.5
65.4
2.7
68.6
68.7
2016-20 2021-25
1.0
0.8
19.7
17.4
6.6
6.7
40.6
37.1
59.7
54.6
2.3
2.0
69.6
70.6
70.2
71.4
As per the recent report of the Technical Group on Population Projections by the Office of the
Registrar General of India:
• The population of Bihar is expected to increase from 82.99 million to 113.98 million during the
period 2001-2026—an increase of 37.34% in twenty five years at the rate of 1.3 % annually.
• The Crude Birth Rate of Bihar will decline from 27.5 in 2004 to 17.4 during 2021-25 because of
falling level of total fertility and other reasons.
• The Infant Mortality Rate of the state, which is reported to be 55.5 in 2004, is expected to decline
to 37.1 by the end of the period 2021-25.
• With the declining fertility, along with the increases in life expectancy, the number of older persons
in Bihar is expected to double from 5.5 million in 2001 to 11 million in 2026.
• The proportion of population in the working age group 15-59 years in Bihar is expected to rise
from 52.4 per cent in 2001 to 64.1 per cent in 2026.
• The sex ratio of the total population (females per 1000 males) in Bihar is expected to decrease (i.e.
become less feminine) from 949 in 2001 to 919 during 2026.
• The urban population in the state, which is 10.6% in 2001, is expected to increase to 10.7%
by 2026.
• The Total Fertility Rate (TFR) of Bihar is expected to decline from 3.9 in 2001 to 2.0 during
2021-25. The assumption is that the Total Fertility Rate would decline steadily and would touch
the floor value of 1.8 in some states. With this, the weighted TFR of Bihar is projected to reach
the replacement level of 2.1 by the period 2024.

2.3 Page 13

▲back to top


11 BIHAR: POPULATION IN THE NEW MILLENNIUM
Major Indicators—District wise
Decadal Growth Rate
According to 2001 Census, the decadal growth rate of population during 1991-2001 for the
State is 31.14 per cent as compared to 23.54 for 1981-1991. Among the districts, Sheohar (36.61)
has the highest percentage of decadal growth rate followed by Purnia (35.40) and Araria (33.94).
Nalanda (18.75) has the lowest decadal growth rate followed by Munger (20.58) and Lakhisarai
(24.11).
Density of Population
According to the 2001 Census, Bihar has a high density of the population with 665 persons per
square kilometer as compared to 497 according to 1991 Census. Among the districts, Kaimur
(Bhabua) 383 has the lowest percentage of density of population followed by Jamui (452) and Banka
(533). Patna (1474) has the highest density of population followed by Darbhanga (1446) and Vaishali
(1335).
Sex Ratio
According to the 2001 Census Bihar has shown a decline in the overall sex ratio for the state is
942 girls per 1000 boys as compared to 953 the previous decade. The district with the highest overall
sex ratio is Nawada (987) followed Gaya (968) and Purnia (967). District with the lowest overall sex
ratio is Munger (872) followed by Patna (873) and Bhagalpur (872).
Child Sex Ratio
According to the 2001 Census Bihar has shown a decline in the child sex ratio for the state is 942
girls per 1000 boys as compared to 953 the previous decade. The district with the highest child sex
ratio is Nawada (987) followed Gaya (968) and Purnia (967). District with the most unfavourable
child sex ratio is Saharsa (912) followed by Munger (914) and Darbhanga (915).
Female Literacy
According to the 2001 Census, the female literacy of the state is 39.4 as compared to 39.9 in the
1991 Census. The district with the highest percentage of female literacy is Patna (50.8) followed by
Munger (47.4) and Rohtas (45.7) while the districts with low female literacy are Kishanganj (18.6),
Supaul (20.8) and Madhepura (22.1).
Girls Marrying Below the Age of 18 Years
According to RCH-DLHS (District Level Household Survey) 2002-2004, girls married below
the age of 18 years in Bihar is 51.5. The district of Sheikpura (85.0) has the highest percentage of
girls marrying below the age of 18 years, followed by Samastipur (67.7) and Jamui (64.7). The
districts with the lowest percentage of girls marrying below the age of 18 years are Saran (28.9)
Gopalganj (34.6) and Siwan (39.5).

2.4 Page 14

▲back to top


12 BIHAR: POPULATION IN THE NEW MILLENNIUM
Birth Order 3 and Above
According to RCH-DLHS 2002-2004, the birth order 3 and above for Bihar is 54.4. The district
of Kishanganj (65.6) has the highest percentage of birth order 3 and above, followed by Saharsa
(62.6) and Purnia (59.6). The districts with the lowest percentage of birth order 3 and above are
Rohtas (46.5) Patna (48.1) and Jamui (49.8).
Ante-Natal Care
According to RCH-DLHS 2002-2004, percentage of women who received any ante-natal care
(ANC) is 19.6 for the state of Bihar as compared to 29.6 in RCH-DRHS (District Rapid Household
Survey) 1998-1999. The percentage of any ante-natal care was highest in the districts of Gopalganj
(53.3), Rohtas (52.4) and Patna (52.4) while the percentage of any ante-natal care in the districts of
Khagaria (23.3), Samastipur (23.4) and Sheohar (23.7) was the lowest.
Institutional Delivery
According to RCH-DLHS, 2002-2004, 23% of women in Bihar had institutional delivery as
compared to 14.9% institutional delivery in RCH-DRHS, 1998-1999. The districts of Patna (45.3),
Rohtas (39.7), Munger (38.8) have high percentage of institutional delivery as compared to
Madhubani (7.7), Sheohar (8.4) and Araria (9.1) which have a low percentage of institutional delivery.
Full Immunisation
According to RCH-DLHS, 2002-2004, 23% of children in the age group of 12-35 months in
Bihar received full immunisation as compared to 22.4% full immunisation in RCH-DRHS, 1998-
1999. The district of Bhagalpur (42.8) followed by Patna (39.9) and Gopalganj (39.0) reported a
high percentage of full immunisation while Pashchim Champaran (7.6), Kishanganj (7.9), and Kaimur
(12.5) reported low percentage of full immunisation.
Total Unmet Contraception Need
According to RCH-DLHS, 2002-2004, the total unmet need for the state of Bihar was 36.7% as
compared to 42% in RCH-DRHS, 1998-1999. The districts of Kishanganj (47.3), Nawada (45.9),
Sheohar (45.8) have the highest percentage of total unmet need as compared to Supaul (25.0),
Rohtas (30.5) and Bhojpur (30.8) which have the lowest percentage of unmet need.
Contraceptive Prevalence Rate
According to RCH-DLHS, 2002-2004, per cent of women currently using any family planning
methods is 31 as compared to 23.3 in RCH-DRHS, 1998-1999. The districts of Bhagalpur (39.6),
Munger (38.6) and Saharsa (37.7) have a high percentage of women using any family planning
method while Sheohar (19.7), Samastipur (22.7) and Kishanganj (23.1) have a low percentage of
women using any family planning method.
HIV/AIDS Prevalence
According to the Sentinel Surveillance Survey, 2006 Bihar State AIDS Control Society (BSACS),
the HIV prevalence in Bihar in among STD clinics is 1.05% and ANC clinics is 0.36%. The districts

2.5 Page 15

▲back to top


13 BIHAR: POPULATION IN THE NEW MILLENNIUM
of Siwan (4.76), Patna (3.2) and Kathiar (2.5) have the highest percentage of infection among STD
clinics while Saharsa (1.14), Lakhisarai (1.0) and Samastipur (0.75) have the highest percentage
among ANC clinics. Madhubani, Bhagalpur, Kaimur, Kishanganj, Muzaffarpur and Araria districts are
also showing emergence of HIV/AIDS as per the survey.
From the above district-wise key indicators, a clear trend is noticed where districts like
Sheohar, Kishanganj, Samastipur, Khagaria, West Champaran, Sitamarhi, Purba Champaran,
Madhubani etc. are perpetually at the bottom (i.e. socially and demographically backward/weak
districts of the state or the "vulnerable” districts) in terms of population/fertility indicators (like
decadal growth rate, CBR, CPR, percentage of Birth order 3 and above etc) as well as health
indicators (like IMR, children with complete immunisation, safe delivery, etc). Their trend can be
explained on the basis of social and human development perspective specially relating to such
dimensions like female literacy, girls marrying below 18 years of age, population below poverty line,
standard of living etc.
Table 5: Ranking of Districts According to Socio-Demographic Development Index
Districts
Sheohar
Kishanganj
Samastipur
Khagaria
Pashchim Champaran
Sitamarhi
Purba Champaran
Madhubani
Supaul
Saharsa
Sheikhpura
Araria
Madhepura
Darbhanga
Purnia
Jamui
Rank 2007
4
7
10
11
13
14
15
16
17
18
21
22
24
34
35
36
Rank 2002 Change in Rank Index value 2007
16
-12
2
5
23.69
24.54
22
-12
25.58
37
-26
26.11
4
9
26.26
6
8
26.30
10
5
27.21
13
3
27.35
14
3
27.51
25
-7
27.67
33
-12
27.81
28
-6
28.04
3
21
28.10
30
4
29.66
34
1
29.76
29
7
29.84

2.6 Page 16

▲back to top


14 BIHAR: POPULATION IN THE NEW MILLENNIUM
Kaimur (Bhabua)
44
32
12
Jehanabad
51
72
-21
Begusarai
53
56
-3
Katihar
55
27
28
Nalanda
59
77
-18
Buxar
63
46
17
Lakhisarai
67
35
32
Nawada
71
45
26
Banka
72
44
28
Vaishali
73
52
21
Gaya
83
50
33
Aurangabad
85
48
37
Muzaffarpur
93
67
26
Saran
119
62
57
Siwan
123
69
54
Bhojpur
126
109
17
Munger
129
66
63
Gopalganj
148
40
108
Rohtas
150
53
97
Bhagalpur
156
97
59
Patna
193
228
-35
Source: India Socio-Demographic Development Index, 2007
30.55
31.07
31.29
31.40
31.72
31.96
32.28
32.94
32.99
33.02
33.64
34.07
34.67
36.28
36.46
36.77
36.83
38.22
38.39
38.76
41.42
India Socio-Demographic Development Index published by Population Foundation of India
(PFI), New Delhi in 2007 and the ranking of districts in India for area-specific planning and
programme interventions published by the International Institute for Population Sciences (IIPS),
Mumbai, 2002 attempted to compute composite indices based on ten key variables/indicators (using
six indicators of the DLHS and DRHS under the RCH programme and four indicators of the Census
of India, 2001) respectively. These computations identified districts as "Vulnerable districts" i.e.
socially and demographically weak/backward districts or districts that are lagging behind in human
development. The variables/indicators were chosen in such a way that they reflected the overall socio-
demographic development of the districts. All the 38 districts of Bihar have an index below 50 and
thus, these are vulnerable districts.

2.7 Page 17

▲back to top


15 BIHAR: POPULATION IN THE NEW MILLENNIUM
Planned Parenthood
India was the first country in the world to implement a National Family Planning Programme that
over time expanded so much that it sidelined not only maternal and child health, but all other health
programmes. The fear of a population explosion ensured that fertility control became the core of
health care planning. Family planning targets were set and enthusiastically implemented. The focus
was to curb the increasing numbers from a purely quantitative perspective. This Neo-Maltusian
environment continued till the eighties. The focus was on population and not on people. These
programmes did not look at human development or quality of life, but focused instead on women as
recipients and primary actors of the programme whose 'fertility needed to be controlled'. Despite this,
the population continued to grow and there was no improvement in maternal health.
The International Conference on Population and Development (ICPD), Cairo 1994, brought in
a new perspective and new hope to rights based development approaches and the Reproductive and
Child Health programme was launched afresh along multiple approaches. There was a paradigm shift
from previous emphasis on demography and population control to sustainable development and
reproductive rights. ICPD formed the watershed in the history of population thinking giving birth to
the new world population order.
ICPD emphasized that population was not about numbers, figures and statistics but about people
and improving their quality of life. It required that population programmes should be development
oriented, human rights based, inclusive and participatory, and should involve all concerned people in
the whole process. It also agreed that force, coercion, incentives, disincentives will be counter
productive and that coercion infringes upon human rights.
It was based on a number of critical indicators such as maternal morbidity and mortality, age at
marriage, childbirth assistance, emergency transport and safe abortion services. It also had critical
indicators on the status of the newborn such as neo-natal deaths and infant care programmes. Gender
equity, women empowerment including violence against women, contraception, family planning and
male participation were cross cutting issues to which the government was committed.
One of the main operational strategies in National Population Policy (NPP) was the increased
participation of men in Planned Parenthood. It calls for focused attention on men in the information
and education campaigns to promote the small family norm, and to raise awareness by emphasizing
the significant benefits of fewer children, better spacing, better health and nutrition and better
education. Currently over 97% of the sterilization are tubectomies. NPP emphasizes on the need for
ensuring better and wider reproductive choice for women and young couples and promoting
reproductive rights of women.
Planned Parenthood in a broader sense entails good health of mother and child, proper
development and attention to children and welfare and caring for each member of the family. Planned
Parenthood is directly linked to maternal and infant mortality and morbidity. Only a healthy girl can
grow into healthy woman and be capable of bearing healthy babies. The purpose of Planned
Parenthood is to plan the number, frequency and timing of pregnancy, which ultimately affects family
size and health.

2.8 Page 18

▲back to top


16 BIHAR: POPULATION IN THE NEW MILLENNIUM
The critical message is that Planned Parenthood is a reiteration of the commitment to improve
the quality of life of the people. The main barriers to this commitment in implementing the ICPD
agenda have been the lack of political will and an inadequate understanding of the agenda among
policy makers. Policy makers and programme managers had a strong resistance to change from the
contraceptive target driven approach to a community needs assessment approach because they
believed in the traditional approaches and also were afraid of the consequences of disturbing the status
quo. The patriarchal nature of Indian society, responsible for gender inequities, is deeply embedded
as a mindset and requires sustained effort for change. Lack of commitment and accountability, which
denies people access to quality services, will require a strong political will to change.
Unless NGOs and government make a serious effort, people would not be able to exercise their
reproductive rights. NGOs need to remain focused on their role as watchdogs and change agents to
make the health care system accountable to people and empower them to demand for services. It is,
therefore, our collective responsibility to ensure that these processes are initiated, facilitated and
sustained in a holistic manner.
Building a Mandate on Planned Parenthood in Bihar
Population Foundation of India (PFI) is the Regional Resource Centre (RRC) for Bihar. As RRC
for the state, PFI provides technical support to build capacity in Reproductive and Child Health
(RCH) issues of NGOs under the MNGO Scheme of Government of India. An important component
of PFI's involvement as RRC is to build perspective and advocate on key RCH issues in the state. One
of the key issues for advocacy identified by PFI was Planned Parenthood in Bihar due to the rationale
mentioned above.

2.9 Page 19

▲back to top


17 BIHAR: POPULATION IN THE NEW MILLENNIUM
PFI adopted a participatory process towards involving diverse set of stakeholders and developing
an enabling environment for advocacy on the issue of Planned Parenthood in Bihar. The process
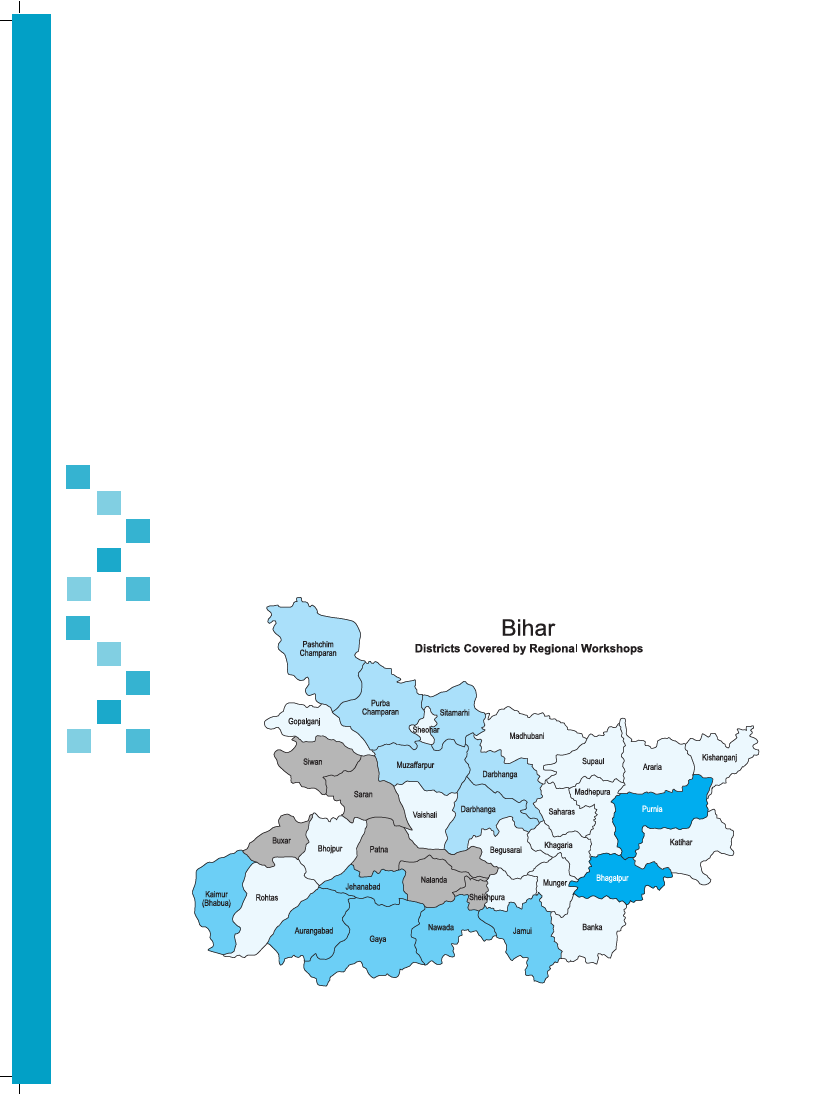
involved a state level workshop and four regional workshops in Bhagalpur which covered neighbouring
districts of Purnia; Gaya which covered districts of Nawada, Jamui, Jehanabad, Aurangabad and
Kaimur; Patna covering Nalanda, Buxar, Saran, Siwan and Sheikpura; and Muzaffarpur which covered
districts of Darbhanga, Samastipur, Sitamari, Pashim Champaran, Purba Champaran, Khagaria and
Saharsa in Bihar. A total of twenty-one districts were covered. Each regional workshop involved
stakeholders such as MNGOs, district level government officials (administrative and health), elected
representatives (Members of Legislative Assembly and Members of Panchayati Raj Institutions), media
and other NGOs working in the region.
The objectives of the regional workshops were as follows:
• To create a perspective on the different aspects of Planned Parenthood.
• To involve different stakeholders in an effort to improve the services required in Planned Parenthood.
• To develop action plans for improving the quality of Planned Parenthood.
Each of the workshop involved detailed discussion on Planned Parenthood issues in Bihar and the
district level issues and recommendations for the state through a state level dissemination workshop.
The current document incorporates recommendations from each of the regional and the state level
workshops.
The workshops were able to reinforce the importance of Planned Parenthood in population
stabilization, do a situational analysis of Bihar, and the issues to be addressed in this context. The
objectives laid down in the National Population Policy 2000 can only be achieved with the concept
of Planned Parenthood. It leads to the empowering women for improved health and nutrition,
ensures child health and survival, meets the unmet needs for family welfare services and increases the
participation of men in family planning. It, thus, leads to a focused and thematic approach, and
improves the client responsiveness to public health facilities.
Planned Parenthood will thus lead to a decrease in the unmet need for contraception, bring about
population stabilisation through an integrated, focussed and participatory approach and provides
assured, responsive, equitable and quality services.
Constraints of
Planned Parenthood in Bihar
Constraints at the Community/Household Level
Knowledge and Behaviour: Knowledge and behaviour plays an important part in shaping health
outcomes, through their impact on preventive activities, health-seeking behaviours, and compliance
during treatment. The GoI Social Assessment Study shows that the majority of women and especially
poor women lack knowledge and information about effective interventions, immunisation schedules
and suffer from misinformation. The age and education level of the mother influences the demand
and utilisation of services.

2.10 Page 20

▲back to top


18 BIHAR: POPULATION IN THE NEW MILLENNIUM
Poor Community Participation: Lack of community participation in creating awareness,
planning and monitoring of health facilities can lead to low demand in a community. Lack of
participation is in part the result of poor decentralisation and weak community structures with
Panchayats playing a minimal role. In addition, gender/social issues are of paramount importance in
determining the community's response to reproductive health (RH) services.
Poor Accessibility: Demand is sensitive to time as well as money. The travel time not
only depends on distance, but also on the transportation system, the road infrastructure, and
geography. In rural communities, where the roads are poor and the transport unreliable, the time
spent waiting for the transport, traveling to and waiting at the facility is unaffordable for most
poor families.
Inadequate Mobilisation of all Available Health Care Resources: In order to increase access to
RH services, the current thinking on partnering with private providers in health service delivery needs
to be re-visited, particularly in remote tribal areas.
Affordability: Public facilities are supposed to provide care free of cost, particularly to those
below the poverty line. Out-of-pocket expenditures for health services are high in India. High prices
for transport and for emergency care when pregnancy complications arise are unaffordable even for
an average family. Since care at public facilities has its own associated costs, the poor are more likely
to pay for private sector care because of convenient hours, 24 hour emergency care, perceived better
quality, options of paying in installment, and availability of drugs. The lack of risk pooling increases
the vulnerability of the poor to poverty.
Constraints at the Programme Level
Poor Decentralisation: Lack of flexibility in programming; one size fits all; lack of differentiated
strategy for groups with special needs. Decentralisation and accountability need to be in place at the
state, district and community levels.
Poor Governance and Lack of Accountability: The issue of governance and accountability comes
up repeatedly when addressing the issue of utilisation of services. One of the primary reasons for not
seeking care in a timely manner, particularly by the poor, is lack of availability of personnel and
supplies at the necessary time and place. The second is the treatment they receive even when trained
personnel are available. These are clearly issues of governance and accountability. Doctor absenteeism,
the ANM not staying in her post, drugs and tests prescribed that cannot be supplied at the facility,
unnecessary referrals, and the rude and callous behaviour of care providers (particularly to the poor
and marginalised) are all major reasons for the poor to either avoid seeking care or seeking care from
the private sector at huge expense.
Perception of Poor Quality: Care could be perceived to be of poor quality for a variety of reasons:
Administrative issues, such as poor deployment of health personnel, inconvenient working hours,
non-availability of lady doctor/anesthetist/surgeon, weak referral. Facility-based issues, such as poor
infrastructure, lack of basics such as water supply and sanitation, lack of privacy during examination.
Supply issues, such as lack of drugs, kits training/capacity building issues, such as poor technical
competency, poor provider/client interactions, and poor provider attitudes.

3 Pages 21-30

▲back to top


3.1 Page 21

▲back to top


19 BIHAR: POPULATION IN THE NEW MILLENNIUM
Constraints at the Policy Level
Lack of Appropriate Policies and Legal Framework: There is a need to develop strategies to
increase advocacy, rope in champions of reproductive health nationally and internationally, and raise
awareness of issues and promote debate.
Cross-sectoral Issues: Health outcomes may not be achieved even when the health system is
functioning fairly well as other sectors influence demand, for example, education, access to water and
sanitation, and road infrastructure, communication and power. These sectors are important
determinants of reproductive and child health outcomes. An important issue, even where services are
not at a desirable level of efficiency, is convergence of available services.
Planned Parenthood and NRHM
Within NRHM the four key reproductive and child health objectives are:
• Reduce infant mortality rate (IMR)
• Reduce maternal mortality rate (MMR)
• Stabilize population (TFR)
• Attain gender and demographic balance.
The incorporation of maternal and infant survival, population stabilisation and gender and
demographic balance into the primary goals of NRHM is evidence of the NRHM's continuing
emphasis on RCH approaches and interventions.
The following table reflects the goal of NRHM vis a vis key RCH indicators.
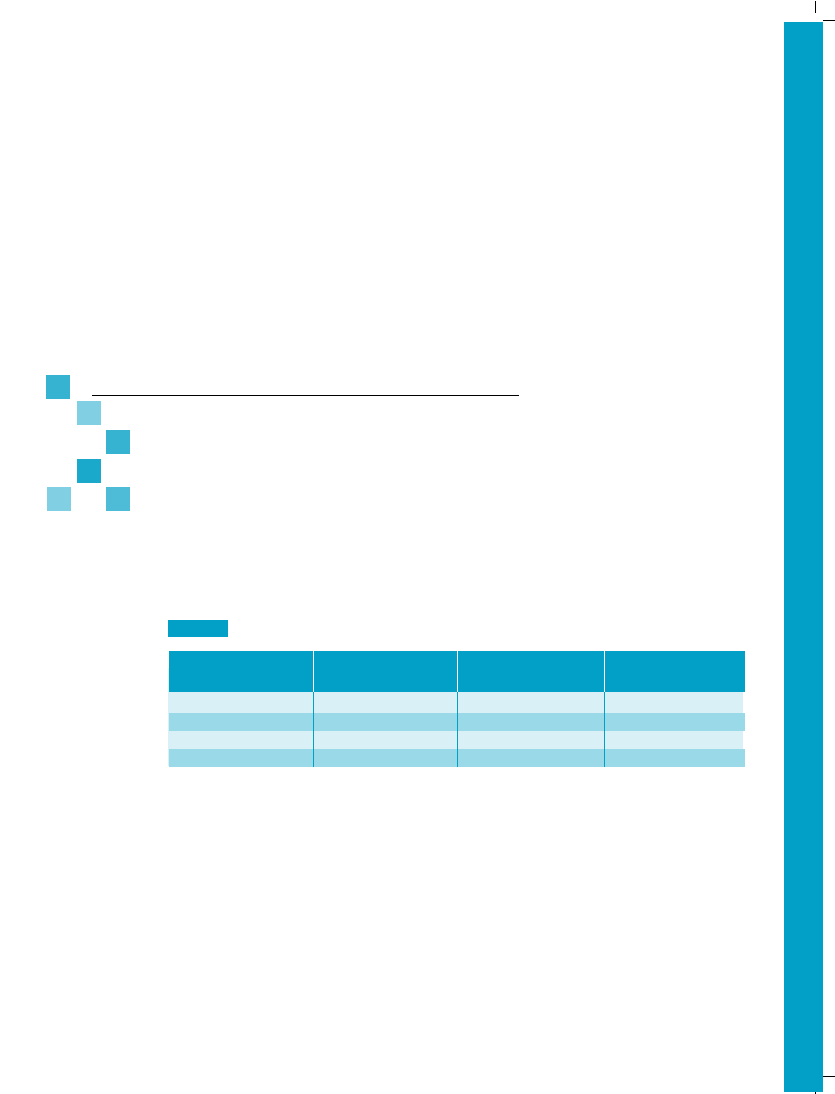
Table 6: Goals of NRHM for Bihar and India
Indicators
India
Bihar
MMR
407
452
IMR
66
62
NMR
45
46.5
TFR
3.2
3.4
Source: Mission Document on National Rural Health Mission-2005, MoHFW, Government of India.
Bihar Goal
(2009-2010)
275
35
25
2.25
Family Welfare and RCH programmes in India addressed only couples, thereby ignoring
adolescents. The couples addressed were over their peak reproductive years that led to no real impact
on maternal mortality, infant mortality, reproductive health of women, and reduced rates of STI/HIV
infection. Alongside there was no impact on population momentum. NRHM/RCH laid out new
approaches to solving the problem.
Understanding the specific linkages between Planned Parenthood and NRHM was very
important, the key indicators are IMR, MMR, TFR. Planned parenthood addressed the social and
behavioural factors that contribute to IMR, MMR and TFR which include age of mother at birth,
nutritional status of mother and length of previous birth interval, medical care received during
pregnancy, delivery and early postpartum period.

3.2 Page 22

▲back to top


20 BIHAR: POPULATION IN THE NEW MILLENNIUM
Planned Parenthood means planning one's family by taking conscious and informed decisions on
when to marry (age), when to have one's first child, the timing of subsequent children, the total
number of children desired. The objective of Planned Parenthood is to give one's children the best
possible chance of surviving, growing and thriving and of family well-being. For Planned Parenthood
to be implemented successful, family planning programmes must reach men and women early in their
lives, focusing on:
• Youth before they marry (adolescents in and out of school)
• Young couples to delay the first child
• Space subsequent children
• Limit family size
• Create equal value for the girl and boy child
• Preparing families for childbirth, nutrition, care and development
• Ensuring access to and utilization of services that will ensure the birth and survival of mothers
and children.
Planned Parenthood is a simple intervention with wide ranging benefits in reducing maternal and
infant mortality, and population stabilisation. It is a key strategy in attaining NRHM goals.
Participants
• Department of Health, Government of Bihar
• Directorate of Health, Government of Bihar
• State Health Society, Government of Bihar
• Community Based Organizations/Non Government Organizations
• Health Managers-Public, Private and Corporate
• Service Providers-Public and Private
• Media
The outcome of Planned Parenthood is prevention of unwanted pregnancies, prevention of high
risk pregnancies, preventing unsafe abortions and helping increase nutritional health of the women.
These ensure less demand on natural resources, better opportunities for better lives, and helps men
to provide a better life for their families.
On a national level Planned Parenthood helps in overall development and brings about
faster economic and educational improvement. When families are able to provide for the well
being of women, they are ensuring enough food, clothing, housing and education for children.
Planned Parenthood helps men care for their families and helps them to provide a better life for
their families.

3.3 Page 23

▲back to top


21 BIHAR: POPULATION IN THE NEW MILLENNIUM
Recommendations
Historically India's population stabilisation efforts have centered around family planning with
focus on fertility reduction. Such narrow vertical programs, often limited to achieving numbers, are
not the answer for India's population stabilisation. The shift has to be made from numbers to people.
Incentive driven programs often lead to coercive norms such as the two child norm, which harm
women's health and infringe on their rights, and increases gender inequalities. Population and family
planning programs have to be squarely placed within the larger context and take responsibility of
effective, affordable and accessible public health programs. There should be a rights-based, gender-
balanced approach to population stabilisation.
The need is for greater social investment, wider socio-economic development, strengthening of
the public health system and improved governance in order to achieve population stabilisation. Social
investments help reach the goal of slower population growth. Improving health care, education and
opportunities for women is a matter of human rights. It also empowers women and results in smaller
and healthier families.
For this need to be realised, priority should be given to repositioning family planning within
comprehensive primary health care, which in turn should be one of the key indicators for socio-
economic development. The social and developmental issues including poverty and discrimination
issues need to be tackled in a comprehensive and holistic manner rather than targeting population
control/family planning on a stand-alone basis. This is also located within a reproductive health and
reproductive rights framework.
The State of Bihar has adopted the National Population Policy, 2000 and the National Health
Policy, 2002. Even though it does not have a policy of its own, the suggestions and recommendations
under each strategic direction envisaged in the NPP should be as per local needs.
The following were the recommendations from the regional workshops:
Delaying Age at Marriage and Spacing
• Reproductive health rights of women should be promoted with active participation of adolescents
in planning and execution of programs.
• Provision of information, guidance and counseling services to adolescents and orientation to
parents about needs and constraints of adolescents to allow delayed age at marriage.
• Emphasis should be on skill and ability development by educational system in keeping with the
opportunities to enable youth to develop into responsible and responsive citizens with an
adherence to secular principles and values enshrined in the constitution of India.
• The state should reduce the percentage of girl's marrying below 18 years from 51.5% to 80% by
2010 and to 100% by 2012.
• Promote change in reproductive behaviour through behaviour change communication initiatives.
The long-term goal should be to improve the health and welfare of young mothers and their
children by changing traditional customs of early childbearing.
• In order to bring about a reduction in maternal and infant mortality rates; and improve the survival
and general health of the mothers and children, focus should be to delay the first child until the
woman is 21 years of age, and space subsequent children by three to five years.

3.4 Page 24

▲back to top


22 BIHAR: POPULATION IN THE NEW MILLENNIUM
The target should be the following age groups:
• Adolescent girls between 12-14 years of age.
• Adolescent girls and boys between 15-19 years of age.
• Newlywed couples who had not yet had a child.
• Young couples with only one child.
• Families of young couples especially young mothers-in-law.
• Respected elders and community leaders.
• Delay of first pregnancy and spacing for the subsequent pregnancy, questioning preference for
sons, shifting to male sterilization or non sterilization options should be an approach of the state
to acquire gender equity.
• Family planning/welfare programs will only have current levels of success as a stand alone
program. They will require health education built around better understanding of human
sexuality, universal access to all modern methods of contraception (basket of choice) especially
condoms, pills, and IUD as a backup option to through social marketing/franchising approaches
such as the social marketing approach of Janani.
• Long acting IUDs for 10 years should be advocated after screening for RTI and STI.
Comprehensive development with education and social security should be the focus of the state.
• Family planning program should have comprehensive First Referral Unit (FRU) level services with
fixed day per week approach and a one third Laparoscopic Tubectomy (LTT), one third
Conventional Tubectomy (CTT) and one third NSVT mix. This should happen only as part of
health system development approach and not as camp approach.
• Filling up of all vacancies to meet shortfall in health personnel and presence of health personnel in
all positions. Training for new ANMs/Nurses and paramedics should be completed by 2010.
• District level committees for accreditation of MTP centres should be in place. Comprehensive
abortion care should be provided at state and district levels.
Community Needs Assessment
• Family planning and other population stabilisation programmes should no longer be an isolated
programme but form an integral part of the comprehensive primary health care programmes and
need to be based on "Community Needs Assessment" which should be the starting point in any
exercise of planning and designing of programme implementation to improve the overall socio
economic development of the country and ultimately stabilise population.
• The Community Needs Assessment and Micro Plan to develop the Village Action Plan by the
Village Health Committee should be done in consultation with the PRIs helped by the local
government functionaries.
• Based on these Micro Village Action Plans, the Block and District Plans should be developed.
• Micro planning with community needs assessment can help identify and address the local problems
through more acceptable strategies.
• This decentralised and participatory process of health planning provides spaces for involvement of
Panchayati Raj Institutions, increased interface and interaction between the community and the state,
addresses gender concerns, ownership and accountability in health programme implementation.

3.5 Page 25

▲back to top


23 BIHAR: POPULATION IN THE NEW MILLENNIUM
• "Quality of Care" should be ensured at all levels of health programme implementation. Indicators
of quality of care should be developed at the community based planning stage.
• It is vital to install a good Health Management Information Systems (HMIS) for improving the
effectiveness of the programme.
• The emphasis on complete registration of births, marriages, pregnancies and deaths, shall inform the
planners of the current and the future status of the population and help at various stages of the program.
• 100% registration of births, deaths, marriages and pregnancies in a campaign mode. 50% of
registration of marriages should be completed by 2010 and 100% by 2015.
Quality of Care
• Good quality family welfare services and reproductive technologies that are safe and effective
should be promoted. Quality of care, demand for spacing methods should be enhanced.
• Male participation should be advocated to reduce the burden on women by committing to
providing for informed choice and to seek the voluntary involvement of the citizens.
• Develop special packages for districts with high unmet need in terms of health and family welfare
services with the help of non-government and not-for-profit organisation. It should endeavour to
increase the utilisation of these services by making them user friendly.
• The state should promote a spirit of voluntarism and protect human rights to protect family
planning services from adopting coercive strategies in any form.
• Strategies for achieving population stabilisation should include improving socio-economic
indicators such as addressing the needs for maternal care, child health and contraceptive services,
education of girls, ensuring a minimum age at marriage of girls, reducing infant mortality and
MMR through better health care and immunisation, nutrition support to women and children.
• Improvement in socio-economic indicators for population stabilisation should be supported
adequately and effectively with strong political commitment, effective IEC strategy and all round
up gradation of health facilities.
• Public health programmes through the primary health care system need to work together so that
all families have access to a continuum of care that extends from pregnancy (and even before),
through child birth and childhood, instead of the often fragmented services available at present.
• To ensure that all families have access to care, the state government must accelerate the building
up of the coherent, integrated and effective health systems.
• Programmes on the one hand should not focus only on numbers or on female sterilisation but in
providing accessible, affordable, quality of care and choice in decision making in family planning
issues. Coupled with this is the need to tackle the health work force crisis.
• Multi-pronged approach is required to approach population stabilisation such as (a) strong
campaign for age at marriage at 18 years for girls, (b) ensure institutional delivery, and (c) meet
the unmet demand for contraception.
• Emphasis should also be provided on monitoring of maternal and child health services and health
programmes through proper health systems management and information systems at district level
as well as availability of district health indicators on a regular basis.
• Essential obstetric emergency and obstetric care should be provided at the district and FRU levels
to prevent maternal deaths.
• A dual approach of institutional delivery and safe delivery by TBAs/other SBAs should be
implemented.

3.6 Page 26

▲back to top


24 BIHAR: POPULATION IN THE NEW MILLENNIUM
• Accreditation of private providers and reimbursement of services should be provided through a
voucher system like the Chiranjeevi Programme in Gujarat.
• Programmes should focus on the high fertility districts where all social and health indicators and
the governance system are extremely poor.
Sex Ratio
• The PCPNDT Act should be vigorously implemented along with monitoring of ultrasound clinics.
The social issues connected to child sex ratio such as eve-teasing, molestation, violence against
women should be addressed.
Literacy
• A multicultural approach to improve literacy, universal primary education, reduce dropout rates,
enable youth to augment employment opportunities, addressing needs of health, integrate
information on health including reproductive health and population issues, HIV/AIDS and life
skills in the curriculum.
Nutrition
Morbidity and mortality is related to high prevalence of malnutrition. The stakeholders recognized
young children, adolescents, pregnant and lactating women and elderly as the most vulnerable. The
single greatest cause of malnutrition is poverty and the single greatest remedy is equitable development.
• Recognising the complete unacceptability of hunger in modern society, the state should ensure
food security to all.
• Strengthen and universalise the Public Distribution System and ensure employment guarantee or
unemployment benefits so that there is assured food supply at affordable rates.
• Supplementary feeding system should reach all children through the Aanganwadi and School Mid
Day Meal Programmes.
• Integrated Child Development Scheme (ICDS) should remain the key strategy.
• Reduce malnutrition and under nutrition by 50% by 2010 and 100% in 2012.
• The current ICDS Scheme should be strengthened into a comprehensive early childhood care
program with improvements in quality and outreach.
• Every pre-school child should be assured of nutrition, pre-school education and health care and
every working mother should be assured of day care support for young children.
• The ICDS and Mid Day Meal Programmes should undertake innovative, flexible and collaborative
approach to meet the health need of infants, pre school children, and school going children,
expectant young mothers and elderly people.
• Reduce child nutrition levels as well as preventive measures against epidemics and recurrent
infections like diarrhoea, cholera etc in young children through school health programme.
• Children with special needs such as the physically challenged should be provided special nutrition
with a flexible partnership approach.
• Among all these food security measures, public understanding of good dietary habits as suitable to
different cultural and economic contexts should be promoted through appropriate nutrition and
education programmes.

3.7 Page 27

▲back to top


25 BIHAR: POPULATION IN THE NEW MILLENNIUM
Intersectoral Coordination and Decentralisation
Intersectoral coordination is essential to ensure that many of the social determinants of health and
addressed adequately. Priority areas of such coordination are nutrition, food supply, water and
sanitation and poverty alleviation programmes.
• The PRI and statutory social sector sub committees should be the main institutional framework
for intersectoral coordination.
• Coordination should include community needs assessment, planning job responsibilities and
functioning at the village level so that each of the functionaries should assist each other in reaching
the common goals.
• The health sector staff, ASHAs, panchayat functionaries, primary school teachers and Aanganwadi
workers should be entrusted with various individual and joint responsibilities in integrated service
delivery.
• The Panchayats should involve civil society in monitoring the availability, access and affordability
of services and supplies.
• Coordinate and ensure registration of births, deaths, marriages and pregnancies at the village and
Panchayat levels.
• Assess progress on different parameters and joint action plans to ensure that progress is
accelerated.
Public-Private Partnership
The major part of curative health care provision in the state is by the private sector. There is need
to involve this sector in contributing to the public health goals including the increasingly important
goal of ensuring that health care provision does not adversely impact the poor.
• Develop a basic minimum regulatory framework to register and accredit private health care
providers.
• Adequate information about the services they offer and their costs and quality should be linked to
processes of accreditation.
• The framework should ensure that costs and quality remain within reasonable limits and poor have
access especially in emergency situation.
• Private sector should be encouraged to develop links to public health system especially for referral
and diagnostic health services.
• Ensure cost and quality regulation to supplement and not substitute existing public health care in
such partnerships.
• Bring in private capital to contribute to health sector goals and not transfer public assets or
resources to private hands. Ensure mechanisms for the poor to access such partnership.
• Better access for the poor to tertiary services through risk pooling mechanisms and social insurance
linkages.
• Promote a partnership with dedicated not for profit voluntary sector in health care service
provision.
• Act as centres of innovation and excellence in reaching health care to the poor.

3.8 Page 28

▲back to top


26 BIHAR: POPULATION IN THE NEW MILLENNIUM
• Scale up innovative projects in the state on health, for example, the Janani model of social
franchising for reproductive and child health services, the Pathfinder model of delaying age at
marriage and first pregnancy etc.
Capacity Building
• District level orientation programmes for all health workers including Traditional Birth Attendants
and Skilled Birth Attendants should be undertaken.
• Orient and train the PRIs (elected women representatives of the Panchayats constitute more than
50% of the total elected representatives) so that they play an effective role. Necessary support
systems for them should also be developed.
• Financial and administrative powers should be given to the three tier PRIs at one go as in Kerala
(Big Bang Approach).
Communicable Diseases
• Develop an effective epidemiological information system to identify the magnitude and
distribution of communicable diseases especially malaria and kala azar in different population
groups.
• Integrate all communicable disease control programme at the primary health care and grassroot
levels to make program implementation more effective.
• Adopt innovative and effective models like Integrated Management of Neo-natal and Childhood
Illnesses (IMNCI) and the Home Based Neo-Natal Care (HBNC) model with community
participation.
• Couple prevention and control of communicable diseases among children (neo-nates) by
intersectoral coordination and referral within five years.
• Train ASHAs, re-train Dais and Skilled Birth Attendants in a phased manner for the above
initiatives.
Young People
• Develop an integrated youth policy, strategy and plan and set up youth resource centres at the state
and district levels.
• Enroll, retain and vocationalise formal and non-formal education as part of the strategy to
empower adolescent groups.
• Form self help groups of adolescents for micro-finance/Prime Minister Rozghar Yogana.
Conclusion
It is now commonly agreed that improvements in public health are not determined solely by
improvements in the quality of services or in health service delivery.
• A broader approach is needed that tackles inequality in health provision and access, and increases
demand for services among the poor and the marginalised.
• Studies indicate that building demand for services calls for a multi-pronged approach that
addresses the following:

3.9 Page 29

▲back to top


27 BIHAR: POPULATION IN THE NEW MILLENNIUM
— Perceptions of quality of care, determined by availability of trained personnel, provider
behavior, and availability of drugs and medicines;
— Cost of care;
— Geographical/physical access to services; and
— Gender/social barriers to accessing health care.
Protecting the poor from the financial consequences of illness by strengthening a network of
public health facilities that is capable of providing reliable RH services of acceptable quality.
While strengthening public sector delivery has been traditionally regarded as the "best response"
to the issue of increasing access to health services, it is increasingly becoming evident that there are
geographical areas, as well as marginalised populations, that will remain outside the reach of the public
sector. Analysis of National Family Health Survey-2 data in India clearly indicates the overwhelming
dependence in rural areas on private providers for self-perceived gynecological ailments.
Gender or socio-cultural differences between women and men place other burdens on women's
health. The role, rights, responsibilities, and status assigned to women by society leave women
vulnerable to unwanted and unprotected sexual intercourse, poor nutrition, and physical and mental
abuse; they also limit women's access to health care. The status of women in society is a serious
limiting factor to their health status.
Bihar along with the rest of India has the maximum number of young people in its population.
Any programme aimed at bringing about a change in behaviour, attitude or numbers must include
and involve young people in the process particularly the adolescent. Special focus needs to be given
to the married adolescent so as to influence them and making them capable towards decision making
for a better family life based on the principles of choice, dignity and rights. The issues of focus are
reproductive health information and counseling, youth friendly services, economic and personal
development issues and community norms and attitudes. The common components are:
• Ensuring access to reproductive health services and information,
• Emphasizing youth skills development beyond traditional schooling to include life skills,
continuing education and livelihoods.
• Fostering change in family and community norms and attitudes to increase acceptance of solutions
that genuinely address youth reproductive health, social, and economic needs.
The second long-term goal is to improve the health and welfare of young mothers and their
children by changing traditional customs of early childbearing. In order to bring about a reduction in
maternal and infant mortality rates; and improve the survival and general health of the mothers and
children, there should be a delay in the first pregnancy until the woman is 21 years of age, and space
subsequent children by three to five years. Some of the target population are adolescent girls and boys
between 15-19 years of age, newlywed couples who had not yet had a child, young couples with only
one child and families of young couples.
The important focus should be towards preventing unsafe abortion, reduce abortion related
mortality/disability, increase access to abortion and other reproductive health services and empower
women to make their own reproductive choices. There is need for strengthening training sites and
strengthening service delivery sites in collaboration with the state government, provide private sector
linkages towards strengthening service delivery at village level, training of health providers at all levels
in new technology and increased linkages between PHCs and the ANM and the women in
the village.

3.10 Page 30

▲back to top


28 BIHAR: POPULATION IN THE NEW MILLENNIUM
References
Annual Sentinel Surveillance for HIV Infection in India, County Report 2005, National Institute of Health and
Family Welfare and National AIDS Control Society, New Delhi, 2007.
Bulletin of Rural Health Statistics in India, Ministry of Health and Family Welfare, Government of
India, 2006.
Health Information of India, Central Bureau of Health Intelligence, Ministry of Health and Family Welfare,
Government of India, 2005.
Human Development: Strengthening District Level Vital Statistics in India, F. Ram, Chander Shekhar and S K
Mohanty, International Institute for Population Sciences, Mumbai, 2005.
Losing Count, Mapping India's Child Sex Ratio, Rao K.L. and Nayak S, Population Foundation of India, New
Delhi, 2006.
National Population Policy-2000, Ministry of Health and Family Welfare, Government of India, 2000.
Mission Document on National Rural Health Mission-2005, Ministry of Health and Family Welfare,
Government of India, New Delhi, 2005.
National Family Health Survey-1, Bihar-1993-1994, International Institute for Population Sciences, Mumbai, 1995.
National Family Health Survey-2, Bihar-1998-1999, International Institute for Population Sciences, Mumbai, 1999.
National Family Health Survey-3 Factsheets, India-2005-2006, International Institute for Population Sciences,
Mumbai, 2007.
Population, Health and Development Bihar (draft), Ali, A, Mukhophay, S and Nayak S, Population Foundation
of India, New Delhi.
Population Policy-2002 (draft) Department of Health, Government of Bihar.
Primary Census Abstract, Total Population: Table A-5, Series-I, Census of India, Registrar General of India, New
Delhi, 2001
Reproductive and Child Health District Rapid Household Survey (RCH_DRHS), 1998-1999 International
Institute for Population Sciences, Mumbai, 1999.
Reproductive and Child Health District Level Household Survey (RCH_DLHS), 2003-2004, International
Institute for Population Sciences, Mumbai, 2005.
Report and Tables on Age, C-14, Census of India, Registrar General of India, New Delhi, 2001.
SRS Bulletin 2003, Sample Registration System, Registrar General of India, New Delhi, 2005.
SRS based abridged life tables, Registrar General of India 1999-2003, New Delhi, 2005.
Statistical Report No. 1 of 2004, Sample Registration System, Registrar General of India, New Delhi, 2006.
Textbook of Preventive and Social Medicine, K. Park and K. Park, Seventeenth Edition Mrs. Banarsidas Bhanot
Publishers, Jabalpur, 2002.
Training Module on Reproductive and Child Health, Population Foundation of India, 1999
www.censusindia.net
www.iipsindia.org
www.mohfw.nic.in
www.nhfsindia.org
www.rchindia.org
www.whosea.org

4 Pages 31-40

▲back to top


4.1 Page 31

▲back to top


4.2 Page 32

▲back to top