Cost Analysis for Scaling Up Manual

Cost Analysis for Scaling Up Manual


1 Pages 1-10

▲back to top


1.1 Page 1

▲back to top


1.2 Page 2

▲back to top


1.3 Page 3

▲back to top


1.4 Page 4

▲back to top


One of the key challenges to universal health care in India is the scaling up of models
or innovations that have been tested in a variety of contexts. Findings from several
evaluations and reviews, especially of the National Rural Health Mission, highlight
bottlenecks in rapid and effective scaling up. Key factors that need to be addressed
are the lack of a scaling up strategy, poor knowledge management, little attention to
technology transfer, assessment of costs and cost effectiveness, and capacity building.
Population Foundation of India (PFI) in partnership with Management Systems
International (MSI) adopted the Scaling Up Management (SUM) Framework in 2006
and has since been applying it to NGO and government-led pilots for the scaling up of
innovations in health and nutrition in India.The initiative is supported by The John D and
Catherine T MacArthur Foundation. The SUM framework is an operational framework
that enables a systematic approach to scaling up.
PFI has trained various NGOs, funding organizations and government representatives on
the SUM framework to enable them to systematically apply the scaling up management
principles to their programmes. PFI, with the support of the Planning Commission,
04

1.5 Page 5

▲back to top


05
organized a National Conference on Scaling Up: Lessons Learnt and Way Forward in
2010 to share experiences from health and other social sectors on scaling up, and to
develop a vision and strategy for scaling up social sector programmes in India. PFI and
MSI have also developed a tool kit and offer training workshops for practitioners and
researchers on Scaling Up. Details can be accessed at: http://populationfoundation.in/
news/pfi-conducts-training-programme-trainers-scaling
The cost of scaling up interventions has been one of the most critical areas of dialogue
among policy actors in developing countries. Without a means of determining the
costs of expanding health interventions, the feasibility or sustainability of scaling up
interventions cannot be assessed.This manual attempts to fill the gap by analyzing cost
data at the point of service delivery for taking scaling up decisions.This will also help in
estimating resource requirements and efficiently allocate scarce resources especially in
the context of scaling up pilot interventions.
We hope that this manual will be helpful to organizations advocating for Scaling Up.

1.6 Page 6

▲back to top


Introduction...................................................................................07
Definitions and classifications.....................................................09
Cost analysis: How to estimate unit cost?..................................14
Costing scaling up operations.....................................................25
How to do a cost-effectiveness analysis?...................................30
06

1.7 Page 7

▲back to top


07
Background
The cost of scaling up primary health care interventions has been one of the most critical
areas of dialogue among policy actors in developing countries. Without a means of
determining the costs of expanding health interventions, policy makers cannot assess
the feasibility or sustainability of scaling up interventions. It is also important to know
whether costs incurred to scale up an intervention would produce adequate value for
money or, at least, are more cost effective than other competing interventions. Clearly,
the broader issue of efficiency in resource allocation and consequent speed and scope
of scale up rates depend crucially on the knowledge of costs and cost-effectiveness of
potentially scalable interventions.
Unfortunately, the evidence on costs and cost-effectiveness often remain unavailable
or inaccessible to the programme managers/policy makers when they have to make
crucial decisions on maintaining or scaling up a programme.The primary reason behind
such a miss is an apparent lack of adequate interest and skill to grip and analyze the cost
data at the service delivery level. The manual attempts to fill this gap by helping health
professionals estimate resource requirements and efficiently allocate scarce resources
especially in the context of scaling up pilot interventions.
Purpose of this manual
The central purpose of the manual is to provide guidance to health programme
managers on (1) how to apply costing techniques for estimating resource needs for an
intervention, and (2) how to do a simple cost-effectiveness analysis to assess the value
for money invested on a particular intervention.The concepts and techniques discussed
are linked and made relevant to scaling up operations of the interventions.

1.8 Page 8

▲back to top


After the training based on this manual, the trainees should be able to identify and
categorize the problems they face in allocating scarce resources. It would help to
convince programme managers to use cost information as one important indicator
of the efficiency of their facilities. Finally, service providers may develop a better
understanding of how to use resources more effectively to improve the delivery of
health services.
Who will use this manual?
The manual is primarily targeted at programme managers and health professionals
from agencies associated with Scaling Up initiatives organized by PFI. However, more
generally, it may be used by those who will conduct cost studies and related evaluations.
They should be of interest also to officials who will use the results. Experience with
similar studies is not a requirement; neither is training in economics, accounting,
or epidemiology.
Sources
As a user of this manual one might require access to a particular methodological text
for estimating costs and the related aspects of health services, especially their effects
and cost effectiveness. Cost Analysis in Primary Health Care: A Training Manual for
Programme Managers1 is an excellent resource and is the basis for this manual in
several places. The manual liberally uses some of the text’s language verbatim or with
slight paraphrase. Application of the manual, however, does not require access to the
above reference despite its relevancy to various topics, especially costs.
In addition to above resource, this manual draws heavily upon the following resources.
Janowitz B and Bratt J (1994). Methods for costing family planning services. UNFPA
and FHI.
O ver M (1991). Economics for health sector analysis: concepts and cases.The World Bank.
Johns B and Torres T (2005). Cost of Scaling up health interventions: A systematic
review. Health Policy and Planning, 20(1), p 1-13
Organization of the manual
The manual starts with an introduction (Section I). In the next section (Section II), the
basic concepts and classifications related to costs are discussed. Next section (Section
III) is the core where the process of cost analysis is presented step by step. Section IV
extends the analysis to scaling up initiatives. Finally, the last section (Section V) presents
a simple procedure on how to do cost-effectiveness analysis.
08
1 Creese A and Parker D (1994). Cost analysis in primary health care: A training programme for
programme managers. WHO: Geneva

1.9 Page 9

▲back to top


09
Definitions and
classifications
Introduction
In common parlance we often use the words ‘costs’, ‘prices’, ‘payments’, and
‘expenditures’ interchangeably. For example, we ask ‘how much did the shirt cost you?’
to mean ‘what was the price you paid for the shirt?’ Similarly, the actual expenditure
incurred to run a hospital may often be denoted as costs of producing hospital services.
However, from an economist’s or a manager’s viewpoint, the words bear different
connotations. To an economist, costs always imply the value of resources or inputs –
expressed in terms of monetary units - used in the production of a certain good or a set
of services. Thus costs are always associated with some production – a kind of sacrifice
you make as a producer to transform inputs into output. It may be expressed either in
terms of how much was the actual value of the resources (Actual cost) or how much
value we should assign to them (Standard costing). In any case, it is different from price
which indicates how much one would pay per unit of a good or service when he/she
wishes to purchase it.
It is important to note that the connotation of cost varies according to how you look at
it. In other words, as a programme manager, there are several ways you can classify
the concept depending on which aspects of programme you are interested in.The major
classifications are given below.
Economic costs vs. accounting costs
Suppose, in a Reproductive and Child Health care (RCH) programme run by a voluntary
agency, three types of human resources are used: (1) paid clinical staff (doctors, paramedical
staff, etc.), (2) paid managerial staff (programme coordinator and assistants), and
(3) community level volunteers for counselling pregnant women. Since the first two

1.10 Page 10

▲back to top


10
categories are paid staff there will be cash outflow to pay their salaries and this outflow
will be recorded (or, booked) by the accountant. This is an explicit cost since you
used the resources, paid for it in cash and recorded it. On the other hand, for the third
category (volunteers) there is apparently no cost since there is no cash outflow for them
(except probably some expenses for their refreshment and travel). So the cost does not
show up explicitly in any record (or, book) for this category even though you are using
these resources.
From an accounting viewpoint, therefore, only the payments to the first two categories
will be included while the third will remain unaccounted or excluded. This is called
Accounting cost. An economist will, however, include all of them. For the third category,
the economist will impute the market price of the volunteers’ time (i.e., the wage a
volunteer would have earned had he/she been employed on a similar but paid job).This
is called Opportunity cost which implies that the cost of using a resource arises from the
value of what it could be used for instead.
The concept of opportunity cost is very important to the programme managers who are
in-charge of using scarce resources to gain some health outcomes. For example, if you
receive a free supply of vaccines from the government or any other agency for your
MCH programme the accounting cost will be zero, but the opportunity cost will be the
value you would have to pay if you would purchase the vaccines from the market. It can
also be looked at in an alternative way. For example, the opportunity cost of providing
a free medical check-up for women is the revenue you have sacrificed had you treated
them with a ‘fee’.
The question is: why should we bother at all about these ‘zero’ costs and treat them as
a legitimate cost item since we are not paying anything anyway? There are two reasons:
(1) the items which cost you nothing today (e.g., donated vaccines, volunteer workers,
etc) may come up with a price tag tomorrow. Hence, if you are concerned with the long
term sustainability of the programme, the total cost of all inputs – even those temporarily
provided by donors or paid for at below market rates – must be estimated at their full value.
(2) Assessing the efficiency of the inputs may produce distorted results (and, hence, wrong
decisions regarding their allocation) if some inputs are assumed to have zero or less-than-
market value. For example, a programme run by a set of inefficient or idle volunteers may
look more cost-efficient than one which is being managed by a paid but efficient set simply
because in the former case you get some output without paying anything.
Programme cost vs. users’ cost
We should also distinguish between costs borne by programs and costs borne by users
(apart from service fees). Some programmes bear a part of costs related to delivery of
services and the users supplement it by paying from their own pockets. For example, in
no-cost fixed service delivery points such as clinics, the user bears the costs of travelling
to the clinic to obtain the services. In that case, the travel cost is the users’ cost while the
rest (e.g., medicines, consultations, etc.) are programme costs. On the other hand, in an
outreach door to door service, the program bears that cost and users pay nothing. The
total costs of fixed and outreach programs may be the same but the cost burden falls
differently on programs and users.
Non-shared (or, Direct) vs. Shared (or, Indirect) costs
In any programme, it is possible to identify certain inputs that contribute directly to the

2 Pages 11-20

▲back to top


2.1 Page 11

▲back to top


production of output, and other inputs that are associated with supporting direct activities.
Accordingly we can classify the associated costs as “shared” and “non-shared” costs.
For example, consider the RCH programme again. Suppose, the programme wants to
analyze its cost for running fixed clinics which is one of its many activities. There are
several inputs which are exclusively devoted to this activity and, hence, are ‘traceable’
to this activity – for example, the clinical staff, maintenance of the equipment, medicines
and consumables.The costs for these inputs are directly attributed to the clinic activities
and, hence, they may be termed as Non-shared or Direct Costs.
The above inputs are, however, ineffective without the support of some other inputs.
These inputs support other activities also but it is difficult to identify their contribution
to a particular activity without applying some allocation rule or formula. For example,
if the clinic is located in the programme office building and the rent is charged for the
whole building, it is difficult to assess how much of this rent could be ‘apportioned’ to
the clinic room. Similarly, a part of the time of the programme coordinator is also used
by the clinic, who spends time also for other activities. As Table 1 shows, the salaries,
supplies, and other costs are classified as non-shared costs of the clinic (because, these
inputs are exclusively used by the clinic), while programme coordinator’s salary, rent,
utilities, etc. are classified as shared costs (because, these inputs are shared also by
other non-clinic activities).
Table 1. Monthly cost reports of the RCH clinic
Classification
Non-shared costs
Salary of clinic staff
Furniture + equipment
Medicines and consumables
Total Non-shared costs
Shared costs (allocated)
Programme coordination
Administration
Rent + utilities
Maintenance
Total shared costs
Total costs
Amount (in Rs.)
75,000
10,000
5,000
90,000
1,500
500
250
200
2,500
92,500
Capital cost vs. Recurrent cost
The key issue in distinguishing between recurrent and capital costs is the life expectancy
of project inputs. “Recurrent costs” usually are defined as the costs associated with
inputs that will be consumed or replaced in one year or less, while “capital costs” are
defined as the annual costs of resources that have a life expectancy of more than one
year, such as equipment or buildings. Recurrent and capital costs may be either direct
or indirect.
In a primary health care setting, examples of recurrent costs can include commodities
(such as drugs, contraceptives, etc.), medical materials and supplies, office supplies,
utilities and staff salaries. Capital costs can include clinic space, operating room
equipment and vehicles for transporting people and commodities. Staff training also
11

2.2 Page 12

▲back to top


12
can be classified as a capital cost if the new skills are expected to last for one year or
more. The costs of refresher training courses that occur throughout the year should be
classified as recurrent.
Table 2 presents an example of this classification based on the experience of a Breast-
feeding Promotion programme in health facilities.
Table 2: Classification of cost by inputs: An example of a Breastfeeding Programme2
CAPITAL COSTS
Vehicles: Bicycles, motorcycles, 4-wheel drive vehicles, trucks
Equipment: Televisions, VCRs, slide projectors, refrigerators, sterilizers, bassinets, electric breast pumps,
scales, other equipment with relatively high unit costs ($100 or more)
Buildings (Space): Health centres, hospitals, administrative offices, storage facilities
Training (Non-recurrent): Trainers, education materials, space, trainees, travel
Social Mobilisation (Non-recurrent): Social mobilisation activities that occur only once or rarely
(example: formation of community based committee)
RECURRENT COSTS
Personnel (all types): Supervisors, health workers, health volunteers, administrators, counsellors,
consultants, casual labour
Supplies: Drugs, breast milk substitutes, manual breast pumps, bottles and nipples, educational materials,
baby cots, small equipment (less than $100)
Vehicles (Operation & Maintenance): Petrol, diesel, lubricants, tires, spare parts, registration, insurance
Buildings (Operation & Maintenance): Electricity, water, heating, fuel, telephone, fax, insurance, cleaning,
painting, repairs of electric fittings, plumbing, roofing, Air Conditioning
Training (Recurrent): Short courses, in-service training
S ocial Mobilisation: Operating costs
Other operating costs not included above
Fixed vs. Variable cost
Fixed costs do not change in response to changes in volume. They are a function of the
passage of time, not output. For instance, in the RCH example (see Table 1), maintenance
costs will remain Rs. 200 irrespective of output level (i.e., number of beneficiaries);
hence it will be a fixed cost. Variable costs, on the other hand, are functions of output.
In other words, starting from zero (when there is no output) it increases as output
increases. For example, costs on medicines and consumables are variable – it increases
as the number of users increase.
In the context of programme management, the distinction is important. Fixed
costs are often committed and, hence, difficult to control. For example, you have
to pay the salaries of permanent staff even if your programme is not doing well.
Hence, a programme with a high percentage of fixed cost but low output may risk
low sustainability.
2 Robertson R et al (1995). Guidelines for estimating costs, savings, and cost-effectiveness of
breastfeeding promotion through health facilities. University Research Corporation/International
Science and Technology Institute. Bethesda, MD..

2.3 Page 13

▲back to top


EXERCISE
Assume that you are doing a cost classification of a School Health Education programme
to be implemented by a local NGO.The programme’s objective is to generate awareness
about major communicable diseases and their simple hygienic and dietary solutions
among school children. In this programme, thirty schools will be targeted and trained
community health workers will visit and interact with the students of Class VIII and IX
with different types of education materials. At least four visits will be made to each
school. All activities – including the training of health workers – will be supervised by a
team of two public health specialists (Medical officers).
1. List all key activities and required inputs of the programme.
2. Impute cost to all inputs (hypothetical)
3. Classify them by recurrent/non-recurrent, direct/indirect, and fixed/variable
4. C ross classify Direct/Indirect and Fixed/Variable. For example, in the first cell,
write the items and their costs which are direct as well as variable. And, so on.
Variable
Fixed
Total
Direct
Indirect
Total
13

2.4 Page 14

▲back to top


Introduction
One fundamental item of financial data needed by a health programme manager
is the unit cost of health care services they are providing. A unit of health services
may be one child immunized, or a birth delivery at the programme’s health facility.
This section explains how to allocate costs by such activities and how to compute unit
costs. To perform these calculations precisely, the programme needs an accurate and
comprehensive financial accounting system. In many programmes, however, existing
accounting systems have gaps, such as excluding some costs or lacking the data to
relate the costs to specific activities. In these cases, estimates are needed. This section
provides a number of suggestions for generating such approximations. It is organized
based on the following steps.
Steps of cost analysis
1. Decide purpose of the cost analysis.
2. Decide time horizons
3. Identify the programmes/activities
4. Identify the costs for non-recurrent inputs
5. Identify the costs for recurrent inputs
6. Allocate all costs to the programme/activity
7. Compute total and unit cost for each programme/activity
Step 1: Decide purpose of the cost analysis and assess data availability
What are the services or programmes for which you are interested in computing
unit costs? For example, do you want to know the unit cost for all programmes,
or a separate unit cost figure for each service? The decision will depend on two
key questions:
14

2.5 Page 15

▲back to top


P urpose of the Analysis. If you want to do a comparison of costs of certain services
(e.g., immunization, neo-natal care, maternal care, etc) covered by your programme,
you will need to compute unit costs for each service separately. If you want to compare
multiple programmes or service delivery centres with similar services (e.g., comparing
the unit cost of the programme across multiple centres), it may be sufficient to compute
a single unit cost for all programme services for each centre.
O ne may also look at the purpose from a different angle. If your programme is ongoing
you may want to know how efficiently the resources are being used. In that case, data
on actual expenditure should be used to estimate the unit costs. On the other hand,
if you are planning a new intervention (or, scaling up an existing intervention) you
should use the standard cost or ‘shadow price’3 of the inputs to estimate resource
requirement and their allocation. Hence, in the first case, you should use how much
was actually spent (including the imputed value of “free” resources) while, for the
later, your focus is in how much they should cost.
T ype of Data Available. Your ability to compute unit costs will be constrained by
how aggregate or disaggregate the available data are for both costs and utilization.
For example, in order to compute unit costs by service, you would need to have at
minimum utilization data by service (e.g., actual total beneficiaries for each service for
a particular budget year).
Step 2: Decide time horizons
One can analyze unit cost based on data for a single month, a quarter, or a year.The data
period chosen will depend first upon how the available data are organized. Sometimes
important data such as maintenance costs are only available on an annual basis, and to
do a quarterly analysis, one would have to make assumptions about use patterns within
the year. In such situations, it may make more sense to analyze data for a whole year
rather than for each quarter.
A second consideration in the choice of the data period is the purpose of the analysis.
If managers are trying to understand a rapid recent change in costs, then quarterly or
monthly analysis may be appropriate. However, if the aim is to compare a particular
programme’s costs to other programmes, it may make more sense to use a longer
time-period. Using annual data may help to “equalize seasonal variations” since each
programme is affected by these factors differently.
Step 3: Identify the activities in the programme
The next step for computing unit costs is to determine the centres of activity or programme
in the organization to which direct and/or indirect costs will be assigned. It is useful to
begin by listing all activities that relate to the implementation of your program and are
candidates for costing. For example, in a FP/RH programme you may want to identify the
unit cost of (1) sterilization, (2) condom distribution, and (3) safe abortion.
Step 4: Identify the costs for non-recurrent inputs (or, capital costs)
Capital assets are assets having an economic useful life exceeding one year and
3 Shadow price is the opportunity cost of an activity or project to a society, computed where the
actual price is not known or, if known, does not reflect the real sacrifice made. In a free market
economy, the market price reflects this real sacrifice and approximates the shadow price.
15

2.6 Page 16

▲back to top


16
not acquired primarily for resale. A cost analysis which ignores capital is essentially
assuming that the present physical assets will be available forever. In reality, assets
are being worn down by the programme’s daily activities, and this depreciation is an
expense. Unlike drug purchases or salaries, depreciation is not expenditure, it does not
require an actual cost outlay. However, depreciation may be hard to measure, if certain
information is not available (such as purchase price and the useful life of its equipment).
If this is the case, then determining the depreciation expense becomes more sensitive
to the analyst’s assumptions.
The technique we use to estimate capital costs is called “annualization.” Essentially,
we calculate the amount of the good that is used up (depreciated) in the period of time
corresponding to the cost study. Depreciation is only one part of the annual cost of a
capital good. The other part is an allowance that represents the interest that could have
been earned if the program had invested the funds used to purchase the item. This
component is usually referred to as the “opportunity cost of capital.”
Although this seems complicated, the mechanics of annualization are made relatively
simple by standard tables like the one presented at the end of this manual (see Annex).
To use the annualization table, we need the following information for each capital good:
Estimate of the replacement cost
Estimate of the useful life
Discount rate
Estimate of the replacement cost
To determine the replacement cost for a capital item you need to use the current value
(actual or projected). For example, to identify the replacement cost of a building at its
current site, you need to determine the cost of the land and the current construction
cost for a similar building. The original construction cost should not be used. Current
value can be established in one of several ways. If the item to be purchased is new,
the market price can be used. If the item is used, you can check the market prices of
comparable items or estimate the replacement cost of the item. For example, if a four
year-old jeep is to be used, you might check the prices of comparable vehicles or ask a
mechanic what it would cost to replace the vehicle with a similar one.
Estimate of the useful life
There are no clear-cut rules for estimating useful life.The period may be relatively short for
medical equipment, say two years, moderate for vehicles, say seven years, and much longer
for buildings, say 25-30 years.You should use the remaining life expectancy of used items,
not the life expectancy at the time of original purchase. Purchasing agents or government
accountants may be able to provide standard life expectancies for common items.
Discount rate
In addition, we need an estimate of the discount rate, which is the rate used for economic
appraisals of projects in the country where you are working. The discount rate should
reflect the rate of return on investments that the program could have made. An easier
alternative is to accept the World Bank standard rate of 3%.
Given these three pieces of information, you can compute the annualized value of the
capital item by applying the following formula:

2.7 Page 17

▲back to top


AV= RC ×
 
Where, AV= Annualized value
RC= Replacement Cost
r= rate of discount, and n = useful life
Suppose, the RC of an equipment is Rs. 10,300. Total useful life is 20 years and the
discount rate is 3%. Applying the above formula, the annualized cost would be
Rs. 692.30.
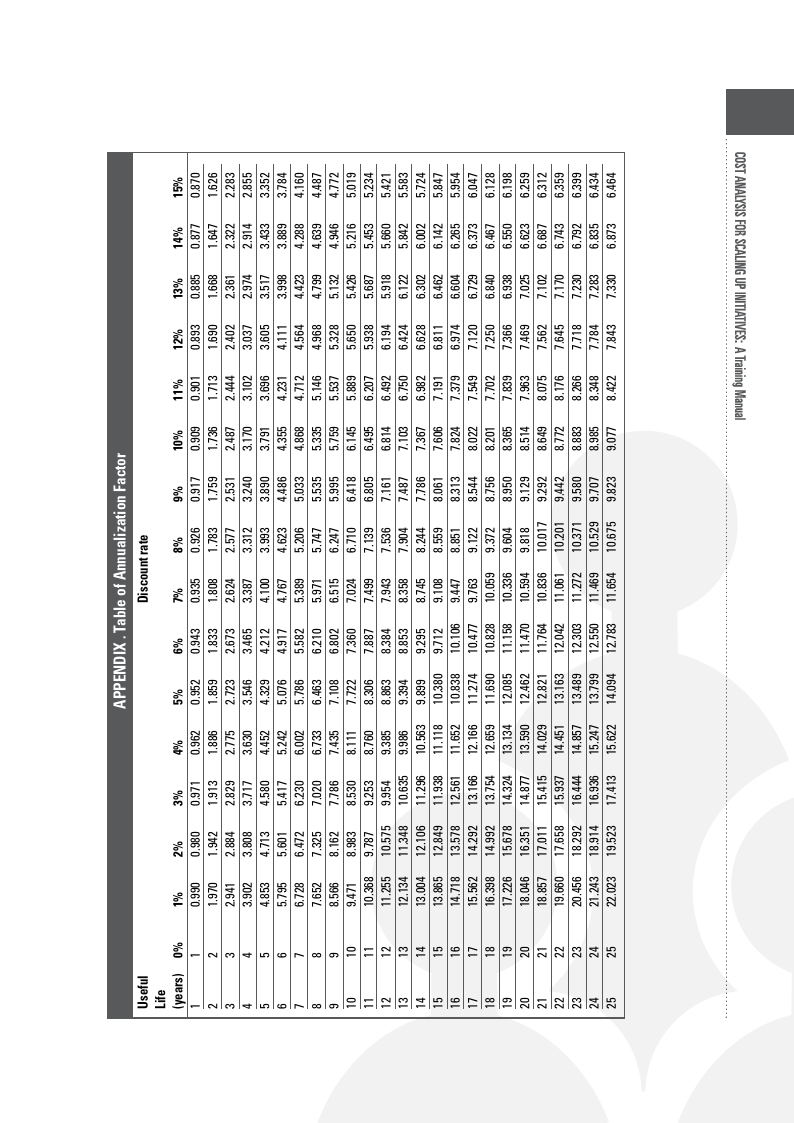
Fortunately, you can reach the same result without much effort if you use the
Annualization Table given in the Annex (see Box 1 and Table 3 on how to use
the table).
Box 1: Example of how to compute the annual capital cost
Table 3 provides data for this example of how to compute annual capital cost on the equipment. The
assumptions are as follows:
1. Total life of the asset: 20 years.
2. Replacement cost: to replace each asset at today’s prices would cost Rs. 10,000. The price of locally
produced items is increasing at 3% per year.
3. Discount rate: 3%
Using these assumptions, you can compute a reasonable measure of its annual capital cost using the
following formula:
Capital cost in year k = Replacement cost in year k/annualization factor
In Annex, we find the annualization factor for a 3% discount rate and a life of twenty years. The
annualization factor is 14.877.
The replacement cost next year will be Rs. 10,300/-, since 3% inflation will have occurred. Dividing by the
annualization factor, the capital cost for next year is therefore Rs. 692.30 (Rs. 10300/14.877). The following
year’s capital cost is similarly computed as Rs. 713 (=10,609/14.877). The capital cost therefore increases
from year to year at the rate of inflation. (Equivalently, capital cost computed in this way stays constant in
real terms).
So the capital cost this year is Rs. 692.30, and this becomes part of the programme’s costs .
Table 3. Worked example of annualized capital cost
Total useful life
Annualization factor
Replacement cost
Annual capital cost
Beginning of this year
20
-
10000.00
n.a.
End of this year
20
14.877
10300.00
692.30
End of next year
20
14.877
10609.00
713.10
17

2.8 Page 18

▲back to top


18
If the replacement cost of the item is less than Rs. 5,000 (or $100), do not annualize
the cost – it is not worth the trouble. Instead, treat the item as a recurrent cost. If the
programme has several of the same type of item, add their costs and annualize the total
cost of all the items. For example, assume that a recovery room in a sterilization unit
has eight beds, which each cost Rs. 40,000. Sum their costs (Rs. 3,20,000) and annualize
the cost in one step.
Step 5: Identify the costs for recurrent inputs
Salaries and benefits
Salaries and benefits usually represent the largest cost component of public health
programmes. They typically represent from one-third to three-quarters of the total
programme costs. Clearly, you will need to devote considerable time and effort to
identifying precisely all personnel-related costs. Every employee who is connected with
the programme in any way should be listed according to job function and location. The
list should include, in addition to physicians, nurses and other health workers, all clerical,
administrative and maintenance staff, plus any volunteers or consultants. Sometimes
staff from other divisions or organizations provide support to your programmes; these
individuals should be included as well.
The next step is to determine the cost to the employer of each employee’s compensation
for some unit of time (i.e., monthly or annually) including all fringe benefits such as
vacation and sick leave, social security, and pension. The computation of personnel
costs can be streamlined by aggregating similar types of employees into categories
and calculating their costs all at once.
Supplies
This category is for materials (drugs, consumables, stationeries, etc.) used up in a year,
as direct inputs to the principal activities performed by the programme. For example,
for a disease control of programme it could include such items as drugs, reagents
for tests, insecticides for vector control, needles, stationary, etc. For an immunization
programme, it would include vaccines, needles, and syringes, among other things.
Also, as mentioned earlier, any item costing less than Rs. 5,000 may be itemized in this
recurrent category even if it lasts more than a year.
In addition to the item cost, the full cost of supplies should also include the cost of
transport to the point of use. The cost should include all the materials used including
waste or damaged items. The cost, however, should not include the inventory stocks
(i.e., those kept in stores and not used).
Operation and Maintenance (O&M)
The capital inputs – building, vehicles, equipment – require regular maintenance and
costs on this account are grouped under recurrent costs. For building, O&M costs
include charges for utilities, insurance, cleaning materials, painting, repairing, and so
on. The standard practice of allocating a percentage of total budgets (say, 5%) may
understate the true annualized cost of the building. One must devise a rule to allocate
some portion of the total budget of the programme being studied. The simplest way
would be to assume that the building’s share of maintenance costs is proportional to its
age; the idea is then to weigh older buildings more heavily, assuming they need more
intensive maintenance.

2.9 Page 19

▲back to top


For vehicles, the costs of operating, maintaining, and repairing vehicles should all
be measured. These will include, materials, such as fuel, lubricants, insurance, tyre,
batteries, and spare parts. However, where repairs and maintenance are contracted out,
or where they are performed by a different agency, their costs should be included under
vehicle O&M costs.
Other recurrent costs
This is, of course, the residual category, which covers all recurrent inputs not dealt
with elsewhere. These may include O&M costs of equipment, postage, printing,
photocopying, etc.
Step 6: Cost allocation
Allocation process and criteria
We have already seen that the total cost of providing a service is equal to the sum of
shared and non-shared costs. Hence, to identify the unit cost of a particular programme
or service, it is essential to allocate the proportion of resource value in each category.
Allocating non-shared costs is straightforward. Since 100% of non-shared inputs are
devoted exclusively to the programme in reference, you just add the full cost of these
inputs. In some cases, it may be less than 100% but a known percentage; in that case
also, allocation follows the simple rule: add the known fraction of the resource costs. For
example, if in a programme, a doctor spends full time and another doctor spends half-
time by contract, 100% of the salary of the first and 50% of the second need to be added.
Shared costs – for which the share percentage is unidentified – are a bit complicated.
In this case you need a formula or allocation criteria to apportion and then allocate the
cost. This process is called cost allocation. The best way to start with this process is to
find some allocation statistic – or some proxy variable – for each shared input, which
would reflect the magnitude of resource use of that input. For example, if a vehicle is
used for multiple programmes the distance travelled by the vehicle for each programme
could be a proxy indicator or allocation statistic of vehicle use. In that case, what you
have to do is to compute the proportion of distance travelled for a programme in total
distance travelled and use this proportion to allocate the shared cost to the particular
programme. If, for example, a clinic is located in the room of a building which accounts
for approximately 10% of the total building space, and the annualized building cost is
Rs. 50,000, Rs. 5,000 (10% of 50,000) may be allocated to clinic under the building cost item.
The table below lists some of the popular allocation statistic for each type of resource.
Table 4. Cost allocation
Shared inputs
Vehicles
Equipment
Building space
Personnel
Supplies
Vehicle O&M
Building O&M
Allocation criteria
Distance travelled/time used
Time used
Space used
Time worked
Weight/volume
Distance travelled/time used
Space used
19

2.10 Page 20

▲back to top


20
It is, however, not always easy to derive the percentages in a straightforward way.
In that case, you may use other allocation statistics to measure another resource.
For example, if you cannot measure the proportion of vehicle costs that should be
allocated to the immunization programme, you can use the proportion of staff time
devoted to the programme as a way of allocating the value of shared vehicle costs.
If half the staff time during a particular period is devoted to immunization, it is reasonable
to assume that half the transport is, too.
Personnel time is, indeed, a commonly used indicator of allocating not only the
manpower but also the shared costs of other resources. The easiest way to measure
and apportion the time is to fill up a time sheet by asking each worker about the time
devoted to each activity. However, measuring by this way may not always yield the
desired result. For example, a programme coordinator may handle two programmes
simultaneously and the time devoted to one may be apparently indistinguishable from
the same spent on other. In that case, his/her response may be vague and arbitrary.
The alternative, which may yield more concrete and accurate data, is to directly observe
staff on a random sample of days recording how much time they spend on each activity
(a time motion study) in a day. However, this procedure may require substantial effort
and time, and may not be feasible.
An easier alternative, in such difficult cases, is to use some other proxy of time.
For example, number of visits for outreach programmes may be considered as a proxy of
time (more visits mean more time used). However, the problem in this case is that your
result depends heavily on assumptions that you make to compare visits for different
programmes. For example, if you run two programmes – immunizations and treatment
of children diarrhoea – comparing personnel time in terms of number of visits may not
be appropriate since the time taken for a visit for immunization may not be the same
for a visit for treatment. In that case, it is necessary to put some weight to one in terms
of the other to make comparison feasible (for example, a visit for treatment= two visits
for immunization).
Cost allocation template and application
Given the considerations described above, you can now proceed to estimate the allocated
cost of a programme or an activity. Below we demonstrate the process through a set of
templates and a simple example on a nutrition programme.
Example: Suppose a nutrition programme has the following components:
(1) prevention, (2) high-risk screening, (3) growth monitoring, and (4) rehabilitation.The
programme uses the following non-recurrent (capital) inputs:
Building space
Equipment
The recurrent inputs are:
Personnel
Supplies, and
Others
We wish to estimate the total cost for each component. It is known that some of the
inputs under each category are shared across the components. For demonstration we
estimate the cost of one component (prevention) here with a set of hypothetical data;

3 Pages 21-30

▲back to top


3.1 Page 21

▲back to top


the other components can be costed in a similar way.
The costing process could be done in three steps of estimation: Non-recurrent cost,
recurrent cost, and total cost. First we estimate the non-recurrent cost.
Non-recurrent cost
The cost for “prevention” is computed by using the following templates.The percentage
given in column (g) should be based on some appropriate allocation statistic
(e.g., space)
Table 5. Calculating non-recurrent costs
Building space
Cost items Unit Replacement Total
Annualization Annualized % allocated Allocated
(a)
(b) cost/unit
(d)
Factor (@3%) Cost
(based on Cost (Rs)
(c)
= (b) ×(c) (e)
(f)
allocation (h)
= (d) ÷ (e)
statistic) = (f) × (g)
(g)
Main
5000 Rs. 1,000
Rs. 5 million 14.877
3,36,090
10%
33,609
building sq.ft
(20 years)
Annex
building
1000 Rs. 1,000
Rs. 1 million 14.877
67,218
40%
sq. ft
26,887
60,496
Total
Equipment
Clinical
equip set 1
50,000
50,000
4.58 (5 years) 10,917
50%
5,459
Furniture 5 12,000
60,000
4.58
13,100
25%
3,275
Total 8,734
Total non- 69,230
recurrent
(annualized)
Total non-recurrent cost for a year works out to Rs. 69,230.
Recurrent cost
The recurrent costs for the component “prevention” are allocated using the following
template.
21

3.2 Page 22

▲back to top


22
Table 6. Calculating recurrent costs
Personnel
Cost items
Unit
Replacement Total
% allocated
(a)
(b)
cost/unit
(d)
(based on
(c)
= (b) ×(c)
allocation statistic)
(e)
Medical Officer
1
Rs. 50,000
Rs. 50,000 10%
Nutrition specialist 1
Rs. 30,000
Rs. 30,000 25%
Counsellor
4
Rs. 20,000
Rs. 80,000 100%
Office help
1
Rs. 10,000
Rs. 10,000 25%
Total
Supplies
Nutrition supplement 100 boxes 1,000
1,00,000
100%
Test reagents
1
12,000
12,000
100%
Other supplies
10,000
10,000
25%
Total
Others
Maintenance
1
50,000
50,000
10%
Total recurrent
Allocated
Cost (Rs)
(f)
= (d) × (e)
5,000
7,500
80,000
2,500
95,000
1,00,000
12,000
2,500
1,14,500
5,000
2,14,500
Total cost
Finally, the results from the above are summarized and total cost for the “prevention”
is computed.
Cost items
Recurrent
Non-recurrent
Total
Allocated cost (Rs)
2,14,500
69,230
2,83,730
Step 7: Calculating unit costs
At this point you know the total costs that were incurred at each of the programme
or programme components. What is the output of each component, in numbers?
This requires incorporating utilization data into the analysis. This is the point at which
any problems with the utilization data become particularly important, because they
directly alter the unit costs.
In the context of primary health programmes, the most important output would be
number of beneficiaries actually covered by the components. The possible problem is
that ‘benefits’ are not equally weighted across the components so that the number of
beneficiaries in one component may not be directly compared to the same in other.
For example, in the nutrition programme, the beneficiaries of the “prevention”
component are not qualitatively comparable to beneficiaries of “screening”. In that case,
you have to impute comparable weights to each component if you want to compare
their unit costs (e.g., 1 child covered under “prevention”= 2 covered under screening).
However, the problem does not arise if you compare the unit cost of one across different
periods or different service delivery centres.

3.3 Page 23

▲back to top


Once you have obtained the utilization data, the unit cost can be computed. For each
of the components, divide its fully allocated cost (from above) by its units of service.
Table 7 shows the calculated unit cost for one component (Prevention) based on the
estimated allocated cost.
Table 7. Unit cost calculation of nutrition programme
Component
Prevention Screening
Units
5,000
Cost
Non-shared Total
1,92,000 2,73,730
Cost Per Unit
Non-shared Total
38.40
54.70
Non Shared % of Total
70%
GM Rehabilitation
What is the significance of the unit cost estimated above? As you see, the unit non-
shared cost for prevention is Rs. 38.4, which is quite less than the true unit cost
(Rs. 54.7). Hence, if you use the former, which is more likely since this is the only
explicit and visible part of the cost, you will end up underestimating your resource use
or resource need. For a true representation, it is essential that you allocate and add the
shared costs to its non-shared counterpart.
EXERCISE
The following exercise is adapted from Creese (1994). The table below presents total
expenditure recorded for the last year for each of the inputs of a RCH programme.
Examine the list and answer the questions:
Table 8. Exercise on recorded expenditure
Input
Nurse (2)
Vaccine
Refrigerators
Bicycles
Jeep
Driver
Scales
Nurse assistant
Health centre (building)
Drugs
Syringes
Fuel
Expenditure (Rs.)
3,60,000
5,00,000
0
0
0
1,50,000
0
2,80,000
0
10,00,000
20,000
30,000
The programme has four components: (1) growth monitoring of 0-5 year olds;
(2) treatment of common child diseases (0-5 years); (3) immunization; and (4,5) pre and
post natal care.
In addition, the following information are also given:
1. Refrigerator has 10-years life time; current cost is Rs. 15,000
2. Bicycle has 10-years life time; current cost is Rs. 5,000
23

3.4 Page 24

▲back to top


3. Jeep has 8-years lifetime; current cost is Rs. 10,00,000
4. Scales have 25-years lifetime; current cost is Rs. 2,000
5. Health centre building has 25-years lifetime; current cost of construction
Rs. 20,00,000.
Also assume that:
The nurse and nurse assistant spend approximately equal time on all five
components.
T he volume of drugs is approximately three times that of vaccines, and one-third of
the drugs must be stored in the refrigerator. Half of the drugs are used for treatment
of common child diseases, and one quarter each for pre and post natal care.
The mobile child health clinic (which provides outreach services equally for all RCH
components except pre and post natal care) accounts for 10% of the time for which
the jeep and driver are used.
Questions:
1) W hich input costs are still difficult to allocate? What assumptions would you take
for each of them (regarding allocation statistic, cost values, etc.) to allocate costs,
in the absence of more information?
2) Calculate the total costs for each component and overall total cost after cost
allocation.
3) S uppose, for (1)-(3) components, 2000 children and for (4) and (5) 500 mothers
are being served by the programme. Calculate the unit costs for each component.
Interpret.
24

3.5 Page 25

▲back to top


25
Costing scaling up
operations
Introduction
Most service delivery interventions begin as pilot projects. When a pilot study of an
intervention is successful, managers begin to think about scaling up the project to new
areas. Cost is a critical factor influencing the extent and pace of this scale up process.
In order for managers and policy makers to plan for these changes, they need to analyze
the change in costs when interventions are ‘scaled up’ to cover greater percentages of
the population. They, for example, may be interested in the cost of extending health
interventions to the poorest people in their country, who often live in rural or remote
areas previously uncovered. Without a means of determining the costs of expanding
health interventions into such areas, they cannot assess the desirability or feasibility of
scaling up interventions.
One may, however, argue that information on the costs of a pilot project is adequate
to estimate the costs when this intervention is scaled up. Hence, why do we need to
address it separately? For example, the cost of providing ‘preventive’ nutrition services
for 5,000 children, as worked out in Section III, was Rs. 2,73,730. Hence, it is a simple
arithmetic that it would need about Rs. 2.73 million (2,73,730 × 10) if you plan to scale
up your coverage to 50,000 children.Therefore, you just need to estimate the pilot costs
and multiply it with scale multiplier (e.g., 10 times in the above example).
As we will see in the next part of this section, the above argument is unlikely to be
accurate in many cases. There are several factors which remain insignificant in a pilot
project but may emerge as crucial determinants when you try to scale it up. In that
case, you need to identify those factors and predict how they can affect the unit and
total costs of a scaling up process. Our purpose is not to provide a “cookbook” solution
for estimating scale up costs. Rather, it is designed to help managers think critically

3.6 Page 26

▲back to top


26
about the factors that must be considered in estimating the costs of scaling up an
effective intervention.
Economies and diseconomies of scale
Scale describes the extent or level of activity and output at which an intervention
is operating. The scale of a project can thus be measured in a number of ways: by
the coverage of activity (e.g. the proportion or percentage of people reached by an
intervention); by the volume of output of these activities (e.g. the total number of
condoms provided, total number of persons trained); or more simply by the level at
which the activities are undertaken (e.g. community, district or national).
Economies of scale or scale efficiency are said to be present if unit (or, average) costs
decrease as the level of output increases. Economies of scale may be present as a result
of indivisibilities in how the project is operated or specialization and the division of
labour that requires a large volume of output to be beneficial. For example, a minimum
level of fixed inputs is needed to run the Nutrition centre (e.g. the building), regardless
of whether one or 100 children are seen.The average cost of seeing one client is far more
than the average cost of seeing 100 people, as the fixed costs are spread over fewer
people (or outputs). The lowest cost per person reached is described as the minimum
average cost and is the point of scale-efficiency.
Conversely, if unit (or, average) costs rise as the scale of operations increases, the
situation (i.e., average cost increases when output is increased) is called Diseconomies
of Scale. This usually happens when the intervention has grown too far. Becoming
larger produces cost disadvantages.This may be because of problems such as increased
bureaucracy, poorer communications and worse labour coordination which are often
encountered in larger organizations.
There are several concerns to address before you plan for a scalable pilot intervention
– information on economies of scale (or, conversely diseconomies) is just one of them.
You may not find it technically or otherwise suitable to scale up an intervention even
if its unit cost is predicted to decline if you do so. However, scale efficiency becomes
extremely important when there are alternative interventions competing to scale up
with scarce resources.
Factors influencing scaling up cost
What are the factors that you should keep in mind (in addition to the costing of an
intervention as shown in Section III) when you estimate the resource need for a scaling
up initiative?There are four major factors that you need to focus and count as additional
costs when you plan for scaling up.
Geography and infrastructure
Many studies have demonstrated that, in general, unit cost of primary care interventions
in rural areas is higher than in urban areas4. The higher price of transport, supervision
and training due to greater distances travelled and difficult terrain in remote areas
4 Kumaranayake L, Kurowski C, Conteh L. 2001. Costs of scaling up priority health interventions in
low-income and selected middle income countries: methodology and estimates. WHO Commission
on Macroeconomics and Health, Working Group 5 Paper 18. Geneva: World Health Organization.

3.7 Page 27

▲back to top


27
is one reason costs are higher in rural areas, and these inputs cause diseconomies
of scale. Similarly, poor infrastructure such as, lack of roads, supply chain and other
basic infrastructure elements may hinder the ability to scale up, make communication
and training more difficult, or otherwise substantially increase prices in new areas
of coverage.
Following steps should be kept in mind to estimate unit costs in these cases:
Step 1: Group the intervention areas in order of their relative difficulties (say 3-4 groups).
For example, remote mountain areas, hilly areas, and plain areas.
Step 2: Estimate the cost in plain areas.
Step 3: Assign weights in ascending order of difficulties. For example, Plain= 1,
Hilly= 2, Mountain= 4. Justify the weights by some evidence.
Step 4: Adjust the unit cost of each group accordingly
Human resources
As such, lack of human resources constitutes one of the most binding constraints
to scaling up in the short run. The cost of recruiting, training and retaining skilled
personnel must be accounted for when considering the cost of scaling up. A programme
using an existing community health worker network might imply no human resource
constraint, but if this network does not pre-date the programme, setting it up would
incur additional costs. Expansion into remote areas may also entail offering incentives
to health personnel to locate to these areas and programmes. In that case, an additional
amount should be imputed to unit costs of personnel.
Specifically, the following points should be kept in mind when you estimate human
resource cost for scaling up.
Cost of recruiting and developing additional skilled staff
Cost of retention of staff especially at remote areas (special incentive)
Fixed costs
The traditional argument for decreasing unit costs involves spreading fixed costs
over more people as output increases. For example, as more patients utilize a heath
service unit, the cost per patient becomes lower. For reasons of equity or equal access,
health centres in rural areas are often located such that they cannot possibly serve the
equivalent number of people as urban or semi-urban health centres. The fixed costs of
rural health centres are, thus, spread over fewer people.
The bottom-line of the above argument is that the scale up may involve substantial
fixed cost at the initial level, but the unit cost should reduce consistently when the
costs are spread out among more and more users. Since the unit cost is usually higher
in rural and low-demand areas, a good strategy to help the unit cost reduce at a faster
rate would be to adopt alternative technologies, such as campaigns, outreach or mobile
facilities, to reach a remote population, although these technologies may still be more
expensive per patient than the average cost in urban areas. In addition, significant
streamlining in the administration of the programme may result in fixed costs dropping
to a manageable level (say to 10-15%).
Management and support system
The management of a programme and system support must be accounted for in the

3.8 Page 28

▲back to top


28
costing process. These concerns tend to be more important in the short run because
they represent problems in utilizing an existing infrastructure (physical or human
capital). During the process of scaling up, for example, there is an increased need for
communication among the various levels of personnel implementing the programme.
The pilot programmes are often guided by focused attention and tight management
which make them efficient and successful. It is also experienced that these interventions
are carefully insulated from the mainstream system faults and barriers. However,
the insulation weakens and the ‘external’ system occupies internal space when the
intervention is scaled up and gets too dispersed for the initial small management team.
In that case, it is not only important to link up and leverage the system resources, but
also necessary to organize a new network of decentralized management, information
systems and capacity building.
As an example, consider a Social Franchise programme in Family Planning run by an
NGO in a district.The programme requires establishing a franchise network with a small
number of private providers (for sterilization and other contraceptives). This, in turn,
would require intensive training of the franchisees, a smooth logistic management
(for supply of contraceptives, providers’ payment, etc), and demand generation
campaign among potential users. This may be well organized by a small team of
dedicated workers of the NGO without much support from the government. However,
it is a different game when the intervention is scaled up to the whole state. For an effective
result, it is extremely important to set up training hubs across the state, substantial
technical support, and an extensive monitoring and information system. In addition, a
huge set of infrastructure needs to be built up if the existing government infrastructure
is not leveraged. Conversely, there should be gains in the long run in terms of resource
savings through bulk purchase of contraceptives and economies of scope – that is,
implementing more than one programme with common resources (for example, the
franchise clinics may also be used for a parallel intervention on safe abortion). All these
have serious implications on costs – extrapolation of the NGO’s programme cost might
be an inaccurate estimate of the resource need.
In short, following key areas need to be addressed and costed to ensure an effective
management and support system:
New infrastructure for capacity building or leveraging existing infrastructures
Technical support team
Coordination team (Project management unit)
Demand generation through mass communication
MIS infrastructure
Logistic hubs (e.g., distribution centres, etc.)
Changes in the intervention
If some components of the pilot project prove more effective than others, decision-
makers may change the intervention to emphasize these components in the
scale up. Such changes likely will affect costs. For example, if in the example
of Social Franchising, the pilot project focused more on permanent methods
(e.g., sterilization) and less on semi-permanent contraceptives (e.g., IUD). However,
if the decision-makers now want to promote IUD insertion in scaling up process,
there will be significant implication on costs since IUD insertion costs much less
than sterilization.

3.9 Page 29

▲back to top


Summary
The general guidelines for costing scale up operations are summarized below.
Scale Factors Specific points of interest
Geography and
Higher cost of transport, training and
infrastructure
Supervision
Some topographies are more costly to
build in/maintain/travel in
Human resources Not enough trained and professional
people to implement scale up
Staff may need incentives/pay to locate in
rural areas
Fixed costs
Programmes with high fixed costs/
centralization will show declining unit costs
May need different technologies in rural and
low-demand areas (e.g., mobile health)
Management and
support system
Increased need for system support
Lack of management infrastructure
Need for expansion of technical support
Increased need for demand generation and
communication
Changes in the
The composition of components in the
intervention
pilot stage may change in the scale up stage
Selected key additional
areas in the costing process
“Difficulty” weights in the
estimation of unit cost
Additional cost for recruitment,
training of new staff
Retention incentives
Additional fixed costs
Costs of alternative technology
Additional costs for
New infrastructure for capacity
building or leveraging existing
infrastructures
Technical support team
Coordination team (Project
management unit)
Demand generation through
mass communication
MIS infrastructure
Logistic hubs (e.g., distribution
centres, etc.)
Change in the proportion of cost
components
EXERCISE
Consider the exercise given in the last section (Section III). Suppose the above programme
serves 2000 children and 500 mothers in an average block. Now, it is decided that the
programme will be scaled up to 50 blocks spreading over 5 districts in the state. Among
them, 30 are remote, and 20 are average. It is expected that approximately 1,50,000
children and 40,000 mothers will be covered through the programme.
1.T ake necessary assumptions to identify the scale up factors and input costs. Justify
your assumptions from your experience.
2. Calculate total costs for each component and overall total cost.
29

3.10 Page 30

▲back to top


How to do
a cost-effectiveness
analysis?
30
Introduction
Among the major uses of cost information, its application for measuring efficiency is
particularly noteworthy. However, efficiency is usually referred to in terms of immediate
output of a programme; for example, number of condoms distributed. In contrast,
effectiveness is usually related to the real benefits or outcome of a programme.
Thus, in the case of condom distribution, “number of condoms distributed” may be a
good indicator of efficiency, but it fails to provide a reliable idea about the effectiveness
of the programme. “Number of STD cases averted due to condom use” may be a better
indicator for measuring effectiveness, or impact, or, benefits. Note that effectiveness is
a measure of the extent to which programme objectives are achieved.
Cost-effectiveness analysis produces an estimate that takes into account the benefits
of an activity as well its costs, and weighs up the “pros” and “cons.” It is based on
cost numerator in relation to an effectiveness denominator to obtain cost effectiveness
measure, such as cost per life saved by a program. The ratio is expressed as:
 
One problem with the denominator is that the ‘effectiveness’ is measured in binary
terms, i.e., lives saved or not, or, cases averted or not.This may not reflect the whole of
‘effects’ of a programme since, in many cases an intervention may also benefit those who
suffer from a health condition but do not necessarily die. In other words, a programme
may not only avert deaths or cases but also help reduce the burden of morbidity of
those who are already affected (e.g., a diarrhoea control programme may reduce the
possibility of infection through strong preventive measures, and, at the same time,

4 Pages 31-40

▲back to top


4.1 Page 31

▲back to top


31
reduce the length of morbidity by treating the affected persons as well).
One way to include the morbidity effects is to convert the health outcomes (mortality
and morbidity) into a single utility index, such as Disability-Adjusted Life Years (DALY).
However, for simplicity’s sake, we will demonstrate the application of the simple CE
ratio as given above.
In brief, Cost-Effectiveness Analysis (CEA) is a technique to assist in decision making.
It helps in identifying the areas of a health program that are ineffective and thus helps in
designing a better program. It involves assessing the gains (effectiveness) and resource
inputs required (costs) of alternative ways of achieving a specified objective, usually
expressing the results in terms of cost per unit of effectiveness for each alternative
and then comparing the cost effectiveness of each alternative. The alternative with the
lowest cost per unit of effectiveness is called the most “cost-effective” and is generally
to be preferred on grounds of economic efficiency.
Below we discuss how this ratio can be estimated by following several steps.
Step 1: Define the objectives of the programme
First, the programme, on which the cost-effectiveness analysis will be done, needs to
be concretely defined in terms of its objectives. For example, one of the objectives of
a family programme is to avert unwanted births. Similarly, the objective of a sexual
health programme among sex workers is to reduce the incidence of STDs.
Step 2: Identify the alternative ways to achieve the objectives.
The next step is to identify all possible alternative ways (or, approaches) to achieve
the objective. For example, some possible alternatives for the above-mentioned
FP programme: (1) improving access to availability and accessibility of affordable
contraceptives, (2) improving reproductive health service delivery, (3) raising awareness
about the benefits of small families, and so on. Similarly, for the sexual health
programme, they might be: (1) distribute condoms among sex workers, (2) provide STD
treatment through satellite clinics, (3) promote safe sex practices through IEC activities,
and so on.
Step 3: Compute incremental costs for different approaches
Next, the total programme costs (recurrent and non-recurrent) for each alternative needs
to be worked out. However, this is just the gross cost and may not properly reflect the
true cost of the programme. To get a better result, subtract the clients’ potential cost
of treatment had there been no such programme. For example, if the FP programme
were not there, some couples would have sought contraceptives from private outlets
and spent some amount of money for that. With the programme, these costs would
probably be saved. The savings in cost thus needs to be subtracted to get the net cost
of the programme.
Step 4: Compute net “benefits” for the approaches
The effectiveness of each approach needs to be estimated through a common indicator
which should sufficiently reflect the impact of the approaches. For example, a good
indicator for the FP programme would be “numbers of unwanted births averted”.
Similarly, for the sexual health programme it could be the “number of STD cases
averted”. The problem is that programme data usually gives information on immediate

4.2 Page 32

▲back to top


32
outputs and does not give any direct information on estimation of the long run outcome.
One needs to collect additional information from experts and/or existing research
literature to predict the probable outcomes. For example, there are now well-tested
models available, such as MSI Impact or Spectrum (UNFPA) which can estimate the
numbers of birth averted from a given set of data on projected use of contraceptives.
Step 5: Calculate cost-effectiveness ratio for each alternative
The final step in this analysis is straightforward. The ratio of cost and effectiveness for
each approach needs to be calculated and compared. The result should be interpreted
as “cost per case averted/life saved/births averted”. The approach with the least cost per
case averted is the most cost-effective approach.
A Case Study and Exercise5
Problem
This exercise presents information on different approaches to a STD control program.
The required task is to identify and quantify the total costs of each and to calculate
the cases of STD averted as a result of each approach. Then this information must be
used to make a judgement about the cost effectiveness of each approach.The purpose
of the exercise is to highlight the important concept of units of outcome in ranking
proper worth.
General background
The area in and around Calcutta, the capital of West Bengal, attracts a large and diverse
population from all over the eastern region of the Indian sub-continent, including
countries like Nepal and Bangladesh.This is because of the abject poverty in this part of
the world and Calcutta being the only major centre for commerce in the region. Most of
these people are involved in manual labor in the dock/port, transport, etc. Most of them
leave their family behind and are highly mobile.
The socio-psychological nature of the emigrant population, coupled with their mobility,
makes this segment highly prone to SexuallyTransmitted Diseases (STD). With a highly
positive correlation between the prevalence of STD to the prevalence of HIV/AIDS,
a program for STD control becomes necessary. Also diagnosis and treatment of STD is
relatively easier than for AIDS, which makes STD control all the more essential.
Given the importance of STD control; in and around Calcutta, an NGO took up the
challenge of STD control (prevention) in the region, through counselling and condom
distribution. The project was targeted to males in the high risk population segment.
The NGO was assured assistance in this novel effort from the Department of Health and
some international funding agencies.
Now the NGO was faced with the task of identifying a particular approach for the STD
prevention program. There were a lot of different approaches available, but the NGO
concentrated on three/four distinct and widely acceptable approaches. Subsequently,
5 The following exercise is a modified version of a case presented in Economics for Health Sector
Analysis by Mead Over [Washington:The World Bank, 1991, pp. 145-154].The exercise, which is used
here as a demonstration of the tool, should not be viewed as a reflection of any particular reality.

4.3 Page 33

▲back to top


the decision makers in the NGO got on with the task of studying in details the cost and
outcome implications of each approach to select the best among them.
Study design
A study was undertaken to find the cost and outcomes with respect to each of the
alternatives. The alternatives identified were as under:
Approach 1: (Control case) No special inputs were provided in this case. Regular
health services provided by the government were allowed to continue without any
special focus on STD. This was to provide the basis for calculating the STD cases
prevented by other approaches.
Approach 2: Distribution of condoms through local level STD clinics, in collaboration
with government health centres at the local level. It also involved counselling the
clients by the doctors at the centre.
Approach 3: Distribution of condoms and counselling in the field by the health
workers of the NGO.
Approach 4: A sustained IEC (Information, Education, Communication) campaign
with the aim of educating the target segment in safe sex practices.
A specific number of males from the high risk population segment were covered
under each approach (as in Table 9 below). Outcome of the different approaches were
measured as the number of STD cases prevented. STD cases averted is a measure of
the difference between the number of STD cases that actually occurred and the number
of cases that could be expected without intervention. By multiplying the number of
persons covered in each approach other than the control case, by the STD specific
morbidity rate in the control case (0.0155 or 15.5 per thousand) and subtracting the total
number of STD cases observed in each approach from the product, the number of STD
cases averted is obtained (see Table 9 below).
Data (Cost and outcomes)
The study of various approaches were conducted in the months of October to December
1998 and the information compiled on project costs and number of STD cases averted
under various approaches are given in the tables below.
1. STD cases averted
Table 9: STD cases by each approach during the three months of observation
S.No.
Approach
Number of
1
2
males covered
3
1.
Approach 1
4400
2.
Approach 2
6018
3.
Approach 3
6875
4.
Approach 4
7023
STD specific morbidity
Number of Rate
cases
(per 1000)
4
5
68
15.5
91
53
51
Cases averted
(3 x 0.0155) - 4
6
2. Costs
Cost per packet of condoms (containing 5 condoms each): Rs 1.00
The number of packets used in each approach was:
33

4.4 Page 34

▲back to top


Approach 2:
Approach 3:
Approach 4:
844
23056
2280
3. Manpower (Salaries)
Table 10: Monthly Salary by Profession/No. of Persons Involved in Study by Approach
Profession
1
Nurses/Health Workers
Physicians
Project/Field Officers
Amount per
month (Rs.)
2
3000
10,000
10,000
Staff directly involved in the project
Approach 2 Approach 3 Approach 4
3
4
5
0
21
24
7
0
0
3
3
4
4. Transportation, Training and IEC
These include costs for transportation by health workers for home visits and also by
program officers for field supervision. Training costs included the orientation of staff
towards STD prevention, safe sex practices and the art of counselling. Cost of IEC
materials included cost towards posters, banners and related IEC materials. All these
costs pertain to the quarter in question (Oct-Dec 2010).
Table 11: Cost of Transportation/Training/Poster by Approach
(in Rs. ‘000 for the whole quarter)
Cost Items
Transportation
Training
IEC materials
Approach 2
197
2
0
Approach 3
205
15
17
Approach 4
214
17
39
EXERCISE
You have been appointed as Project Co-ordinator in the NGO. On the basis of the data
collected for the period of three months for the three different approaches to STD
prevention, you must make a decision on the best design of the project. The resources
are limited, so you will be interested in initiating a cost-effective program. This means
preventing as many STD cases as possible with the least expenditure of resources.
1. Decide which approach provides the most cost-effective method of STD prevention.
In order to make this decision:
a) Calculate total costs for approaches 2 to 4.
b) Calculate the cost per person covered for each approach.
c) Calculate the number of STD cases averted for each approach.
d) Finally calculate the cost per STD case averted for each approach.
e) Which approach is the most cost-effective?
When calculating costs please remember that the duration of the study was
three months.
34

4.5 Page 35

▲back to top


35

4.6 Page 36

▲back to top


Population Foundation of India
B-28, Qutab Institutional Area, Tara Crescent,
New Delhi- 110 016, INDIA
Telephone : + 91-11-43894100
Fax: +91-11-43894199
E-mail: info@populationfoundation.in
Website: www.populationfoundation.in