Infant and Child Mortality in India - State Level Estimates by Religion Caste Education and Occupations PFI

Infant and Child Mortality in India - State Level Estimates by Religion Caste Education and Occupations PFI


1 Pages 1-10

▲back to top


1.1 Page 1

▲back to top


|1

1.2 Page 2

▲back to top


1.3 Page 3

▲back to top


Infant and Child Mortality
in India
State Level Estimates by Religion, Caste,
Education, and Occupations
Preparation of the Estimates
Dr. S. Irudaya Rajan
Centre for Development Studies, Kerala
Dr. P. Mohanachandran Nair
University of Kerala
Preparation of the Report
Dr. Lalitendu Jagatdeb
Nihar Ranjan Mishra
Dr. Lopamudra Paul
Population Foundation of India, New Delhi

1.4 Page 4

▲back to top


© Population Foundation of India
April, 2010
Designed and Produced By FACET DESIGN
D-9, Defence Colony, New Delhi-24
Tel. 011-24616720

1.5 Page 5

▲back to top


Foreword
Differentials in the health status of individuals, in tandem with differentials in other basic
endowments, have a bearing on their pattern of access to and utilization of health care serv-
ices. It is the need of the hour to examine the attainment of these indicators and differences
among diverse groups in India.
Understanding the need for indirect estimates for Infant Mortality Rate (IMR) and Child
Mortality Rate (CMR) by religion, caste, education and occupation, Population Foundation
of India (PFI) has undertaken the current study jointly with Prof. S. Irudaya Rajan from the
Centre for Development Studies (CDS) to provide indirect estimates on vital rates of mortal-
ity (Infant and child mortality) by sex and place of residence, by religion, caste, education and
occupation for the States and UTs of India.
The estimates were based on the available information such as Children Ever Born (CEB)
and Children Surviving (CS) available from the Fertility Tables of 2001 Census. The state
level estimates for 29 states and 6 union territories were prepared by sex and place of
residence (rural and urban). Another important objective behind undertaking this study is to
provide comparable estimates between the 1991 and 2001 Censuses so that they will be
widely used by planners and policy makers.
We hope the report would be useful to the academia, researchers, policy makers and
programme managers involved with health, population and social development.
(A.R. Nanda)
Executive Director, PFI
|5

1.6 Page 6

▲back to top


Contents
Abbreviations
........ 07
List of Tables, Graphs and Maps
........ 08
List of Tables
List of Graphs
List of Maps
........ 08
........ 09
........ 09
Introduction
Rationale for the Study
Methodology and Limitations.
Findings
Infant and Child Mortality Rate by Religion
Infant and Child Mortality Rate among Scheduled Castes and Scheduled Tribes
Infant and Child Mortality Rate by Education
Infant and Child Mortality Rate by Occupation
References
........ 10
........ 11
........ 11
........ 13
........ 13
........ 14
........ 18
........ 19
........ 21
Appendix: Tables for the States and UTs depicting levels and differentials in IMR/CMR ........ 22
by education, caste, occupation and religion
6|

1.7 Page 7

▲back to top


Abbreviations
CDS :
CEB :
CMR :
CS
:
IMR :
MDGs :
MMR :
NCMP :
NFHS :
NHP :
NPP :
NRHM :
NSS :
OBC :
PFI
:
SCs :
SRS :
STs
:
TFR :
U5MR :
Centre for Development Studies
Children Ever Born
Child Mortality Rate
Children Surviving
Infant Mortality Rate
Millennium Development Goals
Maternal Mortality Ratio
National Common Minimum Programme
National Family Health Survey
National Health Policy
National Population Policy
National Rural Health Mission
National Sample Survey
Other Backward Classes
Population Foundation of India
Scheduled Castes
Sample Registration System
Scheduled Tribes
Total Fertility Rate
Under Five Mortality Rate
|7

1.8 Page 8

▲back to top


List of Tables, Graphs and Maps
Page
List of Tables:
Table-1 : Infant Mortality Rate (IMR) by Sex, Place of Residence and Religion for States and
22
UTs of India, 1991 and 2001.
Table-2 : Child Mortality Rate (CMR) by Sex, Place of Residence and Religion for States and
26
UTs of India, 1991 and 2001.
Table-3 : Infant Mortality Rate (IMR) by Sex, Place of Residence for Scheduled Castes for
30
States and UTs of India, 1991 and 2001.
Table-4 : Child Mortality Rate (CMR) by Sex, Place of Residence for Scheduled Castes for
31
States and UTs of India, 1991 and 2001.
Table-5 : Infant Mortality Rate (IMR) by Sex, Place of Residence for Scheduled Tribes for States
32
and UTs of India, 1991 and 2001.
Table-6 : Child Mortality Rate (CMR) by Sex, Place of Residence for Scheduled Tribes for States
33
and UTs of India, 1991 and 2001.
Table-7 : Infant Mortality Rate (IMR) by Sex, Place of Residence and Education for States and
34
UTs of India, 1991 and 2001.
Table-8 : Child Mortality Rate (CMR) by Sex, Place of Residence and Education for States and
47
UTs of India, 1991 and 2001.
Table-9 : Infant Mortality Rate (IMR) by Sex, Place of Residence and Occupation for States and
59
UTs of India, 1991 and 2001.
Table-10 : Child Mortality Rate (CMR) by Sex, Place of Residence and Occupation for States and
71
UTs of India, 1991 and 2001.
8|

1.9 Page 9

▲back to top


List of Graphs:
Graph-1 : IMR by Religion and Place of Residence, India, 2001
Graph-2 : CMR by Religion and Place of Residence, India, 2001
Graph-3 : IMR among SCs in States of India, 2001
Graph-4 : CMR among SCs in States of India, 2001
Graph-5 : IMR among STs in States of India, 2001
Graph-6 : CMR among STs in States of India, 2001
Graph-7 : IMR by Level of Education, India, 2001
Graph-8 : CMR by Level of Education, India, 2001
Graph-9 : IMR by Occupation, India, 2001
Graph-10 : CMR by Occupation, India, 2001
List of Maps:
Map-1 : Infant Mortality Rate for Scheduled Castes, India, 2001
Map-2 : Infant Mortality Rate for Scheduled Tribes, India, 2001
Map-3 : Infant Mortality Rate for Marginal Workers, India, 2001
Page
13
14
15
16
17
18
19
19
20
21
15
17
20
|9

1.10 Page 10

▲back to top


Introduction
The past few decades have witnessed increasing concerns in developing countries including India on the
poor state of health and development of children. To underscore the need to position child survival at the
heart of the international agenda, reducing child mortality has been focused as one of the eight Millennium
Development Goals (MDGs).
Reduction in Infant Mortality Rate (IMR) is one of the goals of National Rural Health Mission (2005-2012).
The National Population Policy, 2000 also aims at reducing Infant Mortality Rate to below 30 per 1000 live
births by the year 2010 (NPP, 2000).
The NRHM, 2005 is implemented throughout the country with special focus on 18 States with weak public
health indicators and/or weak infrastructure; to improve the availability of and access to quality health care
in general and to reproductive and child health care in particular and to build synergy between health and
determinants of good health like nutrition, sanitation, hygiene and safe drinking water. Accordingly, targets
have been set to reduce the Maternal Mortality Ratio (MMR) to 100 per100, 000 live births by 2012; the Total
Fertility Rate (TFR) to 2.1 by 2012; and the Infant Mortality Rate (IMR) to 30 per 1000 live births by 2012.
In 1999, while the total under-five child deaths in the less developed countries amounted to about 10
million, India alone accounted for about one-fifth of the under-five deaths (2.1 million), the highest number
within a single country (Cleasson M., E. Bos, and I. Pathmanathan, 1999).
The Constitution of India guarantees social, economic and political provisions for protection and promo-
tion of interest of the SCs/STs, and the Minorities. In order to bring them at par with the rest of society, the
approach of social justice is being adopted to ensure equal rights, access to public services and resources
to enable them to develop their potential and capacities as agents of social change, through the process of
planned development (S. Venkatesan, 2009).
The Hindus are the largest religious groups followed by the Muslims, Christians and others including Sikhs,
Buddhists and Jains, which are described as minorities. The Hindu religion has further been divided into differ-
ent caste groups broadly termed as Scheduled Castes (SCs), the Scheduled Tribes (STs), the Other Backward
Classes (OBCs) and others. According to the 2001 Census, the Hindus constitute about 80.5 percent and within
it, the SCs representing 16.2 percent, the STs account for 8.2 percent of the country’s total population. In the
absence of specific Census data, it is not possible to give the exact figure for the OBCs, but NFHS and National
Sample Survey (NSS) estimates depict it roughly as 32-37 percent. The religious minorities, who constitute 19.5
percent, represent Muslims (13.4 percent), Christians (2.3 percent), Sikhs (1.8 percent), Buddhist (0.8 percent),
Jains (0.4 percent) and others (0.7 percent).
10 |

2 Pages 11-20

▲back to top


2.1 Page 11

▲back to top


The discussion here focuses on equity perspective of the present health status and patterns of health
care access and utilization by different social groups viz. SCs & STs and the religious minorities both in abso-
lute and relative terms. The National Family Health Survey (NFHS-III, 2005-06) provides recent information
on aspects of health status, access to health care, and utilization of health service by different sections of
population in India.
Generally, in the assessment of health conditions of population, it is often restricted to a few measurable
aspects, such as mortality, morbidity, and nutritional status. Other things being equal, a better health status
enhances the capabilities and productive skills of individuals.
Mortality is an important indicator and reflects country’s level of socio-economic development and quality
of life of population. The NFHS gives major three mortality rate related to children namely, Infant Mortality
Rate (IMR), Child Mortality Rate (CMR) and Under-five Mortality Rate (U-5MR). Infant Mortality Rate is the
proportion of newborn dying before completion of the first year of age. According to the NFHS-III, the Infant
Mortality Rate for Hindus (63 per 1000 live births) is much higher than Christians (54.8 per 1000 live births)
and Muslims (60.4 per 1000 live births), but close to the average for India (57 per 1000 live births) as a whole.
Similarly, Under-five Mortality Rates are again higher for the Hindus (82.5 per 1000 live births) followed
by Muslims (82.2 per 1000 live births) and Christians (67.0 per 1000 live births). About 20.9 per thousand
children born in Hindu community have probability of dying between 1 and 5 years of age. This is 23.1 per
thousand for Muslims and 12.9 per thousand for Christians.
Rationale for the Study:
One of the objectives of undertaking this study was to provide comparable estimates of Infant Mortality
Rate (IMR) and Child Mortality Rate (CMR) between the 1991 and 2001 Censuses so that they would be
widely used among planners and policy makers. Sample Registration System (SRS) does not provide esti-
mates on vital rates of mortality such as IMR and CMR by religion, caste, education and occupation. Although
National Family Health Survey (NFHS) provides estimates on vital rates of mortality such as IMR and CMR
by religion, caste, education only, these estimates are from sample surveys and hence have limitations. Un-
derstanding the need for indirect estimates for IMR and CMR by religion, caste, education and occupation,
Population Foundation of India (PFI) undertook the current study to provide estimates on these vital rates of
mortality (Infant and child mortality) by sex and place of residence for the states and UTs of India.
Methodology and Limitations:
Pathak, Ram and Singh (1988) suggested a method to estimate infant and child mortality from the data on
children ever born and children surviving by the age of the mother. A modified version of the Pathak methodol-
ogy has been used by Irudaya Rajan for providing the present estimates. The 2001 Census-based estimates
have been compared with the estimates based on the 1991 Census published in the Economic and Political
Weekly (Rajan and Nair, 1998).
The basic advantage of this procedure, however, lies in dispensing with the multipliers used by Brass (1975)
and others.
The probability of survival of children is estimated as: S(Xi) = CSi / CEBi …………(1)
where, i = 1,2,……….7 corresponds to age groups 15-19, 20-24, 25-29,………and Xi be the average
age of children ever born to the women of the i-th age group.
| 11

2.2 Page 12

▲back to top


The average age of the children is estimated using the following procedure:
If f(x) be the age specific fertility rates for the women in the age group x to x+5, the mean child bearing
age for women aged y (x<y <x+5) is given by:
y
v(x) * f(x) dx
_
x=15
my = _________________
y
f(x) dx
x=15
where, v(x)= x+2.5 and x = 15, 20,………,45.
Average age of the children born to mothers in the age group i is then given by:
_
_
Xi = w(i)- m(y,y+5), i= 2,3,...,5,
where,
_
__
m(y,y+5) = my + my+5 , y = 20,25,…45, .................................( 2)
and w(i) is the mid value of the i-th interval.
The estimated Xi need not be an integer value. But once we know S(x) and xi, one can interpolate S(x) for
any integer value of x using simple regression.
It may however be mentioned that estimated value largely depends on the number of children reported to
have been born to the mother of any age. While reporting of the number of surviving children may not suffer
from any kind of error, children ever born data suffer from an under-reporting bias. This is why the survivor-
ship probabilities so projected are overestimated and the child mortality is underestimated. This lacuna is also
present in the Brass type estimations.
Brass (1975) found that the relation between the proportion of children dead, D(i) and a life table mortality
measure, q(x) is primarily influenced by the age pattern of fertility, because it is this pattern that determines the
distribution of the children of a group of women by length of exposure to the risk of dying. Irudaya Rajan and
his team have developed a multiplier to convert the estimated S(x) into estimates of q(x), the multiplier being
selected according to the values of the average ratios of the weighted parities of mothers at younger ages (less
than 35 years of age). The weights are 1, 7, 7, 6, 4, and 1, which were given by United Nations based on the
age pattern of fertility.
Hence q(x) = K {1-S (xi)}, where x= 1, 2, 3, and 5
The following information from the 2001 Census has been utilized in the present study.
12 |

2.3 Page 13

▲back to top


(i ) The number of children ever born (CEB) classified by sex and five year age of mothers from 15-49.
(ii) The number of children surviving (CS) classified by sex and five year age of mothers from 15-49.
(iii) The total number of women, irrespective of whether they are mothers or not classified by five year
age groups.
For 84 per cent of the districts, the values observed in 2001 were lower than that in the 1991 Census. For
the remaining 16 per cent of districts, smoothing techniques have been applied to arrive at lower values in
2001 as against the observed values based on the methodology.
Findings:
Infant and Child Mortality Rate by Religion:
Infant Mortality Rate (IMR):
Table-1 (Appendix), provides the Infant Mortality Rate by religion, sex and place of residence for the states
and UTs. There is rural-urban differential and differential by sex among the states and UTs with respect to
religion. After looking into the estimates derived from 1991 and 2001 Census, it is observed that, IMR has
been reduced across sex and place of residence in between 1991 and 2001.Among the religious communities,
for India, IMR is found to be the highest among Hindus as compared to other communities such as Muslims,
Christians, Sikhs, Buddhists and Jains. Among the religious communities, there exists differential with respect
to sex and place of residence. The rural IMR is slightly higher than the urban IMR. Similarly, the IMR in case of
male is slightly higher than the females. Among the Hindus, Madhya Pradesh (95) is having the highest IMR
and Kerala (18) is having the lowest IMR. Among the Muslims, Assam (78) is having the highest IMR and Kerala
(14) is having the lowest IMR. Among the Christians, Orissa (97) is having the highest IMR and Kerala (17) is
having the lowest IMR.
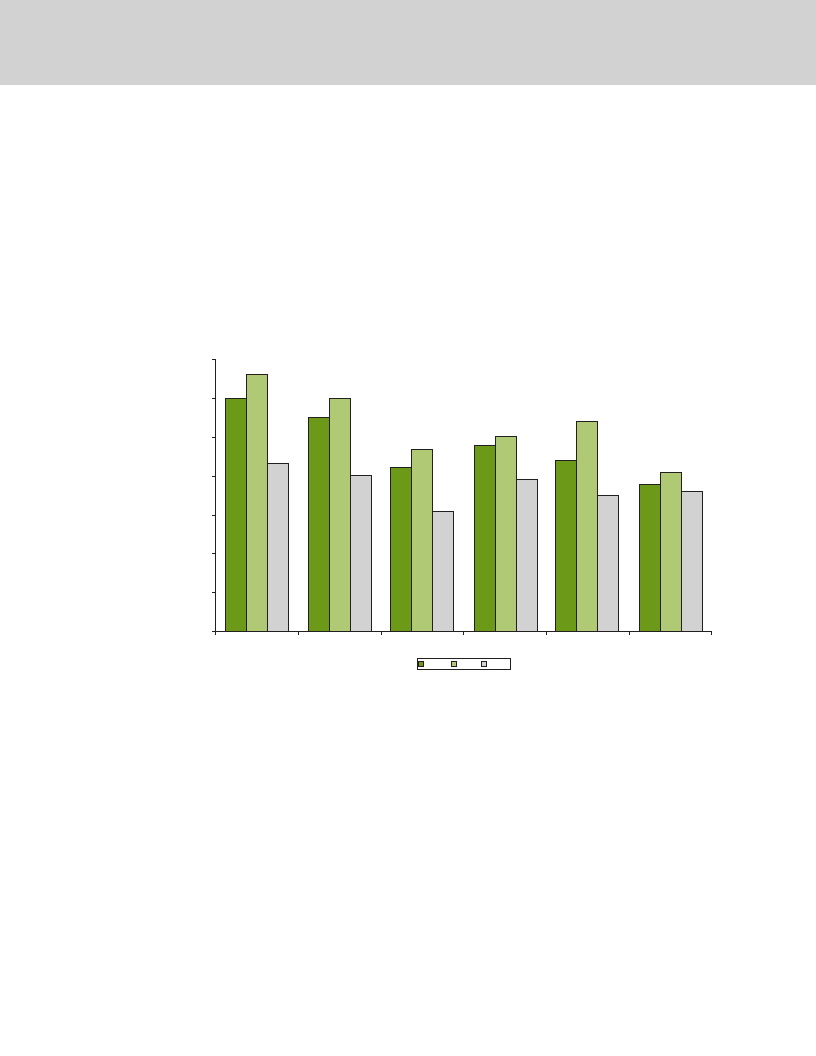
Graph-1: IMR by Religion and Place of Residence, India, 2001
70
60
58
54
50
40
40
30
20
10
0
Hindu
56
50
38
Muslim
44
39
31
48
45
36
Christian
Total
Sikh
Rural Urban
45
40
31
Buddhist
38
35
33
Jain
| 13

2.4 Page 14

▲back to top


Child Mortality Rate (CMR):
Table-2 (Appendix): provides the Child Mortality Rate by religion, sex and place of residence for the states
and UTs. Like IMR, in case of CMR there is also rural-urban differential and sex differential among states and
UTs with respect to religious communities. Child mortality rate has been reduced across sex and place of
residence in between 1991 and 2001. For India, CMR is found to be the highest for Hindus vis-à-vis other
religious communities. The rural CMR is higher than the urban CMR. Among Hindus, Madhya Pradesh (103) is
having the highest CMR and Kerala (20) is having the lowest CMR. Among the Muslims, Assam (86) is having
the highest CMR and Kerala (19) is having the lowest CMR. Among the Christians, Orissa (101) is having the
highest CMR and Kerala (18) is having the lowest CMR.
Graph-2: Child Mortality Rate by Religion and Place of Residence, India, 2001
70
66
60
60
50
43
40
30
60
55
40
47
42
31
50
48
39
54
44
35
41
38
36
20
10
0
Hindu
Muslim
Christian
Sikh
Buddhist
Jain
Total Rural Urban
Infant Mortality Rate (IMR) and Child Mortality Rate (CMR)
among Scheduled Castes and Scheduled Tribes;
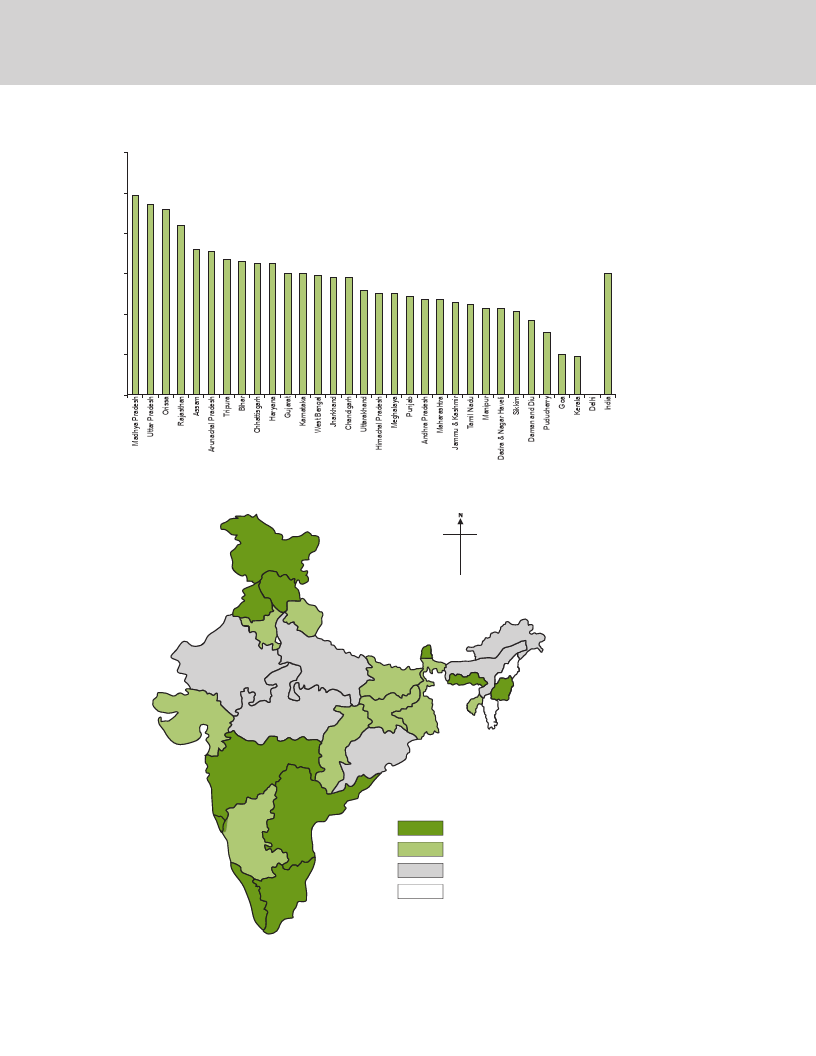
Table-3 (Appendix), provides infant Mortality rate for Scheduled Castes, by sex and place of residence for
the states and UTs of India. The estimates of IMR for Scheduled Castes by sex and place of residence show
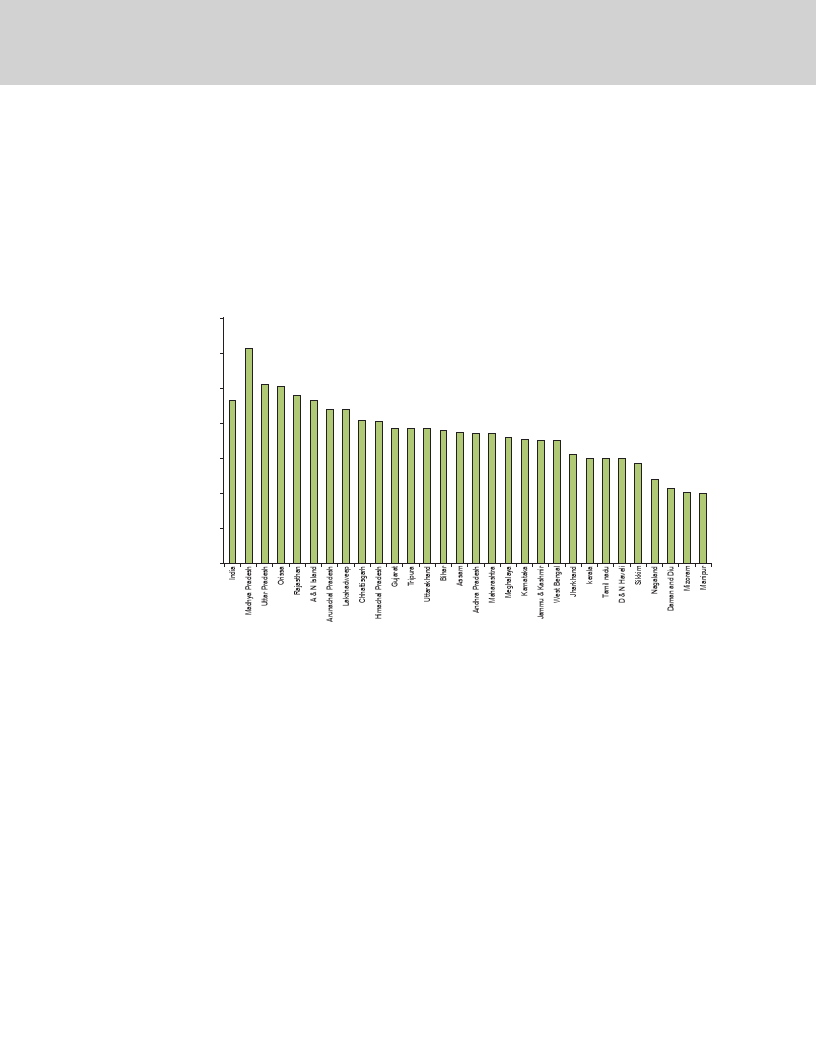
that among the States, Madhya Pradesh (99) is having the highest infant mortality rate followed by Uttar
Pradesh (94), Orissa (92) and Rajasthan (84). The national average is found to be 60.The states like Madhya
Pradesh, Uttar Pradesh, Orissa, Rajasthan, Assam, Arunachal Pradesh, Tripura, Bihar, Chhattisgarh and Haryana
are having infant mortality rate for Scheduled Castes more than the national average. There is a consistent
decline in infant mortality rate for the SCs across the states and UTs by sex and place of residence in between
1991 and 2001. There is rural urban and sex differential, with respect to infant mortality rate among the
Scheduled Castes.
Graph-3: IMR among Scheduled Castes in States of India, 2001
14 |

2.5 Page 15

▲back to top


Map-1: Infant Mortality Rate for Scheduled Castes, India, 2001
120
100
99
94 92
84
80
72 71
67 66 65 65
60
40
60 60 59 58 58
20 19
20
0
52 50 50 49 47 47 46 45 43 43 41
Table-4 (Appendix), gives the Child Mortality Rate for Scheduled Castes by sex and place of residence for
Map not to scale
Infant Mortality Rate
50 & below
51-70
71 & above
Not Available
37
31
60
| 15

2.6 Page 16

▲back to top


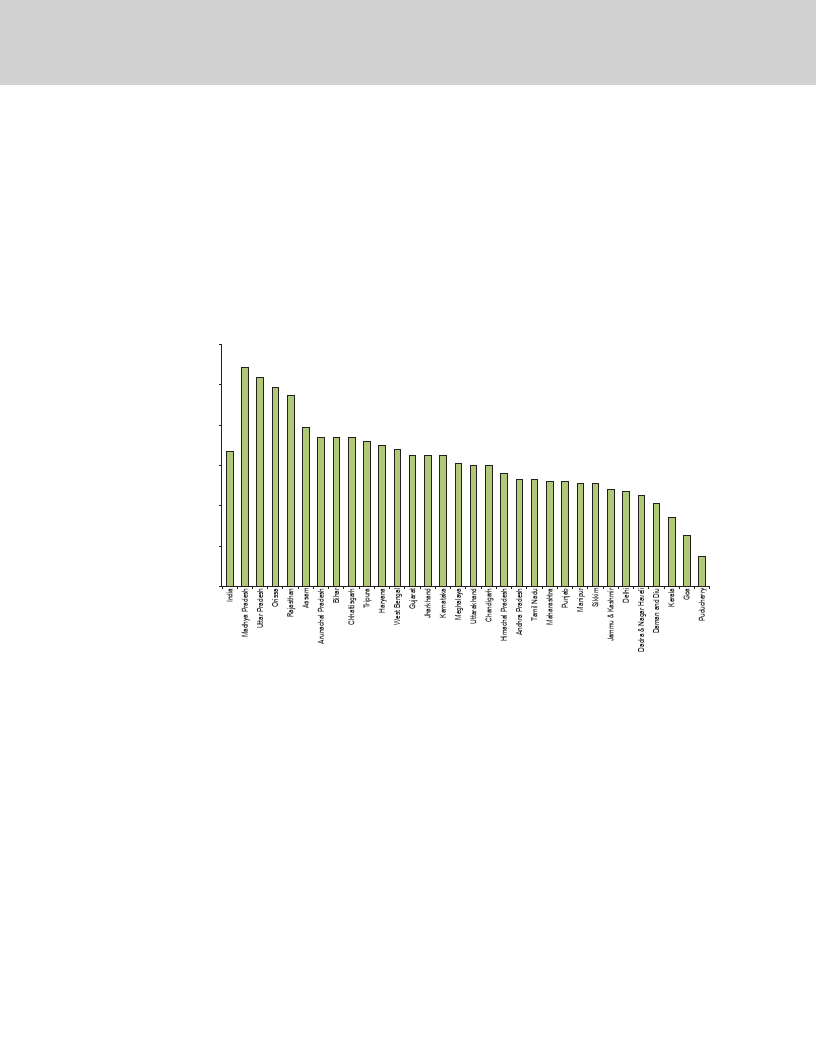
the states and UTs. The estimates of CMR for Scheduled Castes shows that Madhya Pradesh (109) is hav-
ing the highest child mortality followed by Uttar Pradesh (104), Orissa (99), Rajasthan (95), Assam (79) and
Arunachal Pradesh (74).Among the states, Goa (25) is having the lowest CMR for the Scheduled Castes. The
states like, Madhya Pradesh (109), Uttar Pradesh (104), Orissa (99), Rajasthan (95), Assam (79) and Arunachal
Pradesh (74), Bihar (74), Chhattisgarh (74), Tripura (72), Haryana (70) and West Bengal (68) is having the child
mortality for Scheduled Castes more than the national average (67). There is a consistent decline in CMR for
the states during the period 1991-2001.There is also gender differential with respect to child mortality rate
among the States.
Graph-4: CMR among Scheduled Castes in States of India, 2001
120
109
104
100
99
95
80
67
60
40
20
79
74 74 74 72 70 68
65 65 65
61 60 60
56
53 53 52 52 51 51
48 47 45
41
34
25
15
0
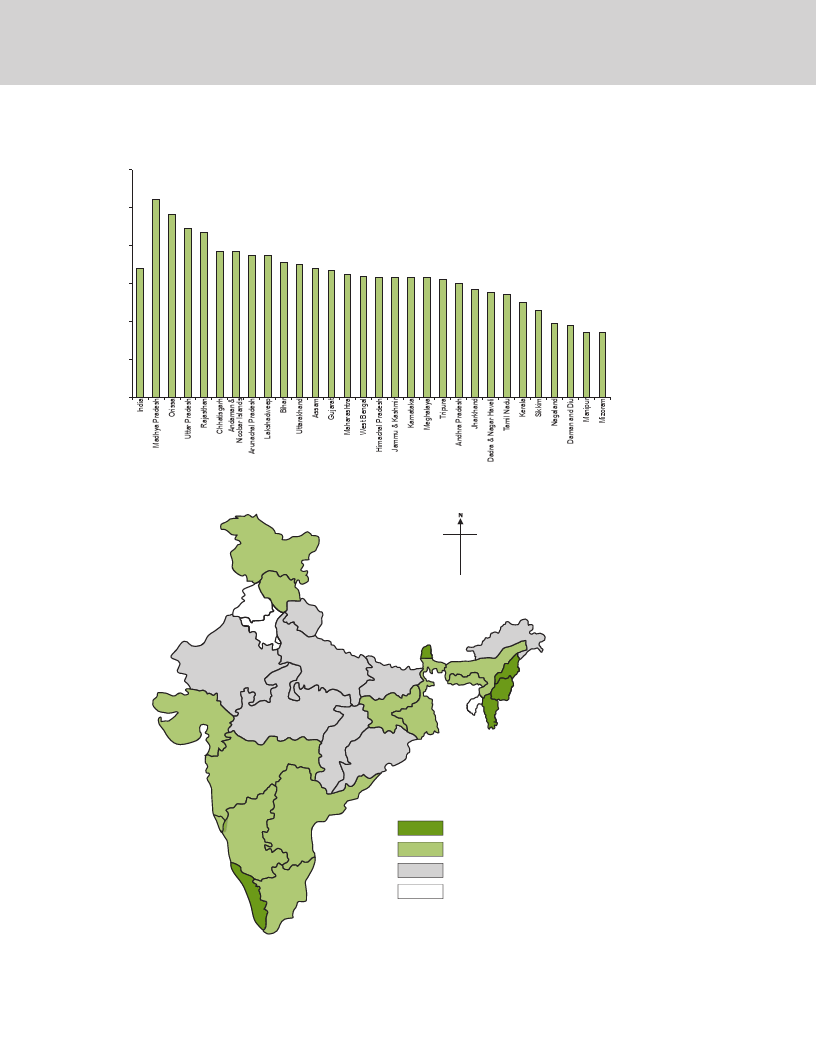
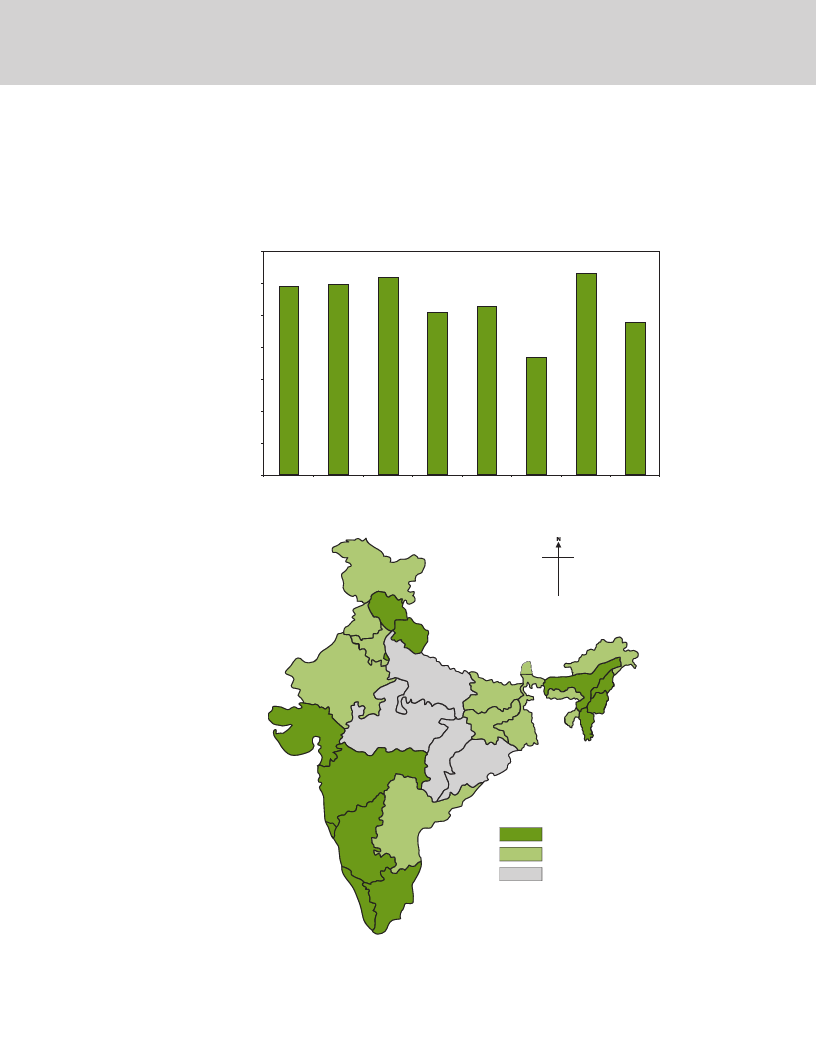
Table-5 (Appendix) gives the Infant Mortality Rate for Scheduled Tribes by sex and place of residence.
Madhya Pradesh (104) is having the highest Infant Mortality Rate followed by Orissa (96), Uttar Pradesh
(89), Rajasthan (87) and Chhattisgarh (77). Mizoram (34) is having the lowest Infant Mortality Rate (IMR) for
Scheduled Tribes among all the States and UTs. States like Madhya Pradesh, Orissa, Uttar Pradesh, Rajasthan,
Chhattisgarh, Arunachal Pradesh, Bihar and Uttarakhand are having Infant Mortality Rate for Scheduled Tribes
above the national average. The IMR for Scheduled Tribes declined consistently during the period 1991-2001.
There is sex differential and rural-urban differential with respect to IMR among Scheduled Tribes across the
states of the country.
16 |

2.7 Page 17

▲back to top


Graph-5: IMR among Scheduled Tribes, in States of India, 2001
120
100
80
68
60
40
20
0
104
96
89 87
77 77 75 75
71 70 68 67 65 64 63 63 63 63 62 60
57 55 54
50
46
39 38
34 34
Map-2: Infant Mortality Rate for Scheduled Tribes, India, 2001
Map not to scale
Infant Mortality Rate
50 & below
51-70
71 & above
Not Available
| 17

2.8 Page 18

▲back to top


Table-6 (Appendix): provides the Child Mortality Rate (CMR) for the Scheduled Tribes across the states and
UTs by sex and place of residence. Madhya Pradesh (123) is having the highest CMR followed by Uttar Pradesh
(102), Orissa (101), Rajasthan (96) and Arunachal Pradesh (88). Manipur (40) is having the lowest Child
Mortality Rate. States like Madhya Pradesh, Uttar Pradesh, Orissa, Rajasthan are having the Child Mortality
Rate for Scheduled Tribes above the national average of 93.Child Mortality Rate for Scheduled Tribes declined
consistently during the period 1991-2001.There is also differential by sex and place of residence with respect
to Child Mortality Rate among the Scheduled Tribes.
Graph-6: CMR among Scheduled Tribes in States of India, 2001
140
123
120
100 93
80
102 101
96
93
88 88
82 81
77 77 77 76 75 74 74
60
40
71 70 70
62 60 60 60 57
48
43 41 40
20
0
Infant and Child Mortality Rate by Education:
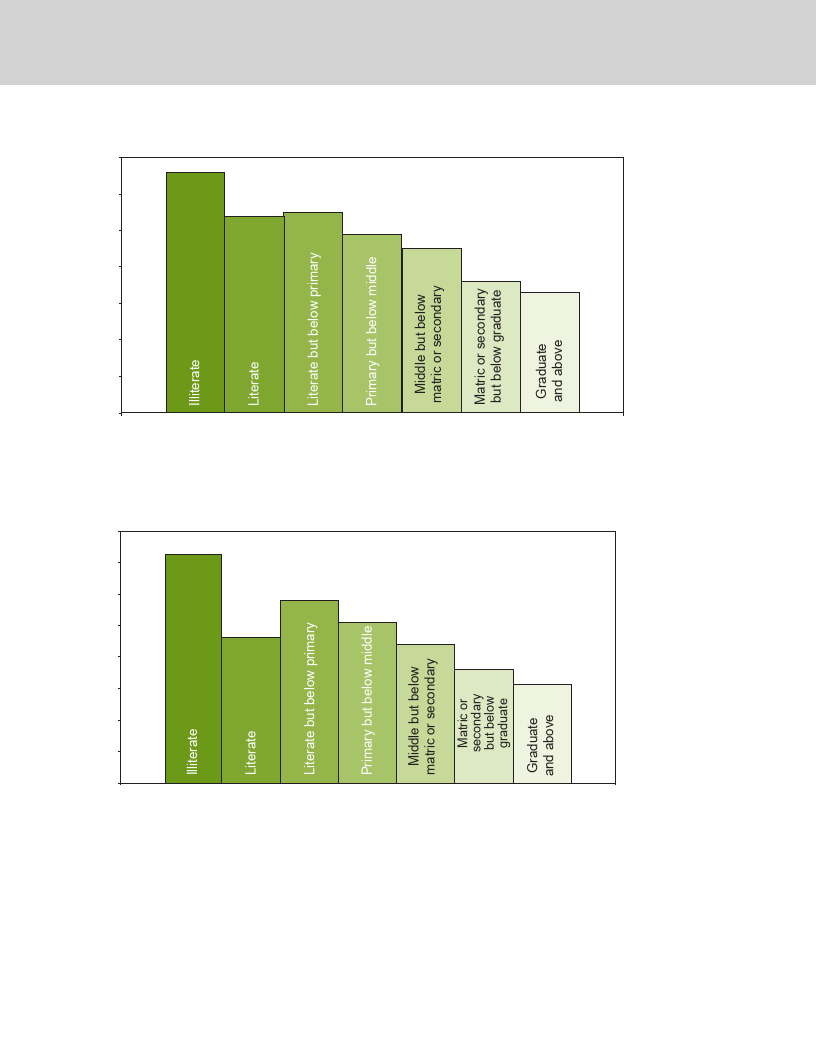
Table-7 (Appendix), provides the Infant Mortality Rate (IMR) by level of education, sex and place of resi-
dence. For all the States and the country as a whole IMR is consistently coming down as the level of education
goes up. The IMR is more for illiterate categories as compared to literates. There is rural-urban differential
across all the levels of education. The rural IMR is slightly more than the urban IMR. There is a consistent
decline in IMR for all the educational levels across all the states and UTs in between 1991-2001. The similar
trend is also observed in case of Child Mortality Rate (Table-8).
18 |

2.9 Page 19

▲back to top


Graph-7: IMR by Level of Education, India, 2001
70
66
60
54
55
50
49
45
40
36
33
30
20
10
0
Graph-8: CMR by Level of Education, India, 2001
80
73
70
60
58
51
50
46
44
40
36
31
30
20
10
0
Infant and Child Mortality Rate by Occupation:
Table-9 (Appendix) provides IMR by occupation and place of residence for the States and UTs of the
country. The IMR is provided by Total Main Workers, Marginal Workers and Non-Workers. The main workers
are classified into three categories: cultivators, agricultural labourers and other main workers (manual/ non-
manual).There is difference in IMR by sex and place of residence. IMR is found to be high (63) among marginal
| 19

2.10 Page 20

▲back to top


workers as compared to main workers (59). Amongst the marginal workers, the major contribution is from
agricultural labourers (62).There is also differential by sex and place of residence. The IMR has declined in all
categories during 1991-2001 and drastically, for non-workers (IMR is found to be 48), which needs further
exploration in terms of other available socio-economic indicators.
Graph-9: IMR by Occupation, India, 2001
70
62
60
59
60
53
51
50
63
48
40
37
30
20
10
0
Total Main Cultivators Agricultural Other Main
Workers
labourers Workers
Manual
Non-Manual
Marginal
Workers
Map-3: Infant Mortality Rate for Marginal Workers, India, 2001.
Non-
Workers
20 |
Map not to scale
Infant Mortality Rate
50 & below
51-70
71 & above

3 Pages 21-30

▲back to top


3.1 Page 21

▲back to top


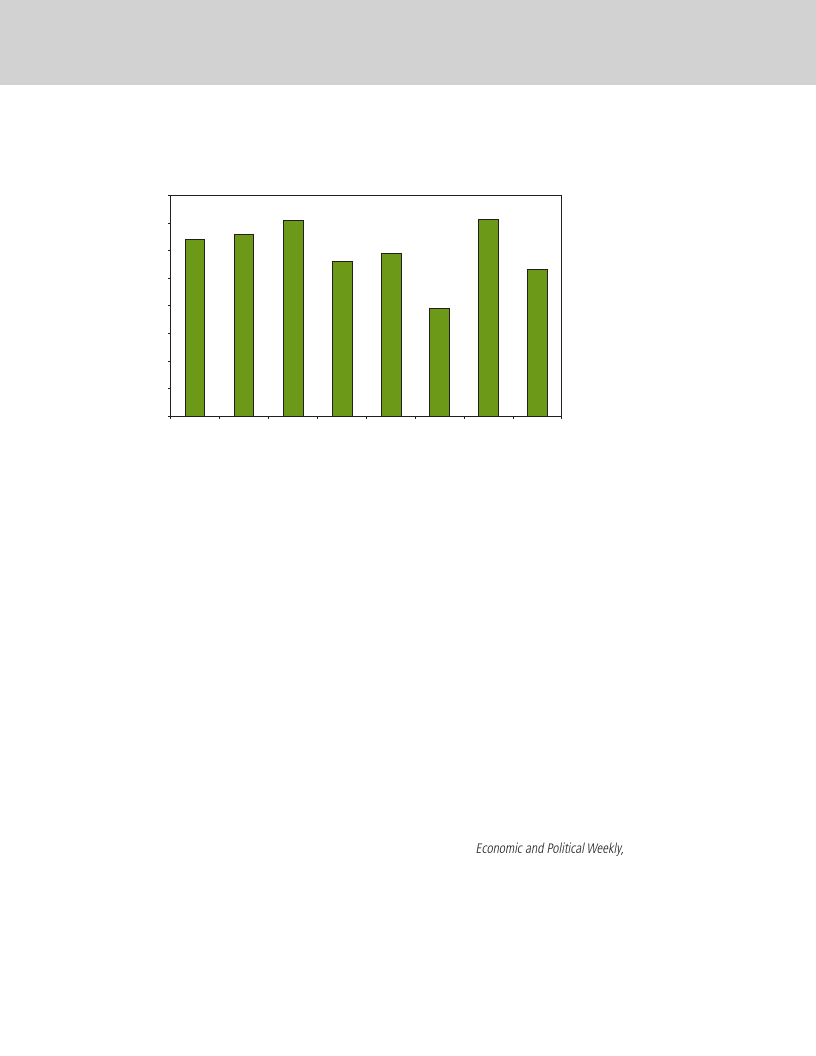
Table-10 (Appendix) provides CMR by occupation and place of residence for the States and UTs. There is
difference in IMR by sex and place of residence.
Graph-10: CMR by Occupation, India, 2001
80
71
70
64
66
60
50
59
56
71
53
40
39
30
20
10
0
Total Main
Workers
Cultivators Agricultural Other Main
labourers Workers
Manual Non-Manual Marginal
Workers
Non-
Workers
Like IMR, CMR is also found to be high (71) for marginal workers as compared to main workers (64). The
main contribution to the CMR for marginal workers is from the category of agricultural labourers (71) followed
by cultivators (66). It can be seen that there is also rural urban and sex differential. There is also a decline in
CMR during 1991-2001.
References:
Brass, W. 1975. Methods for Estimating Fertility and Mortality from Limited and Defective Data. Occasional
Publication. Chapel Hill N. C: Laboratories for Population Studies.
Claeson M., E. Bos, and I .Pathmanathan. 1999. Reducing Child Mortality in India Keeping the Pace. HNP
Discussion Series, Washington DC: World Bank.
International Institute for Population Sciences (IIPS) and ORC-Macro. 2001. National Family Health
Survey-2 (NFHS-2), 1998-99. Mumbai: IIPS.
National Health Policy, 2002. Available at http://mohfw.nic.in/.
National Population Policy, 2000. Available at http://mohfw.nic.in/.
National Rural Health Mission, 2005. Available at http://mohfw.nic.in/.
Pathak, K. B., F. Ram, and B. S. Singh. 1988. “A New Method of Estimating Infant and Child Mortality from Data
on Children Ever Born and Children Surviving”. Janasamkhya 6 (2): 159-68.
Rajan, I. S. and Nair, P. M. 1998. “Infant and Child Mortality Estimates-Part I”. Economic and Political Weekly,
XXXIII (19): 1120-1140.
S. Venkatesan, “Unequal Treatment: Caste and Religious Differences in Health and Access to Health Care in
India” Available at: http://southasia.oneworld.net/acessed on 4th July 2009.
World Health Organization (WHO). 2005. Health and Millennium Development Goals, WHO, Geneva, p-11.
| 21

3.2 Page 22

▲back to top


Appendix
Table 1: Infant Mortality Rate (IMR) by Sex, Place of Residence and Religion for States and UTs of India,
1991 and 2001
1991
TOTAL
RURAL
TMF TMF
INDIA
Hindu
74 72 76 80 78 83
Muslim
68 66 70 78 75 80
Christian
58 52 59 66 63 66
Sikh
55 52 55 58 56 61
Buddhist
70 72 69 86 86 81
Jain
47 49 38 58 59 57
ANDHRA PRADESH
Hindu
50 53 48 54 57 51
Muslim
35 38 33 46 49 43
Christian
40 45 38 43 47 37
ARUNACHAL PRADESH
Hindu
70 72 66 75 77 74
Muslim
68 70 66 68 91 48
Christian
97 97 96 101 103 99
ASSAM
Hindu
72 74 70 76 80 73
Muslim
102 104 95 105 106 97
Christian
65 58 71 68 62 72
BIHAR
Hindu
69 60 78 71 63 81
Muslim
73 66 82 77 70 85
Christian
86 67 93 86 75 98
CHHATTISGARH
Hindu
Muslim
Christian
Sikh
Buddhist
Jain
URBAN
TM F
48 48 48
47 47 47
40 33 47
39 40 37
48 49 45
44 39 47
33 34 30
26 28 25
37 38 35
52 58 44
50 49 58
68 60 83
55 51 58
70 78 64
33 40 26
48 44 52
48 45 51
68 44 71
2001
TOTAL
RURAL
TMF TMF
INDIA
Hindu
54 55 53 58 59 58
Muslim
50 50 49 56 57 55
Christian
39 37 41 44 44 45
Sikh
45 44 46 48 47 49
Buddhist
40 41 38 45 48 43
Jain
35 35 34 38 37 39
ANDHRA PRADESH
Hindu
43 47 39 48 52 44
Muslim
33 35 32 38 41 34
Christian
40 42 37 45 50 40
ARUNACHAL PRADESH
Hindu
55 58 52 55 57 51
Muslim
55 63 47 64 66 62
Christian
71 73 69 70 72 68
ASSAM
Hindu
63 66 59 65 67 62
Muslim
78 82 73 80 82 77
Christian
64 65 63 65 67 64
BIHAR
Hindu
56 54 57 57 55 58
Muslim
58 56 59 60 58 61
Christian
45 40 50 52 47 57
CHHATTISGARH
Hindu
67 71 63 72 76 67
Muslim
45 46 44 50 52 48
Christian
50 48 51 52 50 54
Sikh
37 48 24 54 65 42
Buddhist
54 61 46 58 66 50
Jain
37 48 24 38 36 40
URBAN
TMF
40 41 40
38 38 37
31 31 31
36 35 36
31 31 30
33 32 33
32 34 30
30 31 28
33 33 32
46 51 39
41 64 23
32 33 30
46 48 44
57 60 53
45 45 44
41 41 42
43 43 42
34 27 40
48 51 46
41 42 41
40 42 39
33 44 21
51 45 46
37 35 38
22 |

3.3 Page 23

▲back to top


1991
TOTAL
RURAL
TMF TMF
GOA
Hindu
46 46 44 49 52 51
Muslim
38 40 36 44 41 46
Christian
32 32 30 34 32 36
GUJARAT
Hindu
70 66 73 79 72 82
Muslim
58 55 62 72 68 72
Christian
59 52 64 63 54 75
HARYANA
Hindu
53 51 55 57 55 60
Muslim
73 71 73 75 75 75
Sikh
52 47 58 53 47 59
HIMACHAL PRADESH
Hindu
75 82 70 77 80 69
Muslim
74 81 37 77 81 70
Christian
57 60 54 67 71 63
Sikh
58 60 55 63 65 62
JAMMU & KASHMIR
Hindu
Muslim
Christian
Sikh
Buddhist
JHARKHAND
Hindu
Muslim
Christian
Sikh
Buddhist
Jain
KARNATAKA
Hindu
62 64 59 66 69 63
Muslim
47 50 44 54 59 50
Christian
42 46 39 43 45 42
Buddhist
54 50 60 60 53 65
KERALA
Hindu
37 38 36 38 39 38
Muslim
34 35 34 36 36 34
Christian
46 33 39 38 36 40
MADHYA PRADESH
Hindu
106 108 112 115 113 118
Muslim
84 82 87 107 103 112
Christian
72 76 68 86 92 83
Sikh
52 57 45 65 70 61
Jain
70 64 72 85 94 75
URBAN
TM F
36 35 37
35 40 31
31 29 33
48 47 49
48 45 52
55 53 57
38 37 39
45 33 55
48 44 52
75 75 71
52 57 45
44 37 52
48 51 45
47 49 45
41 43 40
42 47 41
32 26 38
31 26 32
36 36 35
30 22 34
76 71 79
68 67 70
47 47 45
47 54 39
63 52 76
2001
TOTAL
RURAL
TMF TMF
GOA
Hindu
28 29 26 27 28 26
Muslim
28 32 25 28 28 27
Christian
23 24 22 23 24 22
GUJARAT
Hindu
61 62 61 65 66 65
Muslim
55 57 54 60 61 59
Christian
58 64 53 63 69 57
HARYANA
Hindu
42 41 42 47 45 49
Muslim
65 62 68 69 65 71
Sikh
40 40 39 45 44 47
HIMACHAL PRADESH
Hindu
45 47 43 46 47 44
Muslim
43 44 41 44 47 42
Christian
45 48 43 42 37 49
Sikh
39 38 39 39 37 41
JAMMU & KASHMIR
Hindu
45 46 44 47 47 45
Muslim
48 48 49 50 50 51
Christian
32 39 24 26 31 20
Sikh
45 44 48 49 48 53
Buddhist
41 39 44 42 42 43
JHARKHAND
Hindu
49 51 47 52 55 50
Muslim
44 46 41 47 49 44
Christian
48 49 46 51 52 49
Sikh
37 37 38 40 33 49
Buddhist
43 38 48 47 48 44
Jain
32 47 16 30 42 18
KARNATAKA
Hindu
55 57 52 60 63 58
Muslim
47 49 44 52 55 48
Christian
38 39 36 42 43 40
Buddhist
50 51 48 52 53 51
KERALA
Hindu
18 16 20 18 16 21
Muslim
14 12 16 15 12 17
Christian
17 17 19 18 17 20
MADHYA PRADESH
Hindu
95 92 98 102 98 105
Muslim
73 74 71 85 87 84
Christian
72 75 69 85 87 84
Sikh
69 67 70 82 80 85
Jain
61 61 61 66 64 67
URBAN
TMF
28 29 27
28 32 24
23 24 22
46 44 47
46 47 44
40 42 39
38 35 40
50 51 49
30 28 31
38 40 36
33 28 38
43 46 40
37 38 36
39 39 37
40 38 42
35 42 28
41 41 41
36 23 49
35 37 33
34 35 32
28 32 26
36 37 35
30 7 51
35 52 14
42 44 40
39 41 38
34 35 33
38 37 38
16 15 18
15 12 16
17 14 20
63 61 65
55 57 53
50 55 45
46 47 45
49 50 48
| 23

3.4 Page 24

▲back to top


1991
TOTAL
RURAL
TMF TMF
MAHARASHTRA
Hindu
58 59 55 74 78 68
Muslim
45 49 40 56 63 48
Christian
35 41 29 47 49 43
Buddhist
65 67 61 77 82 73
Jain
38 32 40 46 51 41
MANIPUR
Hindu
28 28 28 27 29 27
Muslim
55 58 53 53 51 54
Christian
38 38 39 40 32 40
Meghalaya
Hindu
61 68 54 72 81 63
Muslim
106 107 106 109 112 109
Christian
73 74 72 76 80 74
Buddhist
59 93 40 67 100 52
MIZORAM
Hindu
96 111 83 165 200 157
Christian
48 51 46 68 71 64
NAGALAND
Hindu
56 53 58 48 48 50
Muslim
80 85 75 90 95 84
Christian
54 52 57 55 52 59
ORISSA
Hindu
108 103 110 112 109 115
Muslim
86 81 88 93 86 101
Christian
120 118 124 127 126 130
PUNJAB
Hindu
49 51 47 65 68 60
Muslim
62 49 68 65 62 67
Christian
77 68 85 84 75 94
Sikh
56 54 57 59 56 62
RAJASTHAN
Hindu
82 80 84 88 86 89
Muslim
74 70 77 86 84 89
Christian
78 58 80 98 78 120
Sikh
59 61 56 61 65 58
Jain
48 51 46 61 63 58
SIKKIM
Hindu
57 59 56 57 57 58
Muslim
46 44 58 62 74 51
Christian
65 80 51 66 80 51
Buddhist
55 56 54 55 55 57
TAMIL NADU
Hindu
54 52 55 58 57 60
Muslim
41 48 32 47 56 38
Christian
46 46 46 48 50 45
URBAN
TM F
38 41 37
38 40 36
33 39 27
46 49 44
29 25 36
29 27 34
58 66 49
19 21 17
2001
TOTAL
RURAL
TMF TMF
MAHARASHTRA
Hindu
51 53 50 61 63 60
Muslim
41 42 40 45 47 43
Christian
28 27 28 33 36 31
Buddhist
35 37 32 40 45 37
Jain
26 26 27 28 27 28
MANIPUR
Hindu
27 27 28 26 27 25
Muslim
33 34 31 34 37 31
Christian
37 35 39 37 35 39
48 50 45 Hindu
58 49 70 Muslim
54 54 55 Christian
54 56 39 Buddhist
MIZORAM
32 41 23 Hindu
26 28 23 Christian
NAGALAND
62 56 63 Hindu
70 71 68 Muslim
46 45 49 Christian
ORISSA
77 77 77 Hindu
70 72 68 Muslim
70 66 79 Christian
PUNJAB
35 34 36 Hindu
52 49 55 Muslim
63 54 73 Christian
39 39 38 Sikh
RAJASTHAN
56 54 58 Hindu
52 50 53 Muslim
31 39 28 Christian
41 34 48 Sikh
39 40 36 Jain
SIKKIM
49 52 43 Hindu
40 34 73 Muslim
35 30 50 Christian
45 52 41 Buddhist
TAMIL NADU
42 41 44 Hindu
36 40 30 Muslim
40 37 43 Christian
50 53 47 58 62 54
68 75 61 72 79 63
51 51 52 55 55 55
36 44 29 47 60 36
42 41 42 63 64 61
30 30 31 36 37 35
41 43 40 39 39 39
49 48 50 42 45 40
39 35 42 40 36 44
85 88 81 87 88 85
70 67 72 74 70 76
97 95 98 101 98 104
40 41 40 44 45 43
45 46 43 49 49 51
45 46 43 48 50 45
45 43 46 47 46 48
80 79 81 87 85 88
75 71 78 82 81 84
77 75 77 94 90 97
61 59 62 52 53 51
53 55 52 46 47 45
43 45 42 44 45 42
69 80 86 73 71 73
43 52 34 42 49 34
38 36 41 37 35 39
44 44 43 45 46 44
38 39 37 38 39 37
33 34 32 33 35 32
URBAN
TMF
30 30 29
29 30 28
27 25 28
30 31 28
26 26 26
27 25 29
30 27 33
37 37 37
38 40 35
36 37 35
32 30 34
18 18 17
24 28 19
25 23 26
44 47 41
60 53 66
33 27 37
65 67 63
60 62 58
64 66 61
37 36 37
38 43 34
35 34 36
36 35 37
46 47 48
48 46 50
42 44 39
40 38 42
40 42 39
37 38 36
61 98 12
53 82 27
46 30 58
41 43 40
38 39 37
33 33 33
24 |

3.5 Page 25

▲back to top


1991
TOTAL
RURAL
TMF TMF
TRIPURA
Hindu
77 84 70 80 86 73
Muslim
85 89 75 86 89 77
Christian
66 67 63 66 71 62
Buddhist
87 92 89 89 89 89
UTTARAKHAND
Hindu
Muslim
Christian
Sikh
Buddhist
Jain
UTTAR PRADESH
Hindu
95 90 100 96 92 104
Muslim
82 84 88 93 88 97
Christian
68 60 76 90 83 97
WEST BENGAL
Hindu
64 62 66 69 67 72
Muslim
74 73 76 78 76 80
Christian
73 75 70 77 77 75
Buddhist
67 66 71 75 71 76
ANANDMAN and NICOBAR ISLANDS
Hindu
47 48 46 51 51 51
Muslim
44 52 36 52 51 41
Christian
69 71 69 75 80 71
DADRA and NAGAR HAVELI
Hindu
64 70 57 66 73 60
Muslim
40 39 46 47 38 61
CHANDIGARH
Hindu
43 45 41 55 60 48
Muslim
49 54 43 58 62 54
Sikh
DAMAN and DIU
Hindu
55 61 47 57 66 47
Muslim
37 40 37 28 33 25
DELHI
Hindu
49 49 50 59 59 60
Muslim
55 53 55 69 64 73
Christian
26 29 24 48 43 57
Sikh
30 30 32 51 58 46
Buddhist
74 69 84 125 116 161
Jain
26 26 27 48 50 64
LAKSHADWEEP
Muslim
88 96 80 94 100 77
URBAN
TM F
62 65 60
77 83 53
64 63 71
58 53 62
64 64 65
39 34 39
44 42 47
45 44 46
53 66 40
37 39 36
38 38 37
28 32 25
43 36 49
46 50 39
22 41 19
42 43 38
47 51 40
50 52 49
41 41 39
47 48 47
51 49 53
26 31 22
30 30 31
68 63 73
27 27 27
82 80 83
2001
TOTAL
RURAL
TMF TMF
TRIPURA
Hindu
65 68 62 67 69 66
Muslim
63 66 60 65 68 62
Christian
60 58 61 60 59 61
Buddhist
58 54 61 59 55 60
UTTARAKHAND
Hindu
44 45 41 45 47 43
Muslim
49 49 48 55 55 55
Christian
41 39 44 31 34 29
Sikh
46 49 44 48 51 45
Buddhist
29 28 30 31 32 30
Jain
36 36 35 48 57 40
UTTAR PRADESH
Hindu
86 84 88 89 87 90
Muslim
77 75 78 83 81 85
Christian
72 68 75 80 75 86
WEST BENGAL
Hindu
57 59 54 57 60 52
Muslim
60 63 57 62 65 58
Christian
62 65 59 64 68 60
Buddhist
65 66 64 70 71 68
ANANDMAN and NICOBAR ISLANDS
Hindu
41 44 38 39 43 36
Muslim
33 27 38 39 41 37
Christian
38 37 39 41 41 41
DADRA and NAGAR HAVELI
Hindu
45 49 42 50 54 46
Muslim
32 37 27 28 32 24
CHANDIGARH
Hindu
53 53 52 61 62 61
Muslim
55 44 63 75 74 77
Sikh
42 40 42 64 64 63
DAMAN and DIU
Hindu
30 31 29 30 31 29
Muslim
37 46 26 32 36 27
DELHI
Hindu
40 39 40
Muslim
38 39 36
Christian
26 26 25
Sikh
31 30 34
Buddhist
45 49 40
Jain
27 25 30
LAKSHADWEEP
Muslim
60 56 63 64 62 66
URBAN
TMF
41 43 39
27 20 37
45 50 41
23 31 16
35 35 33
38 39 36
48 42 54
35 35 35
22 17 28
34 32 35
53 50 55
48 47 49
43 39 46
56 57 56
47 48 46
48 46 50
46 44 48
45 47 43
24 9 39
40 16 32
31 35 27
36 41 30
51 50 51
50 40 61
40 39 41
30 35 24
40 52 26
54 52 56
| 25

3.6 Page 26

▲back to top


PUDUCHERRY
Hindu
Muslim
Christian
1991
TOTAL
RURAL
TMF TMF
47 53 44 53 55 49
48 51 44 68 70 64
57 60 56 57 69 48
URBAN
TM F
46 53 49
32 31 36
60 60 59
PUDUCHERRY
Hindu
Muslim
Christian
2001
TOTAL
RURAL
TMF TMF
28 29 26 30 33 27
22 22 21 13 13 14
29 29 28 24 22 26
URBAN
TMF
26 27 25
24 25 23
29 31 27
Table 2: Child Mortality Rate (CMR) by Sex, Place of Residence and Religion for States and UTs of India,
1991 and 2001
1991
TOTAL
RURAL
INDIA
TMF TMF
Hindu
97 94 102 109 102 117
Muslim
91 87 92 107 101 114
Christian
70 64 75 82 79 86
Sikh
67 64 67 74 68 77
Buddhist
92 94 91 114 115 117
Jain
59 57 45 74 71 72
ANDHRA PRADESH
Hindu
58 70 65 64 78 79
Muslim
39 45 45 55 66 65
Christian
61 69 54 74 82 68
ARUNACHAL PRADESH
Hindu
106 107 106 121 122 119
Muslim
84 92 88 111 107 115
Christian
181 186 175 184 193 176
ASSAM
Hindu
97 98 96 102 104 101
Muslim
138 142 135 152 153 152
Christian
83 72 92 84 77 94
BIHAR
Hindu
88 74 104 93 78 110
Muslim
94 83 107 100 89 114
Christian
114 86 144 117 99 143
CHHATTISGARH
Hindu
Muslim
Christian
Sikh
Buddhist
Jain
2001
URBAN
TOTAL
RURAL
TM F
INDIA
TMF TMF
59 56 60 Hindu
60 60 61 66 65 67
60 58 62 Muslim
55 53 57 60 62 64
47 37 57 Christian
42 42 43 47 47 47
37 37 42 Sikh
48 47 49 50 50 51
55 57 52 Buddhist
44 46 45 54 56 53
51 44 59 Jain
38 39 37 41 41 42
ANDHRA PRADESH
37 45 45 Hindu
49 53 45 56 58 53
28 30 32 Muslim
37 38 37 42 43 40
45 47 41 Christian
46 45 42 51 56 46
ARUNACHAL PRADESH
61 60 63 Hindu
59 60 57 66 67 64
62 57 74 Muslim
58 66 53 72 77 70
90 72 121 Christian
78 78 76 85 87 82
ASSAM
69 62 74 Hindu
67 68 66 70 69 71
92 100 85 Muslim
86 87 86 88 88 88
38 49 32 Christian
69 70 69 69 71 68
BIHAR
60 52 64 Hindu
61 57 64 63 58 66
59 53 63 Muslim
53 59 66 65 60 68
89 52 93 Christian
43 38 50 52 47 59
CHHATTISGARH
Hindu
75 77 70 80 81 78
Muslim
47 48 46 55 57 53
Christian
52 50 53 55 53 56
Sikh
39 46 30 61 67 55
Buddhist
58 65 53 68 73 64
Jain
39 46 30 40 38 40
URBAN
TMF
43 42 44
40 38 42
31 32 31
39 38 40
35 34 36
36 35 37
36 37 34
32 33 32
35 34 35
51 54 45
50 66 37
49 50 48
48 49 46
60 63 58
47 48 47
44 41 47
45 43 45
31 26 37
51 53 51
41 42 43
38 42 37
33 39 27
53 50 50
37 35 36
26 |

3.7 Page 27

▲back to top


1991
TOTAL
RURAL
TMF TMF
GOA
Hindu
53 53 51 61 60 63
Muslim
45 47 41 51 46 57
Christian
37 37 35 39 37 41
GUJARAT
Hindu
86 80 95 103 95 110
Muslim
70 67 79 94 84 97
Christian
73 64 82 82 66 101
HARYANA
Hindu
72 66 79 81 74 91
Muslim
118 103 132 121 107 136
Sikh
66 57 74 67 57 75
HIMACHAL PRADESH
Hindu
97 101 92 99 104 97
Muslim
96 104 42 99 110 92
Christian
69 72 69 84 93 84
Sikh
73 73 70 79 81 78
JAMMU & KASHMIR
Hindu
Muslim
Christian
Sikh
Buddhist
JHARKHAND
Hindu
Muslim
Christian
Sikh
Buddhist
Jain
KARNATAKA
Hindu
84 82 87 93 91 95
Muslim
66 65 67 80 78 82
Christian
50 62 58 51 52 50
Buddhist
66 58 76 76 65 87
KERALA
Hindu
45 43 46 45 47 44
Muslim
53 53 53 55 54 55
Christian
53 38 46 44 41 47
URBAN
TM F
41 40 42
40 45 36
36 34 38
59 56 61
57 52 63
65 63 67
44 42 45
55 38 72
59 52 66
97 92 93
64 69 52
51 42 64
56 59 54
55 58 52
54 55 54
50 58 49
37 31 46
37 34 42
41 41 40
35 27 39
2001
TOTAL
RURAL
TMF TMF
GOA
Hindu
30 31 28 29 30 29
Muslim
31 34 29 33 32 35
Christian
24 24 23 24 24 23
GUJARAT
Hindu
64 63 66 68 67 70
Muslim
59 60 58 64 63 64
Christian
61 65 58 67 72 62
HARYANA
Hindu
45 46 45 49 48 51
Muslim
72 66 75 77 75 79
Sikh
44 43 44 48 47 50
HIMACHAL PRADESH
Hindu
65 68 63 66 65 66
Muslim
65 67 64 65 66 65
Christian
67 70 67 68 66 69
Sikh
49 50 49 50 50 51
JAMMU & KASHMIR
Hindu
45 46 46 49 47 47
Muslim
46 46 47 48 48 51
Christian
37 44 29 33 38 30
Sikh
43 44 45 49 45 51
Buddhist
47 46 47 48 49 49
JHARKHAND
Hindu
55 54 55 58 58 58
Muslim
49 48 46 52 52 51
Christian
52 52 50 55 54 53
Sikh
37 37 38 46 35 54
Buddhist
49 40 56 55 51 62
Jain
30 42 19 34 42 26
KARNATAKA
Hindu
60 62 59 67 68 67
Muslim
51 51 50 58 60 56
Christian
40 40 39 44 45 42
Buddhist
57 56 57 60 59 60
KERALA
Hindu
20 18 21 20 19 23
Muslim
19 17 22 20 18 22
Christian
18 16 20 20 19 21
URBAN
TMF
28 29 27
31 32 30
23 24 22
47 46 49
48 47 48
42 42 41
40 35 43
55 53 57
30 29 32
40 41 39
35 30 40
45 47 43
39 40 38
39 37 37
38 36 40
38 45 33
39 39 39
38 27 47
38 37 36
36 35 34
28 32 28
36 35 35
30 12 46
31 46 16
44 46 43
42 43 42
35 36 35
42 40 44
18 17 19
20 18 20
17 15 20
| 27

3.8 Page 28

▲back to top


1991
TOTAL
RURAL
TMF TMF
MADHYA PRADESH
Hindu
162 155 168 176 169 182
Muslim
113 111 122 160 150 171
Christian
95 101 90 115 131 115
Sikh
64 69 57 81 86 77
Jain
91 79 100 112 122 101
MAHARASHTRA
Hindu
71 75 67 96 98 91
Muslim
54 60 48 70 80 59
Christian
422 48 37 55 58 51
Buddhist
84 86 79 103 110 97
Jain
45 39 49 56 64 48
MANIPUR
Hindu
33 33 33 31 33 31
Muslim
73 74 71 69 67 71
Christian
43 43 46 47 37 47
MEGHALAYA
Hindu
89 93 85 113 115 110
Muslim
161 154 161 165 159 165
Christian
95 96 84 103 103 102
Buddhist
75 131 47 89 147 64
MIZORAM
Hindu
137 158 119 253 297 224
Christian
59 63 55 89 93 80
NAGALAND
Hindu
68 65 71 57 55 60
Muslim
105 113 100 119 127 110
Christian
66 62 70 67 64 72
ORISSA
Hindu
164 159 167 168 164 172
Muslim
114 110 124 130 117 146
Christian
184 182 192 201 197 206
PUNJAB
Hindu
61 62 58 81 84 76
Muslim
78 57 84 81 77 86
Christian
104 85 121 112 97 136
Sikh
72 69 65 77 69 79
RAJASTHAN
Hindu
115 106 124 126 116 136
Muslim
96 91 103 122 116 125
Christian
99 71 105 133 98 172
Sikh
71 74 70 77 81 73
Jain
58 61 54 77 79 74
URBAN
TM F
100 95 107
90 85 92
54 54 57
56 66 46
79 64 99
46 49 43
45 48 42
40 46 33
57 60 53
36 30 43
34 31 39
81 90 71
23 25 21
55 58 54
72 57 92
66 66 67
66 69 45
37 49 27
42 45 39
76 64 80
87 91 85
55 52 56
103 105 101
91 94 89
96 82 108
40 39 41
64 57 71
79 66 95
46 46 45
68 66 72
64 63 66
37 46 33
48 39 55
46 48 43
2001
TOTAL
RURAL
TMF TMF
MADHYA PRADESH
Hindu
103 97 108 112 106 116
Muslim
78 76 79 93 92 94
Christian
74 76 72 92 92 91
Sikh
69 67 70 85 81 88
Jain
61 62 61 70 69 71
MAHARASHTRA
Hindu
55 56 55 65 68 63
Muslim
33 35 32 47 50 46
Christian
28 28 29 34 36 33
Buddhist
43 42 40 48 53 45
Jain
26 26 27 30 28 31
MANIPUR
Hindu
29 28 30 28 29 27
Muslim
40 39 38 38 39 36
Christian
38 36 40 39 36 41
MEGHALAYA
Hindu
57 58 56 69 69 68
Muslim
80 84 78 86 89 81
Christian
58 60 58 63 64 62
Buddhist
38 46 33 55 66 43
MIZORAM
Hindu
43 42 44 65 67 63
Christian
37 36 35 43 44 42
NAGALAND
Hindu
46 48 45 46 46 46
Muslim
54 51 56 45 47 43
Christian
39 35 42 40 37 44
ORISSA
Hindu
91 93 88 94 93 95
Muslim
75 72 79 80 74 85
Christian
101 99 103 105 103 109
PUNJAB
Hindu
42 42 43 47 48 46
Muslim
47 49 48 52 51 54
Christian
47 46 48 50 50 50
Sikh
47 45 49 50 48 50
RAJASTHAN
Hindu
89 85 93 95 90 98
Muslim
77 74 81 87 85 90
Christian
78 76 79 97 95 98
Sikh
63 62 65 55 55 54
Jain
55 56 54 49 49 48
URBAN
TMF
68 64 71
59 59 58
52 57 46
46 47 45
49 50 48
31 31 31
32 33 30
28 26 29
33 33 33
26 26 26
27 25 29
39 33 42
37 37 37
39 41 37
40 40 39
36 37 36
23 21 24
26 29 24
29 27 28
46 48 44
63 58 68
34 29 38
67 67 67
62 64 62
65 67 63
38 37 39
40 43 41
38 34 39
37 37 38
60 59 62
58 57 61
50 49 50
45 42 48
44 45 42
28 |

3.9 Page 29

▲back to top


1991
TOTAL
RURAL
SIKKIM
TMF TMF
Hindu
82 84 78 86 87 81
Muslim
71 70 73 78 97 61
Christian
80 102 63 84 109 63
Buddhist
91 93 89 94 95 93
TAMIL NADU
Hindu
70 66 73 78 73 83
Muslim
48 56 37 59 68 44
Christian
54 54 53 56 58 57
TRIPURA
Hindu
101 113 99 106 122 104
Muslim
113 117 108 114 118 109
Christian
82 87 79 82 87 78
Buddhist
124 121 125 125 122 125
UTTARAKHAND
Hindu
Muslim
Christian
Sikh
Buddhist
Jain
UTTAR PRADESH
Hindu
134 119 152 134 124 158
Muslim
114 106 126 129 119 134
Christian
83 76 99 117 105 138
WEST BENGAL
Hindu
82 77 84 94 90 99
Muslim
104 100 109 112 108 116
Christian
95 97 92 100 99 103
Buddhist
89 82 93 94 94 104
ANANDMAN and NICOBAR ISLANDS
Hindu
62 64 59 689 73 66
Muslim
51 62 41 62 73 48
Christian
92 93 91 97 102 93
DADRA and NAGAR HAVELI
Hindu
92 99 85 95 103 88
Muslim
47 44 58 54 43 77
CHANDIGARH
Hindu
50 53 48 67 72 60
Muslim
59 66 50 74 78 70
Sikh
37 36 37 63 64 63
2001
URBAN
TOTAL
RURAL
TM F
SIKKIM
TMF TMF
56 60 50 Hindu
51 52 49 52 53 50
47 39 95 Muslim
69 77 58 73 68 73
40 35 62 Christian
51 57 41 50 55 44
52 60 48 Buddhist
45 43 48 44 42 46
TAMIL NADU
51 51 52 Hindu
52 49 51 53 54 52
41 48 35 Muslim
44 45 44 46 48 45
47 42 50 Christian
38 39 37 39 40 38
TRIPURA
78 81 76 Hindu
70 72 67 73 74 73
105 122 103 Muslim
71 72 68 73 75 70
80 79 99 Christian
65 63 66 65 64 66
Buddhist
65 62 68 66 63 69
UTTARAKHAND
Hindu
51 47 46 50 52 51
Muslim
53 52 55 59 60 62
Christian
39 36 42 33 37 34
Sikh
46 49 46 51 51 50
Buddhist
33 32 33 37 36 36
Jain
32 32 33 40 47 34
UTTAR PRADESH
72 64 82 Hindu
93 89 99 99 94 104
76 78 74 Muslim
81 78 86 90 86 95
46 40 58 Christian
75 70 79 95 86 102
WEST BENGAL
53 49 57 Hindu
63 62 63 64 66 61
56 54 57 Muslim
68 69 68 70 71 69
65 82 47 Christian
66 67 64 69 73 68
45 47 41 Buddhist
66 68 65 70 71 70
ANANDMAN and NICOBAR ISLANDS
43 43 42 Hindu
47 49 46 47 51 47
32 37 29 Muslim
37 31 41 42 43 40
50 41 61 Christian
44 43 46 47 46 47
DADRA and NAGAR HAVELI
53 58 46 Hindu
50 54 47 55 59 52
27 49 24 Muslim
35 38 31 30 32 27
CHANDIGARH
49 51 45 Hindu
56 55 56 67 69 65
54 63 47 Muslim
57 47 65 85 78 95
31 31 33 Sikh
44 42 45 66 68 65
URBAN
TMF
40 40 39
61 91 21
51 72 31
48 37 56
47 48 45
43 44 45
35 35 36
44 46 42
36 32 41
49 52 45
27 34 22
37 35 35
42 41 43
42 38 46
33 33 33
20 15 25
32 28 33
56 54 58
51 50 53
44 42 47
56 58 58
50 51 51
48 46 50
48 46 51
48 49 46
31 19 42
46 49 42
34 36 32
37 42 32
55 53 56
53 45 64
42 41 43
| 29

3.10 Page 30

▲back to top


1991
2001
TOTAL
RURAL
URBAN
TOTAL
RURAL
URBAN
T M F T M F TM F
TMF TMF TMF
DAMAN and DIU
DAMAN and DIU
Hindu
78 77 79 87 86 88 62 64 61 Hindu
35 36 33 36 37 35 32 35 26
Muslim
42 45 44 33 38 30 48 46 46 Muslim
38 46 30 34 36 29 43 54 33
DELHI
DELHI
Hindu
61 57 62 75 71 76 59 56 59 Hindu
42 40 43
Muslim
67 65 71 85 80 95 63 63 63 Muslim
40 42 41
Christian
31 34 29 55 51 73 31 36 26 Christian
26 26 25
Sikh
35 35 37 63 70 53 35 35 36 Sikh
33 31 35
Buddhist
94 85 112 181 172 217 84 79 95 Buddhist
45 45 43
Jain
31 31 32 60 58 86 31 31 31 Jain
27 25 30
LAKSHADWEEP
LAKSHADWEEP
Muslim
126 134 108 127 138 103 111 103 117 Muslim
69 68 70 74 72 75 60 59 61
PUDUCHERRY
PUDUCHERRY
Hindu
68 70 66 76 79 74 58 65 56 Hindu
35 37 34 41 44 38 34 35 33
Muslim
55 59 52 67 63 73 53 59 46 Muslim
29 30 29 24 26 24 30 30 30
Christian
73 76 72 70 85 60 72 72 75 Christian
33 34 31 32 31 34 32 35 30
Table 3: Infant Mortality Rate (IMR) by Sex, place of Residence for Scheduled Castes for States and Uts of
India,1991 and 2001
1991
TOTAL
RURAL
MADHYA
PRADESH
TMF TMF
112 110 115 122 117 126
UTTAR
PRADESH
100 97 102 104 101 106
ORISSA
114 118 109 115 120 112
RAJASTHAN 91 88 94 96 94 98
ASSAM
92 94 87 94 97 90
ARUNACHAL
PRADESH
TRIPURA
78 90 71 80 94 74
BIHAR
82 74 90 83 75 92
CHHATTISGARH
HARYANA
68 72 69 75 75 74
GUJARAT
79 75 92 94 88 101
KARNATAKA 74 74 73 78 78 79
WEST
BENGAL
72 70 74 75 73 78
JHARKHAND
CHANDIGARH 54 60 47 67 73 55
UTTARAKHAND
HIMACHAL
PRADESH
80 86 75 86 87 85
URBAN
TM F
82 80 85
73 72 74
94 92 96
66 65 67
72 74 71
65 74 57
63 60 69
52 57 50
57 56 59
59 60 58
56 54 59
51 56 46
63 62 65
MADHYA
PRADESH
UTTAR
PRADESH
ORISSA
RAJASTHAN
ASSAM
ARUNACHAL
PRADESH
TRIPURA
BIHAR
CHHATTISGARH
HARYANA
GUJARAT
KARNATAKA
WEST
BENGAL
JHARKHAND
CHANDIGARH
UTTARAKHAND
HIMACHAL
PRADESH
2001
TOTAL
RURAL
TMF TMF
99 97 101 105 103 108
94 93 96 97 95 98
92 97 88 95 98 90
84 83 85 88 86 89
72 77 67 74 78 69
71 55 85 67 46 86
67 70 63 69 71 66
66 64 68 67 65 69
65 69 61 68 73 63
65 63 67 68 66 70
60 59 61 65 63 66
60 62 57 64 67 61
59 62 56 59 62 55
58 60 56 62 63 60
58 61 55 59 67 51
52 55 50 54 57 52
50 54 47 51 55 47
URBAN
TMF
69 70 68
54 52 56
66 71 60
52 52 52
54 58 51
76 63 86
53 60 46
54 52 55
53 54 52
50 49 51
49 48 51
43 46 41
56 58 55
40 42 38
58 60 56
38 40 36
43 45 40
30 |

4 Pages 31-40

▲back to top


4.1 Page 31

▲back to top


1991
2001
TOTAL
RURAL
URBAN
TOTAL
RURAL
URBAN
T M F T M F TM F
TMF TMF TMF
MEGHALAYA 97 95 98 102 93 115 82 101 75 MEGHALAYA 50 61 39 77 98 57 21 9 24
PUNJAB
71 70 71 77 76 77 53 50 55 PUNJAB
49 49 49 52 51 52 42 43 40
ANDHRA
PRADESH
68 70 65 70 72 68 49 52 47 ANDHRA
PRADESH
47 52 43 49 55 44 35 37 33
MAHARASHTRA 66 72 63 75 88 71 53 51 47 MAHARASHTRA 47 49 45 52 54 49 40 42 38
JAMMU &
KASHMIR
JAMMU &
KASHMIR
46 47 45 48 49 47 36 38 33
TAMIL NADU 65 64 68 69 66 72 56 56 55 TAMIL NADU 45 47 43 46 47 45 45 45 44
MANIPUR
49 56 43 75 91 57 16 16 17 MANIPUR
43 39 46 63 61 65 28 25 32
DADRA and
NAGAR HAVELI
DADRA and
43 36 50 30 26 34 58 54 63
NAGAR HAVEL
SIKKIM
61 56 65 64 58 67 47 48 45 SIKKIM
41 47 36 42 48 36 36 35 38
DAMAN and DIU
DAMAN and DIU 37 49 25 29 28 30 46 63 28
PUDUCHERRY 66 70 64 65 71 61 67 66 67 PUDUCHERRY 31 32 30 31 32 31 31 32 30
GOA
49 56 43 63 74 45 38 36 39 GOA
20 16 25 17 12 23 25 20 30
KERALA
52 47 54 52 47 55 48 44 50 KERALA
19 17 21 20 18 22 17 15 19
DELHI
57 58 56 67 69 64 57 58 54 DELHI
INDIA
84 82 86 89 86 91 62 60 63 INDIA
60 60 59 63 64 63 45 45 44
Table 4: Child Mortality Rate (CMR) by Sex, place of Residence for Scheduled Castes for States and UTs of
India, 1991 and 2001
1991
2001
TOTAL
RURAL
URBAN
TOTAL
RURAL
URBAN
T M F T M F TM F
TMF TMF TMF
INDIA
118 110 127 127 118 136 79 74 83 INDIA
67 65 69 72 72 73 50 48 52
MADHYA
PRADESH
174 161 187 190 177 205 116 108 123 MADHYA
PRADESH
109 105 114 117 113 120 76 75 78
UTTAR
PRADESH
151 136 168 158 143 176 98 92 105 UTTAR
PRADESH
104 99 109 110 104 114 59 55 65
ORISSA
155 158 153 179 181 176 128 120 136 ORISSA
99 104 95 103 105 100 70 75 66
RAJASTHAN 136 123 150 147 134 162 91 83 100 RAJASTHAN 95 91 99 98 94 101 60 57 63
ASSAM
126 126 126 130 131 130 94 94 95 ASSAM
79 82 77 82 84 79 57 59 55
ARUNACHAL
PRADESH
ARUNACHAL 74 58 89 76 61 92 79 66 92
PRADESH
BIHAR
11 97 126 114 100 130 76 74 86 BIHAR
74 69 79 76 70 80 59 54 63
CHHATTISGARH
CHHATTISGARH 74 77 71 77 81 74 58 60 57
TRIPURA
112 111 114 116 116 117 87 96 77 TRIPURA
72 76 69 74 78 70 57 63 53
HARYANA
97 97 96 99 103 111 65 69 61 HARYANA
70 66 75 75 72 79 59 55 63
WEST
BENGAL
101 97 105 105 99 119 75 69 80 WEST
BENGAL
68 68 67 68 68 67 59 61 60
GUJARAT
100 93 114 130 117 139 70 67 80 GUJARAT
65 62 68 72 68 75 54 50 57
JHARKHAND
JHARKHAND 65 65 65 70 69 71 44 45 43
KARNATAKA 105 102 106 112 110 114 79 77 82 KARNATAKA 65 67 64 70 72 69 49 51 47
MEGHALAYA 134 133 142 151 122 179 110 139 103 MEGHALAYA 61 67 57 91 110 71 23 13 33
UTTARAKHAND
UTTARAKHAND 60 60 60 62 62 63 42 43 41
| 31

4.2 Page 32

▲back to top


1991
2001
TOTAL
RURAL
URBAN
TOTAL
RURAL
URBAN
T M F T M F TM F
TMF TMF TMF
CHANDIGARH 66 72 59 85 95 70 63 68 58 CHANDIGARH 60 62 58 63 69 58 58 58 59
HIMACHAL
PRADESH
111 115 107 114 116 112 79 78 80 HIMACHAL
PRADESH
56 60 55 56 61 55 45 45 42
ANDHRA
PRADESH
93 94 93 99 99 99 64 65 64 ANDHRA
PRADESH
53 58 51 55 61 53 38 40 38
TAMIL NADU 86 82 90 90 85 95 72 71 73 TAMIL NADU 53 55 54 19 19 19 17 18 17
MAHARASHTRA 93 92 93 110 111 109 65 62 70 MAHARASHTRA 52 55 50 60 62 57 45 44 45
PUNJAB
93 89 99 102 98 105 65 61 71 PUNJAB
52 49 54 54 51 56 43 43 43
MANIPUR
61 68 52 98 120 73 23 22 26 MANIPUR
51 47 54 69 65 73 29 27 33
SIKKIM
77 68 87 82 70 89 54 56 52 SIKKIM
51 57 46 55 62 45 39 40 39
JAMMU &
KASHMIR
JAMMU &
KASHMIR
48 50 50 50 51 52 38 38 40
DELHI
79 76 82 96 89 104 76 74 79 DELHI
47 45 48
DADRA and
NAGAR HAVELI
DADRA and
45 39 52 33 28 37 59 55 64
NAGAR HAVELI
DAMAN and DIU
DAMAN and DIU 41 52 30 36 35 36 47 64 30
KERALA
65 63 67 66 64 69 57 54 61 KERALA
34 32 36 35 32 37 32 29 31
GOA
59 65 55 81 96 59 44 42 49 GOA
25 23 29 24 22 29 27 25 32
PUDUCHERRY 84 86 80 84 93 76 85 82 88 PUDUCHERRY 15 15 14 16 16 15 15 14 13
Table 5: Infant Mortality Rate (IMR) by Sex, place of Residence for Scheduled Tribes for States and UTs of
India,1991 and 2001
INDIA
MADHYA
PRADESH
ORISSA
UTTAR
PRADESH
RAJASTHAN
CHHATTISGARH
ANANDMAN
and NICOBAR
ISLANDS
ARUNACHAL
PRADESH
LAKSHADWEEP
BIHAR
UTTARAKHAND
ASSAM
GUJARAT
MAHARASHTRA
WEST
BENGAL
1991
TOTAL
RURAL
TMF TMF
88 88 86 89 87 92
112 116 108 113 117 109
109 106 112 110 109 112
95 92 97 96 93 98
106 106 106 109 110 109
87 85 89 88 87 89
95 97 91 99 102 97
95 94 96 100 99 102
81 76 83 82 80 85
70 67 73 70 67 73
79 77 79 80 86 80
87 93 81 90 97 85
77 77 76 78 79 78
URBAN
TM F
60 59 60
92 92 91
99 93 103
60 50 69
66 10 63
48 49 46
84 82 87
60 59 62
56 55 58
64 63 66
57 60 55
56 50 60
INDIA
MADHYA
PRADESH
ORISSA
UTTAR
PRADESH
RAJASTHAN
CHHATTISGARH
ANDAMAN
and NICOBAR
ISLANDS
ARUNACHAL
PRADESH
LAKSHADWEEP
BIHAR
UTTARAKHAND
ASSAM
GUJARAT
MAHARASHTRA
WEST
BENGAL
2001
TOTAL
RURAL
TMF TMF
68 71 65 70 72 67
104 107 101 106 110 103
96 99 91 97 101 92
89 86 92 91 88 93
87 87 87 89 88 89
77 83 73 79 84 74
77 81 73
75 77 72 77 78 74
75 76 75 75 76 74
71 69 74 72 71 74
70 73 67
68 65 30 68 65 70
67 69 64 69 71 66
65 69 61 69 75 64
64 68 61 65 69 61
URBAN
TMF
45 46 43
79 80 77
78 80 76
55 45 64
55 55 56
50 53 45
39 43 36
74 71 76
46 40 53
41 44 38
59 54 49
45 47 43
50 47 54
32 |

4.3 Page 33

▲back to top


1991
2001
TOTAL
RURAL
URBAN
TOTAL
RURAL
URBAN
T M F T M F TM F
TMF TMF TMF
HIMACHAL
PRADESH
89 94 83 89 95 84
HIMACHAL
PRADESH
63 68 59 65 69 61 49 53 44
JAMMU &
KASHMIR
JAMMU &
KASHMIR
63 62 65 64 63 66 49 49 49
KARNATAKA 82 79 83 72 80 83 78 76 79 KARNATAKA 63 66 59 65 68 61 51 53 49
MEGHALAYA 76 78 72 78 81 75 54 55 53 MEGHALAYA 63 63 62 66 67 66 43 42 45
TRIPURA
81 90 75 81 91 76 55 61 51 TRIPURA
62 61 63 63 62 64 38 37 40
ANDHRA
PRADESH
72 74 71 73 75 72 52 55 50 ANDHRA
PRADESH
60 63 57 62 65 58 41 43 39
JHARKHAND
JHARKHAND 57 59 55 58 61 57 38 41 36
DADRA and
NAGAR
HAVELI
71 82 63 74 84 65
DADRA and
NAGAR
HAVELI
55 61 50 57 62 52 37 51 22
TAMIL NADU 62 64 61 62 60 60 70 75 66 TAMIL NADU 54 54 53 55 53 55 51 58 44
KERALA
72 69 75 73 70 75 62 73 50 KERALA
50 49 51 50 49 52 41 36 46
SIKKIM
56 58 54 59 60 57 45 48 42 SIKKIM
46 46 47 46 46 47 40 38 41
NAGALAND 53 51 55 54 53 56 44 42 46 NAGALAND 39 35 42 40 36 44 32 26 37
DAMAN and
DIU
DAMAN and
DIU
38 47 28 38 50 25 42 42 43
MANIPUR
36 35 37 38 36 40 18 20 17 MANIPUR
34 33 35 36 35 38 17 18 16
MIZORAM
MIZORAM
34 34 35 43 43 42 25 23 26
Table 6: Child Mortality Rate (CMR) by Sex, place of Residence for Scheduled Tribes for States and UTs of
India, 1991 and 2001
INDIA
MADHYA
PRADESH
UTTAR
PRADESH
ORISSA
RAJASTHAN
ANANDMAN
and NICOBAR
ISLANDS
ARUNACHAL
PRADESH
LAKSHADWEEP
CHHATTISGARH
HIMACHAL
PRADESH
GUJARAT
TRIPURA
UTTARAKHAND
BIHAR
1991
TOTAL
RURAL
TMF TMF
111 109 113 116 112 119
139 139 139 142 144 140
131 128 135 134 131 137
125 116 132 128 125 133
114 114 125 121 126 127
156 157 155 158 159 157
111 114 107 118 123 114
106 104 109 111 105 114
101 106 96 102 107 98
106 100 109 107 105 112
106 118 101 107 119 101
103 98 113 109 103 116
URBAN
TM F
79 78 81
102 105 98
74 59 90
112 106 118
88 84 93
68 66 70
102 100 105
81 78 87
67 72 63
76 69 80
INDIA
MADHYA
PRADESH
UTTAR
PRADESH
ORISSA
RAJASTHAN
ANANDMAN
and NICOBAR
ISLANDS
ARUNACHAL
PRADESH
LAKSHADWEEP
CHHATTISGARH
HIMACHAL
PRADESH
GUJARAT
TRIPURA
UTTARAKHAND
BIHAR
2001
TOTAL
RURAL
TMF TMF
93 96 90 95 98 93
123 120 125 124 122 126
102 99 105 104 102 106
101 103 99 103 105 101
96 94 99 98 95 102
93 97 88
88 91 86 99 102 96
88 88 88 86 84 87
82 88 80 84 89 82
81 85 75 82 86 77
77 74 79 80 77 84
77 76 78 78 77 79
77 81 74
76 73 90 76 74 90
URBAN
TMF
60 62 59
87 85 88
66 57 72
80 82 80
61 60 64
60 64 57
91 88 93
55 56 50
51 55 46
57 56 59
48 47 50
56 52 61
| 33

4.4 Page 34

▲back to top


ASSAM
ANDHRA
PRADESH
MAHARASHTRA
MEGHALAYA
KARNATAKA
JAMMU &
KASHMIR
WEST
BENGAL
JHARKHAND
KERALA
TAMIL NADU
DADRA and
NAGAR
HAVELI
SIKKIM
NAGALAND
DAMAN and
DIU
MIZORAM
MANIPUR
1991
TOTAL
RURAL
TMF TMF
98 98 99 99 98 100
96 95 97 98 97 99
96 100 93 100 102 97
90 90 89 94 98 90
92 89 95 95 92 99
88 84 93 90 58 79
82 78 85
78 71 85
93 104 81
84 80 88
77 69 85
96 107 86
86 89 84 90 93 87
65 62 67 66 64 67
42 40 45 45 42 49
URBAN
TM F
72 68 77
69 66 72
69 71 66
66 67 65
87 88 86
156 157 155
68 75 64
91 98 87
50 58 44
53 50 57
25 26 25
ASSAM
ANDHRA
PRADESH
MAHARASHTRA
MEGHALAYA
KARNATAKA
JAMMU &
KASHMIR
WEST
BENGAL
JHARKHAND
KERALA
TAMIL NADU
DADRA and
NAGAR
HAVELI
SIKKIM
NAGALAND
DAMAN and
DIU
MIZORAM
MANIPUR
2001
TOTAL
RURAL
TMF TMF
75 75 75 76 75 77
74 76 73 77 79 75
74 75 72 77 82 74
72 74 69 75 76 75
71 74 68 73 78 69
70 67 74 72 69 75
70 71 69 71 72 70
62 62 62 63 63 64
60 62 60 62 60 64
60 60 59 60 58 61
60 66 58 65 67 60
57 59 56 60 62 58
48 45 52 50 47 54
43 53 34 43 52 31
41 41 42 50 50 49
40 37 42 42 40 45
URBAN
TMF
48 47 50
52 51 49
50 52 48
47 46 49
56 58 56
52 51 53
59 55 64
41 44 40
49 44 52
60 64 57
40 48 30
46 52 42
42 36 45
50 55 43
29 27 28
23 24 22
Table 7: Infant Mortality Rate (IMR) by Sex, place of Residence and Education for States and UTs of
India, 1991 and 2001
INDIA
Illiterate
Literate but
below middle
Middle but
below matric
Matric
but below
graduate
Graduate and
above
1991
TOTAL
RURAL
TMF TMF
80 78 82 84 82 87
61 61 61 67 69 67
48 48 50 56 54 59
39 38 54 47 44 48
40 42 36 48 43 61
URBAN
TM F
55 54 56
45 45 45
INDIA
Illiterate
Literate
37 37 38 Literate but
below primary
33 30 36 Primary but
below middle
32 36 29 Middle but
below matric
or secondary
Matric or
secondary
but below
graduate
Graduate and
above
2001
TOTAL
RURAL
TMF TMF
66 67 65 68 69 68
54 54 53 57 58 57
55 56 54 58 59 56
49 49 48 51 52 50
45 46 44 47 47 46
36 36 37 38 38 38
33 32 34 33 33 34
URBAN
TMF
52 52 51
46 47 46
45 46 44
41 42 40
40 41 40
34 33 34
32 32 33
34 |

4.5 Page 35

▲back to top


1991
TOTAL
RURAL
TMF TMF
ANDHRA PRADESH
Illiterate
52 56 49 56 59 53
Literate but
below middle
39 41 37 43 45 41
Middle but
below matric
30 29 31 34 33 36
Matric but
20 21 20 25 27 23
below graduate
Graduate and 18 22 16 29 36 24
above
ARUNACHAL PRADESH
Illiterate
95 100 91 102 107 97
Literate but
below middle
65 66 65 65 63 66
Middle but
below matric
52 51 52 59 59 59
Matric
but below
graduate
46 41 46 47 44 45
Graduate and 56 63 46 58 66 51
above
ASSAM
Illiterate
73 69 73 94 97 92
Literate but
below middle
72 74 71 73 77 71
Middle but
below matric
53 56 51 57 60 54
Matric but
39 39 39 47 48 48
below graduate
Graduate and 38 36 42 49 50 47
above
URBAN
TM F
40 42 38
30 31 28
2001
TOTAL
RURAL
TMF TMF
ANDHRA PRADESH
Illiterate
50 53 46 54 57 50
Literate
35 37 32 36 39 33
26 24 27 Literate but
44 47 41 46 49 42
below primary
17 16 18 Primary but
below middle
38 42 34 39 43 36
16 18 14 Middle but
below matric
or secondary
36 37 34 36 39 33
Matric or
secondary
but below
graduate
29 31 28 29 32 27
Graduate and 17 20 15 21 22 20
above
ARUNACHAL PRADESH
43 46 38 Illiterate
83 86 82 83 85 81
59 61 57 Literate
50 53 48 51 53 49
41 40 41 Literate but
66 71 59 66 73 58
below primary
44 38 46 Primary but
below middle
56 58 53 55 54 55
50 48 53 Middle but
below matric
or secondary
48 47 49 48 47 49
Matric or
secondary
but below
graduate
37 38 36 39 37 42
Graduate and 44 44 45 54 62 47
above
ASSAM
72 68 74 Illiterate
65 67 62 66 69 60
59 61 57 Literate
41 44 38 42 46 38
39 36 39 Literate but
54 58 49 54 59 50
below primary
22 22 25 Primary but
below middle
49 53 44 50 55 45
29 32 28 Middle but
below matric
or secondary
41 45 37 41 45 38
Matric or
secondary
but below
graduate
35 37 33 35 37 33
Graduate and 31 30 32 30 28 32
above
URBAN
TMF
37 39 34
30 31 29
35 37 34
34 35 32
33 34 33
29 29 28
15 16 13
51 58 45
45 50 39
52 59 43
56 66 45
46 45 48
35 37 32
36 41 33
53 56 50
35 37 33
43 48 37
40 42 36
38 41 35
33 35 31
28 30 26
| 35

4.6 Page 36

▲back to top


BIHAR
Illiterate
Literate but
below middle
Middle but
below matric
Matric but
below graduate
Graduate and
above
1991
TOTAL
RURAL
T
M
F
T
M
F
72 64 80 73 64 83
62 53 72 68 60 76
54 48 61 59 52 67
47 42 53 49 46 52
38 28 48 49 36 64
CHHATTISGARH
Illiterate
Literate but
below middle
Middle but
below matric
Matric but
below graduate
Graduate and
above
GOA
Illiterate
44 46 40 46 50 41
Literate but
below middle
38 37 38 43 41 41
Middle but
below matric
32 32 35 36 33 39
Matric but
28 27 29 31 28 38
below graduate
Graduate and 20 20 23 30 32 20
above
URBAN
TM F
52 51 55
43 37 45
BIHAR
Illiterate
Literate
2001
TOTAL
RURAL
T
M
F
T
M
F
62 60 64 62 60 64
46 46 46 48 47 48
39 36 43 Literate but
55 55 55 56 56 56
below primary
31 31 57 Primary but
below middle
50 49 51 50 50 51
31 29 33 Middle but
below matric
or secondary
46 45 47 47 47 47
Matric or
secondary
but below
graduate
41 41 40 43 44 42
Graduate and 35 27 41 40 34 46
above
CHHATTISGARH
Illiterate
79 84 74 82 87 76
Literate
59 62 55 63 67 59
Literate but
71 75 66 72 76 68
below primary
Primary but
below middle
64 67 59 66 70 61
Middle but
below matric
or secondary
53 57 50 55 58 50
Matric or
41 44 39 43 45 40
secondary but
below graduate
Graduate and 33 35 31 32 36 28
above
GOA
45 44 45 Illiterate
29 32 26 28 32 23
32 33 29 Literate
18 18 17 18 19 17
28 28 28 Literate but
26 29 22 26 27 25
below primary
26 25 29 Primary but
below middle
21 22 20 19 20 18
15 16 20 Middle but
below matric
or secondary
20 19 23 20 16 25
Matric or
15 15 14 17 19 15
secondary but
below graduate
Graduate and 15 18 13 17 20 14
above
URBAN
TMF
48 46 52
35 34 34
46 47 46
42 42 43
38 38 37
32 32 32
28 28 29
66 68 63
43 45 40
57 60 55
52 53 50
46 48 41
38 40 35
32 34 30
31 33 29
17 18 17
25 31 20
24 25 23
21 21 21
13 12 14
14 15 12
36 |

4.7 Page 37

▲back to top


GUJARAT
Illiterate
Literate but
below middle
Middle but
below matric
Matric but
below graduate
Graduate and
above
1991
TOTAL
RURAL
TMF TMF
77 74 80 84 81 86
57 52 61 64 62 66
47 45 50 55 50 64
43 40 47 51 49 54
45 36 51
HARYANA
Illiterate
78 78 80 81 78 82
Literate but
below middle
51 45 54 54 48 61
Middle but
below matric
38 40 40 49 50 49
Matric but
25 25 24 31 31 20
below graduate
Graduate and 26 27 22 29 32 25
above
HIMACHAL PRADESH
Illiterate
88 92 82 89 93 82
Literate but
below middle
65 68 60 66 70 61
Middle but
below matric
52 55 49 53 55 49
Matric but
41 45 36 44 47 37
below graduate
Graduate and 27 28 26 30 29 30
above
URBAN
TM F
60 48 60
44 42 46
GUJARAT
Illiterate
Literate
2001
TOTAL
RURAL
TMF TMF
52 53 54 55 57 54
37 38 36 40 41 39
40 38 41 Literate but
45 45 44 48 47 47
below primary
37 33 42 Primary but
below middle
40 40 39 42 44 41
40 33 42 Middle but
below matric
or secondary
38 39 37 41 42 39
Matric or
35 34 34 36 36 35
secondary but
below graduate
Graduate and 33 31 35 34 33 35
above
HARYANA
57 58 57 Illiterate
71 68 75 74 70 77
39 32 44 Literate
53 51 55 56 54 58
26 26 26 Literate but
67 65 69 69 67 71
below primary
20 20 20 Primary but
below middle
61 59 63 61 60 63
24 26 22 Middle but
below matric
or secondary
56 54 59 57 55 61
Matric or
46 44 49 49 47 52
secondary but
below graduate
Graduate and 22 25 20 26 29 23
above
HIMACHAL PRADESH
61 60 62 Illiterate
64 66 62 65 67 62
57 58 54 Literate
42 44 41 42 44 41
45 44 45 Literate but
64 67 61 64 68 61
below primary
35 40 30 Primary but
below middle
53 57 49 53 56 49
23 27 18 Middle but
below matric
or secondary
47 48 44 46 48 44
Matric or
37 37 35 37 37 36
secondary but
below graduate
Graduate and 25 26 25 28 27 29
above
URBAN
TMF
42 42 41
33 33 33
38 39 36
36 36 35
35 35 34
33 32 32
32 31 35
50 48 53
43 42 46
58 60 57
54 52 57
50 49 51
40 38 43
20 18 21
50 55 45
36 38 36
49 48 49
54 57 50
47 49 46
35 38 33
20 23 16
| 37

4.8 Page 38

▲back to top


1991
TOTAL
RURAL
TMF TMF
JAMMU & KASHMIR
Illiterate
Literate but
below middle
Middle but
below matric
Matric but
below graduate
Graduate and
above
JHARKHAND
Illiterate
Literate but
below middle
Middle but
below matric
Matric but
below graduate
Graduate and
above
KARNATAKA
Illiterate
64 66 61 68 70 65
Literate but
below middle
55 58 51 59 63 55
Middle but
below matric
43 47 40 48 52 45
Matric but
38 33 42 45 44 45
below graduate
Graduate and 34 44 22 27 26 28
above
URBAN
TM F
2001
TOTAL
RURAL
TMF TMF
JAMMU & KASHMIR
Illiterate
53 53 75 55 55 53
Literate
41 40 42 42 42 43
Literate but
49 51 47 52 54 49
below primary
Primary but
below middle
47 45 48 47 45 49
Middle but
below matric
or secondary
41 40 43 41 40 43
Matric or
38 37 39 38 37 39
secondary but
below graduate
Graduate and 37 35 39 38 33 42
above
JHARKHAND
Illiterate
57 59 55 58 60 56
Literate
38 40 35 41 43 38
Literate but
46 48 42 46 50 42
below primary
Primary but
below middle
42 43 39 42 45 40
Middle but
below matric
or secondary
40 42 36 41 43 39
Matric or
33 33 32 36 38 34
secondary but
below graduate
Graduate and 29 31 28 31 32 31
above
KARNATAKA
49 52 47 Illiterate
54 57 52 57 60 54
45 49 40 Literate
34 35 32 37 39 35
38 43 33 Literate but
42 45 40 44 47 41
below primary
35 32 41 Primary but
below middle
38 41 36 41 43 38
34 44 24 Middle but
below matric
or secondary
35 37 34 39 40 38
Matric or
31 32 30 34 36 32
secondary but
below graduate
Graduate and 23 25 20 25 25 26
above
URBAN
TMF
47 45 47
37 36 38
39 41 36
42 43 43
38 37 40
37 35 38
37 36 37
47 48 45
32 33 29
41 42 39
36 37 35
36 40 31
30 30 29
29 31 26
43 45 40
29 29 28
36 38 34
33 35 32
31 31 29
27 28 27
24 24 23
38 |

4.9 Page 39

▲back to top


KERALA
Illiterate
Literate but
below middle
Middle but
below matric
Matric but
below graduate
Graduate and
above
1991
TOTAL
RURAL
TMF TMF
54 58 52 56 58 50
38 39 35 37 41 33
34 32 36 37 35 39
28 27 34 33 27 34
27 20 35 26 17 35
MADHYA PRADESH
Illiterate
113 110 115 118 114 120
Literate but
below middle
87 86 88 99 100 84
Middle but
below matric
77 71 79 87 86 91
Matric but
69 63 74 86 81 92
below graduate
Graduate and 48 48 49 65 62 69
above
MAHARASHTRA
Illiterate
65 67 62 71 73 68
Literate but
below middle
56 58 53 60 63 56
Middle but
below matric
38 41 37 47 49 44
Matric but
26 27 25 34 35 32
below graduate
Graduate and 20 18 22 27 22 31
above
URBAN
TM F
45 45 45
36 30 40
26 24 29
25 22 28
28 22 36
79 77 84
66 65 67
48 32 61
60 53 64
45 45 45
46 47 44
41 44 37
30 32 28
18 20 17
16 16 12
KERALA
Illiterate
Literate
2001
TOTAL
RURAL
TMF TMF
34 33 35 36 34 37
28 25 31 28 25 31
Literate but
23 22 25 25 23 26
below primary
Primary but
below middle
20 18 23 20 18 23
Middle but
below matric
or secondary
21 18 24 21 18 24
Matric or
19 16 22 20 17 23
secondary but
below graduate
Graduate and 17 14 21 17 14 20
above
MADHYA PRADESH
Illiterate
90 90 90 93 93 93
Literate
63 64 63 71 71 70
Literate but
76 76 76 78 79 77
below primary
Primary but
below middle
67 67 66 71 71 70
Middle but
below matric
or secondary
58 58 58 62 62 62
Matric or
46 45 46 52 52 53
secondary but
below graduate
Graduate and 38 36 40 46 44 48
above
MAHARASHTRA
Illiterate
49 51 47 54 56 51
Literate
33 34 33 36 38 35
Literate but
43 45 40 45 47 43
below primary
Primary but
below middle
37 38 35 40 40 37
Middle but
below matric
or secondary
34 35 33 36 38 35
Matric or
30 30 30 32 31 32
secondary but
below graduate
Graduate and 18 17 20 26 21 28
above
URBAN
TMF
25 24 26
27 25 30
19 18 19
19 18 19
20 18 23
19 16 21
17 15 19
67 68 66
45 45 45
60 60 61
54 56 52
48 49 48
39 39 39
35 33 37
38 39 36
29 29 28
34 36 33
32 34 32
31 32 30
27 26 27
15 14 17
| 39

4.10 Page 40

▲back to top


MANIPUR
Illiterate
Literate but
below middle
Middle but
below matric
Matric but
below graduate
Graduate and
above
1991
TOTAL
RURAL
TMF TMF
38 35 38 37 37 37
41 41 42 39 39 38
36 46 27 38 47 29
26 25 26 29 23 32
21 20 28 18 23 14
MEGHALAYA
Illiterate
84 86 80 86 88 83
Literate but
below middle
71 72 69 75 77 71
Middle but
below matric
56 57 52 66 69 63
Matric but
45 47 42 54 56 51
below graduate
Graduate and
above
MIZORAM
Illiterate
103 108 97 109 113 105
Literate but
below middle
58 61 50 68 73 64
Middle but
below matric
28 31 26 47 55 36
Matric but
33 28 37 48 33 55
below graduate
Graduate and
above
URBAN
TM F
38 39 37
45 31 55
28 28 27
20 21 17
24 18 30
63 65 60
49 46 54
44 49 38
44 41 45
56 60 63
39 44 32
21 22 20
28 28 32
MANIPUR
Illiterate
Literate
Literate but
below primary
Primary but
below middle
Middle but
below matric
or secondary
Matric or
secondary but
below graduate
Graduate and
above
MEGHALAYA
Illiterate
Literate
Literate but
below primary
Primary but
below middle
Middle but
below matric
or secondary
Matric or
secondary but
below graduate
Graduate and
above
MIZORAM
Illiterate
Literate
Literate but
below primary
Primary but
below middle
Middle but
below matric
or secondary
Matric or
secondary but
below graduate
Graduate and
above
2001
TOTAL
RURAL
TMF TMF
35 34 36 36 35 36
30 30 30 30 31 30
46 45 45 48 47 49
36 34 39 36 34 38
29 28 30 27 28 26
23 25 21 25 26 23
20 19 22 17 20 14
74 76 72 76 79 74
45 44 44 47 47 47
54 54 54 55 55 55
47 47 47 48 48 48
40 40 41 41 41 40
31 30 32 34 34 34
22 21 23 18 13 22
74 75 72 75 77 73
30 29 31 36 37 37
45 41 48 46 46 49
35 37 35 38 40 35
27 25 29 32 29 34
20 20 19 28 28 27
17 14 19 27 37 16
URBAN
TMF
34 33 36
28 26 30
28 34 23
38 37 39
34 28 41
20 21 18
20 17 24
42 39 44
33 32 33
43 45 41
40 42 39
39 39 40
25 24 28
23 25 21
49 54 44
24 22 26
38 32 44
32 31 33
24 23 25
18 19 17
16 12 20
40 |

5 Pages 41-50

▲back to top


5.1 Page 41

▲back to top


NAGALAND
Illiterate
Literate but
below middle
Middle but
below matric
Matric but
below graduate
Graduate and
above
1991
TOTAL
RURAL
TMF TMF
60 58 63 61 60 65
56 53 58 57 56 59
43 41 45 39 37 42
41 46 36 30 30 24
ORISSA
Illiterate
112 110 115 114 111 117
Literate but
below middle
102 101 103 108 107 108
Middle but
below matric
92 93 91 98 98 98
Matric but
71 55 88 73 71 76
below graduate
Graduate and 58 59 53 69 67 75
above
PUNJAB
Illiterate
62 61 62 68 66 66
Literate but
below middle
54 50 58 58 57 61
Middle but
below matric
44 46 45 50 50 50
Matric but
31 33 28 38 38 37
below graduate
Graduate and 23 21 25 26 26 25
above
URBAN
TM F
56 48 65
50 43 59
47 46 47
50 54 46
88 91 86
63 55 72
68 76 59
44 50 35
36 35 46
43 42 43
40 32 46
33 35 31
24 20 24
18 16 21
NAGALAND
Illiterate
Literate
Literate but
below primary
Primary but
below middle
Middle but
below matric
or secondary
Matric or
secondary but
below graduate
Graduate and
above
ORISSA
Illiterate
Literate
Literate but
below primary
Primary but
below middle
Middle but
below matric
or secondary
Matric or
secondary but
below graduate
Graduate and
above
PUNJAB
Illiterate
Literate
Literate but
below primary
Primary but
below middle
Middle but
below matric
or secondary
Matric or
secondary but
below graduate
Graduate and
above
2001
TOTAL
RURAL
TMF TMF
44 41 47 43 40 47
37 33 40 38 34 41
42 42 43 43 43 43
44 39 48 44 40 49
38 35 42 38 34 42
31 28 34 32 28 35
33 29 37 37 35 40
77 81 73 78 82 73
46 48 44 47 50 45
62 65 58 63 65 60
53 55 51 54 56 51
46 48 43 46 48 43
37 38 36 37 39 35
31 34 29 31 33 28
56 57 56 60 59 58
38 37 39 41 39 42
49 49 49 51 50 52
47 46 49 48 47 50
43 43 43 44 43 45
36 34 37 37 35 38
21 20 23 24 25 23
URBAN
TMF
49 45 52
34 31 37
39 33 44
43 38 47
44 39 50
30 28 31
29 22 34
66 69 63
38 40 37
53 60 47
48 49 45
42 42 42
35 36 35
31 33 29
49 49 47
34 33 34
45 47 42
43 41 44
40 40 39
32 31 33
17 15 19
| 41

5.2 Page 42

▲back to top


RAJASTHAN
Illiterate
Literate but
below middle
Middle but
below matric
Matric but
below graduate
Graduate and
above
1991
TOTAL
RURAL
TMF TMF
84 82 86 89 86 91
61 60 62 74 72 75
46 45 46 600 58 61
34 33 36 44 42 46
31 33 26 39 39 38
SIKKIM
Illiterate
62 63 60 63 64 62
Literate but
below middle
53 55 51 51 52 50
Middle but
below matric
45 43 45 48 47 47
Matric but
37 35 37 34 31 37
below graduate
Graduate and
above
TAMIL NADU
Illiterate
59 58 59 62 62 63
Literate but
below middle
47 51 45 52 56 51
Middle but
below matric
39 40 37 47 47 48
Matric but
35 34 40 43 40 44
below graduate
Graduate and 48 41 56 65 94 27
above
URBAN
TM F
59 57 59
48 47 46
RAJASTHAN
Illiterate
Literate
2001
TOTAL
RURAL
TMF TMF
70 69 71 74 72 74
53 52 54 58 55 59
38 34 40 Literate but
61 60 63 63 61 65
below primary
32 29 33 Primary but
below middle
53 52 54 54 53 56
29 31 27 Middle but
below matric
or secondary
47 48 48 49 49 50
Matric or
42 42 41 43 44 42
secondary but
below graduate
Graduate and 28 31 25 35 34 36
above
SIKKIM
44 48 39 Illiterate
50 52 49 50 52 50
78 84 69 Literate
45 47 44 45 47 45
32 28 34 Literate but
60 60 59 61 62 61
below primary
41 44 35 Primary but
below middle
47 54 40 45 53 37
Middle but
below matric
or secondary
38 43 35 40 43 36
Matric or
40 33 48 42 36 49
secondary but
below graduate
Graduate and 46 43 48 38 25 50
above
TAMIL NADU
49 50 50 Illiterate
54 55 53 54 54 54
41 40 40 Literate
40 41 40 41 42 40
32 33 31 Literate but
45 47 45 47 47 47
below primary
30 30 36 Primary but
below middle
44 45 42 44 45 43
36 26 46 Middle but
below matric
or secondary
42 43 41 42 42 42
Matric or
37 37 37 37 37 36
secondary but
below graduate
Graduate and 31 33 31 28 29 27
above
URBAN
TMF
56 55 57
42 42 42
48 48 48
48 46 48
45 46 43
39 39 39
26 25 26
42 46 37
40 42 38
27 33 24
51 59 43
36 43 27
36 27 45
58 81 42
44 45 43
39 40 38
44 46 42
43 44 42
42 42 40
37 37 37
30 25 34
42 |

5.3 Page 43

▲back to top


TRIPURA
Illiterate
Literate but
below middle
Middle but
below matric
Matric but
below graduate
Graduate and
above
1991
TOTAL
RURAL
TMF TMF
85 92 77 86 93 79
77 79 64 79 83 71
57 61 55 57 62 55
54 57 54 52 56 46
56 62 49 58 68 47
UTTARAKHAND
Illiterate
Literate but
below middle
Middle but
below matric
Matric but
below graduate
Graduate and
above
UTTAR PRADESH
Illiterate
93 90 98 97 92 103
Literate but
below middle
77 71 81 85 80 88
Middle but
below matric
65 59 68 74 68 79
Matric but
51 48 57 63 58 67
below graduate
Graduate and 38 38 42 59 50 64
above
URBAN
TM F
71 78 63
60 61 59
50 54 46
58 54 59
44 57 44
63 60 67
56 52 57
44 40 47
43 38 47
36 33 40
TRIPURA
Illiterate
Literate
2001
TOTAL
RURAL
TMF TMF
60 62 58 61 62 59
44 45 43 44 45 42
Literate but
54 58 51 53 58 50
below primary
Primary but
below middle
45 44 46 46 46 46
Middle but
below matric
or secondary
40 40 40 40 40 41
Matric or
32 33 32 30 33 27
secondary but
below graduate
Graduate and 31 23 38 31 23 39
above
UTTARAKHAND
Illiterate
60 61 58 62 64 60
Literate
37 38 36 37 39 36
Literate but
51 53 51 53 54 51
below primary
Primary but
below middle
46 47 43 45 47 43
Middle but
below matric
or secondary
38 38 38 37 37 36
Matric or
32 34 31 32 36 30
secondary but
below graduate
Graduate and 29 29 30 30 29 32
above
UTTAR PRADESH
Illiterate
73 70 74 75 73 77
Literate
53 52 54 56 55 57
Literate but
63 61 65 65 63 68
below primary
Primary but
below middle
59 59 61 61 60 62
Middle but
below matric
or secondary
56 55 57 57 56 58
Matric or
47 46 48 49 48 49
secondary but
below graduate
Graduate and 32 31 34 46 45 45
above
URBAN
TMF
53 62 43
40 40 40
56 55 55
39 40 38
36 37 34
35 31 40
29 23 36
48 50 47
32 32 31
46 49 42
41 43 40
39 39 40
30 30 30
28 28 27
55 53 56
43 42 45
52 50 53
50 49 50
47 47 48
41 40 43
29 28 31
| 43

5.4 Page 44

▲back to top


1991
TOTAL
RURAL
TMF TMF
WEST BENGAL
Illiterate
71 69 74 75 73 77
Literate but
below middle
61 59 63 66 63 68
Middle but
below matric
50 49 55 57 55 61
Matric but
45 41 50 52 51 54
below graduate
Graduate and 38 39 42 51 42 60
above
ANANDMAN and NICOBAR ISLANDS
Illiterate
52 58 46 56 61 52
Literate but
below middle
47 48 45 51 52 49
Middle but
below matric
49 40 54 54 51 57
Matric but
35 32 41 45 32 46
below graduate
Graduate and
above
DADRA and NAGAR HAVELI
Illiterate
70 74 66 72 78 66
Literate but
below middle
50 63 36 52 61 37
Middle but
below matric
28 25 31 26 24 28
Matric but
below graduate
Graduate and
above
URBAN
TM F
49 47 52
42 36 45
2001
TOTAL
RURAL
TMF TMF
WEST BENGAL
Illiterate
66 69 63 67 70 63
Literate
55 58 53 54 56 51
37 33 38 Literate but
59 62 57 59 62 55
below primary
39 34 44 Primary but
below middle
56 59 53 55 58 52
30 28 32 Middle but
below matric
or secondary
55 57 52 52 55 49
Matric or
51 52 49 47 50 44
secondary but
below graduate
Graduate and 36 35 37 43 40 45
above
ANANDMAN and NICOBAR ISLANDS
40 44 36 Illiterate
49 53 44 52 54 51
36 35 36 Literate
40 42 38 39 42 36
30 31 30 Literate but
53 57 49 51 56 46
below primary
24 17 30 Primary but
below middle
43 46 42 44 49 40
Middle but
below matric
or secondary
39 43 33 39 43 34
Matric or
39 36 42 37 35 39
secondary but
below graduate
Graduate and 35 37 33 24 23 25
above
DADRA and NAGAR HAVELI
41 44 37 Illiterate
57 61 53 58 63 52
50 72 33 Literate
29 32 26 30 30 30
30 22 35 Literate but
42 43 42 42 35 51
below primary
Primary but
below middle
36 37 25 35 43 28
Middle but
below matric
or secondary
25 23 26 30 30 30
Matric or
28 29 26 27 28 26
secondary but
below graduate
Graduate and 22 29 16 19 24 12
above
URBAN
TMF
45 44 46
55 56 54
58 58 56
54 56 53
58 58 57
54 54 53
27 25 29
37 38 35
42 41 43
57 63 52
42 37 46
38 43 32
43 39 47
40 42 38
39 42 35
28 34 20
40 60 20
27 32 21
17 17 19
27 30 24
24 31 17
44 |

5.5 Page 45

▲back to top


CHANDIGARH
Illiterate
Literate but
below middle
Middle but
below matric
Matric but
below graduate
Graduate and
above
1991
TOTAL
RURAL
TMF TMF
55 58 53 58 62 55
39 63 35 48 51 46
29 33 25 52 49 56
24 24 27 31 31 32
23 23 21 32 35 31
DAMAN and DIU
Illiterate
77 80 79 76 80 72
Literate but
below middle
48 48 46 47 47 45
Middle but
below matric
44 42 37 29 29 29
Matric but
39 33 44 41 35 44
below graduate
Graduate and
above
DELHI
Illiterate
55 55 55 61 61 61
Literate but
below middle
47 49 48 53 57 50
Middle but
below matric
42 41 42 47 50 45
Matric but
30 30 30 37 36 38
below graduate
Graduate and 21 20 21 27 30 26
above
URBAN
TM F
55 60 53
37 41 33
CHANDIGARH
Illiterate
Literate
2001
TOTAL
RURAL
TMF TMF
54 56 52 57 60 54
48 47 50 65 64 66
25 28 21 Literate but
52 51 52 60 68 45
below primary
21 22 20 Primary but
below middle
62 66 58 69 69 70
21 23 21 Middle but
below matric
or secondary
55 48 64 62 51 73
Matric or
47 46 48 59 68 50
secondary but
below graduate
Graduate and 21 22 20 30 32 28
above
DAMAN and DIU
67 70 62 Illiterate
51 54 48 52 55 49
49 50 47 Literate
28 32 26 27 27 26
46 47 42 Literate but
42 42 42 43 40 45
below primary
39 36 41 Primary but
below middle
35 47 23 27 36 18
Middle but
below matric
or secondary
27 22 32 27 19 35
Matric or
24 25 24 22 20 25
secondary but
below graduate
Graduate and 33 32 34 14 11 18
above
DELHI
54 54 54 Illiterate
51 52 49
47 49 47 Literate
36 35 37
40 39 40 Literate but
45 45 45
below primary
28 28 30 Primary but
below middle
43 43 43
21 21 22 Middle but
below matric
or secondary
40 40 41
Matric or
33 32 34
secondary but
below graduate
Graduate and 20 19 20
above
URBAN
TMF
53 55 50
45 44 47
51 49 53
60 64 55
53 46 60
43 41 46
19 20 19
43 47 40
32 40 25
42 51 36
47 64 28
28 28 29
26 32 21
47 45 48
51 52 50
36 35 37
45 46 46
43 43 43
40 40 40
33 31 34
20 19 20
| 45

5.6 Page 46

▲back to top


1991
TOTAL
RURAL
TMF TMF
LAKSHADWEEP
Illiterate
110 130 92 113 132 97
Literate but
below middle
79 90 67 93 121 65
Middle but
below matric
76 84 63 86 112 61
Matric
but below
graduate
Graduate and
above
PUDUCHERRY
Illiterate
58 63 53 59 61 57
Literate but
below middle
45 47 40 46 54 39
Middle but
below matric
36 37 36 36 37 35
Matric
but below
graduate
41 41 37 36 40 30
Graduate and
above
URBAN
TM F
89 112 69
67 66 71
2001
TOTAL
RURAL
TMF TMF
LAKSHADWEEP
Illiterate
84 85 82 87 92 82
Literate
39 37 42 36 34 39
66 68 66 Literate but
52 45 59 52 45 56
below primary
Primary but
below middle
38 37 39 35 31 40
Middle but
below matric
or secondary
44 46 42 44 46 41
Matric or
secondary
but below
graduate
31 25 37 26 25 24
PUDUCHERRY
57 65 49 Illiterate
42 46 37 45 52 39
43 45 41 Literate
27 27 25 27 28 25
36 37 35 Literate but
40 40 38 35 34 34
below primary
42 43 39 Primary but
below middle
32 32 30 33 36 29
Middle but
below matric
or secondary
29 32 24 27 28 26
Matric or
secondary
but below
graduate
23 22 23 24 24 25
Graduate and 26 24 27 21 19 24
above
URBAN
TMF
73 80 63
44 42 46
54 48 60
46 54 37
44 44 45
40 23 57
39 41 36
26 26 25
42 43 40
30 30 31
29 34 23
22 21 22
26 25 28
46 |

5.7 Page 47

▲back to top


Table 8: Child Mortality Rate (CMR) by Sex, place of Residence and Education for States and UTs of India,
1991 and 2001
INDIA
Illiterate
Literate but
below middle
Middle but
below matric
Matric but
below graduate
Graduate and
above
1991
TOTAL
RURAL
TMF TMF
100 92 108 107 99 116
77 77 777 88 85 89
60 56 62 68 66 75
46 43 70 54 52 58
47 50 43 59 51 77
ANDHRA PRADESH
Illiterate
76 77 75 82 82 82
Literate but
below middle
48 49 48 57 57 57
Middle but
below matric
36 39 35 44 51 41
Matric but
26 26 27 39 39 39
below graduate
Graduate and 23 26 21 38 47 28
above
ARUNACHAL PRADESH
Illiterate
157 161 153 166 170 162
Literate but
below middle
91 89 93 97 95 99
Middle but
below matric
64 63 64 71 71 75
Matric but
53 44 58 54 52 57
below graduate
Graduate and 68 79 58 74 98 44
above
URBAN
TM F
72 69 77
53 53 53
INDIA
Illiterate
Literate
2001
TOTAL
RURAL
TMF TMF
73 72 74 84 80 89
46 44 46 49 51 52
42 42 43 Literate but
58 59 60 64 61 62
below primary
38 31 43 Primary but
below middle
51 49 50 53 55 56
37 41 34 Middle but
below matric
or secondary
44 46 47 50 47 48
Matric or
36 36 37 38 39 38
secondary but
below graduate
Graduate and 31 30 32 31 31 32
above
ANDHRA PRADESH
50 52 49 Illiterate
57 59 55 62 66 59
36 38 35 Literate
38 40 35 39 42 39
30 32 30 Literate but
47 51 48 53 52 49
below primary
21 21 21 Primary but
below middle
41 45 38 42 46 42
20 23 18 Middle but
below matric
or secondary
39 37 37 39 42 36
Matric or
29 32 28 32 32 30
secondary but
below graduate
Graduate and 21 24 19 26 30 22
above
ARUNACHAL PRADESH
69 70 67 Illiterate
107 111 103 110 114 105
71 73 69 Literate
50 53 51 56 58 54
48 45 48 Literate but
68 71 62 71 73 66
below primary
51 43 58 Primary but
below middle
56 58 53 57 56 55
52 44 58 Middle but
below matric
or secondary
48 47 49 48 47 49
Matric or
47 45 48 49 46 49
secondary but
below graduate
Graduate and 48 44 51 50 46 54
above
URBAN
TMF
57 54 59
36 37 39
48 49 50
45 42 43
40 41 43
34 33 34
31 30 32
44 45 44
30 31 32
38 40 40
37 35 35
33 34 36
29 29 29
18 20 17
62 67 59
45 50 41
61 65 52
56 60 48
46 48 46
35 34 36
35 32 38
| 47

5.8 Page 48

▲back to top


ASSAM
Illiterate
Literate but
below middle
Middle but
below matric
Matric but
below graduate
Graduate and
above
1991
TOTAL
RURAL
TMF TMF
95 90 101 111 115 106
95 95 95 99 99 99
65 68 63 69 72 64
46 44 47 59 56 60
45 42 49 56 59 55
BIHAR
Illiterate
96
Literate but
78
below middle
Middle but
66
below matric
Matric but
56
below graduate
Graduate and 43
above
84 112 99
65 94 84
56 77 75
50 65 60
33 55 58
83 115
72 103
63 89
55 58
41 76
CHHATTISGARH
Illiterate
Literate but
below middle
Middle but
below matric
Matric but
below graduate
Graduate and
above
URBAN
TM F
81 75 84
71 73 73
41 41 46
27 27 30
36 39 34
66 63 74
49 44 55
46 41 50
36 36 72
36 34 38
ASSAM
Illiterate
Literate
2001
TOTAL
RURAL
TMF TMF
73 71 74 83 82 84
43 44 42 44 48 43
Literate but
59 61 57 60 61 58
below primary
Primary but
below middle
51 53 49 52 55 50
Middle but
below matric
or secondary
41 42 40 41 45 40
Matric or
33 35 33 35 35 33
secondary but
below graduate
Graduate and 28 27 28 32 30 34
above
BIHAR
Illiterate
67 62 72 67 62 72
Literate
49 46 49 50 47 54
Literate but
58 55 60 59 56 61
below primary
Primary but
below middle
53 49 53 53 50 56
Middle but
below matric
or secondary
46 43 49 47 47 50
Matric or
41 38 40 43 44 45
secondary but
below graduate
Graduate and 34 32 35 43 39 47
above
CHHATTISGARH
Illiterate
85 90 83 90 92 84
Literate
64 64 61 68 72 67
Literate but
76 80 71 77 81 76
below primary
Primary but
below middle
67 67 62 68 73 67
Middle but
below matric
or secondary
53 57 52 57 58 53
Matric or
41 44 42 48 50 45
secondary but
below graduate
Graduate and 31 34 31 35 39 33
above
URBAN
TMF
59 59 58
35 35 35
48 51 45
42 42 38
38 38 35
31 33 29
27 27 27
57 53 60
35 29 34
49 47 51
42 42 45
38 38 37
32 29 32
27 26 27
72 71 69
43 45 43
59 63 60
52 53 53
46 46 41
38 38 35
30 32 29
48 |

5.9 Page 49

▲back to top


GOA
Illiterate
Literate but
below middle
Middle but
below matric
Matric but
below graduate
Graduate and
above
1991
TOTAL
RURAL
TMF TMF
64 63 67 69 68 69
43 42 45 50 49 48
37 37 40 41 38 46
33 32 34 36 33 45
25 22 27 35 37 24
GUJARAT
Illiterate
90 83 98 95 90 98
Literate but
below middle
70 64 77 82 76 90
Middle but
below matric
59 54 63 70 62 72
Matric but
50 47 58 61 55 67
below graduate
Graduate and 53 45 64
above
HARYANA
Illiterate
83 76 92 87 78 97
Literate but
below middle
63 58 71 66 56 79
Middle but
below matric
44 45 47 59 59 57
Matric but
30 30 29 36 36 25
below graduate
Graduate and 26 26 25 28 29 26
above
URBAN
TM F
52 50 52
37 38 34
GOA
Illiterate
Literate
2001
TOTAL
RURAL
TMF TMF
35 35 31 33 37 31
28 28 27 28 29 27
33 33 33 Literate but
29 29 25 28 27 27
below primary
31 30 34 Primary but
below middle
21 22 20 19 20 20
20 18 25 Middle but
below matric
or secondary
18 19 21 20 16 23
Matric or
15 15 14 16 18 15
secondary but
below graduate
Graduate and 13 17 9 13 16 12
above
GUJARAT
64 58 70 Illiterate
65 66 65 68 70 67
52 49 57 Literate
47 48 46 51 50 52
48 46 49 Literate but
48 45 47 51 47 50
below primary
43 40 49 Primary but
below middle
40 40 42 42 44 43
47 39 49 Middle but
below matric
or secondary
38 36 37 41 39 39
Matric or
35 32 34 36 36 35
secondary but
below graduate
Graduate and 30 30 31 32 31 33
above
HARYANA
61 59 63 Illiterate
77 70 84 80 73 86
46 67 54 Literate
63 61 65 69 66 62
31 31 31 Literate but
70 65 75 72 70 77
below primary
25 25 25 Primary but
below middle
63 59 66 64 63 66
21 23 19 Middle but
below matric
or secondary
56 54 59 60 55 64
Matric or
46 44 49 49 47 52
secondary but
below graduate
Graduate and 24 25 22 26 27 24
above
URBAN
TMF
34 33 32
27 28 27
25 31 23
24 25 23
19 21 19
13 12 14
14 17 9
45 42 46
43 43 43
40 39 39
36 36 38
35 35 34
33 30 32
29 28 31
58 55 60
53 52 55
61 60 63
54 52 60
50 49 51
40 38 43
20 21 18
| 49

5.10 Page 50

▲back to top


1991
TOTAL
RURAL
TMF TMF
HIMACHAL PRADESH
Illiterate
96 101 92 97 102 94
Literate but
below middle
81 84 76 82 86 77
Middle but
below matric
64 67 61 65 67 61
Matric but
48 53 41 51 55 44
below graduate
Graduate and 32 33 30 35 42 35
above
JAMMU & KASHMIR
Illiterate
Literate but
below middle
Middle but
below matric
Matric but
below graduate
Graduate and
above
JHARKHAND
Illiterate
Literate but
below middle
Middle but
below matric
Matric but
below graduate
Graduate and
above
URBAN
TM F
71 73 69
69 70 68
2001
TOTAL
RURAL
TMF TMF
HIMACHAL PRADESH
Illiterate
70 71 68 71 73 70
Literate
52 54 51 55 54 53
53 53 50 Literate but
67 70 64 67 71 64
below primary
40 45 35 Primary but
below middle
53 57 49 53 56 49
27 31 24 Middle but
below matric
or secondary
47 48 44 46 48 44
Matric or
37 37 35 37 37 36
secondary but
below graduate
Graduate and 29 27 29 29 29 28
above
JAMMU & KASHMIR
Illiterate
53 51 75 55 53 53
Literate
39 38 40 40 40 41
Literate but
47 49 47 50 52 49
below primary
Primary but
below middle
45 43 46 45 43 47
Middle but
below matric
or secondary
39 38 41 39 38 41
Matric or
34 34 36 35 34 36
secondary but
below graduate
Graduate and 33 31 34 34 29 37
above
JHARKHAND
Illiterate
62 62 63 64 63 64
Literate
38 40 38 43 46 43
Literate but
48 48 48 52 53 50
below primary
Primary but
below middle
45 43 42 45 48 45
Middle but
below matric
or secondary
40 40 36 43 43 41
Matric or
33 31 32 36 38 36
secondary but
below graduate
Graduate and 28 29 26 29 29 29
above
URBAN
TMF
53 56 51
45 44 46
52 48 52
54 57 50
45 47 46
33 36 33
24 26 22
47 43 47
35 35 36
39 39 36
40 40 43
36 35 40
33 32 35
33 32 33
50 48 51
32 33 29
44 42 41
36 38 38
36 37 31
30 28 29
27 29 25
50 |

6 Pages 51-60

▲back to top


6.1 Page 51

▲back to top


KARNATAKA
Illiterate
Literate but
below middle
Middle but
below matric
Matric but
below graduate
Graduate and
above
1991
TOTAL
RURAL
TMF TMF
93 90 96 98 95 100
67 72 63 75 80 67
50 55 47 59 63 58
43 38 49 52 52 53
39 52 27 29 28 33
KERALA
Illiterate
67 68 66 68 70 67
Literate but
below middle
50 49 50 51 50 52
Middle but
below matric
39 37 41 42 40 45
Matric but
33 32 39 38 32 39
below graduate
Graduate and 32 25 40 31 22 40
above
MADHYA PRADESH
Illiterate
158 151 166 166 159 174
Literate but
below middle
119 115 122 145 146 117
Middle but
below matric
99 93 107 124 115 128
Matric but
90 80 100 121 108 134
below graduate
Graduate and 57 56 60 83 78 91
above
URBAN
TM F
70 67 74
55 58 55
KARNATAKA
Illiterate
Literate
2001
TOTAL
RURAL
TMF TMF
60 63 60 63 66 63
37 35 35 40 42 37
43 51 38 Literate but
45 48 46 47 50 47
below primary
40 37 49 Primary but
below middle
41 43 38 44 46 41
39 52 28 Middle but
below matric
or secondary
35 37 37 42 40 40
Matric or
31 32 30 34 36 32
secondary but
below graduate
Graduate and 23 23 22 23 25 22
above
KERALA
55 54 56 Illiterate
39 38 41 42 40 43
42 35 46 Literate
29 27 32 31 28 33
33 29 37 Literate but
26
below primary
30 27 33 Primary but
24
below middle
33 27 41 Middle but
24
below matric
or secondary
Matric or
22
secondary but
below graduate
Graduate and 20
above
MADHYA PRADESH
111 104 118 Illiterate
98
83 82 88 Literate
76
25 28 27 26 29
24 25 25 25 26
24 26 25 25 26
22 23 24 22 25
18 22 21 19 22
95 101 101 98 104
76 77 89 86 90
58 37 77 Literate but
82 79 84 87 84 85
below primary
76 65 85 Primary but
below middle
70 67 71 76 74 78
53 53 56 Middle but
below matric
or secondary
58 58 60 64 64 64
Matric or
46 45 46 55 55 58
secondary but
below graduate
Graduate and 36 34 38 48 46 50
above
URBAN
TMF
49 48 46
29 29 30
39 40 37
36 35 35
33 31 32
27 28 27
22 22 21
30 29 32
28 27 30
24 22 26
23 21 25
22 21 24
22 21 23
19 16 21
73 71 75
58 55 59
63 63 67
57 56 58
48 49 50
39 39 39
33 32 35
| 51

6.2 Page 52

▲back to top


1991
TOTAL
RURAL
TMF TMF
MAHARASHTRA
Illiterate
93 92 93 102 101 103
Literate but
below middle
68 73 64 75 81 71
Middle but
below matric
46 48 44 54 58 52
Matric but
32 32 30 41 42 39
below graduate
Graduate and
above
MANIPUR
Illiterate
43 40 45 42 4 245
Literate but
below middle
48 46 49 46 44 46
Middle but
below matric
41 54 31 43 55 33
Matric but
30 29 30 34 27 37
below graduate
Graduate and 25 24 27 27 27 27
above
MEGHALAYA
Illiterate
111 113 109 114 117 112
Literate but
below middle
93 94 91 97 99 97
Middle but
below matric
68 70 64 82 85 79
Matric but
52 55 49 66 68 63
below graduate
Graduate and 39 43 35 43 45 40
above
URBAN
TM F
64 66 62
48 52 43
35 39 33
26 28 24
43 44 43
52 36 71
32 33 31
24 25 20
28 21 35
79 81 76
65 66 64
51 57 45
51 46 54
35 38 33
2001
TOTAL
RURAL
TMF TMF
MAHARASHTRA
Illiterate
55 54 53 60 59 57
Literate
46 44 47 49 51 48
Literate but
46 48 46 48 50 49
below primary
Primary but
below middle
37 38 38 43 40 40
Middle but
below matric
or secondary
34 35 36 39 38 37
Matric or
30 30 30 32 31 32
secondary but
below graduate
Graduate and 23 25 24 24 24 26
above
MANIPUR
Illiterate
39 38 39 39 36 39
Literate
30 30 30 30 31 30
Literate but
46 43 45 48 45 49
below primary
Primary but
below middle
36 34 39 36 34 38
Middle but
below matric
or secondary
29 28 30 29 28 28
Matric or
23 23 21 25 25 23
secondary but
below graduate
Graduate and 23 23 24 25 24 26
above
MEGHALAYA
Illiterate
84 86 81 87 90 848
Literate
51 50 49 53 54 54
Literate but
61 61 61 62 65 62
below primary
Primary but
below middle
52 52 52 55 55 55
Middle but
below matric
or secondary
42 42 43 44 45 44
Matric or
33 32 32 38 37 36
secondary but
below graduate
Graduate and 24 23 25 23 18 28
above
URBAN
TMF
44 42 42
39 39 38
37 39 36
32 34 35
31 32 33
27 26 27
23 22 23
37 36 39
28 26 30
31 34 30
38 37 39
34 28 38
20 21 18
20 20 23
59 56 60
35 35 35
48 53 46
43 47 42
41 41 42
25 25 28
23 25 21
52 |

6.3 Page 53

▲back to top


MIZORAM
Illiterate
Literate but
below middle
Middle but
below matric
Matric but
below graduate
Graduate and
above
1991
TOTAL
RURAL
TMF TMF
109 115 102 115 119 110
70 73 62 90 95 84
33 36 30 54 67 42
38 33 44 56 38 71
NAGALAND
Illiterate
76 70 79 77 75 83
Literate but
below middle
68 65 74 69 68 73
Middle but
below matric
50 48 52 46 42 49
Matric but
48 54 43 35 35 28
below graduate
Graduate and
above
ORISSA
Illiterate
120 118 122 124 121 126
Literate but
below middle
118 116 121 119 118 121
Middle but
below matric
99 101 97 142 139 142
Matric but
93 87 94 95 87 100
below graduate
Graduate and 53 58 48 61 60 61
above
URBAN
TM F
72 79 66
46 52 37
25 26 24
33 33 37
69 58 85
62 51 74
54 52 54
57 64 53
94 98 91
87 85 88
90 98 75
50 58 40
41 40 41
MIZORAM
Illiterate
Literate
Literate but
below primary
Primary but
below middle
Middle but
below matric
or secondary
Matric or
secondary but
below graduate
Graduate and
above
NAGALAND
Illiterate
Literate
Literate but
below primary
Primary but
below middle
Middle but
below matric
or secondary
Matric or
secondary but
below graduate
Graduate and
above
ORISSA
Illiterate
Literate
Literate but
below primary
Primary but
below middle
Middle but
below matric
or secondary
Matric or
secondary but
below graduate
Graduate and
above
2001
TOTAL
TMF
81 80 80
34 34 36
50 46 50
38 42 38
29 30 31
22 20 21
17 16 18
54 51 57
37 33 40
42 42 45
44 39 48
38 37 42
31 30 34
30 27 33
92 96 89
60 60 61
69 70 65
58 58 56
48 48 46
37 36 36
30 30 27
RURAL
TMF
82 84 83
44 44 44
52 53 54
42 45 40
34 34 34
28 28 25
23 32 14
54 50 57
38 34 41
43 41 45
44 40 49
39 36 43
33 29 35
35 33 37
96 98 91
62 64 61
70 70 70
59 58 59
48 51 48
37 39 37
29 30 26
URBAN
TMF
56 61 52
29 27 28
43 37 47
34 36 36
29 27 27
20 19 19
16 13 17
51 48 54
32 31 35
39 36 42
43 38 47
40 37 46
28 27 30
24 19 27
71 71 71
48 50 48
58 63 55
50 49 48
42 42 42
33 34 33
28 30 28
| 53

6.4 Page 54

▲back to top


PUNJAB
Illiterate
Literate but
below middle
Middle but
below matric
Matric but
below graduate
Graduate and
above
1991
TOTAL
RURAL
TMF TMF
78 77 78 84 82 88
66 58 74 74 69 77
52 54 52 64 59 61
36 38 33 44 43 44
28 26 30 31 31 30
RAJASTHAN
Illiterate
102 93 109 107 97 118
Literate but
below middle
77 76 78 97 94 102
Middle but
below matric
53 52 53 72 70 75
Matric but
39 38 43 51 49 53
below graduate
Graduate and 37 39 37 46 45 46
above
SIKKIM
Illiterate
85 88 81 85 88 82
Literate but
below middle
58 61 54 61 65 57
Middle but
below matric
52 51 57 55 55 59
Matric but
42 40 42 39 36 42
below graduate
Graduate and
above
URBAN
TM F
51 50 50
47 37 54
38 40 36
29 25 29
26 25 26
70 65 75
56 55 59
44 40 47
38 35 39
35 37 34
80 84 78
42 43 41
37 33 39
48 52 40
PUNJAB
Illiterate
Literate
Literate but
below primary
Primary but
below middle
Middle but
below matric
or secondary
Matric or
secondary but
below graduate
Graduate and
above
RAJASTHAN
Illiterate
Literate
Literate but
below primary
Primary but
below middle
Middle but
below matric
or secondary
Matric or
secondary but
below graduate
Graduate and
above
SIKKIM
Illiterate
Literate
Literate but
below primary
Primary but
below middle
Middle but
below matric
or secondary
Matric or
secondary but
below graduate
Graduate and
above
2001
TOTAL
RURAL
TMF TMF
58 57 59 62 59 61
48 47 49 51 49 54
52 49 52 54 52 54
47 46 49 48 47 53
43 43 43 44 43 45
36 34 37 37 35 39
26 25 28 29 28 29
86 85 88 92 88 94
66 64 67 70 68 72
64 62 68 65 64 70
56 55 57 57 56 62
47 48 51 52 51 52
42 42 41 43 45 42
35 35 35 40 39 40
58 60 57 60 60 61
55 56 54 58 59 57
63 60 62 61 62 64
49 54 46 47 53 43
38 43 37 40 41 39
36 33 42 36 34 41
38 38 39 32 24 40
URBAN
TMF
50 49 52
44 43 44
45 47 44
43 41 44
40 38 39
32 31 33
24 23 24
62 58 65
52 52 55
51 48 53
50 46 51
45 46 46
39 39 39
33 35 32
55 54 57
50 52 48
35 41 31
48 57 43
38 43 29
36 31 41
39 37 39
54 |

6.5 Page 55

▲back to top


TAMIL NADU
Illiterate
Literate but
below middle
Middle but
below matric
Matric but
below graduate
Graduate and
above
1991
TOTAL
RURAL
TMF TMF
81 76 87 85 78 92
59 63 53 64 68 63
44 45 44 59 55 60
40 39 47 50 45 51
39 36 42 42 43 42
TRIPURA
Illiterate
111 112 111 114 113 111
Literate but
below middle
95 111 90 111 105 99
Middle but
below matric
74 73 71 74 73 75
Matric but
66 69 66 64 68 53
below graduate
Graduate and 58 60 57 64 67 61
above
UTTARAKHAND
Illiterate
Literate but
below middle
Middle but
below matric
Matric but
below graduate
Graduate and
above
URBAN
TM F
69 67 70
53 54 53
TAMIL NADU
Illiterate
Literate
2001
TOTAL
RURAL
TMF TMF
63 63 62 64 63 66
53 54 52 56 57 56
37 38 36 Literate but
51 52 54 52 52 56
below primary
35 35 43 Primary but
below middle
49 51 48 50 51 49
38 36 39 Middle but
below matric
or secondary
45 46 44 47 44 48
Matric or
37 37 40 40 40 39
secondary but
below graduate
Graduate and 30 31 30 28 27 28
above
TRIPURA
93 97 93 Illiterate
76 77 74 78 79 75
76 77 75 Literate
60 58 61 62 60 64
62 66 53 Literate but
59 64 59 59 63 58
below primary
70 66 75 Primary but
below middle
48 41 51 51 51 52
51 49 52 Middle but
below matric
or secondary
43 43 43 43 42 43
Matric or
32 33 32 30 33 29
secondary but
below graduate
Graduate and 29 26 33 30 27 34
above
UTTARAKHAND
Illiterate
65 64 66 67 67 68
Literate
49 48 49 50 52 50
Literate but
54 56 56 55 57 54
below primary
Primary but
below middle
48 47 46 48 47 46
Middle but
below matric
or secondary
41 38 40 39 40 39
Matric or
32 34 31 32 36 32
secondary but
below graduate
Graduate and 28 27 28 30 29 32
above
URBAN
TMF
62 60 63
52 53 51
50 52 51
49 47 47
44 45 43
37 37 39
31 32 31
58 65 51
53 53 52
59 58 58
42 43 41
38 37 36
33 31 38
26 23 31
54 53 55
42 42 41
48 49 47
41 43 43
39 39 40
30 30 30
26 25 26
| 55

6.6 Page 56

▲back to top


1991
TOTAL
RURAL
TMF TMF
UTTAR PRADESH
Illiterate
110 101 116 118 108 124
Literate but
103 92 109 113 103 125
below middle
Middle but
below matric
80 73 89 95 85 105
Matric but
63 56 71 78 72 89
below graduate
Graduate and 46 46 49 71 59 81
above
WEST BENGAL
Illiterate
101 97 105 109 105 113
Literate but
below middle
77 71 86 85 80 91
Middle but
below matric
62 57 67 69 67 77
Matric but
54 48 62 64 63 66
below graduate
Graduate and 46 44 49 53 50 57
above
ANANDMAN and NICOBAR ISLANDS
Illiterate
80 82 78 85 88 81
Literate but
below middle
67 73 59 74 83 66
Middle but
below matric
60 50 64 66 62 72
Matric but
40 37 48 52 7 54
below graduate
Graduate and
above
URBAN
TM F
81 73 91
68 64 73
55 55 57
50 44 55
42 39 44
60 55 64
49 41 57
42 38 45
46 39 51
35 33 37
59 56 62
41 40 41
35 36 35
28 21 35
2001
TOTAL
RURAL
TMF TMF
UTTAR PRADESH
Illiterate
81 76 88 86 78 92
Literate
56 52 59 61 58 64
Literate but
68 64 73 70 65 78
below primary
Primary but
below middle
62 61 68 66 62 70
Middle but
below matric
or secondary
58 55 62 59 56 65
Matric or
47 43 48 51 48 52
secondary but
below graduate
Graduate and 38 37 40 45 43 46
above
WEST BENGAL
Illiterate
75 75 75 75 76 75
Literate
58 61 59 60 59 60
Literate but
65 68 66 68 68 65
below primary
Primary but
below middle
59 62 59 61 62 58
Middle but
below matric
or secondary
58 58 55 55 58 52
Matric or
51 50 49 47 50 44
secondary but
below graduate
Graduate and 42 40 45 45 44 47
above
ANANDMAN and NICOBAR ISLANDS
Illiterate
62 62 62 67 68 65
Literate
55 54 55 56 58 54
Literate but
59 60 58 56 61 54
below primary
Primary but
below middle
49 51 51 53 55 49
Middle but
below matric
or secondary
41 43 36 39 41 36
Matric or
39 36 42 37 35 39
secondary but
below graduate
Graduate and 30 32 29 22 20 23
above
URBAN
TMF
60 56 64
43 40 47
54 50 58
52 49 53
47 47 50
39 38 43
36 34 37
56 54 58
56 56 54
61 58 59
54 56 56
58 56 57
51 52 51
50 48 51
52 48 55
50 48 51
57 60 55
48 43 52
41 46 35
43 39 47
35 36 33
56 |

6.7 Page 57

▲back to top


1991
TOTAL
RURAL
TMF TMF
DADRA and NAGAR HAVELI
Illiterate
100 107 91 102 111 94
Literate but
below middle
62 79 41 64 77 43
Middle but
below matric
33 30 36 30 29 33
Matric but
below graduate
Graduate and
above
CHANDIGARH
Illiterate
67 70 65 70 78 64
Literate but
below middle
46 79 40 60 63 56
Middle but
below matric
34 38 29 64 61 70
Matric but
28 28 32 36 36 37
below graduate
Graduate and 27 27 25 37 40 36
above
DAMAN and DIU
Illiterate
99 109 91 104 109 94
Literate but
below middle
55 56 53 54 55 52
Middle but
below matric
47 50 42 34 34 34
Matric but
44 38 51 48 40 51
below graduate
Graduate and
above
URBAN
TM F
48 52 43
62 88 38
2001
TOTAL
RURAL
TMF TMF
DADRA and NAGAR HAVELI
Illiterate
62 64 61 63 69 61
Literate
32 35 29 33 33 33
32 27 40 Literate but
45 45 42 48 43 54
below primary
Primary but
below middle
36 37 30 38 43 33
Middle but
below matric
or secondary
28 23 29 30 33 33
Matric or
28 29 26 28 28 26
secondary but
below graduate
Graduate and 23 30 18 20 24 14
above
CHANDIGARH
67 73 65 Illiterate
67 65 68 73 73 72
42 46 38 Literate
46 44 47 64 64 68
29 33 25 Literate but
55 51 55 66 71 59
below primary
25 27 25 Primary but
below middle
62 63 61 72 72 73
25 27 25 Middle but
below matric
or secondary
55 48 61 62 51 73
Matric or
44 43 45 62 68 57
secondary but
below graduate
Graduate and 27 25 29 33 35 31
above
DAMAN and DIU
83 92 78 Illiterate
56 59 53 57 60 54
56 58 54 Literate
38 40 37 39 41 38
53 55 49 Literate but
42 42 42 43 40 45
below primary
46 41 48 Primary but
below middle
35 44 25 27 36 21
Middle but
below matric
or secondary
30 25 32 27 21 33
Matric or
24 25 24 22 23 22
secondary but
below graduate
Graduate and 24 23 25 23 22 29
above
URBAN
TMF
49 45 53
31 34 23
37 54 20
33 35 29
20 19 24
27 30 27
24 31 17
66 65 68
43 41 44
54 49 55
60 61 57
53 46 57
41 39 44
25 24 25
48 52 44
32 37 27
42 51 38
44 58 28
31 30 32
24 29 21
23 23 23
| 57

6.8 Page 58

▲back to top


DELHI
Illiterate
Literate but
below middle
Middle but
below matric
Matric but
below graduate
Graduate and
above
1991
TOTAL
RURAL
TMF TMF
74 72 77 86 80 92
59 57 60 65 62 69
49 46 49 59 58 59
35 35 35 42 41 45
25 24 25 32 35 31
LAKSHADWEEP
Illiterate
164 213 118 192 227 135
Literate but
below middle
114 122 89 131 188 87
Middle but
below matric
103 114 79 121 159 77
Matric but
below graduate
Graduate and
above
PUDUCHERRY
Illiterate
84 85 84 87 88 87
Literate but
below middle
67 69 64 70 76 65
Middle but
below matric
41 42 40 41 42 40
Matric but
48 49 44 40 45 35
below graduate
Graduate and
above
URBAN
TM F
72 71 74
59 57 60
47 44 47
33 33 35
25 25 26
125 159 91
89 82 93
82 84 88
81 82 81
65 65 63
41 43 39
49 51 46
DELHI
Illiterate
Literate
2001
TOTAL
RURAL
TMF TMF
57 55 55
36 35 37
Literate but
48 48 50
below primary
Primary but
below middle
46 43 46
Middle but
below matric
or secondary
40 41 43
Matric or
33 32 34
secondary but
below graduate
Graduate and 27 26 29
above
LAKSHADWEEP
Illiterate
93 90 95 94 92 97
Literate
56 57 56 55 55 56
Literate but
60 55 65 63 59 65
below primary
Primary but
below middle
48 48 46 47 45 49
Middle but
below matric
or secondary
44 46 44 46 46 46
Matric or
31 29 35 27 31 24
secondary but
below graduate
PUDUCHERRY
Illiterate
54 58 50 57 59 55
Literate
41 42 40 45 44 45
Literate but
49 46 47 47 43 46
below primary
Primary but
below middle
37 38 36 42 42 38
Middle but
below matric
or secondary
34 35 29 33 34 32
Matric or
25 24 25 27 26 27
secondary but
below graduate
Graduate and 24 22 25 20 18 21
above
URBAN
TMF
57 55 55
36 35 37
48 48 51
46 43 46
40 40 42
33 31 34
27 26 29
85 87 82
59 57 59
59 56 63
51 57 42
44 44 43
38 25 51
51 53 49
41 41 40
48 50 46
36 39 37
35 37 28
24 24 25
24 23 26
58 |

6.9 Page 59

▲back to top


Table 9: Infant Mortality Rate (IMR) by Sex, place of Residence and Occupation for States and UTs of India,
1991 and 2001
1991
Q1 TOTAL
RURAL
INDIA
TMF TMF
Total Main
Workers
79 78 79 80 80 80
(a) Cultivators 79 80 80 80 80 80
(b) Agricultural 81 80 81 81 81 82
labourers
(c) Other Main 73 73 74 80 80 79
Workers
(i) Manual
78 78 76 85 84 85
(ii) Non-Manual 52 53 52 60 61 58
Marginal
Workers
87 85 89 8 86 91
Non-Workers 67 67 70 76 74 80
STATE - JAMMU & KASHMIR
Total
Total Main
Workers
(a) Cultivators
(b) Agricultural
labourers
(c) Other Main
Workers
(i) Manual
(ii) Non-Manual
Marginal
Workers
Non-Workers
STATE - HIMACHAL PRADESH
Total
Total Main
Workers
81 86 76 83 87 76
(a) Cultivators 84 88 79 84 88 79
(b) Agricultural 78 73 84 80 74 80
labourers
(c) Other Main 61 67 55 63 68 55
Workers
(i) Manual
76 81 73 76 85 67
(ii) Non-Manual 36 37 35 36 41 35
Marginal
Workers
78 80 74 75 81 74
Non-Workers 64 67 61 67 71 63
URBAN
TM F
60 61 60
67 74 58
67 66 68
58 58 58
62 62 63
44 41 44
65 68 62
48 44 46
2001
TOTAL
RURAL
INDIA
TMF TMF
Total Main
Workers
59 60 58 60 61 59
(a) Cultivators 60 61 60 61 61 60
(b) Agricultural 62 63 61 62 64 61
labourers
(c) Other Main 51 51 50 55 55 55
Workers
(i) Manual
53 54 53 57 57 56
(ii) Non-Manual 37 37 36 42 43 41
Marginal
Workers
63 64 63 64 64 63
Non-Workers 48 48 47 53 53 52
STATE - JAMMU & KASHMIR
Total Main
Workers
58 60 56 58 61 56
(a) Cultivators 64 65 62 64 65 62
(b) Agricultural 62 65 58 62 65 59
labourers
(c) Other Main 52 55 49 51 55 47
Workers
(i) Manual
53 55 51 53 57 50
(ii) Non-Manual 38 41 34 30 34 27
Marginal
Workers
53 52 53 53 53 52
Non-Workers 43 43 43 45 45 44
STATE - HIMACHAL PRADESH
52 55 50 Total Main
Workers
54 57 51 54 57 51
69 77 47 (a) Cultivators 62 66 56 64 67 61
64 78 45 (b) Agricultural 46 48 45 63 69 58
labourers
49 50 49 (c) Other Main 52 54 49 47 49 45
Workers
75 76 74 (i) Manual
28 28 28 54 57 50
32 24 32 (ii) Non-Manual 44 45 43 26 24 29
58 59 58 Marginal
Workers
38 39 36 44 45 43
49 51 45 Non-Workers 54 57 51 38 40 36
URBAN
TMF
43 43 43
52 51 53
53 53 53
42 42 41
45 46 44
31 31 31
49 49 49
39 39 38
50 49 52
54 64 41
49 50 53
50 48 52
51 47 54
43 44 42
44 42 47
38 38 39
42 43 41
57 57 57
39 45 34
39 41 38
43 45 40
31 38 23
29 29 28
37 37 36
| 59

6.10 Page 60

▲back to top


1991
TOTAL
RURAL
PUNJAB
TMF TMF
Total
Total Main
Workers
59 71 49 57 55 59
(a) Cultivators 106 134 71 67 55 78
(b) Agricultural 55 55 56 55 54 57
labourers
(c) Other Main 47 54 39 55 53 55
Workers
(i) Manual
53 61 44 64 67 61
(ii) Non-Manual 32 37 27 46 43 49
Marginal
Workers
76 73 79 77 75 88
Non-Workers 53 52 53 59 59 60
UNION TERRITORY - CHANDIGARH
Total
Total Main
Workers
58 58 57 76 80 71
(a) Cultivators
(b) Agricultural
labourers
(c) Other Main 59 59 59 77 82 71
Workers
(i) Manual
72 73 70 78 81 75
(ii) Non-Manual 48 46 49 57 61 52
Marginal
Workers
Non-Workers 49 49 48 60 66 57
UTTARAKHAND
Total
Total Main
Workers
(a) Cultivators
(b) Agricultural
labourers
(c) Other Main
Workers
(i) Manual
(ii) Non-Manual
Marginal
Workers
Non-Workers
URBAN
TM F
35 34 36
35 32 37
38 39 37
47 49 45
28 29 26
37 34 39
46 44 46
46 44 48
68 69 68
50 44 54
49 52 47
2001
TOTAL
RURAL
PUNJAB
TMF TMF
Total
Total Main
Workers
47 48 46 51 49 51
(a) Cultivators 47 47 48 47 47 48
(b) Agricultural 57 59 55 58 59 56
labourers
(c) Other Main 47 46 49 49 48 51
Workers
(i) Manual
49 49 51 50 49 52
(ii) Non-Manual 35 31 38 38 34 43
Marginal
Workers
51 49 52 52 50 53
Non-Workers 41 40 41 45 44 44
UNION TERRITORY - CHANDIGARH
Total
Total Main
Workers
49 49 50 61 71 50
(a) Cultivators 49 47 50 80 80 79
(b) Agricultural 37 40 35 66 70 64
labourers
(c) Other Main 52 51 52 60 70 51
Workers
(i) Manual
61 64 59 57 51 63
(ii) Non-Manual 41 38 43 52 54 50
Marginal
Workers
49 43 55 56 52 61
Non-Workers 40 40 41 57 64 51
UTTARAKHAND
Total
Total Main
Workers
43 41 44 49 54 45
(a) Cultivators 45 49 43 45 49 42
(b) Agricultural 56 53 55 56 58 55
labourers
(c) Other Main 44 42 46 61 63 60
Workers
(i) Manual
61 64 59 66 70 64
(ii) Non-Manual 40 37 44 45 44 47
Marginal
Workers
46 48 45 47 48 45
Non-Workers 42 43 42 46 47 46
URBAN
TMF
31 31 31
42 30 47
33 31 35
36 35 36
45 46 43
26 27 25
41 39 45
35 33 37
39 39 39
38 38 38
62 65 58
46 41 50
47 46 48
46 47 44
38 35 41
39 37 42
40 36 45
37 34 41
42 43 42
44 49 40
43 46 40
35 35 34
60 |

7 Pages 61-70

▲back to top


7.1 Page 61

▲back to top


1991
TOTAL
RURAL
HARYANA
TMF TMF
Total
Total Main
Workers
58 57 59 59 58 59
(a) Cultivators 52 50 55 52 51 55
(b) Agricultural 69 73 65 70 74 66
labourers
(c) Other Main 55 60 51 59 64 56
Workers
(i) Manual
57 58 55 56 57 55
(ii) Non-Manual 46 60 40 57 59 54
Marginal
Workers
67 66 67 67 68 67
Non-Workers 53 51 56 57 54 60
N.C.T. OF DELHI
Total
Total Main
Workers
53 53 49 53 53 54
(a) Cultivators 50 51 50 49 53 46
(b) Agricultural 67 64 69 57 53 60
labourers
(c) Other Main 53 53 54 60 59 61
Workers
(i) Manual
62 63 61 63 61 63
(ii) Non-Manual 33 33 35 47 47 46
Marginal
Workers
66 64 67 63 67 56
Non-Workers 49 49 49 57 57 57
RAJASTHAN
Total
Total Main
Workers
94 93 94 96 94 98
(a) Cultivators 93 92 93 94 92 95
(b) Agricultural 104 100 109 105 102 109
labourers
(c) Other Main 82 85 82 97 92 102
Workers
(i) Manual
90 89 92 108 102 112
(ii) Non-Manual 56 60 51 66 69 64
Marginal
Workers
90 90 92 91 90 93
Non-Workers 73 70 74 79 76 82
URBAN
TM F
53 49 58
52 43 63
51 54 51
58 61 57
41 44 37
43 37 50
38 37 38
51 51 51
53 41 66
84 87 80
51 53 51
51 51 49
31 30 31
73 57 79
49 47 47
73 70 74
81 82 80
88 81 94
70 68 71
78 76 80
50 53 43
85 80 89
51 50 53
2001
TOTAL
RURAL
HARYANA
TMF TMF
Total
Total Main
Workers
52 49 54 53 51 53
(a) Cultivators 46 47 49 49 48 51
(b) Agricultural 60 58 64 62 64 61
labourers
(c) Other Main 50 55 45 54 52 55
Workers
(i) Manual
54 55 52 53 52 53
(ii) Non-Manual 38 42 36 46 44 48
Marginal
Workers
64 63 65 65 64 65
Non-Workers 51 48 53 47 44 50
N.C.T. OF DELHI
Total
Total Main
Workers
36 34 38
(a) Cultivators 47 45 48
(b) Agricultural 57 57 57
labourers
(c) Other Main 35 33 37
Workers
(i) Manual
44 43 45
(ii) Non-Manual 24 21 27
Marginal
Workers
46 45 47
Non-Workers 39 39 40
RAJASTHAN
Total
Total Main
Workers
68 67 70 69 68 70
(a) Cultivators 69 67 69 68 67 69
(b) Agricultural 75 75 76 75 75 76
labourers
(c) Other Main 65 64 66 68 67 70
Workers
(i) Manual
67 65 68 71 69 73
(ii) Non-Manual 50 53 46 52 57 46
Marginal
Workers
69 67 71 69 67 71
Non-Workers 52 52 53 58 58 59
URBAN
TMF
52 46 57
60 56 65
49 42 54
49 50 47
52 49 54
32 29 35
59 36 41
46 34 37
56 55 57
56 57 54
66 58 75
55 54 56
56 55 57
43 42 45
58 56 59
45 44 45
| 61

7.2 Page 62

▲back to top


1991
TOTAL
RURAL
TMF TMF
UTTAR PRADESH
Total
Total Main
Workers
97 95 99 98 96 101
(a) Cultivators 93 93 95 93 92 95
(b) Agricultural 103 100 107 104 100 108
labourers
(c) Other Main 87 82 91 99 93 104
Workers
(i) Manual
93 86 100 103 96 110
(ii) Non-Manual 67 67 63 86 90 81
Marginal
Workers
102 97 105 103 98 109
Non-Workers 86 81 92 93 87 98
BIHAR
Total
Total Main
Workers
80 71 89 81 72 90
(a) Cultivators 74 69 83 75 67 83
(b) Agricultural 84 74 94 84 74 95
labourers
(c) Other Main 67 64 72 75 67 85
Workers
(i) Manual
77 73 82 84 75 96
(ii) Non-Manual 65 62 68 68 64 71
Marginal
Workers
79 73 86 80 73 86
Non-Workers 66 58 75 69 60 79
SIKKIM
Total
Total Main
Workers
59 60 56 58 59 57
(a) Cultivators 54 54 55 54 54 55
(b) Agricultural 71 77 64 72 75 64
labourers
(c) Other Main 60 62 57 64 66 65
Workers
(i) Manual
85 95 71 89 99 75
(ii) Non-Manual 45 40 46 45 36 52
Marginal
Workers
88 89 86 88 98 91
Non-Workers 51 51 53 53 52 55
URBAN
TM F
71 69 74
81 80 81
97 100 94
64 61 68
72 68 77
54 46 59
75 82 61
58 55 61
54 56 51
67 68 65
60 53 68
56 54 57
62 65 60
46 32 47
64 71 58
48 43 52
47 62 28
44 59 28
43 58 29
46 57 27
99 131 54
46 46 46
2001
TOTAL
RURAL
TMF TMF
UTTAR PRADESH
Total
Total Main
Workers
73 71 76 75 72 78
(a) Cultivators 75 72 78 75 72 78
(b) Agricultural 81 78 83 81 78 83
labourers
(c) Other Main 65 61 67 69 65 72
Workers
(i) Manual
65 62 67 69 66 72
(ii) Non-Manual 47 44 49 59 59 58
Marginal
Workers
73 71 75 74 71 75
Non-Workers 61 59 62 65 64 67
BIHAR
Total
Total Main
Workers
65 62 68 65 62 68
(a) Cultivators 59 55 61 59 55 62
(b) Agricultural 67 65 70 67 65 70
labourers
(c) Other Main 60 58 61 59 58 61
Workers
(i) Manual
59 57 61 58 56 60
(ii) Non-Manual 55 59 51 59 55 63
Marginal
Workers
63 61 66 64 61 66
Non-Workers 52 52 53 54 53 55
SIKKIM
Total
Total Main
Workers
47 48 46 46 46 45
(a) Cultivators 46 46 46 46 46 46
(b) Agricultural 43 38 48 53 48 57
labourers
(c) Other Main 41 49 33 39 45 33
Workers
(i) Manual
42 47 39 40 43 37
(ii) Non-Manual 41 38 43 41 50 32
Marginal
Workers
58 59 56 41 41 42
Non-Workers 40 41 39 40 42 38
URBAN
TMF
51 50 53
68 65 71
68 62 75
49 48 51
51 49 52
39 37 41
59 57 61
46 45 47
48 47 48
51 56 48
56 50 61
54 52 55
56 58 56
42 42 42
55 54 57
40 40 40
45 53 40
47 44 49
65 64 67
39 35 43
41 38 44
38 36 38
62 |

7.3 Page 63

▲back to top


1991
TOTAL
RURAL
TMF TMF
ARUNACHAL PRADESH
Total
Total Main
Workers
97 100 94 100 103 96
(a) Cultivators 104 107 100 105 107 100
(b) Agricultural 76 73 78 77 73 81
labourers
(c) Other Main 69 71 67 81 91 74
Workers
(i) Manual
89 100 77 97 111 81
(ii) Non-Manual 53 49 56 63 62 63
Marginal
Workers
92 92 91 94 96 92
Non-Workers 85 90 81 92 97 87
NAGALAND
Total
Total Main
Workers
55 52 56 56 53 58
(a) Cultivators 57 53 59 56 53 58
(b) Agricultural
labourers
(c) Other Main 44 40 46 44 40 48
Workers
(i) Manual
58 53 63 56 52 61
(ii) Non-Manual 41 38 43 37 38 37
Marginal
Workers
Non-Workers 54 52 53 54 57 45
MANIPUR
Total
Total Main
Workers
32 30 34 33 33 34
(a) Cultivators 34 34 36 35 34 36
(b) Agricultural 34 33 35 33 32 33
labourers
(c) Other Main 31 27 34 32 30 35
Workers
(i) Manual
32 28 35 32 32 31
(ii) Non-Manual 27 23 30 28 24 32
Marginal
Workers
41 42 38 39 38 39
Non-Workers
URBAN
TM F
54 49 59
62 52 73
56 68 45
52 47 56
75 73 76
40 37 44
46 41 50
43 46 40
51 45 56
64 51 73
45 39 46
43 37 46
45 40 48
50 48 53
27 20 31
25 22 29
39 36 42
26 22 31
27 24 30
26 22 30
45 51 37
2001
TOTAL
RURAL
TMF TMF
ARUNACHAL PRADESH
Total
Total Main
Workers
82 84 81 81 82 80
(a) Cultivators 91 92 90 85 87 84
(b) Agricultural 72 68 75 70 65 72
labourers
(c) Other Main 53 56 52 60 61 59
Workers
(i) Manual
66 70 61 67 72 62
(ii) Non-Manual 39 38 41 49 41 57
Marginal
Workers
63 69 58 58 63 52
Non-Workers 55 57 53 53 55 52
NAGALAND
Total
Total Main
Workers
47 43 52 47 43 54
(a) Cultivators 47 43 51 47 43 51
(b) Agricultural 56 50 61 57 46 66
labourers
(c) Other Main 42 38 44 41 38 44
Workers
(i) Manual
54 50 58 54 47 60
(ii) Non-Manual 39 38 40 36 37 34
Marginal
Workers
38 32 45 39 33 45
Non-Workers 31 30 33 31 29 32
MANIPUR
Total
Total Main
Workers
31 30 33 32 31 33
(a) Cultivators 34 33 34 34 33 34
(b) Agricultural 33 31 34 31 30 32
labourers
(c) Other Main 28 25 30 30 28 32
Workers
(i) Manual
30 28 31 31 31 30
(ii) Non-Manual 25 21 28 27 24 30
Marginal
Workers
30 31 29 30 31 28
Non-Workers 27 27 27 28 28 27
URBAN
TMF
39 46 33
53 48 57
50 56 43
34 39 29
47 53 41
28 30 25
43 40 45
41 44 37
44 39 48
58 49 65
53 51 54
40 38 41
41 36 44
33 32 33
38 24 41
35 32 37
25 21 28
24 21 27
36 34 39
24 20 27
24 23 26
25 20 29
33 29 36
25 25 25
| 63

7.4 Page 64

▲back to top


1991
TOTAL
RURAL
MIZORAM
TMF TMF
Total
Total Main
Workers
68 71 64 82 85 77
(a) Cultivators 75 80 71 84 88 81
(b) Agricultural 48 60 37 71 93 51
labourers
(c) Other Main 35 32 36 52 56 49
Workers
(i) Manual
38 35 44 68 60 77
(ii) Non-Manual 35 34 35 42 50 32
Marginal
Workers
47 55 39 77 85 73
Non-Workers 38 40 37 74 79 69
TRIPURA
Total
Total Main
Workers
88 93 82 86 89 79
(a) Cultivators 78 83 73 78 84 73
(b) Agricultural 94 96 91 87 100 85
labourers
(c) Other Main 89 66 80 97 101 92
Workers
(i) Manual
102 111 95 105 116 98
(ii) Non-Manual 63 68 59 71 73 64
Marginal
Workers
95 100 90 95 100 81
Non-Workers 78 82 74 82 87 78
MEGHALAYA
Total
Total Main
Workers
76 77 75 77 79 76
(a) Cultivators 77 77 77 77 77 76
(b) Agricultural 81 86 79 80 84 77
labourers
(c) Other Main 69 71 64 74 78 69
Workers
(i) Manual
77 81 72 77 81 73
(ii) Non-Manual 58 61 53 67 72 60
Marginal
Workers
91 97 85 95 101 89
Non-Workers 70 71 67 80 84 77
URBAN
TM F
35 48 35
35 44 25
35 38 30
31 28 34
26 23 28
32 28 36
30 37 26
25 27 22
69 75 65
40 37 40
75 71 80
69 72 62
88 91 78
52 69 46
89 108 66
62 64 58
58 61 55
74 77 57
81 72 93
54 58 51
70 75 64
46 50 40
48 49 48
50 51 50
MIZORAM
Total
Total Main
Workers
(a) Cultivators
(b) Agricultural
labourers
(c) Other Main
Workers
(i) Manual
(ii) Non-Manual
Marginal
Workers
Non-Workers
TRIPURA
Total
Total Main
Workers
(a) Cultivators
(b) Agricultural
labourers
(c) Other Main
Workers
(i) Manual
(ii) Non-Manual
Marginal
Workers
Non-Workers
MEGHALAYA
Total
Total Main
Workers
(a) Cultivators
(b) Agricultural
labourers
(c) Other Main
Workers
(i) Manual
(ii) Non-Manual
Marginal
Workers
Non-Workers
2001
TOTAL
RURAL
TMF TMF
40 40 40 45 46 45
43 43 43 45 45 45
32 30 35 52 58 45
26 28 24 37 41 32
32 30 35 53 50 57
25 25 24 27 26 29
34 33 34 49 50 47
26 25 27 43 43 44
56 57 54 57 58 56
55 54 55 55 54 55
61 59 63 61 59 63
47 53 41 46 55 37
59 68 50 64 70 58
44 36 52 51 44 55
54 55 53 54 55 52
45 46 42 45 47 44
62 61 62 62 63 63
61 62 61 61 62 61
68 70 67 69 71 68
51 47 54 57 50 64
57 49 66 65 53 78
32 35 29 40 45 36
59 61 58 60 62 59
42 43 42 47 49 45
URBAN
TMF
25 25 24
26 27 25
26 20 31
23 24 22
22 22 20
24 25 23
26 28 24
23 24 20
36 31 41
55 61 50
36 31 42
45 40 48
20 13 29
59 51 67
39 41 37
36 37 35
34 35 34
40 38 45
35 37 33
34 35 33
34 35 33
45 46 43
33 32 34
64 |

7.5 Page 65

▲back to top


1991
TOTAL
RURAL
TMF TMF
ASSAM
Total
Total Main
Workers
73 74 71 73 73 72
(a) Cultivators 65 67 62 65 104 63
(b) Agricultural 81 86 77 82 89 77
labourers
(c) Other Main 83 82 84 80 81 79
Workers
(i) Manual
87 85 88 86 84 90
(ii) Non-Manual 52 53 50 58 60 58
Marginal
Workers
83 83 84 83 83 84
Non-Workers 89 90 86 93 95 91
WEST BENGAL
Total
Total Main
Workers
74 75 72 75 76 74
(a) Cultivators 64 61 66 64 61 66
(b) Agricultural 68 71 63 68 71 63
labourers
(c) Other Main 81 81 81 87 89 86
Workers
(i) Manual
83 84 83 90 91 84
(ii) Non-Manual 76 72 82 90 89 92
Marginal
Workers
78 77 80 78 80 80
Non-Workers 65 63 67 70 67 73
JHARKHAND
Total
Total Main
Workers
(a) Cultivators
(b) Agricultural
labourers
(c) Other Main
Workers
(i) Manual
(ii) Non-Manual
Marginal
Workers
Non-Workers
URBAN
TM F
61 65 56
58 64 66
74 83 64
62 63 59
90 95 78
34 38 28
61 55 65
54 53 56
59 54 64
58 62 66
64 61 65
58 53 65
63 58 68
43 27 56
52 47 74
43 41 47
2001
TOTAL
RURAL
TMF TMF
ASSAM
Total
Total Main
Workers
54 58 50 56 59 53
(a) Cultivators 45 48 42 45 48 42
(b) Agricultural 59 64 53 58 64 53
labourers
(c) Other Main 60 63 57 60 64 56
Workers
(i) Manual
60 64 56 61 65 56
(ii) Non-Manual 41 37 44 44 40 49
Marginal
Workers
50 53 46 50 53 46
Non-Workers 51 55 47 54 57 49
WEST BENGAL
Total
Total Main
Workers
65 69 62 65 69 61
(a) Cultivators 62 60 64 62 59 64
(b) Agricultural 63 68 60 63 68 60
labourers
(c) Other Main 66 69 63 67 71 63
Workers
(i) Manual
65 68 62 66 70 63
(ii) Non-Manual 52 56 48 54 60 49
Marginal
Workers
60 64 56 61 65 57
Non-Workers 57 59 54 57 60 53
JHARKHAND
Total
Total Main
Workers
60 61 58 60 62 58
(a) Cultivators 59 61 57 58 61 56
(b) Agricultural 64 65 62 63 65 61
labourers
(c) Other Main 57 59 54 57 60 54
Workers
(i) Manual
56 59 54 58 61 55
(ii) Non-Manual 42 42 41 42 43 41
Marginal
Workers
58 60 56 57 60 55
Non-Workers 42 43 39 45 48 42
URBAN
TMF
43 47 40
41 45 39
54 62 47
43 46 40
46 50 43
25 27 24
38 41 35
37 40 34
54 57 51
50 52 49
52 55 50
56 51 59
59 54 63
49 45 52
55 57 52
41 40 42
43 45 42
43 41 44
51 49 54
42 45 40
43 45 40
39 40 38
54 56 53
34 35 32
| 65

7.6 Page 66

▲back to top


1991
TOTAL
RURAL
ORISSA
TMF TMF
Total
Total Main
Workers
112 115 108 114 115 113
(a) Cultivators 109 114 101 106 112 101
(b) Agricultural 117 118 114 118 120 114
labourers
(c) Other Main 105 105 104 112 114 111
Workers
(i) Manual
120 110 117 122 116 129
(ii) Non-Manual 73 78 60 77 102 48
Marginal
Workers
112 106 118 111 105 118
Non-Workers 103 103 109 111 109 116
CHHATTISGARH
Total
Total Main
Workers
(a) Cultivators
(b) Agricultural
labourers
(c) Other Main
Workers
(i) Manual
(ii) Non-Manual
Marginal
Workers
Non-Workers
MADHYA PRADESH
Total
Total Main
Workers
115 114 116 116 117 117
(a) Cultivators 106 113 106 109 122 109
(b) Agricultural 123 122 126 125 122 126
labourers
(c) Other Main 112 111 114 127 125 130
Workers
(i) Manual
121 119 122 135 132 138
(ii) Non-Manual 73 74 73 81 88 73
Marginal
Workers
120 117 122 120 118 123
Non-Workers 95 91 99 110 106 115
2001
URBAN
TOTAL
RURAL
TM F
ORISSA
TMF TMF
Total
90 93 87 Total Main
Workers
76 79 72 76 79 73
71 62 87 (a) Cultivators 80 83 77 80 83 77
99 82 121 (b) Agricultural 78 81 74 78 81 74
labourers
70 70 74 (c) Other Main 69 71 66 69 71 67
Workers
71 76 69 (i) Manual
71 74 68 72 75 70
77 58 78 (ii) Non-Manual 53 53 54 54 54 55
110 119 99 Marginal
Workers
74 77 69 74 78 69
73 75 73 Non-Workers 71 73 68 53 55 50
CHHATTISGARH
Total
Total Main
Workers
76 81 72 77 82 71
(a) Cultivators 75 80 71 75 80 71
(b) Agricultural 79 85 75 79 85 75
labourers
(c) Other Main 66 69 63 68 76 59
Workers
(i) Manual
73 76 69 76 86 66
(ii) Non-Manual 47 48 45 46 50 42
Marginal
Workers
73 77 68 73 78 68
Non-Workers 52 55 48 58 62 53
MADHYA PRADESH
Total
90 89 92 Total Main
Workers
87 87 86 88 89 87
78 72 85 (a) Cultivators 83 83 83 83 84 83
97 96 98 (b) Agricultural 93 94 92 93 95 93
labourers
90 89 93 (c) Other Main 79 79 78 88 88 87
Workers
98 97 98 (i) Manual
85 84 84 94 94 93
65 58 72 (ii) Non-Manual 53 52 53 59 59 59
98 103 95 Marginal
Workers
87 87 88 88 88 88
71 66 73 Non-Workers 61 60 60 71 71 71
URBAN
TMF
63 67 60
61 58 67
73 74 71
63 66 59
66 72 60
47 45 48
62 61 63
42 44 40
62 57 66
50 49 51
68 68 68
61 56 67
67 62 72
40 35 46
60 65 55
45 47 42
64 64 63
65 64 66
75 76 74
61 60 61
67 67 67
38 40 36
70 70 70
48 49 47
66 |

7.7 Page 67

▲back to top


1991
TOTAL
RURAL
GUJARAT
TMF TMF
Total
Total Main
Workers
78 74 81 81 75 81
(a) Cultivators 70 68 74 70 68 75
(b) Agricultural 82 80 85 84 81 88
labourers
(c) Other Main 69 67 73 79 73 85
Workers
(i) Manual
77 70 80 85 81 90
(ii) Non-Manual 57 54 59 70 67 76
Marginal
Workers
81 80 87 85 81 88
Non-Workers 58 54 62 70 65 75
UNION TERRITORY - DAMAN & DIU
Total
Total Main
Workers
65 68 63 68 74 58
(a) Cultivators
(b) Agricultural
labourers
(c) Other Main 67 70 65 75 88 71
Workers
(i) Manual
78 80 71 76 81 72
(ii) Non-Manual 64 65 63 68 68 64
Marginal
Workers
52 57 47 51 56 45
Non-Workers 59 64 54 65 71 55
UNION TERRITORY - DADRA & NAGAR HAVELI
Total
Total Main
Workers
75 82 64 77 84 66
(a) Cultivators 75 82 64 77 84 66
(b) Agricultural
labourers
(c) Other Main 57 70 43 66 82 44
Workers
(i) Manual
(ii) Non-Manual 49 60 39 57 71 40
Marginal
Workers
78 84 69 75 85 69
Non-Workers 46 49 42 45 43 44
URBAN
TM F
58 55 57
48 49 46
72 68 87
54 54 55
63 62 64
43 38 46
69 69 67
48 41 49
58 54 53
61 45 64
75 72 72
54 51 60
56 58 54
46 51 44
30 21 39
15 15 20
34 23 47
28 24 42
46 53 34
49 59 36
2001
TOTAL
RURAL
GUJARAT
TMF TMF
Total
Total Main
Workers
48 49 48 49 50 49
(a) Cultivators 47 49 46 47 49 46
(b) Agricultural 52 53 50 52 53 50
labourers
(c) Other Main 46 46 46 49 49 50
Workers
(i) Manual
48 48 48 50 51 51
(ii) Non-Manual 34 32 36 36 34 38
Marginal
Workers
50 52 49 50 52 50
Non-Workers 37 38 36 41 43 40
UNION TERRITORY - DAMAN & DIU
Total
Total Main
Workers
33 35 32 37 37 38
(a) Cultivators 53 56 50 50 53 48
(b) Agricultural 34 36 35 38 40 35
labourers
(c) Other Main 32 34 31 36 35 37
Workers
(i) Manual
41 43 40 46 45 47
(ii) Non-Manual 28 29 27 29 29 30
Marginal
Workers
37 43 33 37 39 35
Non-Workers 30 33 27 29 29 29
UNION TERRITORY - DADRA & NAGAR HAVELI
Total
Total Main
Workers
54 58 51 55 59 51
(a) Cultivators 58 62 54 59 62 55
(b) Agricultural 58 63 51 59 65 53
labourers
(c) Other Main 40 40 39 40 44 35
Workers
(i) Manual
45 44 46 46 46 45
(ii) Non-Manual 33 40 26
Marginal
Workers
59 63 54 60 66 55
Non-Workers 30 35 26 30 33 28
URBAN
TMF
37 37 39
38 42 34
44 41 47
37 36 38
39 38 39
31 29 34
41 42 39
34 35 33
30 34 27
34 29 41
40 45 34
25 29 21
39 40 37
32 38 25
24 20 30
30 21 41
39 32 45
24 21 27
37 43 30
32 38 25
| 67

7.8 Page 68

▲back to top


1991
TOTAL
RURAL
TMF TMF
MAHARASHTRA
Total
Total Main
Workers
68 73 65 69 73 68
(a) Cultivators 60 62 56 60 62 60
(b) Agricultural 77 81 73 77 80 74
labourers
(c) Other Main 58 60 55 62 64 60
Workers
(i) Manual
62 62 60 73 74 72
(ii) Non-Manual 48 55 41 55 62 44
Marginal
Workers
61 63 60 62 64 60
Non-Workers 41 44 39 52 54 49
ANDHRA PRADESH
Total
Total Main
Workers
56 59 52 57 60 54
(a) Cultivators 55 57 53 55 59 53
(b) Agricultural 57 60 52 57 60 54
labourers
(c) Other Main 51 53 49 57 61 53
Workers
(i) Manual
53 55 51 57 60 54
(ii) Non-Manual 44 51 34 56 63 50
Marginal
Workers
61 63 57 61 63 59
Non-Workers 37 41 33 45 48 42
KARNATAKA
Total
Total Main
Workers
70 72 70 72 73 71
(a) Cultivators 65 67 64 65 66 64
(b) Agricultural 74 74 74 74 75 73
labourers
(c) Other Main 62 65 59 72 73 69
Workers
(i) Manual
66 69 66 73 75 70
(ii) Non-Manual 60 62 59 66 68 65
Marginal
Workers
65 68 61 65 68 61
Non-Workers 51 54 48 58 62 55
URBAN
TM F
56 57 54
46 49 40
72 73 71
50 52 47
52 52 49
34 39 30
47 51 45
36 38 33
41 42 41
48 41 54
47 51 45
38 37 39
42 39 45
30 33 27
51 57 43
31 32 29
58 56 61
70 73 66
71 66 77
51 52 53
52 53 52
55 57 52
61 64 58
43 46 40
2001
TOTAL
RURAL
TMF TMF
MAHARASHTRA
Total
Total Main
Workers
44 45 42 45 46 43
(a) Cultivators 41 41 40 41 41 40
(b) Agricultural 49 51 47 49 51 47
labourers
(c) Other Main 35 36 35 40 41 39
Workers
(i) Manual
39 40 38 41 43 39
(ii) Non-Manual 26 26 27 34 34 35
Marginal
Workers
43 45 41 44 45 41
Non-Workers 30 31 29 33 35 31
ANDHRA PRADESH
Total
Total Main
Workers
49 54 46 50 55 47
(a) Cultivators 51 54 46 51 54 46
(b) Agricultural 53 58 49 53 58 49
labourers
(c) Other Main 42 45 37 43 47 39
Workers
(i) Manual
43 47 39 45 49 40
(ii) Non-Manual 34 37 32 36 40 32
Marginal
Workers
51 56 47 52 56 47
Non-Workers 33 35 31 35 39 31
KARNATAKA
Total
Total Main
Workers
48 50 45 50 53 47
(a) Cultivators 50 53 47 50 53 47
(b) Agricultural 58 61 54 58 61 54
labourers
(c) Other Main 35 37 34 37 39 36
Workers
(i) Manual
36 37 34 37 38 35
(ii) Non-Manual 34 35 32 40 42 39
Marginal
Workers
48 51 46 49 52 47
Non-Workers 34 37 32 40 42 36
URBAN
TMF
32 32 33
40 40 41
39 39 40
32 31 32
36 37 37
23 23 24
36 38 33
28 29 28
37 40 34
44 39 48
45 49 41
35 34 35
38 36 41
28 30 25
41 45 37
28 30 26
35 36 34
47 51 44
56 59 53
32 34 31
34 36 33
28 29 27
38 40 36
30 31 28
68 |

7.9 Page 69

▲back to top


1991
TOTAL
RURAL
TMF TMF
GOA
Total
Total Main
Workers
56 56 57 60 61 60
(a) Cultivators 51 52 49 51 53 50
(b) Agricultural 52 60 43 70 74 65
labourers
(c) Other Main 53 53 58 57 58 57
Workers
(i) Manual
64 61 64 67 67 67
(ii) Non-Manual 41 41 38 41 43 37
Marginal
Workers
52 50 54 54 51 57
Non-Workers 36 35 37 54 55 41
UNION TERRITORY - LAKSHADWEEP
Total
Total Main
Workers
79 80 73 85 92 82
(a) Cultivators
(b) Agricultural
labourers
(c) Other Main
Workers
(i) Manual
92 102 86 101 112 93
(ii) Non-Manual
Marginal
Workers
105 68 129 83 41 120
Non-Workers 84 97 78 94 100 79
KERALA
Total
Total Main
Workers
46 43 44 47 48 46
(a) Cultivators 28 31 26 23 24 20
(b) Agricultural 46 48 45 46 50 44
labourers
(c) Other Main 48 44 49 48 51 47
Workers
(i) Manual
43 55 40 54 61 47
(ii) Non-Manual 43 25 55 48 28 53
Marginal
Workers
40 19 36 43 47 37
Non-Workers 35 33 35 36 35 37
2001
URBAN
TOTAL
RURAL
TM F
GOA
TMF TMF
Total
46 45 46 Total Main
Workers
28 31 25 29 32 26
46 57 34 (a) Cultivators 21 19 21 19 19 17
48 47 37 (b) Agricultural 37 45 29 37 47 28
labourers
45 43 45 (c) Other Main 28 30 25 28 30 25
Workers
54 53 54 (i) Manual
29 33 26 29 31 27
37 35 38 (ii) Non-Manual 23 25 20 22 27 18
42 47 37 Marginal
Workers
29 30 29 30 30 29
33 31 33 Non-Workers 19 20 18 18 19 17
UNION TERRITORY - LAKSHADWEEP
Total
67 73 57 Total Main
Workers
45 44 46 40 42 38
(a) Cultivators
(b) Agricultural
labourers
(c) Other Main 45 44 46 40 42 38
Workers
77 88 66 (i) Manual
63 57 74 43 37 48
(ii) Non-Manual 42 46 39 64 73 57
120 90 131 Marginal
Workers
68 50 87 53 52 53
80 83 76 Non-Workers 46 44 49 34 30 39
KERALA
Total
41 30 51 Total Main
Workers
18 17 20 19 17 20
56 50 63 (a) Cultivators 23 20 26 23 21 25
45 28 54 (b) Agricultural 24 23 24 24 23 24
labourers
36 26 38 (c) Other Main 17 15 18 17 16 18
Workers
36 33 37 (i) Manual
19 18 20 20 18 21
36 26 64 (ii) Non-Manual 14 13 15 14 14 15
19 24 14 Marginal
Workers
18 17 20 20 19 21
30 30 34 Non-Workers 18 15 20 17 15 20
URBAN
TMF
28 30 25
34 24 43
36 28 42
27 30 24
30 35 25
23 24 23
29 33 26
20 21 20
50 48 55
50 48 55
71 78 63
28 32 25
82 71 99
39 39 40
16 14 18
18 18 17
21 23 20
18 17 18
16 15 17
16 13 19
14 12 17
17 15 20
| 69

7.10 Page 70

▲back to top


1991
TOTAL
RURAL
TMF TMF
TAMIL NADU
Total
Total Main
Workers
63 59 64 63 61 64
(a) Cultivators 51 46 54 51 46 56
(b) Agricultural 65 64 65 68 71 65
labourers
(c) Other Main 69 65 70 69 69 69
Workers
(i) Manual
67 66 71 71 71 71
(ii) Non-Manual 58 53 56 57 46 62
Marginal
Workers
58 60 56 60 64 59
Non-Workers 47 45 49 55 53 56
UNION TERRITORY - PUDUCHERRY
Total
Total Main
Workers
56 59 54 68 59 53
(a) Cultivators 38 39 36 37 38 36
(b) Agricultural 58 63 55 60 63 56
labourers
(c) Other Main 68 71 63 60 65 54
Workers
(i) Manual
67 66 70 59 66 51
(ii) Non-Manual 69 72 61 61 65 57
Marginal
Workers
67 64 74 68 60 72
Non-Workers 49 52 45 50 53 46
UNION TERRITORY - ANDAMAN & NICOBAR ISLANDS
Total
Total Main
Workers
56 61 51 62 68 57
(a) Cultivators
(b) Agricultural
labourers
(c) Other Main 53 57 49 63 67 57
Workers
(i) Manual
70 81 61 79 92 67
(ii) Non-Manual 35 32 37 38 36 37
Marginal
Workers
57 62 51 58 63 51
Non-Workers 52 53 50 58 60 54
URBAN
TM F
62 58 64
57 78 39
56 51 60
64 61 67
66 60 72
58 65 56
37 35 38
41 41 41
75 75 74
67 70 64
53 61 45
70 70 71
69 66 76
72 80 65
72 68 75
52 52 47
34 34 34
34 34 33
42 45 36
29 28 32
37 31 44
38 38 37
2001
TOTAL
RURAL
TMF TMF
TAMIL NADU
Total
Total Main
Workers
48 48 48 49 49 50
(a) Cultivators 47 44 51 48 46 51
(b) Agricultural 51 51 52 51 51 52
labourers
(c) Other Main 43 45 46 45 46 45
Workers
(i) Manual
45 47 44 46 48 46
(ii) Non-Manual 34 35 33 35 34 37
Marginal
Workers
36 34 37 47 48 46
Non-Workers 40 40 38 39 41 38
UNION TERRITORY - PUDUCHERRY
Total
Total Main
Workers
33 34 34 35 39 32
(a) Cultivators 33 32 34 35 36 34
(b) Agricultural 42 45 38 40 45 35
labourers
(c) Other Main 38 36 39 33 35 30
Workers
(i) Manual
30 32 27 25 25 24
(ii) Non-Manual 25 18 33 21 25 18
Marginal
Workers
33 34 32 41 46 36
Non-Workers 26 28 24 26 28 23
UNION TERRITORY - ANDAMAN & NICOBAR ISLANDS
Total
Total Main
Workers
42 50 34 44 54 35
(a) Cultivators 57 66 47 57 67 47
(b) Agricultural
labourers
(c) Other Main 36 44 28 36 43 27
Workers
(i) Manual
40 45 35 44 60 29
(ii) Non-Manual 32 30 33 28 27 26
Marginal
Workers
44 45 42 45 45 44
Non-Workers 39 38 38 38 40 36
URBAN
TMF
43 44 43
47 41 53
54 54 53
41 43 39
44 45 42
33 36 31
46 45 46
40 40 39
31 28 35
48 53 43
30 27 33
32 36 28
26 16 37
21 16 25
25 27 23
28 31 26
31 32 30
34 35 32
28 25 30
30 27 34
35 34 35
70 |

8 Pages 71-80

▲back to top


8.1 Page 71

▲back to top


Table 10: Child Mortality Rate (CMR) by Sex, place of Residence and Occupation for States and UTs of India,
1991 and 2001
1991
TOTAL
RURAL
INDIA
TMF TMF
Total Main
Workers
93 92 95 94 94 95
(a) Cultivators 99 94 104 99 96 104
(b) Agricultural 104 99 109 105 100 110
labourers
(c) Other Main 85 85 86 97 99 97
Workers
(i) Manual
96 93 98 103 100 107
(ii) Non-Manual 64 65 64 79 76 83
Marginal
Workers
103 97 108 104 102 107
Non-Workers 77 73 82 91 87 95
JAMMU & KASHMIR
Total
Total Main
Workers
(a) Cultivators
(b) Agricultural
labourers
(c) Other Main
Workers
(i) Manual
(ii) Non-Manual
Marginal
Workers
Non-Workers
HIMACHAL PRADESH
Total
Total Main
Workers
109 115 104 111 116 102
(a) Cultivators 112 117 107 112 117 107
(b) Agricultural 136 132 139 130 132 117
labourers
(c) Other Main 77 83 71 86 87 79
Workers
(i) Manual
98 110 95 104 109 82
(ii) Non-Manual 51 53 47 62 63 59
Marginal
Workers
103 109 96 97 110 96
Non-Workers 80 83 77 83 87 79
URBAN
TM F
76 73 76
86 98 72
96 93 99
70 70 74
82 78 85
51 49 51
88 84 92
55 52 58
64 67 62
91 99 90
80 100 57
61 58 61
97 98 96
37 43 37
73 72 74
59 62 57
2001
TOTAL
RURAL
INDIA
TMF TMF
Total Main
Workers
64 65 66 69 67 67
(a) Cultivators 66 67 68 69 67 68
(b) Agricultural 71 69 72 71 69 72
labourers
(c) Other Main 56 53 55 60 61 63
Workers
(i) Manual
59 59 61 65 62 64
(ii) Non-Manual 39 39 38 47 48 46
Marginal
Workers
71 69 74 72 69 74
Non-Workers 53 51 52 58 55 60
JAMMU & KASHMIR
Total Main
Workers
60 63 58 62 64 59
(a) Cultivators 66 67 65 66 67 65
(b) Agricultural 62 65 58 64 66 61
labourers
(c) Other Main 54 56 51 53 57 50
Workers
(i) Manual
54 57 53 55 58 52
(ii) Non-Manual 40 43 37 32 35 29
Marginal
Workers
55 54 56 54 54 54
Non-Workers 45 44 46 46 46 47
HIMACHAL PRADESH
Total Main
Workers
59 63 56 60 62 56
(a) Cultivators 65 69 60 68 70 65
(b) Agricultural 49 49 48 65 70 61
labourers
(c) Other Main 58 57 54 50 52 48
Workers
(i) Manual
30 28 30 59 62 55
(ii) Non-Manual 49 48 48 25 28 32
Marginal
Workers
40 41 38 49 48 48
Non-Workers 59 63 56 40 42 38
URBAN
TMF
45 46 48
58 57 58
62 62 62
44 44 43
50 51 49
33 32 34
54 54 56
41 40 41
54 51 56
56 63 50
53 53 54
52 51 53
54 50 57
45 46 44
46 42 48
39 39 40
44 45 42
60 58 59
41 47 36
41 43 39
45 47 46
35 40 29
33 34 33
37 37 36
| 71

8.2 Page 72

▲back to top


1991
TOTAL
RURAL
PUNJAB
TMF TMF
Total
Total Main
Workers
75 87 70 85 79 90
(a) Cultivators 103 95 111 107 99 115
(b) Agricultural 91 90 92 92 90 94
labourers
(c) Other Main 55 68 48 69 67 71
Workers
(i) Manual
69 77 51 80 83 77
(ii) Non-Manual 37 42 32 41 34 51
Marginal
Workers
104 95 107 105 97 108
Non-Workers 65 64 66 75 72 75
UNION TERRITORY - CHANDIGARH
Total
Total Main
Workers
59 56 59 104 119 86
(a) Cultivators
(b) Agricultural
labourers
(c) Other Main 59 57 61 106 130 86
Workers
(i) Manual
94 95 92 120 139 105
(ii) Non-Manual 32 26 34 42 46 37
Marginal
Workers
Non-Workers 59 59 46 60 68 59
UTTARAKHAND
Total
Total Main
Workers
(a) Cultivators
(b) Agricultural
labourers
(c) Other Main
Workers
(i) Manual
(ii) Non-Manual
Marginal
Workers
Non-Workers
URBAN
TM F
40 39 45
43 39 46
45 47 41
56 57 55
31 34 31
41 39 44
54 52 58
54 52 60
90 85 91
35 28 35
46 50 42
2001
TOTAL
RURAL
PUNJAB
TMF TMF
Total
Total Main
Workers
52 51 53 53 52 54
(a) Cultivators 49 49 50 50 49 50
(b) Agricultural 60 63 58 61 60 62
labourers
(c) Other Main 49 47 52 52 50 54
Workers
(i) Manual
52 51 53 53 52 55
(ii) Non-Manual 38 34 42 40 36 44
Marginal
Workers
53 52 55 54 53 56
Non-Workers 42 41 43 47 46 47
UNION TERRITORY - CHANDIGARH
Total
Total Main
Workers
57 56 58 63 74 52
(a) Cultivators 50 50 52 82 81 82
(b) Agricultural 40 42 37 70 75 66
labourers
(c) Other Main 57 56 58 64 71 58
Workers
(i) Manual
64 66 64 63 55 68
(ii) Non-Manual 45 43 46 57 56 57
Marginal
Workers
53 47 57 64 60 68
Non-Workers 44 43 45 59 65 56
UTTARAKHAND
Total
Total Main
Workers
53 56 50 52 56 53
(a) Cultivators 50 54 51 50 54 50
(b) Agricultural 64 61 66 65 67 66
labourers
(c) Other Main 55 56 57 63 65 62
Workers
(i) Manual
64 67 62 69 72 67
(ii) Non-Manual 42 39 45 46 44 48
Marginal
Workers
52 53 52 52 52 52
Non-Workers 45 46 44 51 49 53
URBAN
TMF
35 34 36
44 39 50
40 43 38
41 41 41
46 48 45
29 28 29
44 41 47
36 35 37
46 47 46
47 47 46
65 66 64
49 47 52
49 48 50
48 48 49
40 37 43
47 46 48
52 49 56
37 34 41
47 46 47
46 50 43
49 48 49
37 35 36
72 |

8.3 Page 73

▲back to top


1991
TOTAL
RURAL
HARYANA
TMF TMF
Total
Total Main
Workers
87 81 94 95 87 104
(a) Cultivators 87 81 92 86 81 92
(b) Agricultural 91 95 87 92 98 87
labourers
(c) Other Main 67 72 61 70 78 62
Workers
(i) Manual
93 94 93 107 108 106
(ii) Non-Manual 54 76 46 70 91 47
Marginal
Workers
102 92 114 103 93 115
Non-Workers 68 63 69 78 70 87
N.C.T. OF DELHI
Total
Total Main
Workers
65 65 63 86 81 90
(a) Cultivators 63 63 61 61 65 53
(b) Agricultural 83 80 89 69 65 76
labourers
(c) Other Main 65 65 66 83 80 87
Workers
(i) Manual
90 89 90 95 93 97
(ii) Non-Manual 38 38 39 55 55 58
Marginal
Workers
109 99 122 116 88 151
Non-Workers 56 57 61 73 70 77
RAJASTHAN
Total
Total Main
Workers
131 124 139 136 128 144
(a) Cultivators 134 127 143 135 127 143
(b) Agricultural 144 1638 151 146 139 153
labourers
(c) Other Main 109 105 115 133 123 144
Workers
(i) Manual
126 117 136 149 139 163
(ii) Non-Manual 68 72 64 81 85 79
Marginal
Workers
134 125 144 135 125 144
Non-Workers
URBAN
TM F
66 58 73
64 50 79
63 66 63
74 74 73
48 52 42
53 42 61
43 42 45
63 63 63
65 49 88
112 116 106
63 65 63
61 63 61
36 35 36
95 108 104
56 55 59
95 92 97
109 111 109
115 104 126
87 84 92
103 98 110
57 65 50
114 109 124
2001
TOTAL
RURAL
HARYANA
TMF TMF
Total
Total Main
Workers
58 55 60 59 56 62
(a) Cultivators 52 50 55 53 52 54
(b) Agricultural 68 63 72 68 67 70
labourers
(c) Other Main 56 61 50 60 58 63
Workers
(i) Manual
59 61 58 62 60 65
(ii) Non-Manual 40 43 38 51 49 52
Marginal
Workers
71 69 74 75 72 77
Non-Workers 56 51 60 53 49 55
N.C.T. OF DELHI
Total
Total Main
Workers
38 36 40
(a) Cultivators 53 48 56
(b) Agricultural 60 58 61
labourers
(c) Other Main 37 35 39
Workers
(i) Manual
49 48 49
(ii) Non-Manual 26 54 28
Marginal
Workers
52 50 54
Non-Workers 42 41 43
RAJASTHAN
Total
Total Main
Workers
75 73 78 77 74 80
(a) Cultivators 76 74 77 77 76 77
(b) Agricultural 84 82 87 84 84 85
labourers
(c) Other Main 70 70 71 76 72 81
Workers
(i) Manual
78 80 76 79 74 84
(ii) Non-Manual 52 53 51 61 63 57
Marginal
Workers
77 72 81 77 73 81
Non-Workers 57 54 61 64 62 67
URBAN
TMF
54 48 59
64 59 70
55 47 61
50 52 49
54 52 57
34 32 35
43 39 46
38 35 40
60 58 62
63 63 63
75 67 83
60 58 61
62 60 65
45 44 46
66 65 67
48 46 50
| 73

8.4 Page 74

▲back to top


1991
TOTAL
RURAL
TMF TMF
UTTAR PRADESH
Total
Total Main
Workers
136 140 149 141 144 156
(a) Cultivators 131 128 143 132 126 143
(b) Agricultural 153 142 171 155 144 173
labourers
(c) Other Main 117 111 129 144 135 151
Workers
(i) Manual
130 117 145 147 135 163
(ii) Non-Manual 83 83 79 116 125 109
Marginal
Workers
147 137 160 149 138 161
Non-Workers
BIHAR
Total
Total Main
Workers
108 92 124 109 94 126
(a) Cultivators 100 87 114 101 88 114
(b) Agricultural 115 98 133 115 98 133
labourers
(c) Other Main 90 81 95 99 85 112
Workers
(i) Manual
97 96 110 110 99 139
(ii) Non-Manual 53 49 58 59 52 66
Marginal
Workers
114 100 130 115 100 131
Non-Workers 82 69 97 88 74 104
SIKKIM
Total
Total Main
Workers
86 88 84 88 91 87
(a) Cultivators 95 96 94 94 96 93
(b) Agricultural 93 101 86 88 96 86
labourers
(c) Other Main 76 78 73 80 82 78
Workers
(i) Manual
113 132 93 117 137 77
(ii) Non-Manual 52 45 58 52 41 64
Marginal
Workers
125 137 124 125 136 109
Non-Workers
URBAN
TM F
94 89 110
110 106 113
132 129 138
83 78 89
95 87 103
39 39 47
98 112 78
66 68 63
89 86 86
93 77 111
55 67 44
64 81 64
41 37 44
81 93 73
59 51 64
54 74 33
51 71 33
50 70 34
53 69 31
145 187 70
2001
TOTAL
RURAL
TMF TMF
UTTAR PRADESH
Total
Total Main
Workers
81 79 86 86 80 91
(a) Cultivators 86 80 91 87 84 90
(b) Agricultural 91 86 96 91 86 96
labourers
(c) Other Main 72 66 75 79 73 85
Workers
(i) Manual
73 67 78 80 74 85
(ii) Non-Manual 49 46 52 62 61 64
Marginal
Workers
84 79 88 84 79 89
Non-Workers 66 62 72 73 69 79
BIHAR
Total
Total Main
Workers
70 64 76 70 64 76
(a) Cultivators 64 58 70 64 58 70
(b) Agricultural 72 67 78 72 67 78
labourers
(c) Other Main 65 64 67 65 64 69
Workers
(i) Manual
67 62 72 66 61 71
(ii) Non-Manual 58 60 57 62 60 64
Marginal
Workers
69 64 77 69 64 77
Non-Workers 58 54 61 59 56 63
SIKKIM
Total
Total Main
Workers
54 55 53 53 54 53
(a) Cultivators 53 56 53 53 53 53
(b) Agricultural 51 46 56 55 52 59
labourers
(c) Other Main 46 51 38 44 47 40
Workers
(i) Manual
49 54 48 50 52 46
(ii) Non-Manual 42 40 45 44 52 38
Marginal
Workers
59 60 59 49 49 49
Non-Workers 46 45 46 47 49 45
URBAN
TMF
53 52 55
73 67 76
76 67 85
53 50 56
55 51 59
40 39 42
64 63 65
49 47 52
61 57 62
57 58 60
72 68 76
56 54 56
59 60 61
43 42 44
61 60 62
43 42 43
52 60 46
***
***
49 47 52
67 66 69
42 38 46
43 41 46
41 39 43
74 |

8.5 Page 75

▲back to top


1991
TOTAL
RURAL
TMF TMF
ARUNACHAL PRADESH
Total
Total Main
Workers
167 150 161 171 179 165
(a) Cultivators 178 186 171 180 188 171
(b) Agricultural 109 102 116 112 104 121
labourers
(c) Other Main 108 110 107 127 129 120
Workers
(i) Manual
128 147 123 139 158 133
(ii) Non-Manual 65 57 72 79 78 85
Marginal
Workers
178 178 176 180 182 177
Non-Workers 157 161 153 166 170 162
NAGALAND
Total
Total Main
Workers
67 64 72 68 65 72
(a) Cultivators 69 65 75 68 65 74
(b) Agricultural
labourers
(c) Other Main 51 45 58 51 45 58
Workers
(i) Manual
64 51 79 68 52 89
(ii) Non-Manual 48 43 49 42 43 42
Marginal
Workers
Non-Workers 66 64 65 66 69 53
MANIPUR
Total
Total Main
Workers
37 35 39 38 38 39
(a) Cultivators 39 39 41 40 39 40
(b) Agricultural 39 38 40 38 37 38
labourers
(c) Other Main 30 26 34 32 29 33
Workers
(i) Manual
31 27 35 31 31 31
(ii) Non-Manual 26 22 30 33 28 37
Marginal
Workers
48 50 45 46 43 47
Non-Workers 42 41 42 40 45 49
2001
URBAN
TOTAL
RURAL
TM F
TMF TMF
ARUNACHAL PRADESH
Total
66 57 75 Total Main
Workers
87 89 86 96 98 95
78 64 95 (a) Cultivators 96 97 98 102 103 101
53 84 52 (b) Agricultural 79 75 84 83 74 90
labourers
64 55 72 (c) Other Main 57 58 57 70 69 71
Workers
97 76 104 (i) Manual
70 73 66 75 79 72
47 37 58 (ii) Non-Manual 42 40 44 54 49 59
53 36 72 Marginal
Workers
69 73 66 72 75 72
69 70 67 Non-Workers 57 60 55 63 65 60
NAGALAND
Total
63 53 72 Total Main
Workers
47 43 52 49 45 54
80 62 101 (a) Cultivators 47 43 51 48 45 52
(b) Agricultural 62 57 68 59 48 67
labourers
52 44 59 (c) Other Main 46 44 49 43 40 47
Workers
50 42 58 (i) Manual
56 50 60 56 49 62
52 45 56 (ii) Non-Manual 41 39 42 43 42 43
Marginal
Workers
42 37 49 42 38 47
62 56 65 Non-Workers 31 30 33 32 30 34
MANIPUR
Total
31 24 36 Total Main
Workers
42 41 42 43 43 43
29 26 34 (a) Cultivators 42 39 44 41 40 43
44 41 49 (b) Agricultural 43 42 44 43 42 44
labourers
27 18 36 (c) Other Main 38 40 38 43 42 44
Workers
31 20 44 (i) Manual
38 38 38 44 43 45
20 15 24 (ii) Non-Manual 37 39 34 35 40 30
52 59 45 Marginal
Workers
32 33 32 32 31 32
48 39 48 Non-Workers 28 28 29 30 31 29
URBAN
TMF
49 53 45
64 56 71
60 64 57
42 46 39
57 63 53
34 35 32
54 48 58
48 51 45
45 40 49
63 53 71
56 53 58
42 40 43
43 40 47
35 34 35
40 35 44
37 34 39
32 31 33
32 27 36
38 36 43
32 32 31
26 25 28
35 33 37
36 33 41
27 27 26
| 75

8.6 Page 76

▲back to top


1991
TOTAL
RURAL
MIZORAM
TMF TMF
Total
Total Main
Workers
87 87 93 110 114 105
(a) Cultivators 97 102 93 112 117 109
(b) Agricultural 59 72 39 93 136 48
labourers
(c) Other Main 40 37 43 64 68 61
Workers
(i) Manual
43 35 53 90 72 105
(ii) Non-Manual 40 39 40 49 59 37
Marginal
Workers
66 71 60 105 114 95
Non-Workers 62 66 58 96 101 91
TRIPURA
Total
Total Main
Workers
116 122 110 107 110 105
(a) Cultivators 106 112 101 106 113 101
(b) Agricultural 130 134 127 117 138 116
labourers
(c) Other Main 108 148 106 134 138 128
Workers
(i) Manual
158 167 132 161 172 143
(ii) Non-Manual 79 84 75 87 95 75
Marginal
Workers
132 138 126 132 138 127
Non-Workers 106 96 102 110 116 106
MEGHALAYA
Total
Total Main
Workers
103 98 103 101 103 99
(a) Cultivators 102 105 100 102 14 100
(b) Agricultural 109 115 109 107 102 111
labourers
(c) Other Main 85 88 82 96 100 91
Workers
(i) Manual
103 108 103 105 110 101
(ii) Non-Manual 70 76 65 83 89 76
Marginal
Workers
120 136 121 133 140 125
Non-Workers 91 92 90 109 109 108
URBAN
TM F
MIZORAM
Total
40 56 40 Total Main
Workers
40 52 29 (a) Cultivators
40 43 32 (b) Agricultural
labourers
36 32 39 (c) Other Main
Workers
30 27 33 (i) Manual
37 32 41 (ii) Non-Manual
35 42 30 Marginal
Workers
41 47 22 Non-Workers
TRIPURA
Total
91 97 87 Total Main
Workers
47 42 47 (a) Cultivators
181 177 216 (b) Agricultural
labourers
85 94 78 (c) Other Main
Workers
125 129 105 (i) Manual
64 69 58 (ii) Non-Manual
117 145 88 Marginal
Workers
78 80 74 Non-Workers
MEGHALAYA
Total
73 76 73 Total Main
Workers
96 100 111 (a) Cultivators
103 94 123 (b) Agricultural
labourers
66 70 63 (c) Other Main
Workers
92 97 86 (i) Manual
58 58 48 (ii) Non-Manual
60 65 60 Marginal
Workers
62 63 62 Non-Workers
2001
TOTAL
RURAL
TMF TMF
44 45 44 51 50 52
47 48 47 50 50 52
39 39 40 59 67 49
28 30 25 39 43 35
34 32 37 59 58 61
27 27 26 32 30 31
43 42 44 54 55 52
31 29 32 53 51 54
61 62 60 60 62 58
60 59 61 59 59 58
67 64 69 67 64 69
54 58 49 55 62 48
68 74 61 70 76 65
49 46 54 54 48 60
59 60 58 59 60 57
49 51 47 51 52 50
67 68 67 71 72 70
69 71 69 69 71 69
77 80 74 77 81 75
55 54 55 62 60 64
62 57 68 72 65 80
39 42 36 49 55 44
69 70 67 70 71 72
49 49 50 57 58 56
URBAN
TMF
29 29 28
31 31 30
29 26 33
25 26 24
24 25 23
26 27 25
30 29 34
27 26 32
41 39 43
***
62 71 54
41 39 44
53 50 56
***
62 56 69
42 44 40
40 41 39
46 46 46
50 46 53
37 41 35
38 39 36
38 40 35
52 55 48
35 34 37
76 |

8.7 Page 77

▲back to top


1991
TOTAL
RURAL
ASSAM
TMF TMF
Total
Total Main
Workers
100 101 99 102 113 100
(a) Cultivators 87 90 85 97 167 84
(b) Agricultural 123 123 124 110 118 104
labourers
(c) Other Main 112 112 111 112 118 110
Workers
(i) Manual
125 125 123 125 126 123
(ii) Non-Manual 65 66 62 74 72 74
Marginal
Workers
113 114 111 113 114 112
Non-Workers 124 126 118 131 134 128
WEST BENGAL
Total
Total Main
Workers
96 97 94 97 98 96
(a) Cultivators 82 81 83 82 80 83
(b) Agricultural 90 93 85 90 93 85
labourers
(c) Other Main 109 110 109 120 118 122
Workers
(i) Manual
111 113 111 118 120 120
(ii) Non-Manual 98 88 110 127 118 137
Marginal
Workers
112 110 114 106 102 108
Non-Workers 84 80 89 97 93 102
JHARKHAND
Total
Total Main
Workers
(a) Cultivators
(b) Agricultural
labourers
(c) Other Main
Workers
(i) Manual
(ii) Non-Manual
Marginal
Workers
Non-Workers
URBAN
TM F
77 81 72
73 79 68
96 112 86
78 79 75
118 117 111
41 44 35
77 69 81
68 67 69
66 64 66
73 104 44
80 73 87
65 65 85
79 70 90
51 32 72
89 82 96
56 48 57
2001
TOTAL
RURAL
ASSAM
TMF TMF
Total
Total Main
Workers
60 63 58 62 63 61
(a) Cultivators 53 53 52 53 53 52
(b) Agricultural 69 75 64 68 75 62
labourers
(c) Other Main 65 66 65 68 71 64
Workers
(i) Manual
68 69 66 69 70 67
(ii) Non-Manual 42 39 46 45 42 49
Marginal
Workers
57 58 55 57 58 55
Non-Workers 56 58 55 59 60 58
WEST BENGAL
Total
Total Main
Workers
74 75 71 74 78 70
(a) Cultivators 68 71 69 68 64 71
(b) Agricultural 73 77 69 73 77 69
labourers
(c) Other Main 72 75 70 75 79 70
Workers
(i) Manual
72 74 70 74 78 69
(ii) Non-Manual 55 59 50 60 65 54
Marginal
Workers
69 70 68 69 70 68
Non-Workers 62 62 63 66 65 65
JHARKHAND
Total
Total Main
Workers
65 64 66 66 67 65
(a) Cultivators 65 66 64 65 66 64
(b) Agricultural 70 70 70 70 71 69
labourers
(c) Other Main 61 62 59 64 66 62
Workers
(i) Manual
63 65 62 66 66 65
(ii) Non-Manual 44 45 44 47 48 47
Marginal
Workers
64 65 63 64 65 63
Non-Workers 44 43 44 50 51 50
URBAN
TMF
45 48 42
47 49 44
56 64 50
44 47 42
49 52 47
26 27 25
44 45 44
39 41 37
62 65 58
59 62 56
64 67 62
61 65 58
64 69 60
52 49 54
60 62 57
44 42 45
46 48 44
45 41 49
59 57 63
45 47 43
48 50 47
40 41 39
60 58 61
35 36 34
| 77

8.8 Page 78

▲back to top


1991
TOTAL
RURAL
ORISSA
TMF TMF
Total
Total Main
Workers
168 171 163 170 171 169
(a) Cultivators 165 171 156 162 167 156
(b) Agricultural 172 174 169 174 176 169
labourers
(c) Other Main 152 154 154 167 170 167
Workers
(i) Manual
184 165 182 187 174 200
(ii) Non-Manual 95 101 76 87 113 60
Marginal
Workers
167 154 181 148 153 181
Non-Workers 154 150 162 167 159 179
CHHATTISGARH
Total
Total Main
Workers
(a) Cultivators
(b) Agricultural
labourers
(c) Other Main
Workers
(i) Manual
(ii) Non-Manual
Marginal
Workers
Non-Workers
MADHYA PRADESH
Total
Total Main
Workers
178 177 182 180 181 182
(a) Cultivators 162 160 162 154 173 159
(b) Agricultural 179 172 197 196 173 203
labourers
(c) Other Main 173 168 177 200 196 204
Workers
(i) Manual
183 183 189 210 206 220
(ii) Non-Manual 97 98 96 124 124 97
Marginal
Workers
185 190 179 185 182 192
Non-Workers 134 129 144 154 153 176
URBAN
TM F
127 131 123
93 78 109
145 112 188
92 92 115
139 116 163
104 71 106
164 178 143
97 99 99
131 130 134
126 124 128
161 156 161
132 130 135
142 142 143
83 71 94
138 129 148
93 83 99
2001
TOTAL
RURAL
ORISSA
TMF TMF
Total
Total Main
Workers
81 84 77 82 84 81
(a) Cultivators 84 85 82 84 85 83
(b) Agricultural 84 86 82 84 86 82
labourers
(c) Other Main 74 76 71 75 76 74
Workers
(i) Manual
78 79 76 80 82 78
(ii) Non-Manual 54 55 53 59 59 59
Marginal
Workers
81 83 77 80 83 77
Non-Workers 56 58 54 60 60 59
CHHATTISGARH
Total
Total Main
Workers
84 86 80 83 87 79
(a) Cultivators 83 85 79 83 85 80
(b) Agricultural 88 92 86 88 93 85
labourers
(c) Other Main 71 74 68 79 84 75
Workers
(i) Manual
80 82 77 87 94 80
(ii) Non-Manual 51 53 50 56 60 52
Marginal
Workers
81 82 79 81 83 79
Non-Workers 57 58 53 65 67 62
MADHYA PRADESH
Total
Total Main
Workers
95 92 97 96 97 98
(a) Cultivators 92 89 94 92 89 94
(b) Agricultural 105 102 106 104 103 107
labourers
(c) Other Main 84 84 86 99 96 101
Workers
(i) Manual
93 90 95 105 103 107
(ii) Non-Manual 62 55 56 69 67 72
Marginal
Workers
98 95 101 99 96 102
Non-Workers 66 63 68 79 76 82
URBAN
TMF
65 68 62
66 62 70
80 82 77
64 67 62
69 74 65
49 47 51
69 68 70
44 44 45
66 62 69
59 57 60
77 77 76
64 61 67
72 70 75
42 39 46
68 73 63
47 49 45
69 69 68
74 73 77
86 88 88
66 63 66
72 72 75
40 42 38
78 78 81
50 51 52
78 |

8.9 Page 79

▲back to top


1991
TOTAL
RURAL
TMF TMF
GUJARAT
Total
Total Main
Workers
98 93 107 106 96 111
(a) Cultivators 92 84 95 92 85 96
(b) Agricultural 110 102 118 111 103 122
labourers
(c) Other Main 87 82 98 106 97 119
Workers
(i) Manual
97 92 108 112 1001 124
(ii) Non-Manual 69 66 75 89 85 98
Marginal
Workers
112 102 122 114 103 124
Non-Workers 70 65 78 91 81 97
UNION TERRITORY - DAMAN & DIU
Total
Total Main
Workers
81 84 79 90 96 74
(a) Cultivators
(b) Agricultural
labourers
(c) Other Main 87 87 83 97 96 93
Workers
(i) Manual
100 102 99 104 110 100
(ii) Non-Manual 82 81 86 84 84 86
Marginal
Workers
74 69 59 63 68 57
Non-Workers 75 80 70 91 91 92
DADRA & NAGAR HAVELI
Total
Total Main
Workers
97 111 86 99 113 88
(a) Cultivators 97 111 86 99 113 88
(b) Agricultural
labourers
(c) Other Main 69 83 50 82 104 51
Workers
(i) Manual
(ii) Non-Manual 61 72 46 68 87 47
Marginal
Workers
100 112 91 103 114 91
Non-Workers 53 57 49 52 51 51
2001
URBAN
TOTAL
RURAL
TM F
TMF TMF
GUJARAT
Total
70 67 73 Total Main
Workers
51 52 53 52 53 55
5 556 53 (a) Cultivators 50 52 49 50 52 49
93 83 105 (b) Agricultural 57 58 56 57 58 56
labourers
66 66 68 (c) Other Main 48 48 48 52 52 55
Workers
79 78 80 (i) Manual
50 50 53 53 54 56
50 44 56 (ii) Non-Manual 34 32 36 38 36 40
85 86 84 Marginal
Workers
53 54 54 53 55 55
57 49 62 Non-Workers 40 38 39 43 45 45
UNION TERRITORY - DAMAN & DIU
Total
74 66 65 Total Main
Workers
36 37 34 39 42 40
(a) Cultivators 55 59 52 53 56 50
(b) Agricultural 43 48 38 44 52 41
labourers
77 56 89 (c) Other Main 34 36 31 38 37 37
Workers
97 94 100 (i) Manual
36 38 32 38 40 39
66 59 76 (ii) Non-Manual 30 31 27 31 34 32
68 71 68 Marginal
Workers
45 48 43 47 47 47
58 59 51 Non-Workers 33 36 30 35 35 34
UNION TERRITORY - DADRA & NAGAR HAVELI
Total
35 26 46 Total Main
Workers
59 63 59 60 64 60
18 18 25 (a) Cultivators 67 67 63 67 67 64
(b) Agricultural 60 63 57 62 65 58
labourers
39 28 59 (c) Other Main 42 42 42 45 49 38
Workers
(i) Manual
48 48 46 51 52 45
33 29 49 (ii) Non-Manual 25 30 23 26 37 12
53 65 39 Marginal
Workers
64 66 63 66 69 63
56 71 41 Non-Workers 33 37 31 36 38 33
URBAN
TMF
40 39 41
41 42 39
49 44 52
39 38 40
44 40 44
32 29 34
46 45 44
34 35 36
26 33 21
***
***
28 32 20
27 36 18
27 31 21
42 60 25
34 38 28
30 29 35
35 50 19
2**
34 26 43
39 32 45
24 13 35
40 31 50
32 38 27
| 79

8.10 Page 80

▲back to top


1991
TOTAL
RURAL
TMF TMF
MAHARASHTRA
Total
Total Main
Workers
91 95 86 91 96 88
(a) Cultivators 85 83 86 76 78 74
(b) Agricultural 102 108 97 102 109 98
labourers
(c) Other Main 72 74 68 78 79 75
Workers
(i) Manual
84 86 84 97 98 95
(ii) Non-Manual 52 57 50 68 80 54
Marginal
Workers
84 84 84 85 84 86
Non-Workers 49 53 45 64 67 61
ANDHRA PRADESH
Total
Total Main
Workers
68 72 64 81 82 80
(a) Cultivators 79 79 79 79 79 79
(b) Agricultural 81 83 79 82 83 80
labourers
(c) Other Main 69 71 66 80 81 77
Workers
(i) Manual
73 74 71 80 82 78
(ii) Non-Manual 58 63 55 68 80 59
Marginal
Workers
96 96 96 97 97 97
Non-Workers 38 52 26 57 65 64
KARNATAKA
Total
Total Main
Workers
98 94 101 101 97 105
(a) Cultivators 96 92 99 96 92 99
(b) Agricultural 107 103 110 107 103 110
labourers
(c) Other Main 78 83 75 92 94 91
Workers
(i) Manual
89 87 91 94 97 92
(ii) Non-Manual 76 77 72 83 84 87
Marginal
Workers
94 93 95 95 94 96
Non-Workers 65 67 66 77 79 70
URBAN
TM F
68 70 66
54 59 47
95 96 94
60 64 57
75 78 74
41 46 37
65 65 65
43 45 40
56 56 55
59 49 66
59 62 52
52 52 51
59 59 59
35 38 32
63 72 50
27 37 22
79 76 82
92 97 86
106 102 110
72 70 75
80 74 85
68 71 66
80 80 79
53 55 50
2001
TOTAL
RURAL
TMF TMF
MAHARASHTRA
Total
Total Main
Workers
50 51 48 51 52 49
(a) Cultivators 47 44 45 47 44 45
(b) Agricultural 58 57 56 58 57 56
labourers
(c) Other Main 38 39 37 46 44 44
Workers
(i) Manual
44 45 43 47 48 45
(ii) Non-Manual 26 26 27 37 36 38
Marginal
Workers
48 51 46 49 51 47
Non-Workers 33 31 31 35 37 36
ANDHRA PRADESH
Total
Total Main
Workers
56 60 52 57 61 56
(a) Cultivators 57 57 52 57 57 52
(b) Agricultural 59 64 58 59 64 58
labourers
(c) Other Main 48 48 43 49 53 45
Workers
(i) Manual
49 53 45 51 55 46
(ii) Non-Manual 36 39 37 42 45 38
Marginal
Workers
57 62 56 58 63 56
Non-Workers 36 38 36 41 45 37
KARNATAKA
Total
Total Main
Workers
53 55 50 56 59 56
(a) Cultivators 55 59 52 56 59 52
(b) Agricultural 66 66 63 66 67 63
labourers
(c) Other Main 40 42 39 42 44 41
Workers
(i) Manual
40 42 39 41 43 40
(ii) Non-Manual 36 37 34 45 47 44
Marginal
Workers
54 57 55 55 58 56
Non-Workers 37 39 38 45 45 42
URBAN
TMF
35 35 35
43 43 44
48 44 48
34 34 34
41 42 42
23 23 24
41 43 38
28 29 30
40 43 40
47 47 50
51 52 47
38 42 39
43 43 40
32 30 31
46 51 43
34 32 33
37 38 39
50 54 49
64 65 61
35 36 33
39 41 38
28 29 29
43 45 43
33 34 31
80 |

9 Pages 81-90

▲back to top


9.1 Page 81

▲back to top


1991
TOTAL
RURAL
TMF TMF
GOA
Total
Total Main
Workers
68 68 67 76 73 77
(a) Cultivators 63 64 61 63 64 62
(b) Agricultural 85 92 77 92 96 87
labourers
(c) Other Main 64 64 68 73 70 73
Workers
(i) Manual
80 77 80 89 83 89
(ii) Non-Manual 48 49 45 48 51 42
Marginal
Workers
64 58 70 66 63 73
Non-Workers 41 40 44 66 67 47
UNION TERRITORY - LAKSHADWEEP
Total
Total Main
Workers
101 109 95 122 124 118
(a) Cultivators
(b) Agricultural
labourers
(c) Other Main
Workers
(i) Manual
129 144 122 157 168 138
(ii) Non-Manual
Marginal
Workers
161 84 205 111 49 191
Non-Workers 129 135 106 135 147 147
KERALA
Total
Total Main
Workers
55 52 57 55 59 53
(a) Cultivators 33 36 31 28 29 25
(b) Agricultural 61 57 65 62 59 65
labourers
(c) Other Main 55 52 58 60 62 56
Workers
(i) Manual
56 68 47 66 76 57
(ii) Non-Manual 47 24 41 50 55 44
Marginal
Workers
47 24 41 50 55 44
Non-Workers 43 40 44 54 42 47
2001
URBAN
TOTAL
RURAL
TM F
GOA
TMF TMF
Total
53 53 53 Total Main
Workers
20 21 17 20 22 19
53 69 39 (a) Cultivators 24 21 24 22 23 23
60 55 42 (b) Agricultural 35 41 29 36 43 28
labourers
52 51 57 (c) Other Main 19 20 16 19 20 17
Workers
66 65 66 (i) Manual
21 24 20 22 24 20
42 40 45 (ii) Non-Manual 13 13 10 12 15 9
49 55 44 Marginal
Workers
21 22 22 21 21 21
38 36 38 Non-Workers 19 20 21 20 21 19
UNION TERRITORY - LAKSHADWEEP
Total
83 95 73 Total Main
Workers
47 49 46 45 49 40
(a) Cultivators * * * * * *
(b) Agricultural * * * * * *
labourers
(c) Other Main 47 49 46 45 49 40
Workers
105 117 88 (i) Manual
66 66 71 55 52 57
(ii) Non-Manual 32 44 21 57 94 16
190 119 205 Marginal
Workers
73 62 87 72 73 74
107 112 104 Non-Workers 46 45 49 46 44 48
KERALA
Total
49 35 63 Total Main
Workers
20 19 21 21 20 22
68 58 83 (a) Cultivators 24 22 26 24 23 25
54 33 66 (b) Agricultural 28 28 27 28 29 27
labourers
41 31 45 (c) Other Main 17 15 18 18 18 18
Workers
41 38 43 (i) Manual
22 20 23 22 20 23
24 29 19 (ii) Non-Manual 16 15 17 17 16 18
24 29 19 Marginal
Workers
21 20 22 23 23 22
39 34 41 Non-Workers 20 17 23 20 17 23
URBAN
TMF
18 20 17
38 26 50
24 5 41
17 20 16
22 25 19
13 14 13
21 21 19
21 21 20
47 50 50
***
***
47 50 50
84 78 124
30 34 27
76 50 107
47 46 47
16 14 18
19 18 20
26 28 24
18 17 18
18 17 18
18 15 20
16 15 18
20 17 22
| 81

9.2 Page 82

▲back to top


1991
TOTAL
RURAL
TMF TMF
TAMIL NADU
Total
Total Main
Workers
83 78 88 95 80 91
(a) Cultivators 74 67 81 74 66 82
(b) Agricultural 80 83 87 88 92 87
labourers
(c) Other Main 85 81 92 85 85 91
Workers
(i) Manual
89 82 93 92 87 93
(ii) Non-Manual 73 65 72 69 54 78
Marginal
Workers
83 76 92 85 80 95
Non-Workers 59 55 61 67 65 72
UNION TERRITORY - PUDUCHERRY
Total
Total Main
Workers
87 86 88 84 92 87
(a) Cultivators 43 44 41 46 43 41
(b) Agricultural 94 95 93 94 96 90
labourers
(c) Other Main 84 87 85 76 81 70
Workers
(i) Manual
89 82 92 71 82 63
(ii) Non-Manual 85 94 77 77 81 73
Marginal
Workers
89 80 96 88 82 94
Non-Workers 61 64 57 61 68 63
UNION TERRITORY - ANDAMAN & NICOBAR ISLANDS
Total
Total Main
Workers
68 73 63 78 84 69
(a) Cultivators
(b) Agricultural
labourers
(c) Other Main 65 69 61 79 83 73
Workers
(i) Manual
92 103 77 107 122 89
(ii) Non-Manual 40 37 44 43 41 44
Marginal
Workers
107 105 110 109 106 112
Non-Workers 64 65 62 70 73 70
2001
URBAN
TOTAL
RURAL
TM F
TMF TMF
TAMIL NADU
Total
78 70 86 Total Main
Workers
56 56 56 57 57 58
73 100 46 (a) Cultivators 54 51 60 54 52 59
68 63 76 (b) Agricultural 60 60 63 60 60 63
labourers
80 73 89 (c) Other Main 48 49 50 53 54 52
Workers
82 72 94 (i) Manual
53 54 52 54 55 54
70 81 70 (ii) Non-Manual 36 37 35 40 41 41
42 40 43 Marginal
Workers
55 56 57 55 56 57
49 49 48 Non-Workers 45 43 43 44 46 46
UNION TERRITORY - PUDUCHERRY
Total
97 97 96 Total Main
Workers
41 43 41 46 50 45
83 86 86 (a) Cultivators 60 53 66 67 55 78
96 92 105 (b) Agricultural 54 57 53 52 57 50
labourers
92 92 93 (c) Other Main 34 33 34 33 36 30
Workers
91 82 98 (i) Manual
39 42 36 33 37 32
94 102 87 (ii) Non-Manual 29 23 33 28 33 26
94 84 103 Marginal
Workers
47 48 46 56 57 50
64 60 59 Non-Workers 34 35 32 34 36 31
UNION TERRITORY - ANDAMAN & NICOBAR ISLANDS
Total
39 39 39 Total Main
Workers
47 52 42 49 59 43
(a) Cultivators 59 69 53 59 69 53
(b) Agricultural 18 14 22 18 19 19
labourers
39 39 38 (c) Other Main 41 48 35 42 48 33
Workers
49 53 43 (i) Manual
47 52 44 48 62 37
34 33 37 (ii) Non-Manual 38 43 31 34 34 33
42 36 51 Marginal
Workers
54 52 52 54 52 54
43 43 43 Non-Workers 44 43 44 46 47 44
URBAN
TMF
48 49 47
53 47 59
62 63 62
46 48 44
51 53 49
35 36 33
54 53 54
45 43 44
35 34 39
9 22 2
57 56 63
34 33 37
41 45 38
28 21 35
36 31 38
31 32 31
42 44 39
***
***
42 44 39
45 48 62
38 48 29
33 48 23
42 42 47
82 |

9.3 Page 83

▲back to top


9.4 Page 84

▲back to top


84 |