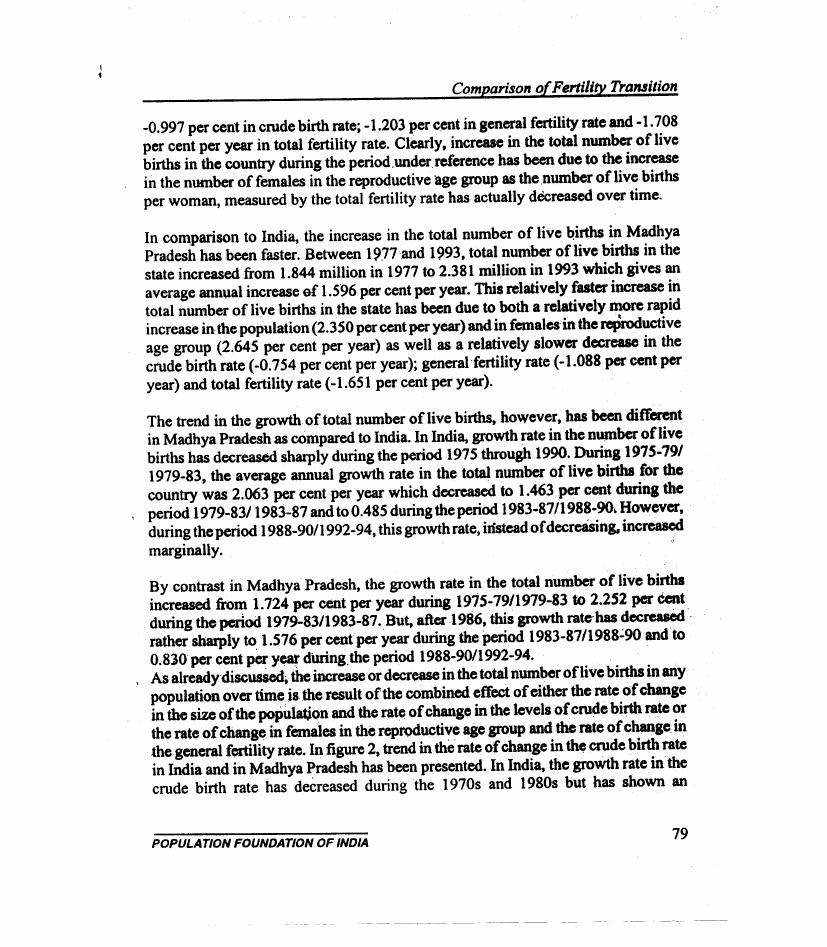
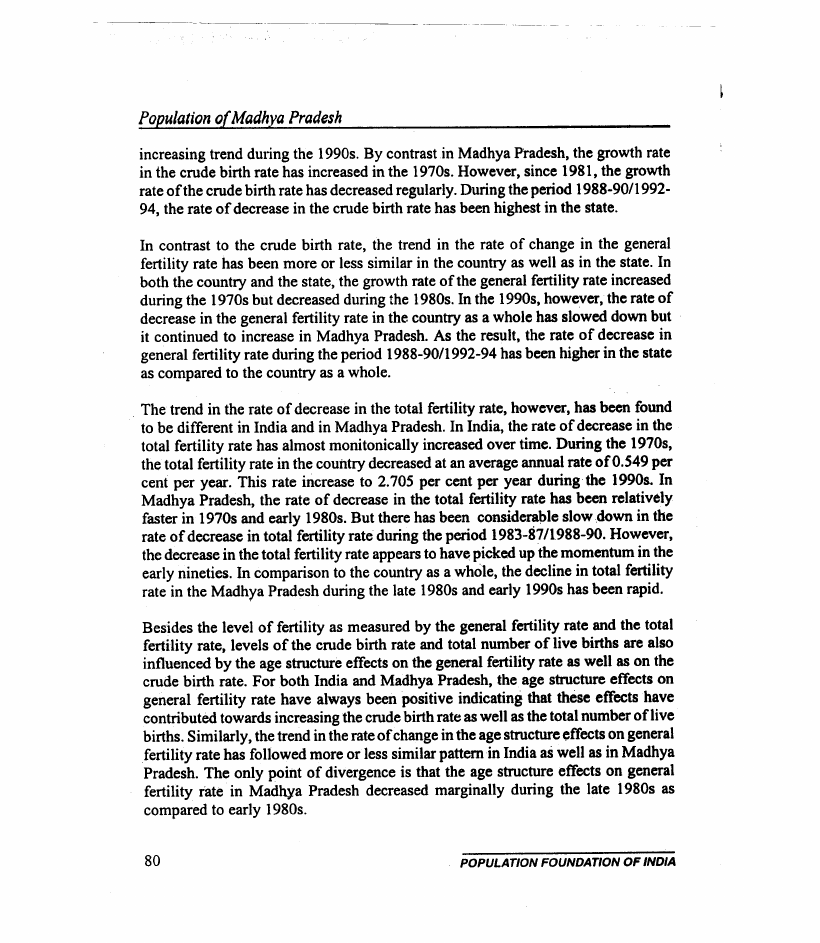
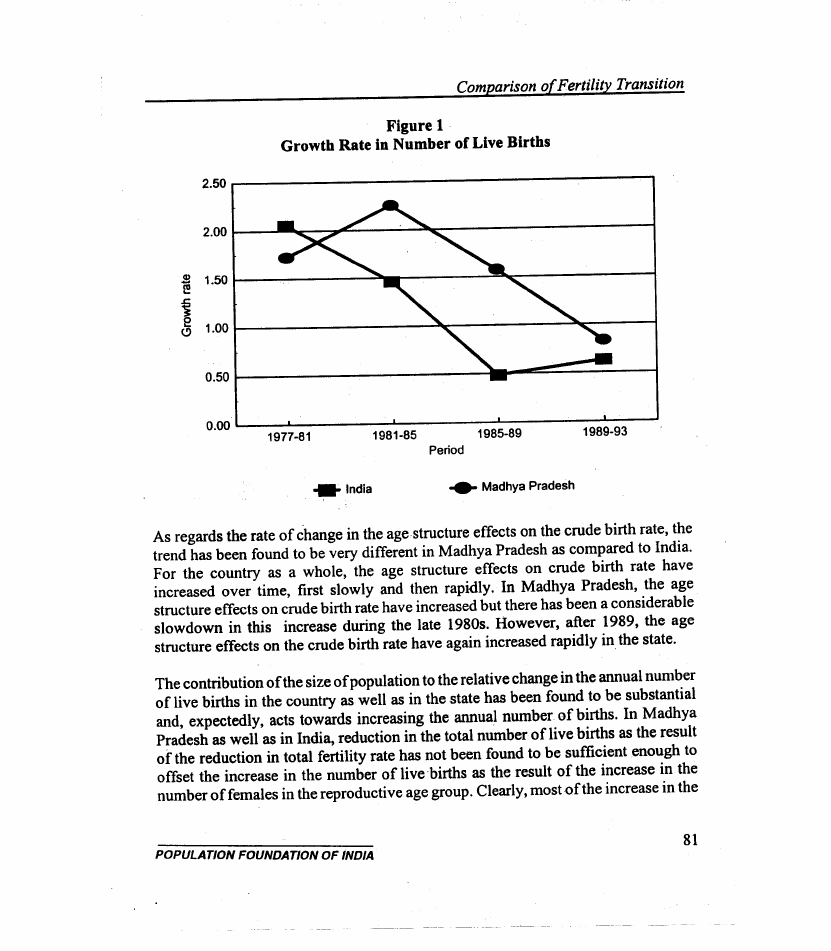
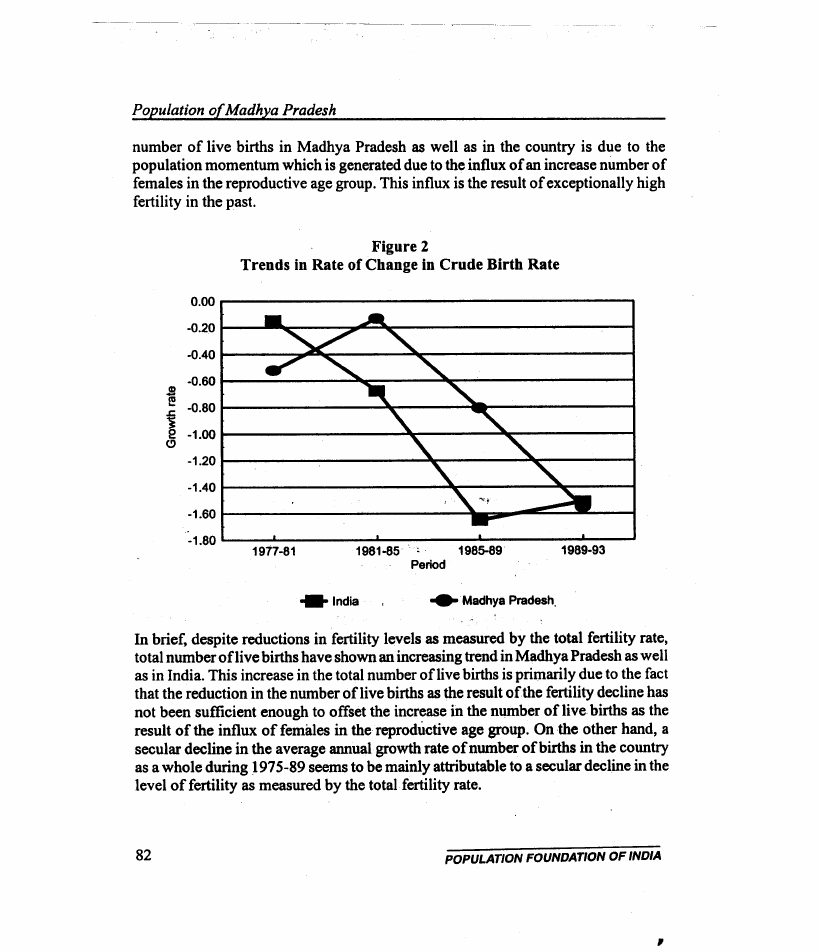
Monograph Series 2

Monograph Series 2


1 Pages 1-10

▲back to top


1.1 Page 1

▲back to top


Alok Ranjan
POPULATION FOUNDATION OF INDIA
New Delhi
1999

1.2 Page 2

▲back to top


Studies in
Population of
Madhya Pradesh
Alok Ranjan
I-
II ~
!
A.t
POPULATION FOUNDATION
8-28, Tara Crescent,
Qutab Institutional Area. New Delhi
Phones: 685 6805, 686 7080 - 81
OF INDIA

1.3 Page 3

▲back to top


1 Population growth in Madhya Pradesh
1
2
Population distribution in Madhya Pradesh
17
3
Transition in number of live births in Madhya Pradesh: 1981-91
37
4
Prospects of fertility decline in Madhya Pradesh
59
5
A comparison of fertility transition in India and Madhya Pradesh 75
6
Prevalence of contraception in Madhya Pradesh
89
7
Maternal mortality in Madhya Pradesh
107
8
Analysis of patterns and changes in labour force in Madhya
141
Pradesh: 1981-91
9
Urbanization in Madhya Pradesh: Results of 1991 population
157
census
10 Demography and development in Madhya Pradesh
175

1.4 Page 4

▲back to top


The Population Foundation of India is happy to publish as the second
issue in its Monograph series, this book entitled "Studies in Population of
Madhya Pradesh" written by Dr Alok Ranjan, Honorary Director, 'Shyam'
Institute, Datia, Madhya Pradesh.
Dr Alok Ranjan has prepared this Monograph on the Population of
Madhya Pradesh taking account of the recently available information on a
number of demographic and social parameters at the district level brought out
by the Registrar General of India and also on some economic variables specially
compiled for the computation of Human Development Index at the district level
by the Government of Madhya Pradesh.
This book attempts to study the population of Madhya Pradesh from the
perspectives of growth and distribution, fertility and mortality levels, family
planning acreptance, maternal mortality and reproductive health, labour force
and urbanisation. He has also developed some indexes of demographic and
socio-economic conditions and ranked the districts according to their
developmental levels.
Madhya Pradesh is one of the five States in the Hindi heartland of the
country which have been lagging behind the rest of the country in almost all
aspects of dev~lopment. On the three indexes of social development calculated
by the Population Foundation of India based on data for 1991census for the
sixteen large States in the country, Madhya Pradesh ranks 14 in terms of Human
Development Index~with only Uttar Pradesh and Bihar below it. It ranks at the
bottom on the Gender Related Health index, implying very low status of women

1.5 Page 5

▲back to top


vis-a-vis men with strong gender differences in the health; and it again ranks 14
on Reproductive Health Index, just a shade better than Uttar Pradesh and
Rajasthan. Madhya Pradesh is indeed one of the least developed states in the
country.
However, very recently, the State has shown considerable progress in
adult literacy, democratic decentralisation and political commitment to social
development. It is hoped that with these strengths, the State will surge ahead in
the coming years in terms of economic and social development.
This book is a timely publication presenting various aspects of
demographic, economic and social conditions of the population of Madhya
Pradesh at the district level.
" The Population Foundation of India is happy to publish this volume in its
Monograph series and is thankful to Dr Alok Ranjan for preparing this volum~
in a readable and cogent manner.
28.7.1999
New Delhi
Dr K Srinivasan
Executive Director

1.6 Page 6

▲back to top


Popu_ation Growth in
Madhya Pradesh
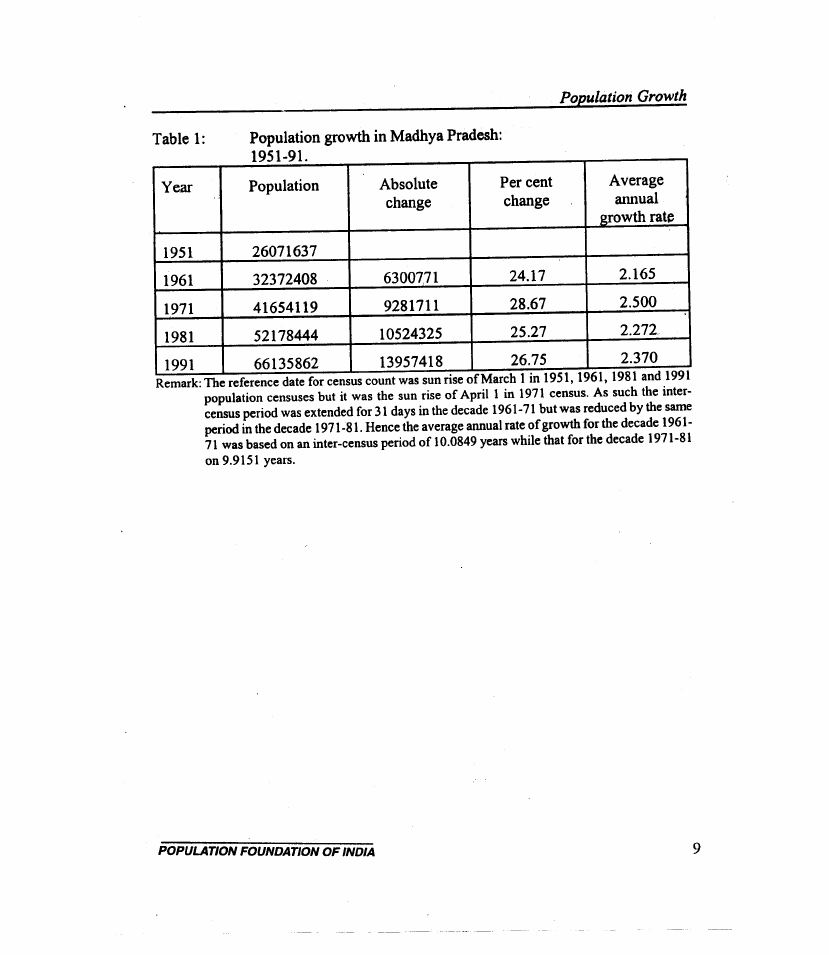
Madhya Pradesh is one pfthose states of Republic of India which is known for rapid
population.growth right since Independence. At Ute time of 1951 populatie>ncensus,
the population of the state was enumerated to be 26.072 million which increased to
66.136 million by 1991. This means that, over a period of 40 years, the population
of the state increased by about 2.5 times. In terms of net addition, more than 40
million people have been added to the population of the state in between 1951 and
1991. During the decade 1951..61, 6.301 million ,people wer~ added to the population
of the state. During the decade· 1961-71, this nUlIlber increased to 9.28~ million;
during 1971-81 to 10.524 million; and during 1981-91 13.957 million people were
added to the population of the state. If this trend continues then; it is estimated that '
during the decade 1991-200 1, 17.69 million people will bead4ed to-the population
of the state. This means that a Haryana of today will bea4dedto ,theexistipg
population ofthe state ina period often years.
. .'.
~e Intertnsof~verage annual rate of growth, the population oftb.e.tateincr~e<i ~t
rate of2.327per cent per year during the period 1951-91. Thisrateishi8heCthant4e
- averageatmual population growth rate of2.122 perceJjltf9rtheco~tryas ~whQle
during the same period.
"
...
Growth of population, however, has notbecn unifonn.,~t was most rapid- during t4e'
decade 1961-71 when the population of the slate increased at an atmua1 average

1.7 Page 7

▲back to top


Population o/Madhya Pradesh
Figure 1
Population Growth in Madhya Pradesh
'2 50
.2
§. 40
:cS:
i 30
~
11111111111.
illlllll' II1I1I1111
1
11111111 11111
IIIIIIIIII!
1961
1Q7t·
YElar .
growth rate of25 per' cent per year. Duringtlie decade 1981-91, ~.was·a sharp
drop in the rate'but it increasedagaiq during the decade 1981-91 ·toa level of2.370
per cent per year j,.
c,
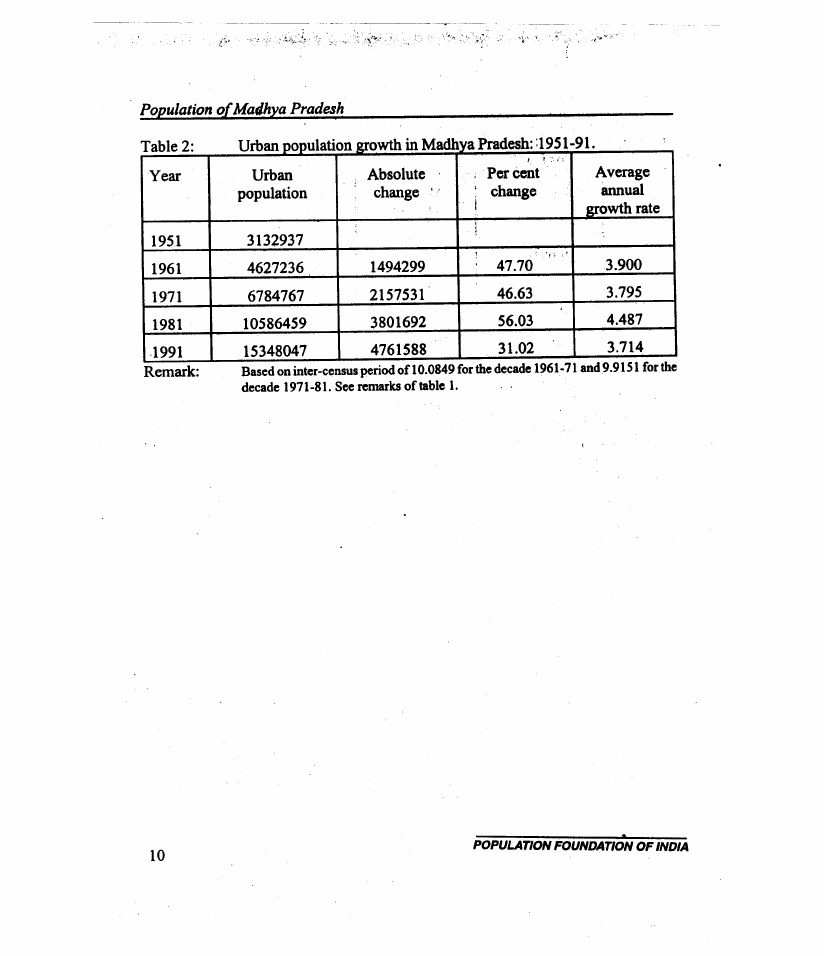
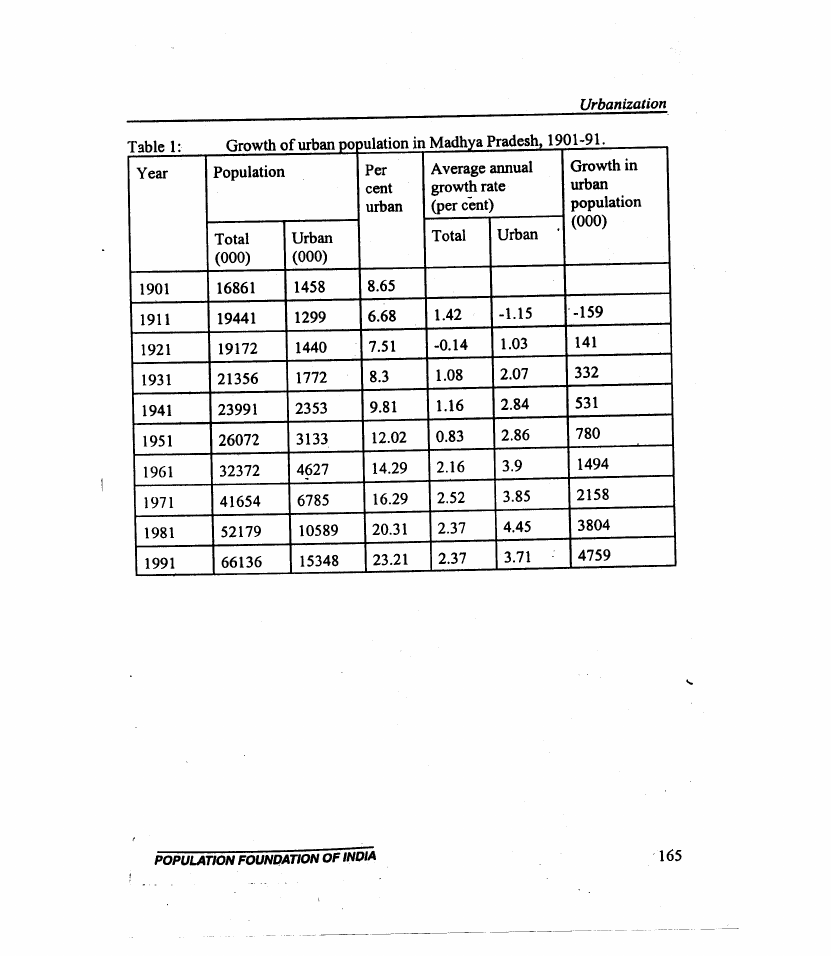
In comparison to the total populationgt'!Jwth rate, growth of urbart population in the
state has been faster throughout the £orty years under reference and this' is expected.
In between 1951 and 1991, urban population of the state increased by. almost 5 times
- from 3.133 million to 15.339 milliOl1.This implies that during aj>eriod of40 years
urban' population ihcreastd 'by about 1+.21' million' whicbamounts to :an average
~ual growth rate 6'£3.973 per cenfpet year. Growth in the urban population of the
. state was typically rapid during the dec~de 1971-81 when it increased at an average
annual rate of growth of 4.449 per cent. As the result of this very rapid growth rate,
the urban population of the state nearly doubled in just 10 years between 1971 and
1981. However, there has been considerable slow down in the growth of urban
population during the decade 1981~91 when it increased at an average annual rate of

1.8 Page 8

▲back to top


Population Growth
growth of 3.708 per cent only. Incidently, this rate of urban population growth is
slowest of all growth rates in different decades of the period 1951-91.
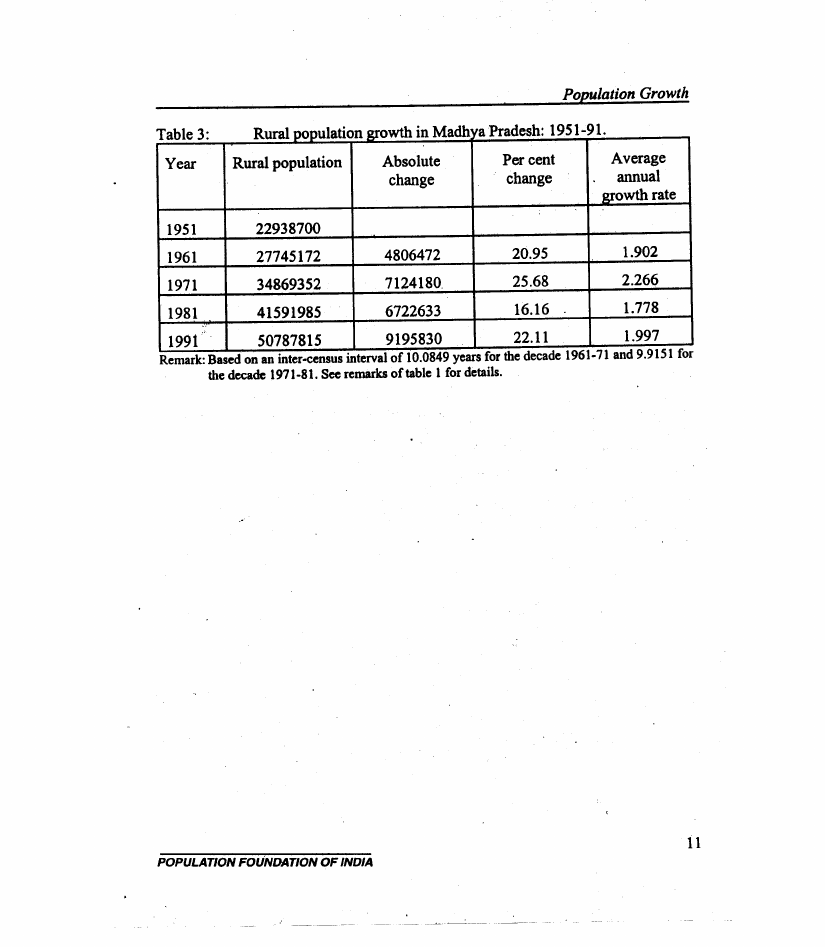
In between 1951 and 1991, rural population of the state increased by 27.89 million
at an average annual rate of growth of 1.99 per cent. In other words, in a period of 40
years, rural population of the state increased by approximately 2.21 times. Growth
of rural population was most rapid during the decade 19(il- 71 when it increased by
an average annual rate of 2.285 per cent. On the other hand, the rural population
growth rate was lowest during the decade 1971-81 when it increased by only 1.763
per cent per year
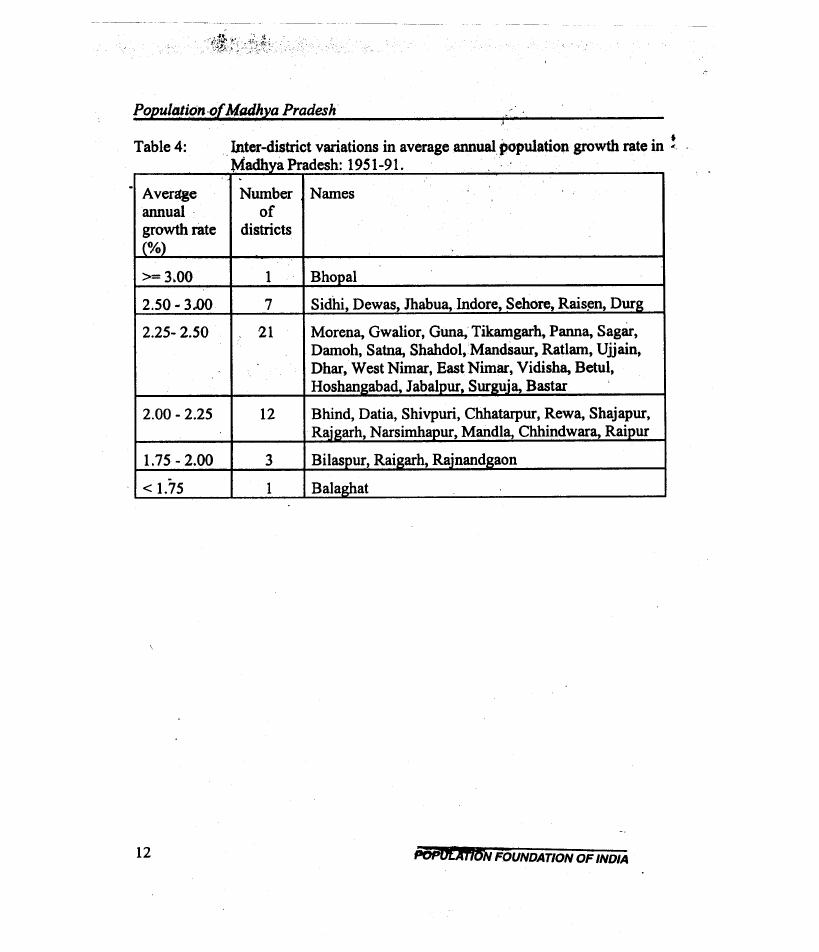
Inter-district variations in the population growth rate are significant in terms of both -
level as well as trend. In 41 of the 45 districts of the state, average annual population
growth rate during the period 1951-91 has been more than 2 per cent per year
indic~ting a rapid in population of these districts. In only 4 districts, average annual
population growth rate during the 40-year period was less than 2 per cent per year.
Most rapid growth of population in this period has been recorded in district Bhopal
where the population increaSed at an average ann\\lal growth rate of 4.365 per cent per
year during the last 40 years. In this district, population increased by almost 6 times
over a duration of 40 years - from 0.236 million in 1951 to 1.350 million in 1991. In
other words, 1.115 million people were added to the population of the district alone
during the period be~een 1951 and 1991.
,
,
The reason behind a very rapid growth of population in district Bhopal appears to be
the location of the sate capital city of Bhopal. It inay'be recalled that the state, in its
present form, came into existence in 1952 and city of Bhopal was made capital·ofthis
new ..state. As such, there has been a very heavy in-migration to the state capital city
of Bhopal leading to a rapid growth of population of the city' and the district.
Moreover, in recent years, there has also been very heavy industrialization around the
city of Bhopal which also appears to have resulted in substantial in-migration into the
district.·
.
After Bhopal, the district with most rapid population growth has been Indore where
population increased at an average annual rate of 2.785 per cent per year during the
40-year period between 1951 and 1991. Here too, most of the population growth
appears to have been confined to the city ofIndore which is the largest city of the
state and is a very impox:tant industrial and economic growth centre. In both the

1.9 Page 9

▲back to top


Poeulation of Madhya Pradesh
Fiaure 2
Urban and Rural Pop ••latlon Growth Rate
in Madhya Pradesh
f•.. 3.50
!
~ 3.00
)2.50
districts Bhopal as well as Indore, urban population contributes to more than.70 per
cent of the total population of the district. Clearly population growth in these districts
is bi~ed heavily by the growth of urban population in these districts.
..
In addition to Bhopal and Indore, there are six more districts where average annual
growth rate of population during the 40-year period has been more than 2.5 per cent
per year. These districts are Dewas, Sehore, Raisen, Sidhi, Jhabua and Durg. Among
these six districts, district Dewas is adjacent to district Indore and has witnessed
heavy industrialization during the period under reference around the district
headquarter town ofDCfwas. The same is true with the distriCts ofSehore and Raisen
which are adjacent to district Bhopal. On the other hand rapid population growth in
district Durg is due to the establishment of BJ;rllai steel plant and subsequent
industrialization in the district. In recent years, however, growth of population in this
district has slowed down rather substantially.

1.10 Page 10

▲back to top


Population Growth
The .case of district Sidhi is typical. This district, prior to 1981 was a typical rural
district with only ~ne tc?wnof population less than 20,000 inhabitants. But within a
_ short span of 10 years, between 1981 and 1991, the urban population of the district
increased at an astonishingly high average annual growth rate of more than 15 per
cent per year which has resulted in more than 4 times increase in· the urban
population within a short duration oflO years.
District Jhabua, by contrast, remains a typical rural district with more than 80 per
cent of its population being tribal. There have been little industrialisation and
urbanisation in the district during the last 40 years between 1951 and 1991.
In foui other districts of the state, the growth of populatiQn during the 40 years period
has been very slow. These districts are Bilaspur, Raigarh, Rajnandgaon and Bal~ghat.
In district Balaghat, the population growth. was slowest among all districts of the
of state. In this.district, population increased at an average annual rate of only 1.689 per
cent per year. All these districts are located in the southeast comer the state and
in all these districts, proportion of tribal population is very high. At the same time,
the speed ofindustrialisation and related urbanisation has been slow in these districts.
Lastly, in the remaining 33 districts of the state, average annual population growth
rate during 1951-91 varied within a narrow range of 2.0 to 2.5 per cent. These
districts include both districts with traditional growth centres and districts with
substantial urban population like JabalpUT,and Ujjain as well as typically backward
districts like Panna, Narsimhapur, Rajgarh, Damoh etc. Some/ofthe districts such as
Mandla, Surguja, Bastar etc. which have substantial tribal population are also
included in this group too.
.
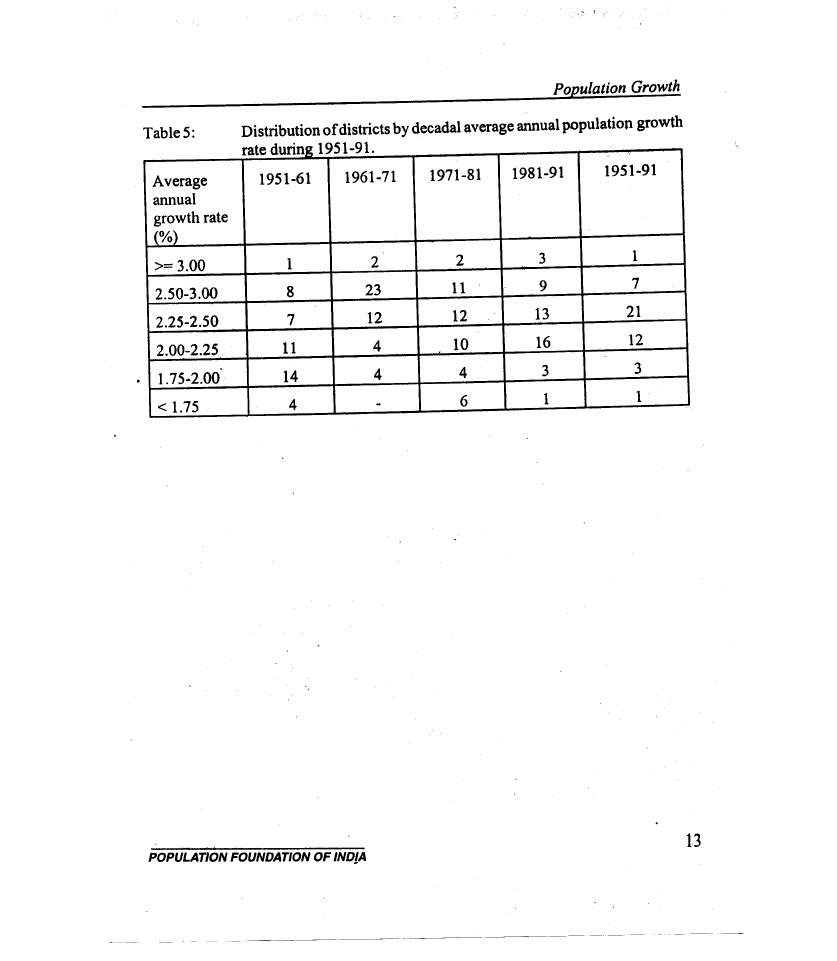
Population growth has not been uniform throughout the period 1951-91 in any of the
45 districts ofthe state. In all districts, population growth rate varied in every decade.
However, in 30 districts of the state, population growth rate during the decade 1981-
91 has been found to be higher than that during the decade 1951-61. In the decade
1951-61,29 districts ofthe state recorded an average annual growth rate ofless than
2.00 percent per year. During the decade 1961-71, in 37 districts, an average annual
population growth rate of more than 2.25 per cent per year was recorded. During the
decad~ 1971-81, the tempo of population growth appeared to have somewhat receded
as there was a decline in. the number of districts recording an average annual
population growth rate of more than 2.25 per cent. On the other hand the number of

2 Pages 11-20

▲back to top


2.1 Page 11

▲back to top


Populational Madhya Pradesh
districts recording an average annual population growth rate of more than 2.25. per
cent remained unchanged during the decade 1981-91 but the number of districts
which recorded an average annual population growth rate ot2.00to 2.25 per cent
decreased from 10 during 1971-81 to 4 during 1981;.91'Ylnfact:iit 'appears that
population growth rate across the districts of the state has tended to converge to the
range 2.00-2.25 per cent per year. During the decade 19S1 ;'61, there were 18 districts
recording average annual population growth rate in this range. This number increased
to 29 during the decade 1981;.91.'
'
.
.~~ ;:' , ;' .
,:
An examination of table 5 suggests that the recent increase in population growth rate
of the state during the decade 1981-91 appears to be largely due to the increase in
population growth rate of those districts where· the existing: levels· of population
growth are low. There are six such"districts \\t:'Vidisha;Mandl~, BUaspur,
Rajnandgaon, Raipur and Bastar. In all these·distri~ts,·average annual population
growth rate during the decade 1971-81 was less than 2,ooper'cent but during the
decade 1981·91, all these districts recorded an average anilual population growth rate
of "more than 2.00 per,cent. In district BUaspur; for example, 'average' annual
population· growth rate increased from 1.922 per cent per year during 1971-81 to
2.511 during 1981-91. Similarly, in district Raipur, this rate shot up from 1.655
during 1971-81 to 2.369 during the decade 1981-91.
District Bnopal and district Balaghat stand out among all districts of the state as far
as levels and trends in average annual population growth rate are, concerned. In
district Bhopal, average annual population growth rate has been more'than 4.00 per
cent throughout the 40-year period under reference. On the other hand, in district
Balaghat, this rate has always been less than 2.00 per cent per year during this period.
Reasons for very rapid population growth in district Bhopal and very slow population
growth in district Balaghat are not known atpresent.'For district Bhopal, it may be
conjectured that very rapid increase of urbaJi population of the district may be one
reason for this rapid population growth but for district Balaghat very little is known
at present.
''
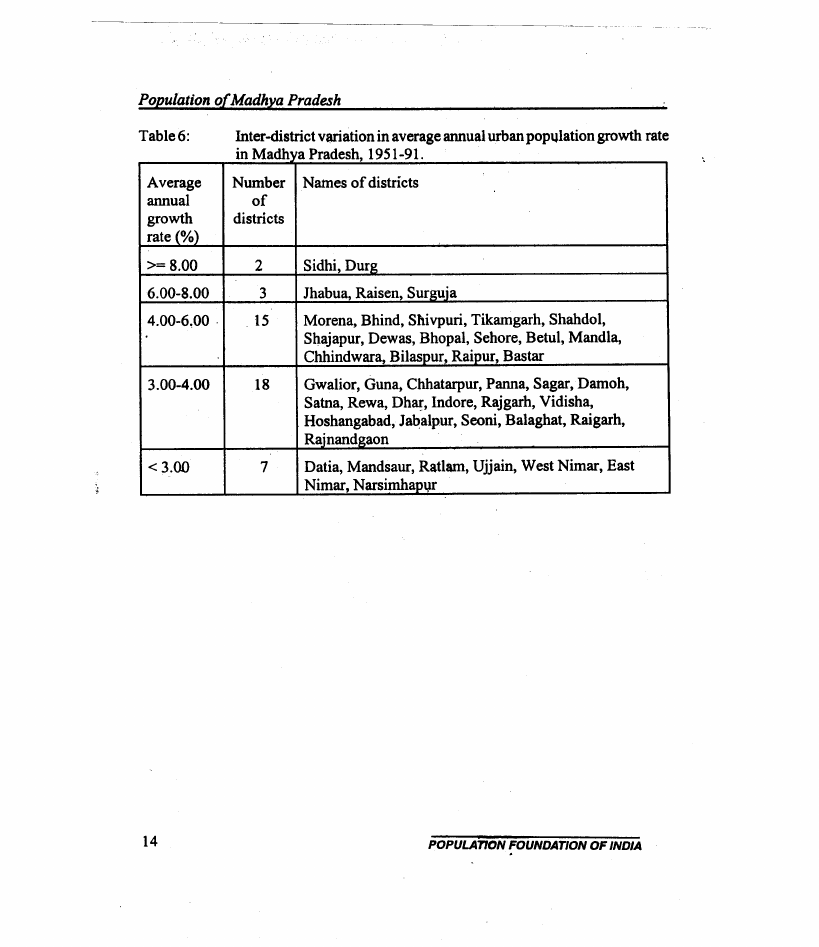
There has also been some very wide variations in urban population growth across the
districts of the state during 1951-91. Highest average annual urban population growth
rate during the 40-year period has been recorded in district Sidhi where there was no
urban locality at the time of 195 1 population census. In this district, urban population
increased from 0 in 1951 to almost 90 thousand in 1991 at an average annual growth

2.2 Page 12

▲back to top


Population Growth
rate of9.57 per cent. Other district where urban population increased at an average
annual growth rate of more than 8.00 per cent is district Durg whereas in three
districts - Jhabua, Raisen and Surguja - average annual urban population growth rate
has been between 6.00 to 8.00 per cent. In all these districts, urban population
constituted less than 3 per cent of the population of the district around 1951.
Interestingly, the period of highest tempo in urban population growth varied from
district to district. In Durg, Jhabua and Raisen, growth of urban population was
highest during the decade 1951-61 whereas in district Sidhi, most of the increase in
urban population was confined to the decade 1981-91 during which urban population
increased at an average annual growth rate of 15.078 per cent. But in district Surguja,
no such peak has been found in the trend in urban population growth rate.
Growth of urban population has been fairly rapid during the 40-year period in 15
other districts of the state. In these districts, the average annual urban population
growth rate always ranged between 4.00 to 6.00 per cent per year. Barring district
Bhopal, in all these districts, proportion of urban population was less than 10 per cent
of the total population in 1951. It appears that 'low urban population base around
1951 in these districts has largely been responsible for relatively high average annual
urban population growth rate in these districts. In other words, urban population
growth rate appears to be affected by what is· known as the level effect. This
observation is also supported by the fact that in those districts where proportion of
urban population to total population was substantial at the time of 1951 population
census - Gwalior, Indore, Jabalpur Ujjain etc. - average annual growth rate of urban
population during the last 40 years has never been rapid. In fact, in many of these
districts, growth of urban population appears to have slowed down in recent years,
particularly during the decade 1981-91 thus raising the possibility of an urban turn
around in these districts.
Finally, in 7 districts ofthe state, urban population growth has been relatively slow -
always less than 3.00 per cent per year. Districts in this,group include both highly
industrialized districts like Mandsaur and Ratlamas well as districts like Datia and
Narsimhapur where there has been practically no industrialization.
Growth of urban population, it may be recal~¢, is directly linked with the process
of economic development and associated industrialization. Industrialization also
leads to the development of new centres of economic activities which also accelerate

2.3 Page 13

▲back to top


Population of Madhya Pradesh
urban population growth. Viewed in this context, rate of urban p.opulation growth in
a district may be indicative ofthe level of economic development in that district.
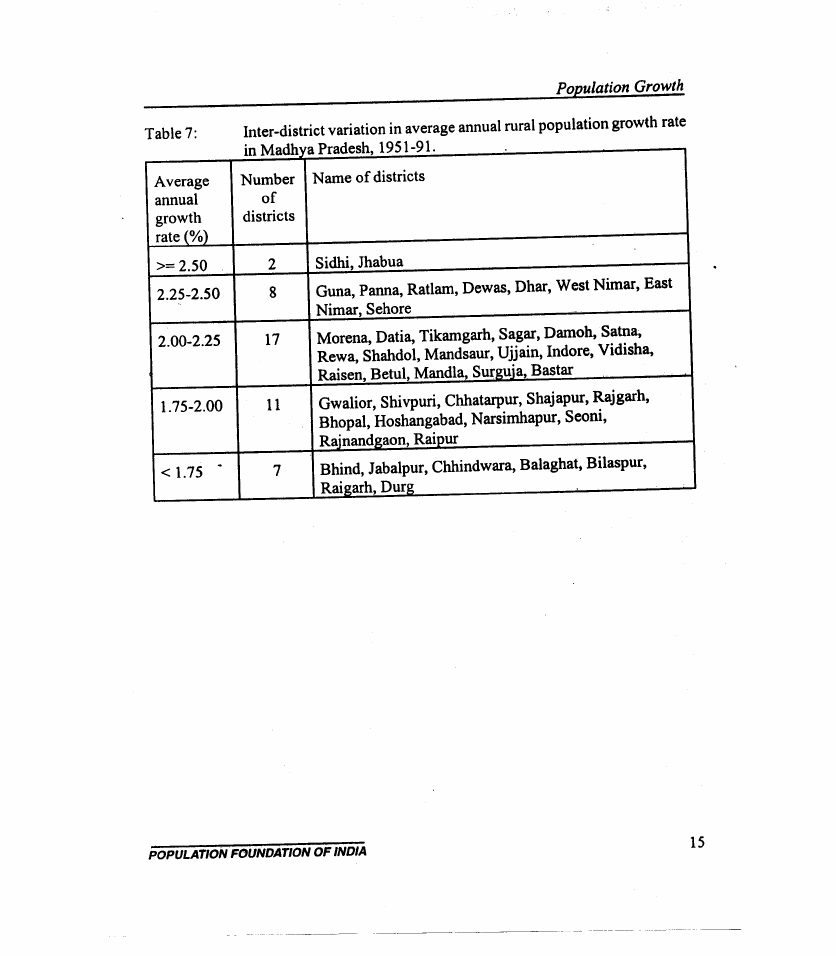
In contrast to patterns and variations in the urban population growth, there are little
inter-district variations in the rural population growth. Highest average annual rural
population growth during 1951-91 has been recorded in district Sidhi where rural
population increased at an average annual rate of more than 2.5 per cent. On the other
hand in district Bilaspur and Balaghat,rural population increased at an average
annual growth rate of less than 1.6 per cent during this period. Rural population
growth has also been very slow in five other districts - Bhind, Jabalpur, Chhindwara,
Raigarh and Durg - with average annual rural population growth rate always falling
below 1.75 per cent.
In majority of the districts, however, average annual rural population growth rate
during the 40-year period varied in the close range of 1.75 to 2.25 per cent. In only
10 districts, this rate has been more than 2.25 per cent whereas in 7 districts, it has
been less than 1.75 per cent. Thus, in comparison to urban population growth, there
is much less variability in the rural population growth rate across the districts of the
state.
Combining the rural and urban population growth rates, we find that in five districts -
Sidhi, Jhabua, Dewas, Raisen and Sehore - both urban as well as rural population
growth has been rapid during the 40 years between 1951 and 1991. Rapid population
growth in district Durg, on the other hand, has largely been due to very rapid increase
in its urban population growth. By contrast, relatively slow population growth in
district Rajgarh and Balaghat appears to be due to slow growth of both rural as well
as urban populations while in district Bilaspur, abnormally slow rural population
growth appears to be largely responsible for the slow growth of total population.

2.4 Page 14

▲back to top


Population growth in Madhya Pradesh:
1951-91.
Year
Population
Absolute
change
Per cent
change
Average
annual
growth rate
1951
26071637
1961
32372408
6300771
24.17
2.165
1971
41654119
9281711
28.67
2.500
1981
52178444
10524325
25.27
2.272
1991
66135862
13957418
26.75
2.370
Remark: The reference date for census count was sun rise of March 1 in 1951, 1961, 1981 and 1991
population censuses but it was the sun rise of April 1 in 1971 census. As such the inter-
census period was extended for 31 days in the decade 1961-71 but was reduced by the same
period in the decade 1971-81. Hence the average annual rate of growth for the decade 1961-
71 was based on an inter-census period of 10.0849 years while that for the decade 1971-81
on 9.9151 years.

2.5 Page 15

▲back to top


Population of Madhya Pradesh
ae
Year
1951
1961
an popu a on gro m
Urban
population
, Absolute
change ' ,
3132937
4627236
1494299
. - lya ra es ::
,
~ I
...; .- :
Percent
, change
Average
annual
I
growth rate
I
1
,
,.
"
47.70
3.900
1971
6784767
2157531
46.63
3.795
1981
10586459
3801692
56.03
4.487
·1991
15348047
4761588
31.02
3.714
Based on inter-census period of 10.0849 for the decade 1961-71 and9.9151 for the
decade 1971-81. See remarks of table 1.
POPULATION FOUNDATlbN OF INDIA

2.6 Page 16

▲back to top


Population Growth
ae
u popu a Ion gro In a va ra es : -
Year
Rural population
Absolute
change
Per cent
change
Average
annual
growth rate
1951
22938700
1961
27745172
4806472
20.95
1.902
1971
34869352
7124180.
25.68
2.266
1981
..
.'
1991
41591985
50787815
6722633
9195830
16.16
22.11
1.778
1.997
Remark: Based on an inter.-census interval of 10.0849 years for the decade 1961-71 and 9.9151 for
the decade 1971-81. See remarks of table 1 for details.

2.7 Page 17

▲back to top


Population ·o(MQt;/hya Pradesh·
.Inter-district variations in average annual population growth rate in .~.
Madh a Pradesh: 1951-91.
.
Aventge
annual .
growth rate
%
Number
of
districts
Names
>=3.00
1 Bho al
2.50 - 3.00
7
Sidhi, Dewas, Jhabua, Indore, Sehore, Rais~n, Dur
2.25- 2.50
21
Morena, Gwalior, Guna,Tikamgarh, Panna, Sagar,
Damoh, Satna, Shahdol,Mandsaur, Ratlam, Ujjain,
Dhar, West Nimar, East Nimar, Vidisha, Betul,
Hoshan abad, Jabal ur, Sur .a, Bastar
12 Bhind, Datia, Shivpuri, Chhatarpur, Rewa, Shajapur,
Ra' arh, Narsimha ur, Mandla, Chhindwara, Rai ur
P6P&Dif16N FOUNDATION OF INDIA

2.8 Page 18

▲back to top


Population Growth
Distribution of districts by decadal average annual population growth
rate d'unn2 1951-91
Average
annual
growth rate
(%)
1951-61
1961-71
1971-81 1981-91
1951-91
>= 3.00
1
2
2
3
1
2.50-3.00
8
23
11
9
7
..
2.25-2.50
7
12
12 .
13
21
2.00-2.25
11
4
10
16
12
1.75-2.00
14
4
4
3
3
< 1.75
4
-
6
1
1

2.9 Page 19

▲back to top


Population of Madhya Pradesh
Inter-district vamation in average annual urban pop\\l.lation growth rate
- I.n M adh"a Praeds, h 1951 91
Average
annual
growth
rate (%)
Number
of
districts
Names of districts
>= 8.00
2
Sidhi, Durg
6.00-8.00
3 Jhabua,Rwsen,Surguia
4.00-6,00 . . 15
Morena, Bhind, Shivpuri, Tikamgarh, Shahdol,
Shajapur, Dewas, Bhopal, Sehore, Betul, Mandla,
Chhindwara, Bilaspur, Raipur, Bastar
3.00-4.00
18 Gwalior, Guna, Chhatarpur, Panna, Sagar, Damoh,
Satna, Rewa, Dh8!",Indore, Rajgarh, Vidisha,
Hoshangabad, Jabalpur, Seoni, Balaghat, RIDgarh,
Rainandgaon
<3.00
7 Datia, Mandsaur, Ratlam, Ujjain, West Nimar, East
Nimar, Narsimhap\\lT

2.10 Page 20

▲back to top


Average
annual
growth
rate (%)
>= 2.50
2.25-2.50
2.00-2.25
1.75-2.00
- < 1.75
Inter-district variation in average annual rural population growth rate
- i.n M adbI' a Pradesh, 1951 91
Number
of
districts
Name of districts
2
Sidhi, Jhabua
8 Guna, Panna, Ratlam, Dewas, Dhar, West Nimar, East
Nimar, Sehore
17 Morena, Datia, Tikamgarh, Sagar, Damoh, Satna,
Rewa, Shahdol, Mandsaur, Ujjain, Indore, Vidisha,
Raisen, Betul, Mandla, Surguja, Bastar
11 Gwalior, Shivpuri, Chhatarpur, Shajapur, Rajgarh,
Bhopal, Hoshangabad, Narsimhapur, Seoni,
Rainand,gaon, Raipur
7 Bhind, Jabalpur, Chhindwara, Balaghat, Bilaspur,
Raigarh, Durg

3 Pages 21-30

▲back to top


3.1 Page 21

▲back to top


Population of Madhya Pradesh

3.2 Page 22

▲back to top


Population Distribution in
Madhya Pradesh
Introduction
It is well. know that during the process of social and economic development,
increasing proportion of population is concentrated in areas of high productivity.
Historically also, areas with 'high population concentration have also been areas of
high produ~p.vity. Population pressure as a result of concentration of population in
areas of high productivity has been suggested as one of the motivational factors for
technological innovation and change, 'particularly in eighteenth century Europe
(Boserup 1981). Boserup has argued that there is a close link between population
distribution and the food supply system. This link is attributed to two long-existing
process of adaptation. One, population distribution has adapted to the natural
conditions of food production through migration and natural increase. Second, food
supply system has adapted to changes in population concentration.
This paper analyses population distribution patterns across the districts of Madhya
Pradesh. Population distribution, it may be recalled, is the end result of the processes
of fertility, mortality and migration. !tis determined by both the natural increase of
the population and its movement from one place to another. In this way, population
distribution patterns are reflective of the demographic processes.
Analysis of population distribution patterns over geographic areas have some
important implications in the context of planned social and economic development

3.3 Page 23

▲back to top


Population of Madhya Pradesh
as it helps in identifying ~eas which require priority ,in ~e efforts related to social,
economic and infrastructure development. Moreovet, analysing population
distribution also helps in analysing movement of population over geographic areas.
Measurement of Population Distribution
An understanding ofthe distribution of population over a group of geographical units
can be achieved though a consideration of the components of population distribution.
Population distribution over the geographical areas, essentially, has two components
- the exterisivenessand the intensiveness. The extensiveness of population
"distribution in a given geographic area is nothing but the size of the population of
that area relative to the size of the population of other g~graphic units. On the other
hand, the intensiveness of population distribution implies the denseness of the
population relative to the area of the geographical unit. Intensiveness may be
measured as the ratio of relative population to the relative area of the geopolitical
unit. Clearly, in the analysis of population distribution patterns over geographical
areas both extensiveness and intensiveness of the population distribution should be
analysed separately as well as in combination.
A v~ simple measure of the extensiveness of population distribution over a given
geographic area is the proportion ofthe population in that area relative to some larger
geographic unit. Thus if the focus of interest is the distribution of p~pulation across
the districts of the state, then a measure of the extensiveness of population in a given
district may be· taken as the proportion of the population 'of the' district to the
population of the state. Denoting by p. the proportion 'of population in districts the
jndex of extensiveness ofpopulation.distrib~tion in districtss, Ea, is
'
On the other hand, intensiveness of population or population concentration is usually
measured by the term population density which is nothing but the number of
inhabitants in a unit area But population depsity is, at best, a crude measure of
population concentration. It does not have any additive or lpultiplicative properties.
A more refmed measure of intensiveness may be de~ed by PSWgproportions rather
than absolute numbers. Thus an index of intensiveness. of pOP\\llatio~ distribution in
a geographic area may defined as the index I. where

3.4 Page 24

▲back to top


" Population Distributioq
•.... ,
#.
.,-
.-
where A, is the proportion of area of district s to the .area ef the sta\\~and log stands
for logarithm to the base 10.
i '. '"
, -,':~1f;i~;,
Combining tire measures of extensiveness and intensiveness, ~ ·&t:t;;..fUl·~stStl'
population distribution, Ds, defined as
' :Ufjoq
for district ·s. Summing over all districts of the &tate,we get an ind~x of population
distribution, D for'the whole state. Thus
The logic of the index defined by equation (3) should clear. The second tenn on the
right is essentially a surrogate for population density. Density or any derivative of it
is an intensive property and, like pressure, it exists a point or at a place. But it does
not tell about extent over which the density prevails. Densities as high as in cities
may be found in restricted quarters of some villages. The difference lies in,lAc, e~tfnt
over which the densities prevail. As such, it requires'a weighing factor to;teUJq~'ww
many people, given density conditions prevail. This weighing is done by the in4ex
of extensiveness .
. It may be npted that the index of extensiveness of population distribution is always
positive and less than' one. Dnthe other hand, the index of intensiveness· can take
~oth positive and negative values. This index ,is zero when p.= A, i.e. when
proportion of population in district s to the population' of the state is equal to the
proportion ofthe area, of district s to the area of the state. WhenP.> A" the index is
positive and vice versa. A positive value of the index Is, may be taken 'as the indicator
of population' concentration in district s relative to the area of the district. Similarly,
a negative value of this index may be taken as ,an indicator of the emptiness in the
pop,ulation distribution relative to the area;, In this way, an assessment and analysis
offhe extensiveness and the intensiveness. of the population distribution reveals a
comprehensive' picture of population distribution over geographical areas.'
The Data
The analysis presented here is built upon the infonnation collected on area and
population of different districts of Madhya Pradesh during the 1911'Jt9,81,,~~} 991
.
POPULATION FOUNDATION OF INDIA

3.5 Page 25

▲back to top


Population of Madhya Pradesh
population censuses. Thisinfonnation is availa~le for the 45 districts of the state. At •
the time of 1971 population census, however, there were only 43 districts in the state.
As such, the infonnation collected during the 1971 population census was adjusted
according to the boundaries of the districts that prevailed at the time of 1981
population census. There was no change in the boundaries of the districts ofthe state
at the time of 1991 population census from that prevailed during the 1981 population
census.
One problem that is usually associated with the use of.infonnation from different
population censuses is the problem of data comparability. In the Indian censuses too,
the definition of the standard urb~ area has been changed frequently. However,
since 1971 population census, the definition of standard urban area has remained
more or less unchanged and so the infonnation collected during the 1971, 1981 and
1991 population censuses is comparable as far as definition ofa standard urban area
is ·concerned,
"
Findings
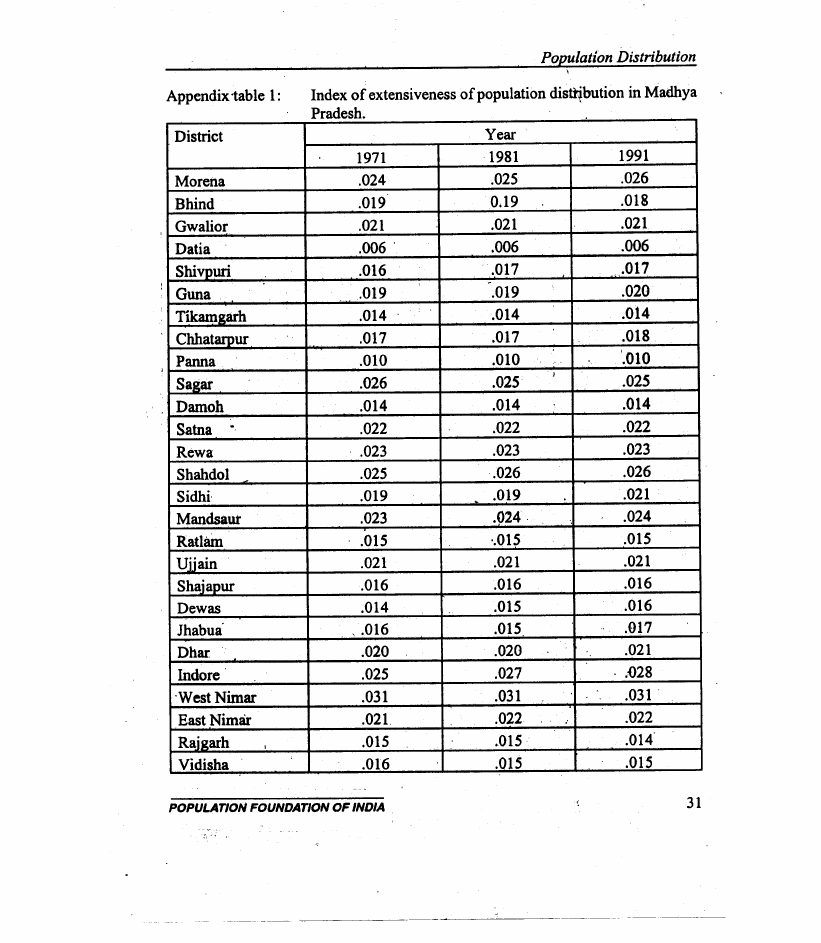
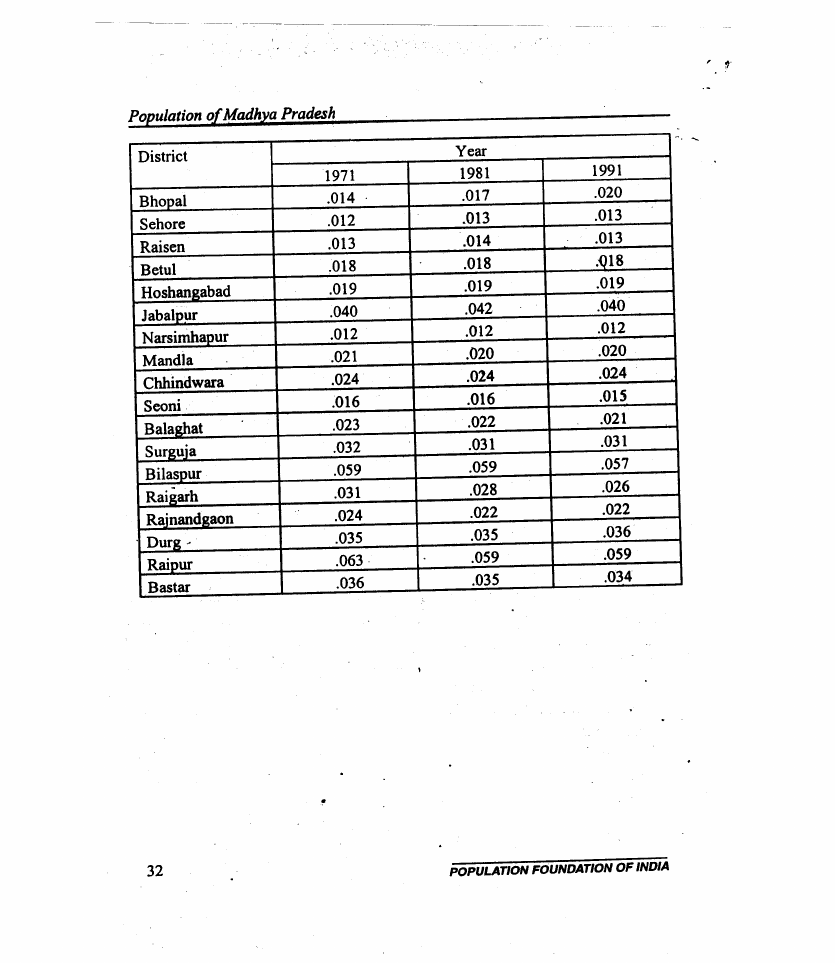
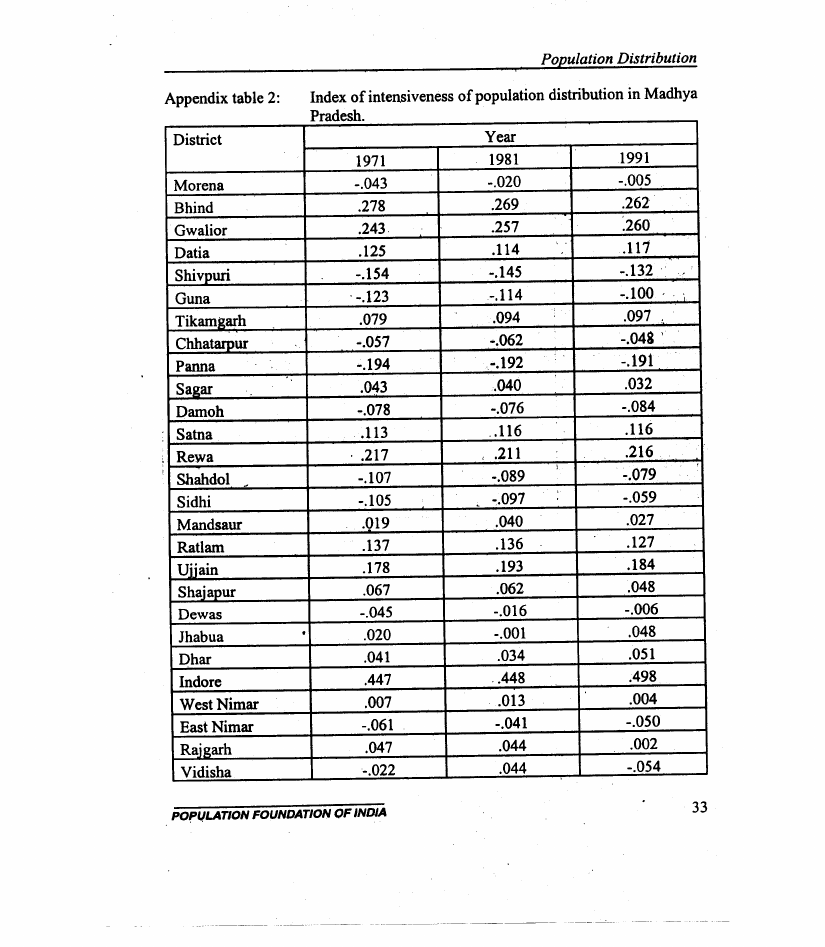
Estimates of the indices Es' Is, and Ds for each of the 45 districts c;>tfhe state are
preseAted in the tables given in the appendix tables 1 through 3 for the years 1971,
1981 and 1991. At this stage it would be better to discuss these indices separately.
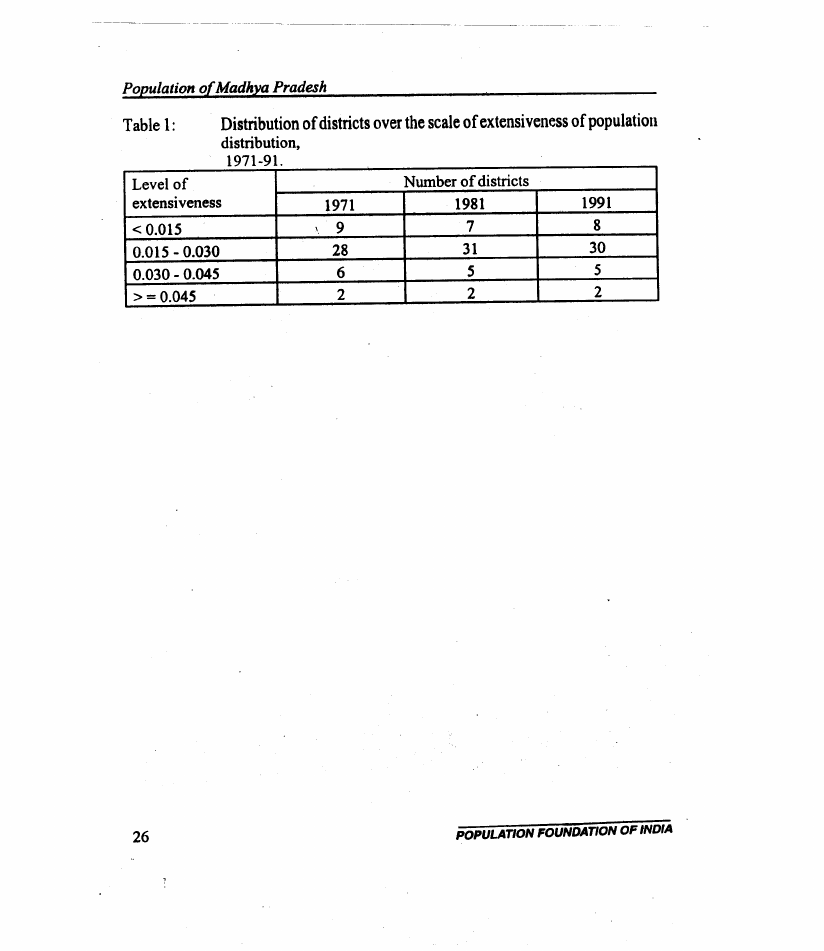
a. Extensiveness ofpQpulation distribution. There has been very little change
in the distribution of districts on the scale of extensiveness of population distribution
during the last twenty years as'may be seen from table 1. This.index has remained
unchanged during the last twenty years in 15 districts of Ule state. These districts
include highly urbanized districts like Gwalior, Ujjain and Ratlam as well as lowly
urbanized districts like Tikamgarh, Panna and Narsimhapur. By ~ontrast, significant
increase in the index of extensiveness has been observed in only two districts of the
state - Indore and Bhopal. Both these districts are pjghly urbanized and are most
developed districts of the state.
As of 1~91,highest proportion ofthe population of the state was living in district
Raipur closely followed by district Bilaspur. Other districts where 3 percent or more
ofthe state population was residing are: West Nimat,;Surguja arid Durg. On the other
hand, smallest proportion of population of the state was residing in district Datia. In
Panna, Narsimhapur. Sehore and Raisen districts also, the proportion of population
to the population of the state was very small. One reason for this pattern of

3.6 Page 26

▲back to top


Population Distribution
extensiveness in population distribution over districts is the variation in the area of
the districts. Proportion of area of districts Datia to the state is the lowest among all
districts of the state whereas the area of district Raipur is third highest in the state.
The area of districts Panna, Sehore, and Narsimhapur is also very small as compared
to other districts of the state.
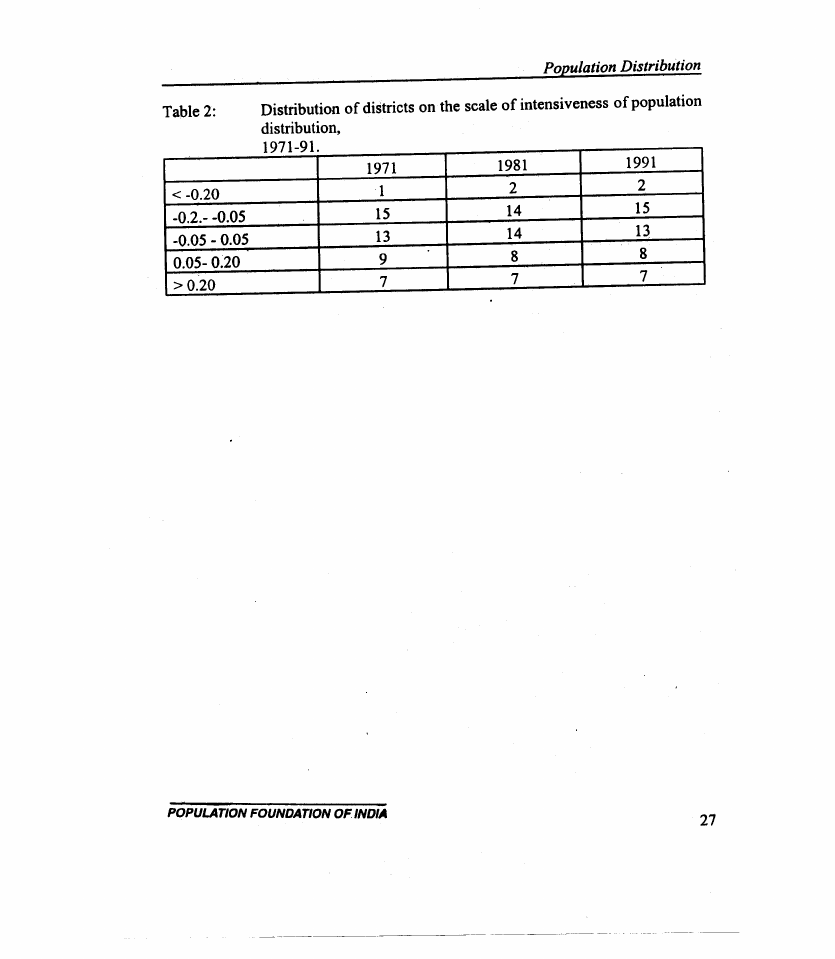
b. Intensiveness of population distribution. Like the ·extensiveness, in case of
intensiveness of population distribution too, there has been very little change in the
distribution of districts over the scale of intensiveness in the' state. In fact,
concentration of the population is not the common feature in most of the districts of
the state. Rather, in majority of the districts, population distribution is characterised
by its emptiness. Over the years, there has been an increase in the intensiveness of
population distribution in a number of districts of the state.· This increase in the
intensiveness has been significant in Morena, Sidhi, Shajapur, Dewas and Bhopal
districts. Despite this increases, in Morena, Sidhi and Shajapur districts, the index of
intensiveness continues to be negative indicating the persistence of emptiness in the
population distribution. Of the remaining two districts, in Dewas, ,the increase is
rapid but the level of intensiveness is low whereas in Bhopal, both the increase is
rapid as well as the level of intensiveness is high.
In three districts of the state, on the _other hand, the index of intensiveness has
decreased very rapidly during the past twenty years. These districts are: Rajgarh,
Vidisha and Balaghat. This rap,id decline in the index of intensiveness in these
districts indicate towards an outflow of people from these dis,tricts to neighbouring
districts. Incidentally, both Raigarh and Vidisha districts are adjacent to district
Bhopal which has recorded a significant increase in the index of intensiveness as well
.as in the index of extensiveness. It is therefore plausible that the observed decrease
in the index ofintensiveness in Rajgarh and Vidisha districts is due to the movement
-of the population from these districts to the neighbouring'district Bhopal. Such a
'movement is expected as the state capital city of Bhopal is located in district Bhopal
and there has been very rapid change in the level of urbanisation and development
during the last twenty years in this district.
The case of district Bhind is typical. There is no metropolitan city in the district and
no rapid industrialisation either in the past or recently. Yet this district has a very
high, degree of intensiveness in the population distribution - higher than the
intensiveness in districts having traditional growth centre like Gwalior and Jabalpur.

3.7 Page 27

▲back to top


Populatioll of Madhya Pradesh
Reasons for a high degree of intensivtness' in population distribution in the district
are not know at present. The only observation that can be made here is that the
agri~ultural productivity in the district is very high.
,
Lowest value of the index of intensiveness has been observed in district Bastar
followed by Surguja. Panna and Mandla districts. In three of these four districts,
majority of the population is tribal and in all these districts, there is very limited
industrial activity. Also, except district Panna, the area of the remaining three
districts is very large. District Bastar;incidentally, is the largest district in terms of
area in the whole country. Most parts of these districts are covered with dense
tropical forests which appears to be the main reason for a low degree ofiptensiveness
in population distribution. In district Panna, on other hand, there is little
industrialisation as well as the productivity of agriculture is very low. As such, the.
push factors of population movement from the district appear to be very strong which
probably is the reason for very low degree ofintensiveness in population distribution.
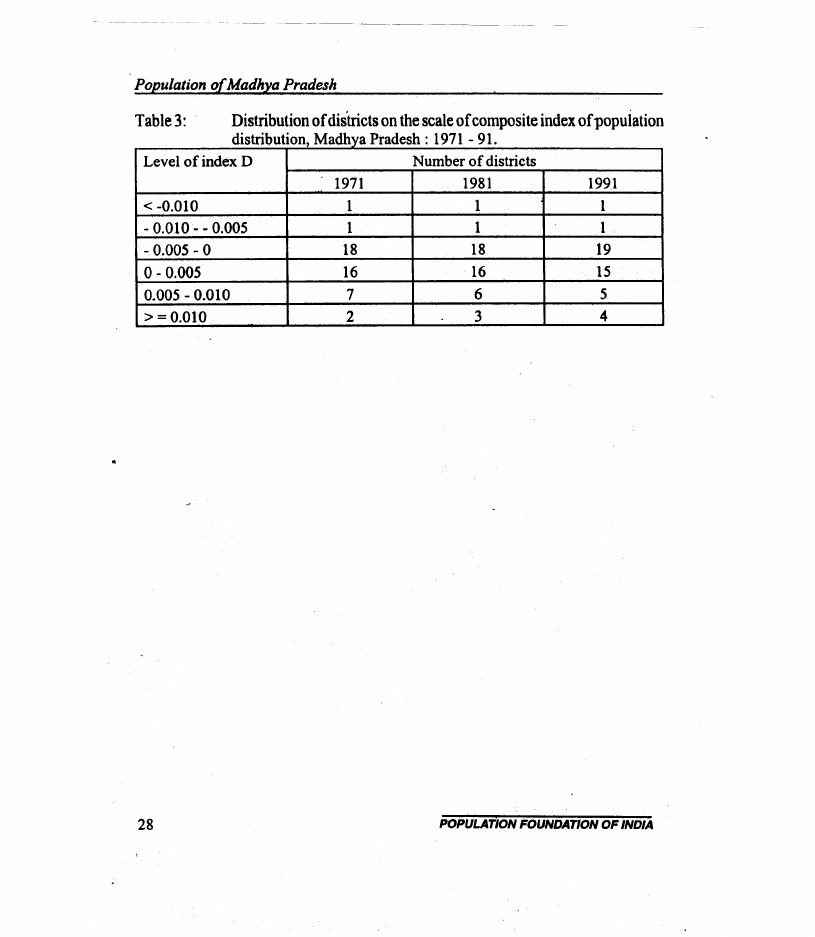
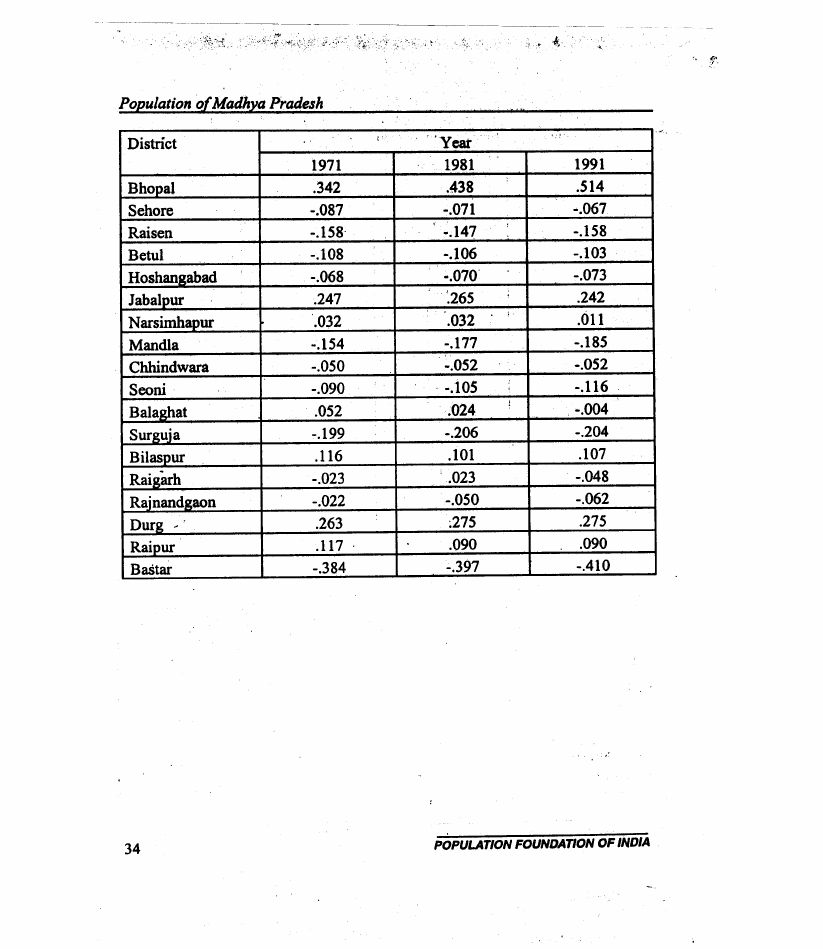
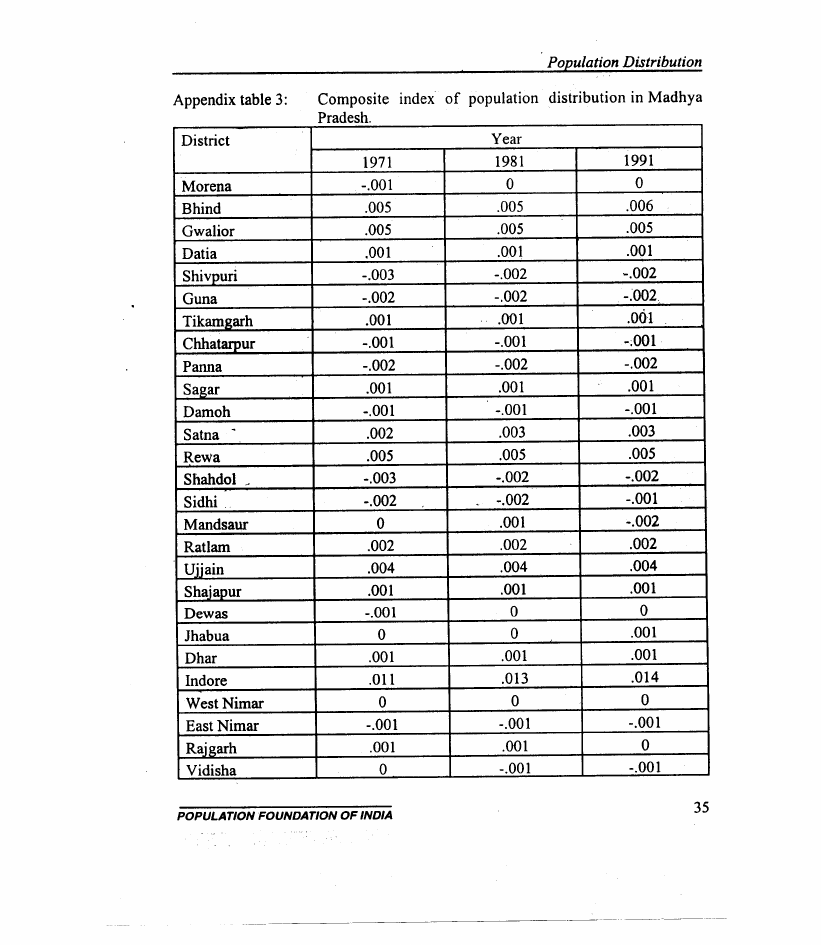
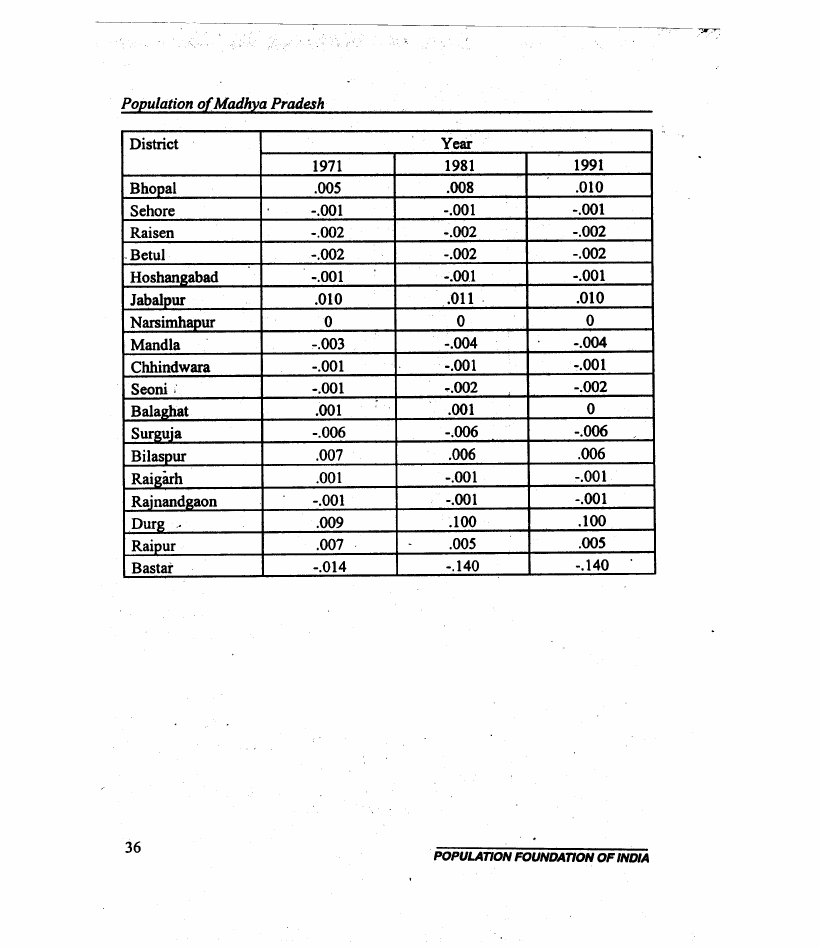
c. Composite index of population distribution. The distributioil of districts over
the scale of the index D - the index of population distribution - vaties little over the
years. For majority of the districts, this index has been within the narrow range of-
0.005 to 0.005 over the last twenty years indicating a high degree of stability in
population distribution across the districts ofthe state. Some tendency of population
concentration, however, is visible from table 3 as at least two districts which were
classified as highly intensive districts in 1971 have become very highly intensive in
1991. These districts are Bhopal and Durg. The reasons for this tendency of
concentration of population in these two districts have already been elaborated
earlier. However, if the discussions are restricted to the remaining 43 districts of the
state, stability in the pattern of population distribution in the state is very much clear
from table 3. This stability has been in both the direction as well as the level.
Districts with positive index of population distribution have remained so with little
change in the value of the index D. Similarly, the districts with negative, index of
population distribution continue to remain so and there is very little change in the
magnitude.
.
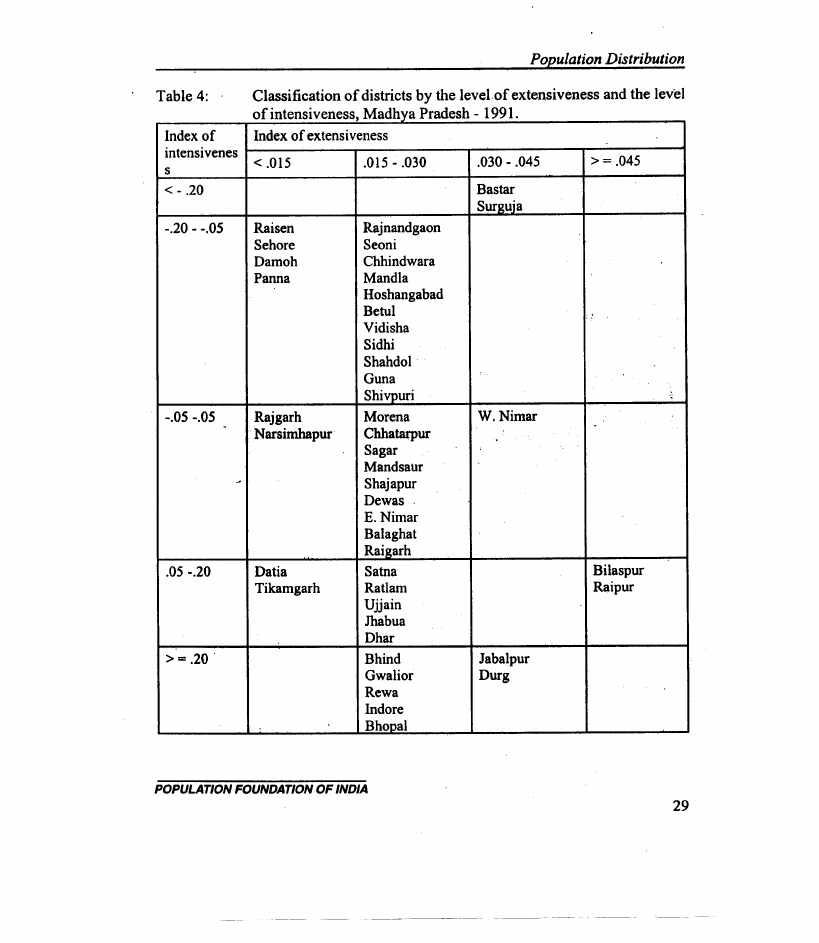
A more composite picture of the pattern ofpopulatioh distribution in the state can be
obtained by classifying the districts simultaneously on the scale of extensiveness and
on the scale ofintensiveness. The results of the exercise have been compiled in table
4. The table identifies four districts - Raisen, Sehore, Damoh and Panna - where both

3.8 Page 28

▲back to top


extensiveness as well as intensiveness in population distribution is very low and four
districts - Bilaspur, Raipur, Jabalpur and Durg - where both extensiveness in
population distribution is very high. Similarly, there are two districts Bastar and
Surguja - where the intensity of population distribution is extremely low but the
extensiveness of population is relatively high primarily because of very large
geographical area of these districts. On the other hand in Datia and Tikamgarh
districts, the intensiveness in population distribution has been found to be very high
but the extensiveness of this population distribution is very low because the
geographical area of these districts is very small. District Datia, incidently, is the
smallest district of the state in terms of area.
The same is true for a number of districts with high intensiveness in population
distribution- Bhopal, Indore, Rewa, Gwalior and Bhind. By contrast, in almost all
the districts having a high proportion of tribal population both the extensiveness as .
well as the intensiveness in population distribution is low. Again the reasons behind
the low extensiveness as well as low intensiveness of population distribution in the
districts dominated by tribal population are not know at present. As far as the
extensiveness is concerned, all these districts are very large in area but for
intensiveness little is known.
Discussion
On the basis of the foregoing analysis, one can visualise at least three regions of
population concentration in the state. The first-region comprises of the districts of
Bhind, Datia, Gwalior and Tikamgarh. High agricultural productivity in this part of
the state appears to be the primary factor behind population concentration in these
districts as there is very little industrialisation in three of the four districts of this
group. The average value of agriculture produce in these districts has been estimated
to beRs 2357/- per hectare around 1982-83 which was well above the state average
ofRs 1899/- per hectare.
The second region of high population concentration comprises of the districts of
Jabalpur, Bilaspur, Raipur and Ourg. In these districts, agricultural productivity is
low and hence may not be the reason for population concentration. But the industrial
activity in this region is at a high scale as is indicated by the indicators of
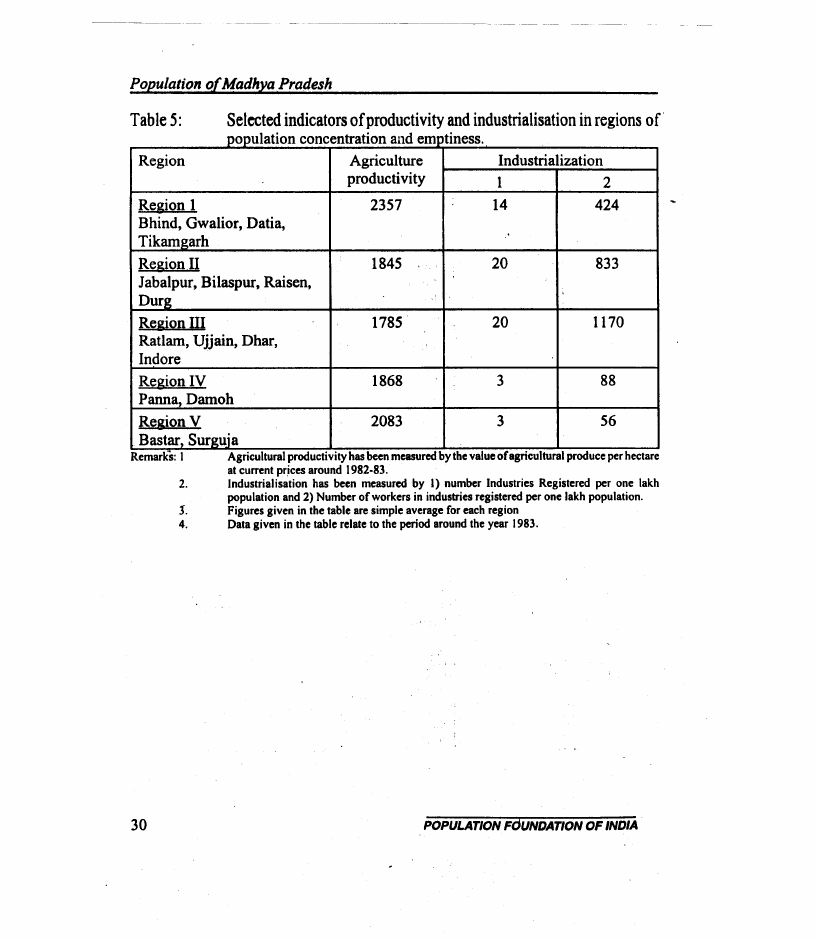
industrialisation as given in-table 5.H appears that level of industrial activity in this
region lias resulted in an influx of people from the surrounding areas to these districts
which has resulted in the increase' in population concentration.

3.9 Page 29

▲back to top


Populationo( Madhya Pradesh
The third region of population concentration comprising of the districts of Dhar,
Indore, Ratlam, Ujjain is very similar to region two. In this region too,
industrialisation and associated in-migration appear to be primarily responsible for
the concentration of the population.
\\
On the other hand, there are two groups of districts with very high degree of
emptiness in the population distribution. One group conSists ofthe districts of Panna
and Damoh while the second region comprises of the districts-ofBastar and Surguja.
In these reasons both the agricultural productivity as well as the industrial activity are
at low levels. The situation is typical in Panna and Damoh where there is little
modernization and where agriculture remains traditional with very low productivity,
and very low value of its produce. In these districts, there seems to be no reason for
the population to not to move out of the district in search of better living
"opportunities.
Besides the above four districts, there are two more districts where a high degree of
emptiness in population distribution has been observed.' These districts are Sehore
and Raisen. Both these districts are: adjacent to district Bhopal where both
extensiveness as well as intensiveness in population distribution has increased
considerably over the past twenty years. It appears' that emptiness in S~hore and
Raisen districts is largely due to the movement ofthe people from these districts to
district~Bhopal where there has been rapid social and economic development in
recent years. Obviously, migration, in or out of the district appears to be the most
important factor associated with the prevailing patterns of population distribution in
the state.
Conclusions
The analysis reveals quite a fair degree of stability in population distribution 'across
the districts of the state during the past twenty years. This suggests that the
movement of population from one district to another has not been very significant in
the state despite, the fact that different districts. of the state are at different levels of
social and economic development. Davis (1951) in his pioneering study has also
concluded that the population oflndiansubcontinent is relatively immobile. He has
,argued that this immobility is not only due to the predominance of agriculture as the
base of the economy but also due to such factors· as caste system; early marriage
norm andjoint family system as well as to the diversity of the language and culture.
In the state like Madhya Pradesh where the process of social and economic
. POPULATION FOUNDATION OF IND""

3.10 Page 30

▲back to top


development is rather slow and where vast tract of population remain under
developed, there is every reason for the persistence of the reasons enumerated by
Davis.
Nevertheless, at least three regions of population concentration in the state are visible
from the analysis. These regions are located in three parts of the state. It may be
pointed out here that these three parts of the state, before 1952, were three different
administrative units. It was only in 1952 that the three regions were combined
together to form one administrative ,unit that is known today as Madhya Pradesh.
This suggests that all the three regions of population concentration have their origins
deep in the past and are not the outcome of any recent social and economic progress
or development.
Though, population distribution across the districts of the state has generally
remained fairly stable over the last twenty years yet a substantial attlount of
population movement appears to have taken place in the districts surrounding the
state capital Bhopal. Very little is known about the quantwn and characteristic of this
movement in population. The present analysis gives only an idea that such a
movement has really taken place.
1. ~oserup E (1981) Population and Technological Change. Oxford, Oxford
University Press.
2. Davis K (1951) Population of India and Pakistan.
Princeton, Princeton University Press.

4 Pages 31-40

▲back to top


4.1 Page 31

▲back to top


Population of Madhya Pradesh
Distribution of districts over the scale of extensiveness of population
distribution,
1971-91.
Level of
extensiveness
1971
Nwnber of districts
1981
1991
< 0.015
\\9
7
8
0.015 - 0.030
28
31
30
0.030 - 0.045
6
5
5
>=0.045
2
2
2

4.2 Page 32

▲back to top


< -0.20
-0.2.- -0.05
-0.05 - 0.05
0.05- 0.20
>0.20
Distribution of districts on the scale of intensiveness
distribution,
1971-91.
1971
1981
1
2
15
14
13
14
9
8
7
7
of population
1991
2
15
13
8
7

4.3 Page 33

▲back to top


Distribution of districts on the scale of composite index of -popuiation
. IStrib Uflon, M adblya Pradesh 1971 - 91
Level of index D
Number of districts
1971
. 1981
199J
< -0.010
1
1
1
- 0.010 - - 0.005
1
1
1.
- 0.005 - 0
18
18
19
0-0.005
16
16
15
0.005 - 0.010
7
6
5
> = 0.010
2
3
4

4.4 Page 34

▲back to top


Population Distribution
Classification of districts by the level. of extensiveness and the level
0f"m tenSlveness, M adhLya Prad es h - 1991
Index of
intensivenes
s
Index of extensiveness
<.015
.015 - .030
.030 - .045
> = .045
< - .20
Bastar
SurR;uja
-.20 - -.05 Raisen
Rajnandgaon
Sehore
Seoni
Oamoh
Chhindwara
Panna
Mandla
Hoshangabad
Betul
Vidisha
"
Sidhi
Shahdol
Guna
Shivpuri
-.05 -.05 . Rajgarh
Narsimhapur
~
Morena
Chhatarpur
Sagar
Mandsaur
Shajapur
Oewas .
E. Nimar
Balaghat
Raigarh
W.Nimar
.
.05 -.20
Datia
Tikamgarh
Satna
Ratlam
Ujjain
Jhabua
Ohar
Bilaspur
Raipur
>=.20 .
Bhind
Gwalior
Rewa
Indore
BhoDal
Jabalpur
Ourg

4.5 Page 35

▲back to top


Population of Madhya Pradesh
Selected indicators of productivity and industrialisation in regions of
population concentration and emptiness.
Agriculture
productivity
2
Region 1
424
Bhind, Gwalior, Datia,
Tikam~arh
Region II
Jabalpur, Bilaspur, Raisen,
Durg
Region III
Ratlam, Ujjain, Dhar,
Indore
Region IV
Panna, Damoh
Region V
Bastar. Sur~uia
Agricultural productivity has been measured by the value of agricultural produce per hectare
at current prices around 1982-83.
Industrialisation has been measured by I) number Industries Registered per one lakh
population and 2) Number of workers in industries registered per one lakh population.
Figures given in the table are simple average for each region
Data given in the table relate to the period around the year 1983.

4.6 Page 36

▲back to top


Population Distribution
\\
Index of extensiveness of population distqbution in Madhya
Pradesh.
District
Year
1971
1981
1991
Morena
.024
.025
.026
Bhind
.019
0.19
.018
Gwalior
.021
.021
.021
Datia
.006 '
.006
.006
Shivpuri
Guna,
.016
:'
-.017
.017
.019
.019
.020
,
Tikamgarh
.014
.014
.014
Chhatarpur
Panna
Sagar
.017
.017
,
.018
.010
.010
'
:'
'.010
J
.026
.025
.025
. Damoh
Satna
.014
.014
.014
.022
.022
.022
Rewa
' .023
.023
.023
Shahdol
Sidhi-
.025
.026
.026
.019
.019
.021
Mandsaut
Ratlain
.023
.024,
"
.024
.015
'.015
.015
Uiiain
.021
.021
.021
Shajapur
.016
.016
.016
Dewas
.014
.015
.016
Jhabua'
Dhar
Indore
, ' .016
.020
.025
.015
.017
.020
.021
.027
' :028
'WestNimar
.031
.031
.031
East Nimar
.021
R~garh
,
.015
.022
.015
''
"
.022
.014'
Vidisha
.016
.015
.015

4.7 Page 37

▲back to top


Population of Madhya Pradesh
District
Bhopal
Sehore
Raisen
Betul
Hoshangabad
Jabalpur
Narsimhaour
MandJa
Chhindwara
Seoni
BalaJdlat
Surguja
BiiasPUT
Raiiarh
Rajnandgaon
. Durg ~
RaiPUT
Bastar ,
1971
.014
.012
.013
.018
.019
.040
.012
.021
.024
~016
.023
.032
.059
.031
.024
.035
.063,
.036
Year
1981
.017
.013
.014
.018
.019
.042
.012
.020
.024
.016
.022
.031
.059
.028
.022
.035
.059
.035
1991
.020
.013
.013
;Q18
.019
.040
.012
.020
.024
.01S
.021
.031
.057
.026
.022
.036
.059
.034

4.8 Page 38

▲back to top


Appendix table 2:
District
Morena
Bhind
Gwalior
Datia
Shivpuri
Guna
Tikamgarh
Chhatarpur
Panna
Sagar
Damoh
Satna
Rewa
Shahdol ~
Sidhi
Mandsaur
Ratlam
Uiiain
Shajapur
Dewas
Jhabua
Dhar
Indore
West Nimar
East Nimar
Rajgarh
Vidisha
Index of intensiveness of population distribution in Madhya
Pradesh.
Year
1971
1981
1991
-.043
-.020
-.005
.278
.269
.262
.243
.257
.260
.125
.114
;
"
.111
-.154
-.145
-.132 ." .,
. -.123
-.114
-.100 ' . "
.079
.094
.097 ,
-.057
-.062
-.048 '
-.194
.043
·.192
.040
-.191
.
.032
-.078
.113
-.076
.
.. 116
-.084
.116
.. 217
-.107
, .211
.
J
-.089
.216
-.079
-.105
. -.097
-.059
.019
.040
.027
.137
.136
.127
.178
.193
.184
.067
.062
.048
-.045
.020
-.016
-.001
-.006
.048
.041
.034
.051
.447
".448
.498
.007
.013
.004
-.061
-.041
-.050
.047
.044
.002
-.022
.044
-.054

4.9 Page 39

▲back to top


Population of Madhya Pradesh
District
Bhopal
Sehore
Raisen
Betul
Hoshangabad
Jabalour
Narsimhapur
Mandla
Chhindwara
Sconi
Balaghat
Surguia
Bilaspur
Raigarh
Rajnandgaon
Durg ~'
Raiour
Bastar
.'
I'
1971
.342
-.087
-.158,
-.108
-.068
.247
.032
-.154
-.050
-.090
.052
~.199
.116
-.023
-.022
.263
.117
-.384
.,
Year
',
1981
.438
-.071 ,
-.147
-.106
-.070' ..
' ~265
:
.032
-.177
-.052
. -.105
.024
!
-.206
.101
'.023
-.050
;275
.090
-.397
."
1991
.514
-.067
-.158
-.103
-.073
.242
.011
-.185
-.052
-.116
-.004
-.204
.107
-.048
-.062
.275
.090
-.410

4.10 Page 40

▲back to top


District
Morena
Bhind
Gwalior
Datia
Shivpuri
Guna
Tikamgarh
Chhatarpur
Panna
Sagar
Damoh
.
Satna
Rewa
Shahdol _
Sidhi .,
Mandsaur
Ratlam
Ujjain
Shajapur
Dewas
Jhabua
Dhar
Indore
West Nimar
East Nimar
Rajgarh
Vidisha
Population Distribution
Composite index of population
Pradesh.
Year
1971
1981
-.001
0
.005
.005
.005
.005
.001
.001
-.003
-.002
-.002
-.002
.001
,. .001
-.001
-.001
-.002
-.002
.001
.001
-.001
-.001
.002
.003
.005
.005
-.003
-.002
-.002
-.002
0
.001
.002
.002
.004
.004
.001
.001
-.001
0
0
0
.001
.001
.011
.013
0
0
-.001
-.001
.001
.001
0
-.001
distribution in Madhya
1991
0
.006
.005
.001
-.002
-.002
.001
-;001
-.002
.001
-.001
.003
.005
-.002
-.001
-.002
.002
.004
.001
0
.001
.001
.014
0
-.001
0
-.001

5 Pages 41-50

▲back to top


5.1 Page 41

▲back to top


Population of Madhya Pradesh
District
Bhopal
Sehore
Raisen
.Betul
Hoshangabad
Jabalour
,
Narsimhapur
Mandla
Chhindwara
Seoni ;
Balaghat
Surguia
Bilaspur
Raigarh
Rainandgaon
Durg ,-
Raipur
Bastai'
1971
.005
-.001
-.002
-.002
-.001
.010
0
,..003
-.001
-.001
.001
-.006
.007
.001
-.001
.009
.007
-.014
Year
1981
.008
-.001
-.002
-.002
-.001
.011 .
0
-.004
-.001
.
,..002
.
.001
-.006
.006
-.001
" -.001
.100
. .005
-.140
1991
.010
-.001
-.002
-.002
-.001
.010
0
-.004
-.001
-.002
0
-.006
.006
,..001
-.001
.100
.005
-.140

5.2 Page 42

▲back to top


Transition in Number of Live Births in
Madhya Pradesh:
1981-91
Introduction
This paper-is focused toward the change in the number of live births in Madhya
Pradesh and in its constituent districts during the decade 1981-91. If it is assumed
that the contribution of migration to change in the size ofthe population is negligible,
then the number of live births constitutes. one of the two components of population
change - the other being the number of deaths. But the direction of the contribution
of number of live births and number of deaths to population change is in opposite
direction. A decrease in the number of deaths results in an increase in population
whereas a decrease in the number of live births results in a decrease in population.
Since, longevity is the cherished dream of humanity and all development activities,
a reduction in the number of live births is the only way out to control population
growth. These considerations constitute the basis for population control programme
which is directed toward reducing number of live births through a reduction in the
crude birth rate. In this context, an analysis ofthe change in the total number oflive
births also provides an opportunity to analyze the impact of population controf
programme on population growth.
Madhya Pradesh is one of those states of the Republic of India where the rate of
population growth remains high and increase in population continues to be rapid.
Since there is no evidence of any substantial decrease in the risk of death which

5.3 Page 43

▲back to top


,might have resulted in a rapid decrease in the total number of deaths in the state, it
.may be argued that primary reason behind rapid population growth in the state is the
large number of live births. An analysis of the trends and determinants of total
number of live births, therefore, is expected to provide a· better insight of the
demographic dynamics that.prevails in the state.
Methodology
Let B denotes the total number oflive births in a year in a population with population
size N. If the crude birth rate is denoted by CBR, then
penoting by TMF, the total marital fertility rate and by TFR the total fertility rate,
equation (1) can be written as
B = N x TMF x (TFR/TMF) x (CBR/TFR)
= N x TMF x (EMF) x (ASB)
Note that the ratio EMF = TFR/TMF is nothing but the fertility inhibiting effect of
marriage patterns in the terminology ofBongaarts (1978). In the present context, this
ratio represents the effect of marriage patterns on the total fertility rate. On the other
hand, the ratio ASB = CBRlTFR measures the age structure effects on crude birth
rate Horiuchi (1991).
Equation (2) is the basic decomposition that we use in the present analysis. This
equation suggests that four factors contribute to increase or decrease in total number
of live births in any population,,· the size of,the population, average number of
children born per currently married woman in her reproductive period, the effect of
marriage patteJ;1ls on total fertility rate and the ~ge structure effects on crude birth
rate. This means that changes in total number of live births in any population should
be analyzed and e~plored in the context of changes in the. size of the population, in
the level oftotal marital fertility rate, changes in marriage patterns and changes in the
age structure effects on crude birth rate.
'
Equation (2) can also be used to measure the impact of population control efforts on
the total number of live births in the state. Population control activities in the state
are organized
under the National
Family
Welfare Programme
,
and are. directed
solely

5.4 Page 44

▲back to top


to the promotion of family planning methods to reduce the marital fertility. This
means that population control efforts influence the total marital fertility only.
Equation (2) permits us to estimate the change in the number oflive births due to the
change in the total marital fertility rate when other determinants oftotal number of
live births are kept constant.
IfBt denotes the total number oflive births in the Qeginning of the period t and Bz
denotes the total number of live births at the end of the period, then the exponential
growth in the total number of live births in the period t is given by
where rp is the average annual rate of change in the size of the population; rImis the
average annual rate of change in the total marital fertility rate; rfinis the average
annual rate of change in the effect of marriage patterns on total fertility rate; and rbf
is the average ~ual rate of change in the age structure effects on crude birth rate.
Equation (4) suggests that the rate of change in total number of live births in a
population-is the algebraic sum of the rate of change in the size of the population,
rate of change in the total marital fertility rate, rate of change in the effects of
marriage patterns on total fertility rate and rate of change in age structure effects on
crude birth rate. In this way, the relative contribution of the change in the size ofthe
population, total marital fertility rate, effect of marriage patterns on total fertility rate
and age structure effects on crude birth rate on total number of live births over time
can be measured and analyzed, thereby permitting to assess the relative role of the
four factors in the transition in total number of live births.
Bz - Bt = (Pz - Pt) x TMFz x EMFz x ASBz
+ (TMFz - TMF1) x Pz x EMFz X ASBz
+ (EMFz - EMF1) x Pz x TMFz x ASBz
+ (ASBz - ASBt) x Pz x TMFz X EMFz
+ Interaction term

5.5 Page 45

▲back to top


Population o(Madhya Pradesh
Equation (5) can be used to estimate the actual number of live births contributed by
the change in the four contributing factors to the total change in the total number of
live births over a period oftime.
Data Source
The analysis is built upon the district level information onthe size of the population,
total marital fertility rate, total fertility rate and crude birth rate made available by the
Registrar general of India on the basis of 1981 and 1991 population censuses
(Government ofIndia, 1997). The estimates of fertility indicators provided by the
Registrar General are derived through indirect techniques of demographic estimation
and are based upon the information on children ever born and any live birth during
the year preceding the enumeration collected during the census. This information was
collected from all currently married women in the reproductive age group. As such,
estimates of fertility indicators employed in this analysis are based on the fertility
experience of currently married couples only. They do not take into account the
fertility experience of widowed and divorced women. It is assumed that the fertility
experience ·of widowed and divorced women is similar to that of the currently
married women and the bias due to omitting the divorced and widowed women in
estimating the indicators of fertility is almost negligible. It may be pointed out that,
at the district level, this is the only source of information about. fertility related
indicators in the state.
Findings
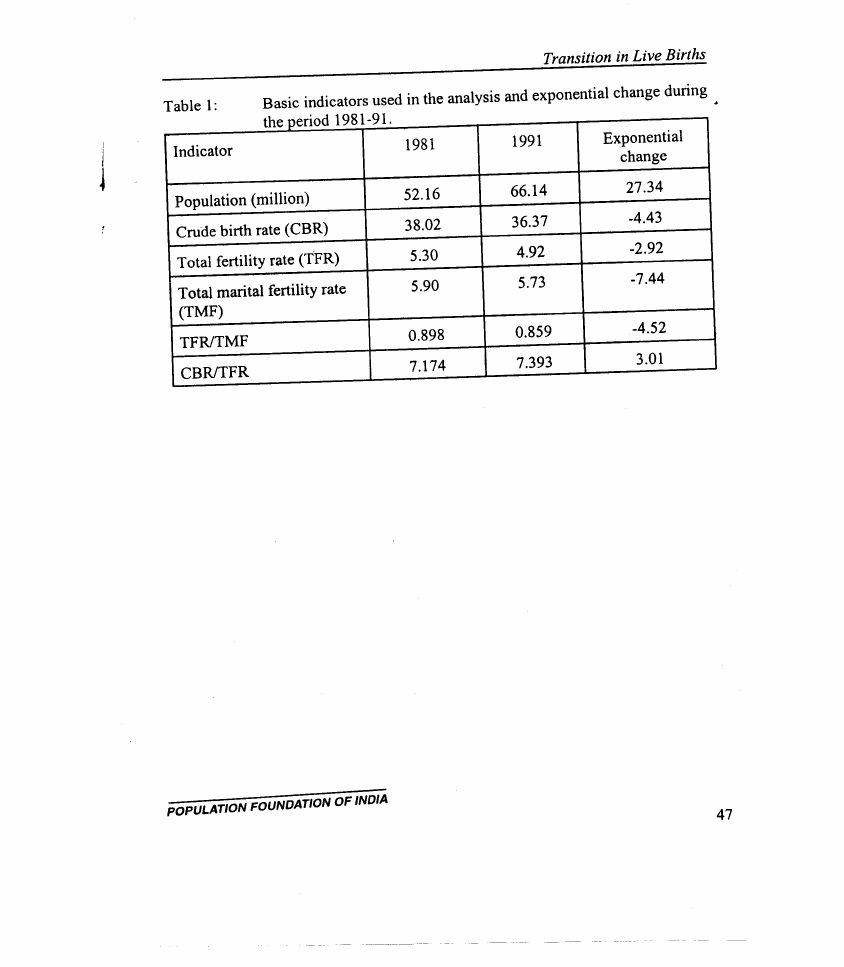
Basic information used in the analysis is compiled in table 1. In 1981, the population
of the state was enumerated to be 52.16 million which increased to 66.14 million in
1991. This means that in a period often years between 1981 and 1991, the population
of the state has recorded a growth of 27.34 per cent. During the same period, the
crude birth rate in the state recorded a decrease of 4.43 per cent from 38.02 per 1000
population in 1981 to 36.3 7 per 1000 population in 1991; total fertility rate recorded
a decrease of 2.92 per cent while total marital fertility rate recorded a decrease of
7.44 per cent. As the result the ratio of total fertility rate to total marital fertility rate
recorded a decrease/of 4.52 per cent while the ratio of cnuie birth rate to total fertility
rate recorded an increase of3.01 per cent. .
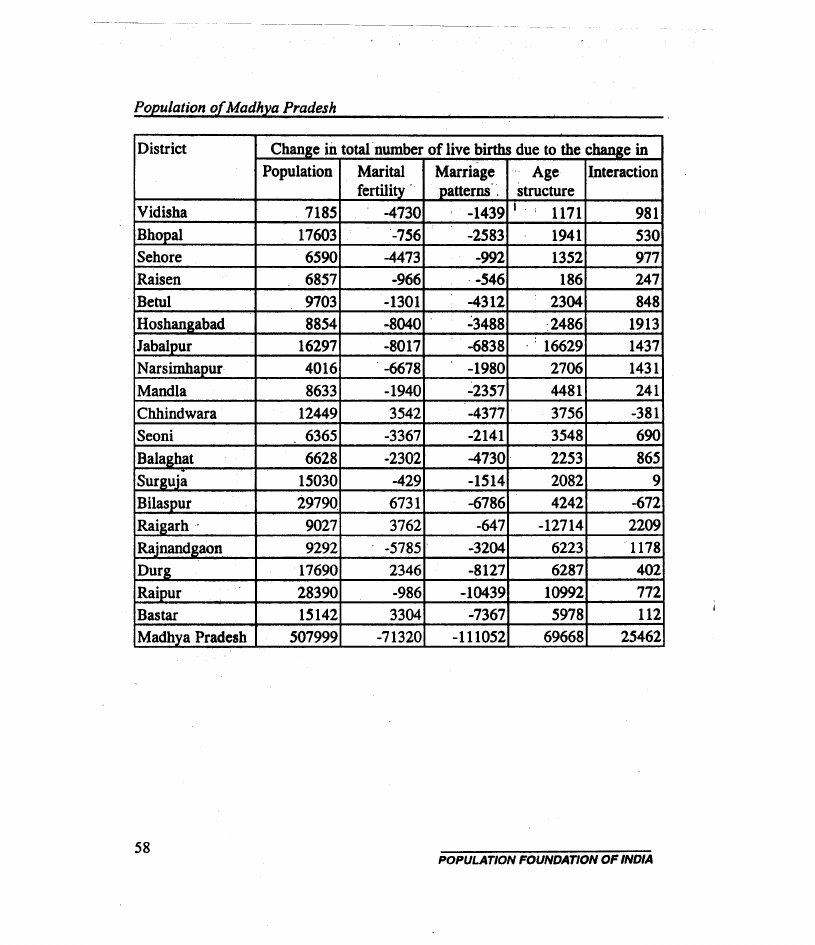
As the result of the differential rate of growth in the determinants of number oflive
births, the total number of live births in the state increased from 1.983 million in
1981 to 2.405 million in 1991 which amounts ~o a growth of 19.31 per cent in a

5.6 Page 46

▲back to top


duration of 10 years. Main contributor to this growth in the total number of live
births, as may be seen from table 1, is the growth ofthe population. The population
of the state increased by 27.34 per cent during the decade underreview. In addition
to the increase in population, the increase in the index of age structure effects on
crude birth rate has also contributed toward the growth of total number oflive births
in the state. In contrast, change in both the total marital fertility rate and change in
the effect of marriage patterns on total fertility rate had acted to decrease the total
number oflive births. However, the negative growth rate in total marital fertility rate
and in the ratio of total fertility rate to total marital fertility rate has been marginal
as compared to the positive growth rate in the size of the population and the positive
growth of the age structure effects on crude birth rate.
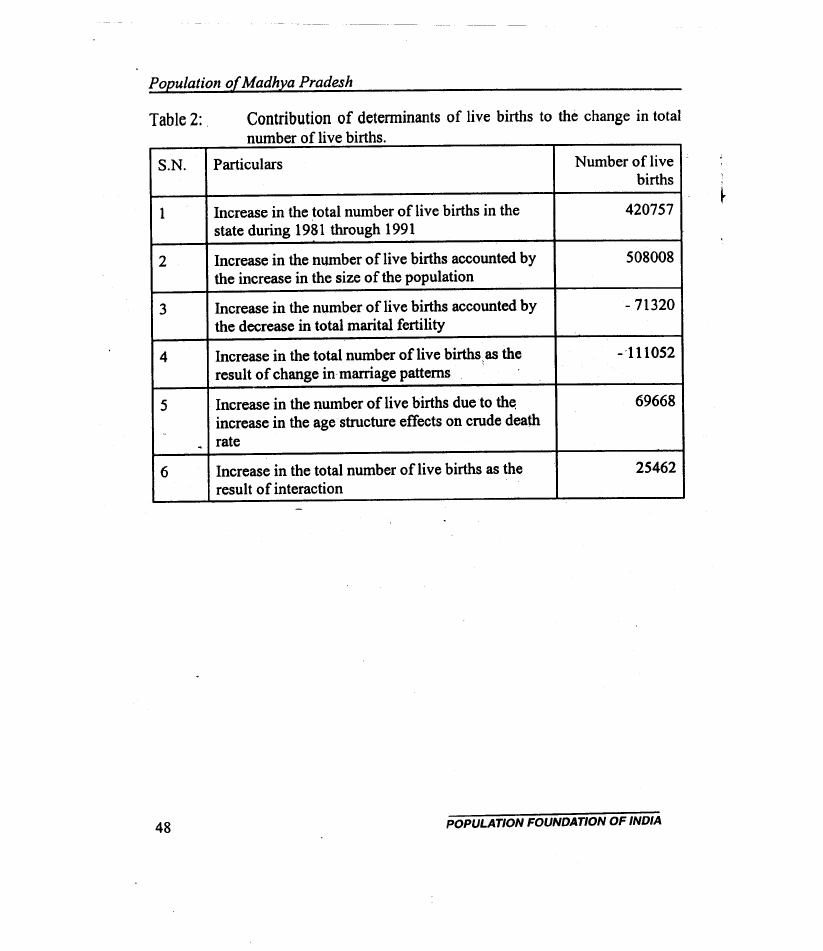
Because of these changes, total number of live births in the state increased from
1.983 million in 1981 to 2.405 million in 1991. This means that during the decade,
total number of live births in the state increased by more than 420 thousand live
births. One would have expected a reduction in the total number oflive births in the
state as the result ofthe implementation of National Family Welfare Programme. But
the fact is 'that instead of decreasing, total number of live births in the state has
actually increased during the decade. This increase in the total number oflive births
appears to have been responsible for the increase in the population growth rate that
has been recorded in the state in the eighties.
A decomposition of the increase in the total number oflive births in the state during
the period under reference suggests that the change in the total marital fertility rate
and in the ratio of total fertility rate to total marital fertility rate has resulted in a
decrease in the total number of live births. But total decrease in the number of live
births due to these two factors has been less than the increase in the number of live
births due to the increase in population size, changes in the age structure effects on
crude birth rate and the interaction effect. In fact, decrease in the number of live
births as the result of the decrease in total marital fertility rate is almost same as the
increase in the number of live births as the result of the change in age structure
effects on crude birth rate.
Another interesting finding of the analysis is that total number of live births
prevented as the result of effect of changes in the marriage patterns on total fertility
rate is more than those prevented as the resulted ofthe change in total marital fertility
rate. This observation gains significance because of the fact that the onus of the

5.7 Page 47

▲back to top


National Family Welfare Programme in the country is almost entirely on reducing
fertility within the institution of marriage. Efforts to increase the age at marriage have
generally been left to the process of social and economic development, especially
through the improvements in female literacy. Clearly, the impact of National Family
Welfare Programme in reducing the number of live births in the state has, at best,
been marginal.
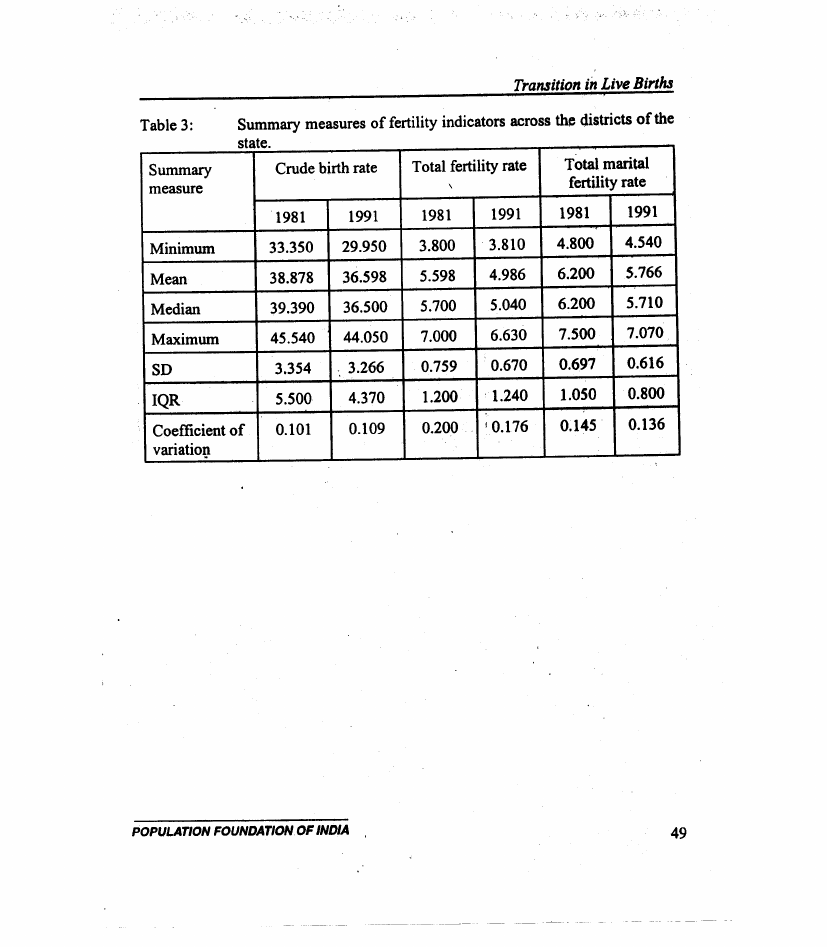
The above methodology has also been applied for each ofthe 45 districts ofthe state.
Summary measures ofthe three fertility indicators used in this analysis - crude birth
rate, total fertility rate and total marital fertility rate - are given in table 3. The fact
that the district~ of the state vary widely on the scale of fertility is very much clear
from the table. An interesting observation of the table is that in case of crude birth
..rate the coefficient of variation has increased over time but it has decreased in case
of total fertility rate and total marital fertility rate. This shows that variability in
marriage patterns as well as variability in the age structure of population across the
districts of the state has increased over time.
In order to identify cluster of districts which behave in a similar manner in terms of
cJ1anges in population growth rate, growth rate in total marital fertility rate, growth
rate in the ratio of total fertility rate to total marital fertility rate and growth rate in
the ratio of crude birth rate to total fertility rate, we have applied the cluster analysis
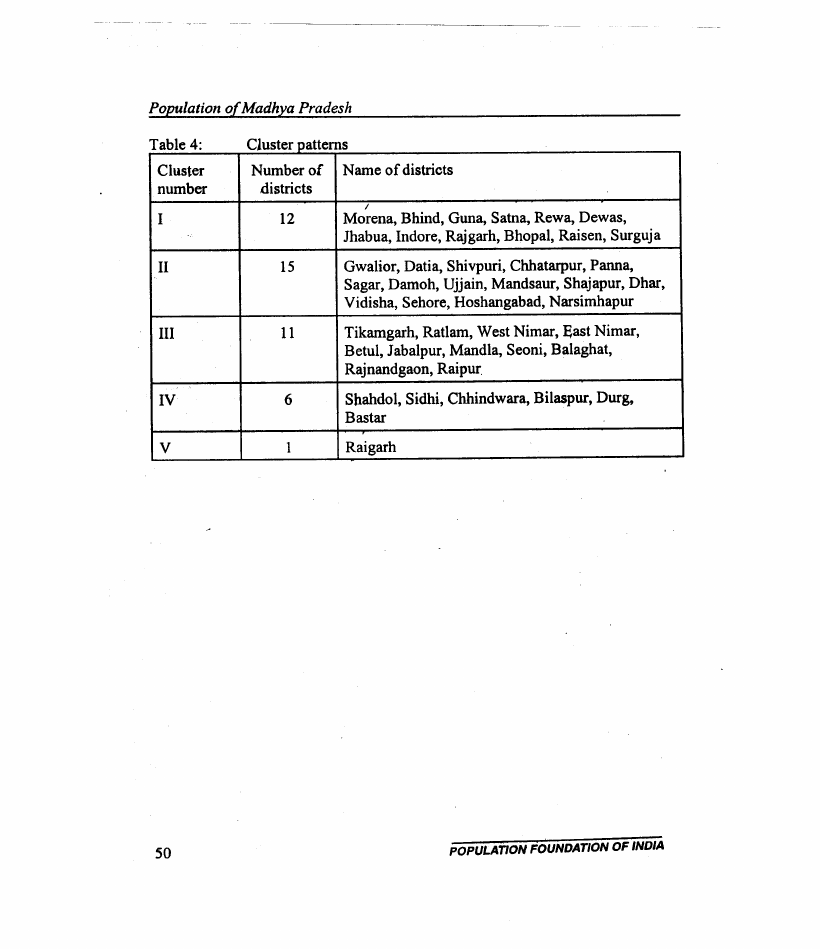
procedure. The K-me~s clustering method was applied to identify the group of
districts in a manner that the within group variation is minimized. The exercise
revealed that all but one of the 45 districts of the state can be grouped into four
clusters. The only district which could not be grouped with any other district of the
state is district Raigarh. The pattern of change in the four determinants of total
number of births in this district has been found to be typical of all other districts.
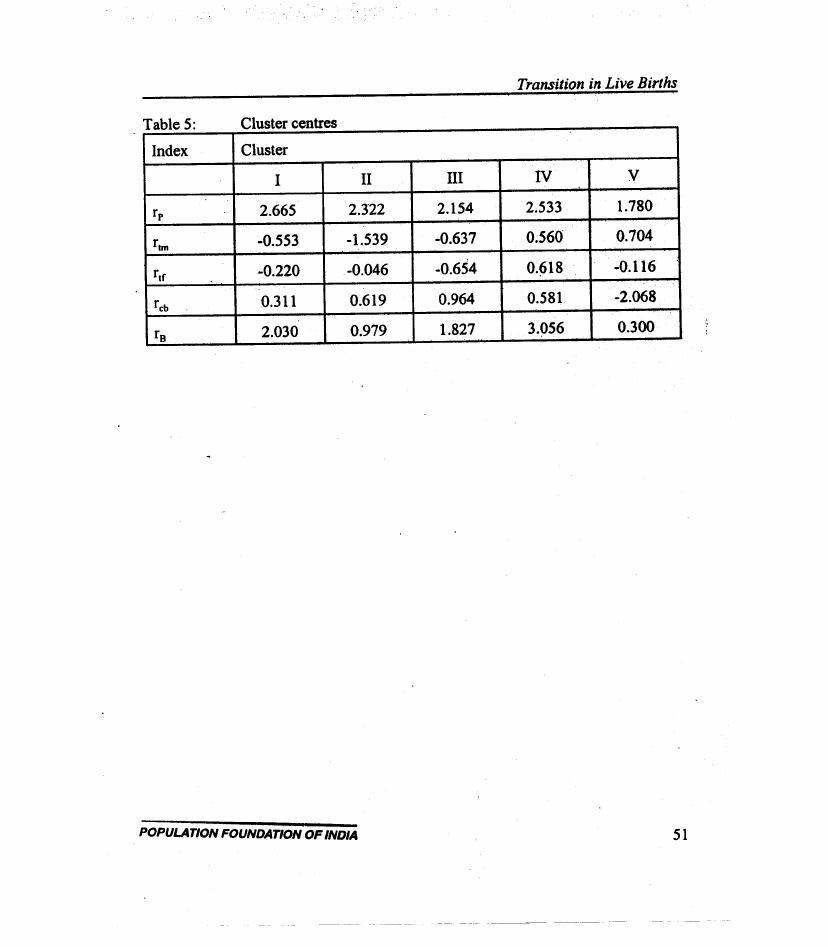
The K-means clustering method also identifies the centre of clusters around which
the cluster districts are located. This centre, actually refers to the central tendencies
of the cluster concerned. The values of the growth rate Gf the four determinants of
total number oflive births for five centres identified in the analysis are given in table
5 along with the growth rate in the total number of births. The growth rate of total
number of births during the period 1981 through 1991 has been found to be highest
in cluster IV. In the districts ofthis cluster, the total number oflive births increased
by more than 30 per cent in between the period 1981 through 1991. In cluster I also,
the growth of total number of live births in the decade was quite rapid.

5.8 Page 48

▲back to top


By contrast, increase in the total number of live births was found to be lowest in
cluster V where total number of live births increased by just 3 per cent during the
period under reference. In addition to cluster I, in cluster II also, the growth of total
number of live births has been very slow - less than 10 per cent in a period of 10
years.
It may be seen from table 5 that reasons behind a typical growth pattern in total
number oflive births in different clusters of the state are different. The rapid growth
in the total number oflive births in cluster IV, for example, is attributed to a rapid
growth of population, an increase in total marital- fertility and a positive trend in the
age structure effects on crude birth rate. By contrast, a very slow growth of total
number of live births in cluster V is primarily due to a very strong negative trend in
the age structure effects on crude birth rate and a relatively slow growth of
population - a reflection of the prevalence of low fertility levels in the past. But the
total marital fertility rate has shown an increasing trend in this cluster during the
decade as the result of which, total number oflive births has shown a very marginal
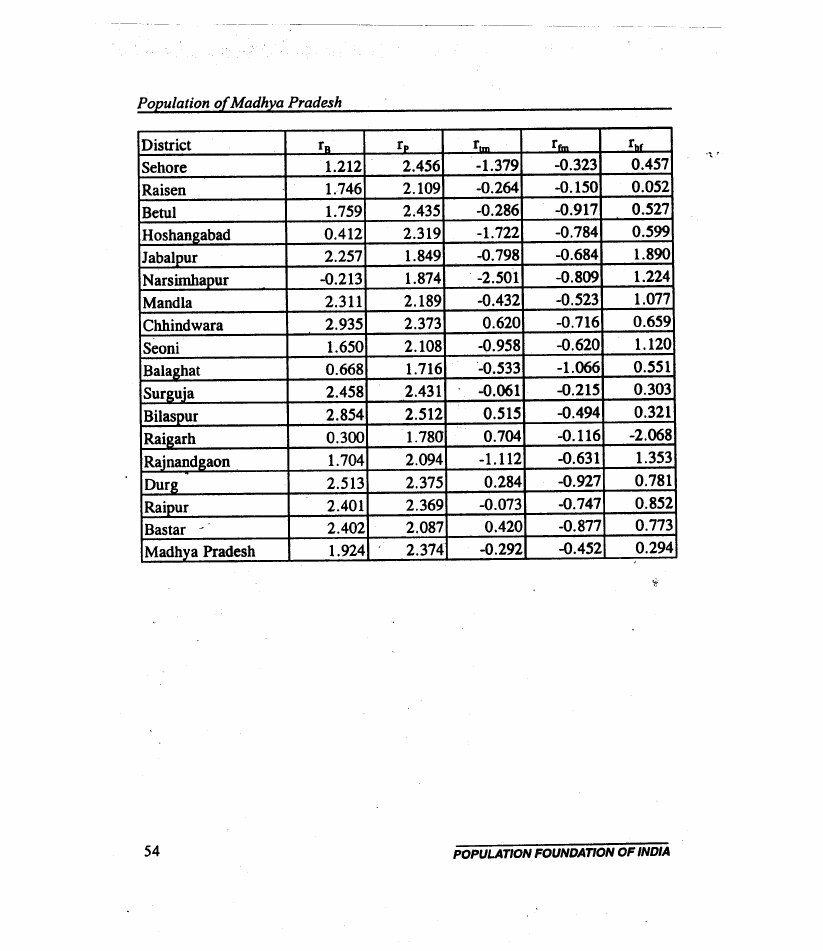
growth during the period under reference.
Primary reason behind a relatively slow growth of total number of live births in
districts of cluster II, on the other hand, is a relatively sharp decrease in total marital
fertility rate. During the decade under reference, total marital fertility rate in the
districts of this cluster decreased, on average, by more than 15 per cent. This decrease
in the total marital fertility rate has been able to compensate, to a substantial level,
the effect of rapid population growth on the total number of live births. On the other
hand, in districts of cluster III, a strong increasing trend in the age structure effects
on crude birth rate appears to be one of the factors in the growth of total number of
live births. This strong increasing trend in the age structure effects on crude birth rate
is a reflection of the prevalence of high fertility levels in the distant past and a
decreas~ in these levels in the recent past.
As the result of varying growth rate oftotal number oflivebirths in different clusters,
the contribution of each cluster to the increase in the total number of live births in
between 1981 and 1991 also varies widely. It may be seen from table 6 that just 6
districts of cluster IV account for nearly 30 per cent of the increase in the total
number of live births in the state during the decade 1981-91. Similarly, 12 districts
of cluster I account for another 30 per cent while 11'districts. of cluster III account for
about 27 per cent of the increase in the total number of live,births in the state during

5.9 Page 49

▲back to top


the period under reference. By contrast, the 15 districts of cluster II account for only
about 13 per cent of the increase and one district of cluster V only about 0.4 per cent
of the increase in the total number oflive births in the state. Clearly, majority of the
increase in the total number of live births in the state during the period under
reference has been confined to 6 districts of cluster IV. In these districts, total number
of live births increased from 0.359 million in 1981 to 0.483 million in 1991 - an
increase of 0.124 million in a period of 10 years.
Among the individual districts, only Narsimhapur district has recorded a negative
growth in the total number of live births during the period under reference. The
remaining 44 districts, however, vary widely in terms of the growth in the total
number of live births. In 9 districts, the growth rate of total number of live births
during the period 1981-91 has been less than 10 per cent while in 16 districts, it
varied from 11 to 20 per cent. By contrast, in district Sidhi, the growth rate in the
total number oflive births has been estimated to be alarmingly high - more than 40
per cent in a period of 10 years. In Shahdol and Bhopal also, the growth rate in the
number of live births has been estimated to be very high.
As resards the change in total marital fertility rate, in all but seven districts of the
state, this rate has recorded a decrease of varying magnitude during the period under
reference. The seven districts where the total marital fertility 'rate. has increased
. during the period under reference are Shahdol, Sidhi, Chhindwara, Bilaspur, Raigarh,
Durg and Bastar. Of these seven districts, all but Raigarh, belong to cluster VI as
identified above. In all these districts, the total marital fertility rate was more than 5 .
live births per woman in 1981 and this number has increased further in between 1981
and 1991. On the other hand, change in the ratio oftotal fertility rate to total marital
fertility rate has been found to be negative in all districts except district Shajapur and
district Morena whereas the change in the ratio of crude birth rate to total fertility rate
has been found, to be positive in all districts except district Raigarh. This positive
change in the age structure effects on the crude birth rate is basically a reflection of
high fertility levels .that had prevailed in these districts in the past. By contrast, a
negative change in the age structure effects on crude birth rate in district Raigarh is
a reflection of low fertility levels in the district in the past.
'
Conclusions
j"
,
The present analysis depicts a'relatively gloomy picture for the state of Madhya
. Pradesh as far as transition in the total number of live births is concerned. Since

5.10 Page 50

▲back to top


population growth is directly related to the growth in the total number oflive births,
it is clear that in the years to come, there is little hope for a slow down in population
growth in the state.
The analysis also highlights the fact that the activities initiated to reduce total marital
fertility rate under the National Family Welfare Programme have not been effective
enough to bring down the total number oflive births per year. As the result of these
activities, the total marital fertility rate in the state as a whole has decreased only
marginally. But the number of live births prevented due to this decrease in total
marital fertility rate have not been sufficient enough to compensate for the increase
in the total number of live births as the result of the increase in the size of the
population as well as the increase due to changes in the age structure effects on crude
birth rate. As the result, despite a reduction in the total marital fertility rate, total
number of live births in the state have increased over time. This indicates that the
National Family Welfare Programme in the state has only a limited impact in terms
of the reduction in the total number of live births in the state. Interestingly, the
impact ofthe transition in marriage patterns on the total number oflive births in the
state has been more than the impact of transition in total marital fertility rate. This
observation questions the efficiency as well as the effectiveness of the National
Family Welfare Programme in the state.
In any case, the analysis reveals that if a reduction in the total number of live births
is to be ensured, a more rapid reduction in the total marital fertility rate will have to
be secured. This calls for improving both efficiency as well as effectiveness of
fertility reduction efforts in the state. There is an immediate need for a critical
analysis of the context and contents of the National Family Welfare Progran;une in
the state in this regard. In view of the fact that the transition·in the total number of
live births vary widely across the districts ofthe state, a decentralized, district-based
approach for the implementation ofthe National Family Welfare Programme needs
to be developed to making the programme efficient as well as effective. This is
particularly the case in Shahdol, Sidhi, Chhindwara, Bilaspur, Raigath, purg and
Bastar districts where the total marital fertility has increased over time. Incidently,
these seven districts, alone, account for more than 30 per cent ofthe increase in total
number oflive births in the state in between 1981 and 1991.

6 Pages 51-60

▲back to top


6.1 Page 51

▲back to top


Bongaarts J (1978) A framework for analyzing proximate determinants of
fertility. Population and Development Review, 4(1): 105-132 .
. Government of India (1997) District Level Estimates offertility and Child
Mortality for 1991 and their Inter-relations with Other Variables. Occasional
Paper No. 1 of 1997, New Delhi, Registrar General.
Horiuchi S (1991) Measurement and analysis of cohort size variations.
Population Bulletin of United Nations, 30: 106-124.
.

6.2 Page 52

▲back to top


Indicator
Basic indicators used in the analysis and exponential change during
the peno. d 1981-91
1981
1991
Exponential
change
Population (million)
52.16
66.14
27.34
Crude birth rate (CBR)
38.02
36.37
-4.43
Total fertility rate (TFR)
5.30
4.92
-2.92
Total marital fertility rate
5.90
5.73
(TMF)
-7.44
TFRlTMF
0.898
0.859
-4.52
CBRlTFR
7.174
7.393
3.01

6.3 Page 53

▲back to top


Population o(Madhya Pradesh
Contribution of detenninants of live births to the change in total
number of live births.
S.N. Particulars
Number of live
births
1
Increase in the total number of live births in the
state during 1981 through 1991
420757
2
Increase in the number of live births accounted by
the increase in the size of the population
508008
3
Increase in the number of live births accounted by
the decrease in total marital fertility
- 71320
4
Increase in the total number of live births:as the
result of change in marriage patterns
-'111052
5
Increase in the number oflive births due to th~
increase in the age· structure effects on crude death
. rate
69668
6
Increase in the total number of live births as the
result of interaction
25462

6.4 Page 54

▲back to top


Transition in Live Births
Summary
measure
Summary measures of fertility indicators across ~ districts of the
state.
Crude birth rate
Total fertility rate
\\
Total marital
fertility rate
1981
1991
1981 1991 1981 1991
Minimum
33.350 29.950 3.800 3.810 4.800 4.540
Mean
38.878 36.598 5.598 4.986 6.200 5'.766
Median
39.390 36.500 5.700 5.040 6.200 5.710
Maximum
45.540 44.050 7.000 6.630 7.500 7.070
SO
3.354 -,3.266 0.759 0.670 0.697 0.616
.
IQR
5.500 4.370 1.200 1.240 1.050 0.800
Coefficient of
variatiotl
0.101
0.109
0.200 ! 0.176 0.145 0.136

6.5 Page 55

▲back to top


Population of Madhya Pradesh
ae
Cluster
number
I
II
III
IV
V
us er pa ems
Number of
districts
12
Name of districts
I
Morena, Bhind, Guna, Satna, Rewa, Dewas,
Jhabua, Indore, Rajgarh, Bhopal, Raisen, Surguja
15
Gwalior, Datia, Shivpuri, Chhatarpur, Panna,
Sagar, Damoh, Ujjain, Mandsaur, Shajapur, Dhar,
Vidisha, Sehore, Hoshangabad, Narsimhapur
11
Tikamgarh, Ratlam, West Nimar, East Nimar,
Betul, Jabalpur, Mandla, Seoni, Balaghat,
Rajnandgaon, Raipur.
6
Shahdol, Sidhi, Chhindwara, Bilaspur, Durg,
Bastar
1
Raigarh

6.6 Page 56

▲back to top


Index
rp
flm
f1f
fcb
fo
Clustef
I
2.665
-0.553
-0.220
0.311
2.030
II
2.322
-1.539
-0.046
0.619
0.979
III
2.154
-0.637
-0.654
0.964
1.827
IV
2.533
0.560
0.~18 .
0.581
3.056
V
1.780
0.704
.
-0.116
-2.068
0.300

6.7 Page 57

▲back to top


Cluster
Contribution of different clusters to the increase in total number of
live births.
Estimated number of live
births
Increase in total number of
live births
1981
1991
Number
Proportion
I
500583
627067
126484
30.06
II
531808
587218
55410
13.17
III
537766
65138.1
113615
27.00
IV
359267
482878
123610
29.38
V
53716
55354
1638
0.39
All clusters
1983141
2403898
420757
100.00

6.8 Page 58

▲back to top


Appendix table 1:
District
Morena
Bhind
Gwalior.
Datia
Shivpuri
Guna
Tikamgarh
Chh8tarpur
Panna
Sagar
Damoh
Satna
Rewa
Shahdol
Sidhi
Mandsaur
Ratlam
UUain
Shaiapur
Dewas
Jhabua
Dhar
Indore
WNimar
ENimar
Raigarh
Vidisha
Bhooal
Transition in Live Births
Average annual growth rates of total number oflive births
and 1'ts coml onen ts fior the di'stricts 0fth e statet 1981 -91
r ••
rD.
r._ .
r~
r",r
2.585
2.703
-0.320
0.067
0.136
1.486
2.208
-0.834
-0.111
0.222
0.838
2.446
-1.449
-0.340
0.180
1.374
2.431
-1.371
-0.478
0.792
1.386
2.679
-1.302
-0.416
0.425
2.293
2.676
-0.606
-0.135
0.358
2.138
2.440
-0.873
-0.277
0.848
1.316
2.677
-1.609
-0.422
0.670
0.932
.
1.211
2.375
2.185
-1.278
-1.117
-0.373
-0.380
0.208
0.524
0.985
2.184
-1.449
-0.446
0.696
2.193
2.374
-0.505
-0.125
0.448
2.151
3.409
2.497
.
2.592
-0.182
0.773
-0.187
-0.492
0.023
0.536
4.218
3.258
0.751
-0.205
0.414
0.280 ,2.080 . -2.275
-0.292
0.767
1.606
2.159
-0.830
-0.414
0.692
0.465
2.161
-1.919
-0.479
0.701
1.356
2.061
-1.345
0.034
0.606
2.092
2.610
-0.648
-0.487
0.617
2.713
3.508
-0.921
-0.097
0.223
2.245
2.756
-1.174
-0.196
0.860
1.442
2.616
-0.951
-0.713
0.491
1.505
2.171
-0.804
-0.673
0.811
1.982
2.168
-0.313
-0.644
0.771
1.734
2.137
-0.873
-0.007
0.476
0.892
2.151
-1.200
-0.380
0.321
3.868
4.116
-0.144
-0.483
0~379

6.9 Page 59

▲back to top


Population of Madhya Pradesh
District
Sehore
Raisen
Betul
Hoshangabad
Jabalpur
Narsimhapur
Mandla
Chhindwara
Seoni
Balaghat
Surguja
Bilaspur
Raigarh
Rajnandgaon.
DurJt
Raipur
Bastar ~
Madhya Pradesh
rR
1.212
1.746
1.759
0.412
2.257
-0.213
2.311
2.935
1.650
0.668
2.458
2.854
0.300
1.704
2.513
2.401
2.402
1.924
rp
2.456
r,m
-1.379
2.109 -0.264
2.435 -0.286
2.319 -1.722
1.849 -0.798
1.874 -2.501
2.189 -0.432
2.373
0.620
2.108 -0.958
1.716 . ·-0.533
2.431 -0.061
.
2.512
0.515
1.780 0.704
2.094 -1.112
2.375
0.284
2.369 -0.073
2.087
0.420
2.374 -0.292
rrm
-0.323
-0.150
-0.917
-0.784
-0.684
-0.809
-0.523
-0.716
-0.620
-1.066
-0.215
-0.494
-0.116
-0.631
-0.927
-0.747
-0.877
-0.452
rhf
0.457
0.052
0.527
0.599
1.890
1.224
1.077
0.659
1.120
0.551
0.303
0.321
-2.068
1.353
0.781
0.852
0.773
0.294

6.10 Page 60

▲back to top


Appendix table 2:
District
Morena
Bhind
Gwalior
Datia
Shivpuri
Guria
Tikamgarh
Chhatarpur
Panna
Sagar
Damoh .
Satna
Rewa
Shahdol .-
Sidhi
Mandsaur
Ra:tlam
Ujjain
Shajapur
Dewas
Jhabua
Dhar
Indore
W Nimar
E Nimar
Rai~arh
Transition in Live Births
Estimates of total number of live births in the districts of
Mdah ya Praeds. h
Estimated number of live births
Change
1981
.1991
58084
75221
17136
39118
45385
6267
45102
49042
3940
12466
14303
1836
35139
40365
5225
42113
52967
10854·
32781
40597
7816
37408
42669
5261
24591
26992
2401
57199
64564
7365 .
30979
34187
3208 .
47520
59169
11650
48967
60719
11751
47846
67282
19436
38331
58444
20113
48388
49760
'1372
29861
35064
5203
41519
43493
1974
32350
37047
4697
30079
37078
6999
33914
44485
10571
40866
51153
10287
49374
57032
7658
64797
75318
10521
45739
55767
10027
31214
37123
5909

7 Pages 61-70

▲back to top


7.1 Page 61

▲back to top


Population of Madhya Pradesh
District
Vidisha
Bhopal
Sehore
Raisen
Betul
Hoshangabad
Jabalpur
Narsimhapur
Mandla
Chhindwara
Seoni
Balaghat
Surguja
Bilaspur
Raigarh
Rainandgaon
Durg
',e
Raipur
Bastar
Madhya Pradesh
Estimated number of live births
1981
1991
33947
37115
35441
52176
26801
30255
·30283
36060
37654
44895
41051
42777
77044
96551
24001
23496
34846
43905
43949
58938
28389
33482
39312
42027
54476
69653
100828
134132
53716 ,
41470
55354
49174
65085
83684
105872
134601
63228
80397
1983141
2403898
Change
3167
16735
3454
5777
7241
1726
19507
-505·
9059
14989
5093
2714
15177
33305
1638
7705
18598
28729
17169
420757

7.2 Page 62

▲back to top


Appendix table 3:
Components of change in the total number of live births in
the d"lstncts 0fMdah lya Pradesh , 19819-1
District
Chanl:te in total number of live births due to the chanl:te in
Population
Marital
fertility
Marriage
Age Interaction
patterns structure
Morena
17814
-2447
502
1015
253
Bhind
8994
-3947
-507
998
729
Gwalior
10643
-7644
-1698
874
1764
Datia
3087
-2102
-701
1089
463
Shivpuri
9486
-5612
-1714
1680
1385
Guna
12437
-3310
-719
1862
584
Tikatugarh
8789
-3702
-1139
3301
567
Chhatarpur
10022
-7448
-1841
2764
1763
Panna
5706
-3681
-1026
557
846
Sagar
12671
-7632
-.2501
3295
1532
Damoh W
6707
-5329
-1559
2298
1090
Satna
12503
-3062
-744
2594
359
Rewa .-
13418
-1115
-1145
137
. 457
Shahdol
15361
.5006
-3390
3510
-1051
Sidhi
16251
4227
-1208
2370
-1526
Mandsaur
9344
-12714
-1473
3674.
2542
Ratlam
6808
-3035
-1482
2344
569
Ujjain
8453
-9199.
-2136
2946
1910
Shajapur
6899
-5331
127
2177
827
Dewas
8518
-2481
-1851
2217
596
Jhabua
13164
-4292
-435
982
1153
Dhar
12320
-6372
-1015
4216
1138
Indore
13127
-5692
-4216
2730
1709
W Nimar
14696
-6307
-5240
5865
1507
E Nimar
10869
-1770
-3710
4137
501
Rajgarh
7143
-3387
-24
1727
451

7.3 Page 63

▲back to top


Population of Madhya Pradesh
District
Vidisha
Bhopal
Sehore
Raisen
Betul
Hoshangabad
Jabalpur
Narsimhapur
Mandla
Chhindwara
Seoni
Balaghat
Surguja
.
Bilaspur
Raigarh-
Rajnandgaon
Durg
Raipur
'. '
Bastar
Madhya Pradesh
Change in total' number of live births due to the change in
Population
7185
Marital Marriage
Age Interaction
fertility " patterns', structure
-4730 , -1439 I ' ' 1171
981
17603
'-756 -2583
1941
530
6590
-4473
-992
1352
977
6857
-966
'-546
186
247
9703
-1301
-4312 2304
848
8854
-8040 ' ~3488 ,2486 1913
16297
-8017
-6838 ': 16629
1437
4016 '-6678
-1980 2706
1431
8633
-1940
-2357
4481
241
12449
3542
-4377 3756
-381
6365
-3367
-2141
3548
690
6628
-2302
-4730
2253
865
15030
-429 -1514 2082
9
29790
6731
-6786 4242
-672
9027
3762
-647 -12714 2209
9292
-5785 ' -3204 6223
1178
17690
2346
-8127 6287
402
28390
-986 -10439 10992
772
15142
3304
-7367 5978
112
507999 -71320 -111052 69668 25462

7.4 Page 64

▲back to top


Prospects of Fertility Decline in
Madhya Pradesh
IntrC;lduction
The 1991 population census has revealed that population of the state increased at the
rate of2:38 per year during the decade 1981-91. This rate of growth Was thkd highest
among all major states of the country, next only to Rajasthan and Haryana.
Moreover, ~~mpared to the decade 1971,:,81, there has been an ' increase in the
population growth rate in the state during the eighties. Since 1951, the population
growth rate in the state has always been'more than 2 per cent per year and, there is'
little sign of any decreasing trend in this growth rate. This increase in population
growth rate in the state may be attributed to a continued decline in mortality and
persistence of high fertility. Information available from the sample registration
system suggests that decline in mortality was more rapid in the state than'the decline
in fertility during the period 1981-91. Inract, fertility levels in the state remained
practically stagnant or even increased rjghtup to 1987. It was 'only after 1987 that
some decline in fertility levels in the state has been observed.
Since persistence of a PQPulation growth rate of more then 2 per cent per year may
be viewed as a direct consequence of high fertility, future population growth in the
state will depend largely upon future fertility trends. It may also be pointed here that
although mortality levels in the state are declining, they are still regarded as high. A
further reduction in mortality, therefore, is expected to result in a further increase in
population growth rate ifthe mortality decline is not associated with an equally rapid

7.5 Page 65

▲back to top


Population Growth in Madhya Pradesh
decline in fertility. An analysis of prospects of fertility decline in Madhya Pradesh,
therefore, becomes important in analysing future· population growth patterns.
It is in this context that this paper attempts to analyse prospects of fertility decline
in Madhya Pradesh in the next 20 years by using the proximate determinants
approach of fertility determination. The advantage of the proximate determinants
approach is that it has a policy orientation. Using alternat~ve projections of proximate
determinants of fertility, alternative projections offertility can be obtained which, in
turn, provides the population policy makers alternative frameworks for reducing
fertility. This approach also helps in evolving a long term strategy of fertility
reduction which can become the basis for the planning and implementation offamily
planning programmes and other activities directed towards fertility reduction.
Methodology
The analysis is built upon the methodology developed for estimating family planning
requirements to achieve demographic goals. This methodology was basically
developed to estimate contraceptive prevalence rate to achieve a fertility target
(Bongaarts and Stover, 1986). However, the methodology can also be used to project
fertility if likely levels of contraceptive prevalence rate' and other proximate of
fertility are known or assumed. The theoretical basis of the methodology is derived
from the concept of the proximate determinants approach of fertility determination
first propounded by Davis and Blake and later expanded and further developed by
Bongaarts(Davis and Blake, 1956; ,Bongaarts" 1978, Bongaarts and Potter, 1983).
The basis of the methodology is the well-known equation
'.
TFR = Total fertility rate
TF= Total fecundity
and Cj•j = m, c, i, a, s are the indices developed by Bongaarts to measure fertility
iilhibiting effects of marriage pattern, contraception, postpartum infecundability,
induced abortion and sterility (Bongaarts, 1978). If we denote by the subscript 0, the
base period and by t, the end period of the projection span,then it is easy to derive
from equation (1) that

7.6 Page 66

▲back to top


Prospects of Fertility Decline·
k = IlCjjCj\\, j = m, c, i, a, s
Formulae for calculating the indices cj have been derived by Bongaarts and are not
repeated here.
Actual calculations have been carried out by using the SPECTRUM software
package. SPECTRUM is a system ofintegrated policy models designed to'answer
a number of''what if' questions relevant to population growth and its consequences.
The ''what if' refers to factors that can be changed or influenced by public policy
(The Futures Group International, 1997).
Assumptions 8J,ld Estimates-
Application of the methodology requires estimates of different proximate
determinants of for .the base year and their projeCtions Jorthe end year of the
projection span. These estimates and assumptions related to current levels and future
trends in the proximate determinants of fertility are discussed at length below with
the year 1991 as the base year for the projection.
Contraceptives Prevalence Rate. The practice of contraception is the most important
proximate determinant of fertility. Empirical evidence from different parts of the
world suggests a linear relationship between the contraceptives prevalence rate and
the total fertility rate. Because of this linear relationship, promotion of contraception
through the use of family planning methods is the mainstay of all programmes and
activities to reduce fertility and control population growth.
For Madhya Pradesh, latest estimates of contraceptives prevalence rate are available
through the National Family Health Survey and refer to the year 1992 (International
Institute for Population Sciences, 1995). According to these estimates, 36.6 per cent
of currently married couples in the age group 15-49 years in the state were practicing
some form of contraception around the year 1992; The practice of contraception,
however, has been found to vary widely with the.age of the mO.theras may be seen
from figure 1. In the age group 15-19·years, only 3.8 per cent of the couples were
found to be practicing some form of contraception. Similarly, in the age group 20-24
years, the contraceptives prevalence rate was found to be just 12.8 per cent. This
means, basically, that there was no fertility regulation in the younger ages of the
reproductive period and virtually natural fertility conditions are prevailing among

7.7 Page 67

▲back to top


Population Growth in Madhya Pradesh
Figure 1
Age-specific Contraceptives Prevalence Rate
§ 40
.f 30
II o Pili
IUD
30-34
Age
II 1.I.I.'.··· mlJ F Ster :::::y::·:·::~M:::S: ter
Tra
ill ".
.
"
currently married females below 25 years of age. From the age 25 years onwards,
there is a very steep rise in the contraceptive prevalenc·e rate up to 35 years of age
but the rise in contraceptive prevalence rate flattens in the age group 35-44 years and
then it declines slightly in the age group 45-49 years.
Another interesting observation of figure I is that nearly all the increase in
contraceptive prevalence rate with age is confined to the increase in the prevalence
of sterilization only, Although the National Family Welfare Programme in the state
promotes other methods contraception also but it is clear from the figure that the
National Family Welfare Programme in the state is very much synonymous to a
sterilization programme and contraceptive methods other than sterilization have been
given only a lopsided attention.
'Given the prevailing pattern of contraceptive use in the state, we have projected three
scenarios of contraceptive use for the year 2021, The first scenario that has been
projected reflects the outcome of an all out effort to promote contraception. This

7.8 Page 68

▲back to top


scenario is the result of a very rapid increase in the practice of contraception in the
younger ages of the reproductive period ..Obviously, this very rapid increase in the
contraceptives prevalence rate in the younger ages of the reproductive period could
be achieved only through promoting the barrier methods of contraception. A very
strong political commitment is required to induce such type of change in the practice
of contraception in the state in the years to come. This scenario may be termed as the
scenario of high contraceptive use.
The second scenario projected for the year 2021 assumes a less drastic increase in the
contraceptives prevalence rate in the younger ages of the reproductive period. This
scenario can be· achieved with the existing efforts but with an appropriate
reorientation of the family\\Velfare programme in the· state ..This scenario may be
termed as the sc~nariO of medium contraceptive use.
Finally, the third likely scenario for the year 2921 assuinesthatthe:re will be little
change in the current strength and efforts to promote contraeeptiOn in the state. As
the result, it is expected that the contraceptives prevalence rate will record only a
marginal incre~e in the years to come and most of the contraceptive practice will be
of confined to the later ages ofth~ reproductive period. Jnsuch a scenario, the unwanted
fertility will be high and so will be the unmet need contraception.
Contraccmtive Methods Mix. The existing contraceptive methods mix in the state is
very heavily biased towards the terminal methods. This dominance is so strong that
even in the age group 15-19 years, more than one fourth of the total contraceptives
users have been found to be sterilized while virtually all couples with age 30 years
and more have been found to be sterilized. This dominance ofterminalmethods like
sterilization is an important hindrance in the universalization of contraceptive use in
the state, especially among the couples in the younger ages of the reproductive
period. In any case, the prevailing highly biased contraceptive methods mix does not
reflect the cafeteria approach of the family welfare programme in the state.
As regards the likely future scenario, it is assumed that the dominance of terminal
methods like sterilization will continue in the family welfare programme of the state
and so the contraceptive methods mix will remain biased towards sterilization:
However,. the current ~end suggests that male sterilization will be replaced totally by
female sterilization. At the same time, it is also assumed that the barrier methods of
contraception like intra-uterine devices and oral pill will also gain popularity in the

7.9 Page 69

▲back to top


Population Growth in Madhya Pradesh
Figure 3
Project Contraceptive Methods Mix: in Madhya Pradesh, 2021
II F Ster
II M Ster
30-34
Age
II Condom IlIUD. IIop
years to -come. This assumption is based on the recent policy level changes in the
orientation of the National Family Welfare. Programme. There is now a lot more
emphasis on the promotion of spacing methods of contraception than the terminal
.methods in the implementation of the family welfare programme. It is also assumed
that by the year 2021, the traditional methods of family planniBg will be totally
replaced by the m09em methods. Based on these assumptions, the current and likely
'scenario of the age-specific contraceptive methods ~ix in the state is presented in
figureS 2 and 3 respectively.
Proportion.ofFcmales Married. The proportion ofcurreittly married females out of
the total females in the reproductive age group is' another proximate determinant of
fertility. In Madhya Pradesh, marriage is univerSal and the,marriage patterns are
characterized by early Iilarriage norms resulting in a low mean age at marriage for
females. According to the 1991 population census, the female mean age at marriage
iIi the state was estimated to be 16.6 years which is well below the national average

7.10 Page 70

▲back to top


Prospects ofFerti/ity Decline
(Government ofIndia, 1997). It has also been observed that in the age group 15-19
years 50 per cent of the females were married at the 1991 population census. This
indicates that females enter into the marital union at an early age which results in an
increase in the period exposed to the risk of conception.
Changes in the marriage patterns are possible in terms of the time of entry into
l1\\arital union. The period of exposure to conception can be reduced by increasing the
age at marriage. This means there exists some scope of reducing the proportion of
females current married in the age group 15-19 years and to a very limited extent in
the age group 20-24 years. At the same time, a small increase in the proportion of
currently mamed females in the later ages of the reproductive period is also expected
as the result of improvements in male adult mortality.
Figure 2
Contraceptive Methods Mix in Madhya Pradesh, 1992
c
i
e 60%
0-
i~
40%
(J
II II II III F Ster
M Stet
Condom
IUD . )I;i@iil OP
As such, three scenarios have been assumed for the likely proportion of females
married in the age group 15-19 years. The first, high scenario assumes that there will
be a drastic reduction in this proportion from 50 per cent in 1991 to just 20 per cent

8 Pages 71-80

▲back to top


8.1 Page 71

▲back to top


Population Growth in Madhya Pradesh
in 2021. Like the contraceptives prevalence· rate, this scenario will require
considerable political commitment to materialize. The second scenario, medium one
. assUIhes that ~ proportion will decrease to 30 per· cent while the third, the .low
scenario assumes that the proportion of currently married females in the age group
15-19 years could to reduced only marginally to 40 per cent. It is also assumed that
because of the reduction in male adult mortality, the proportion of females married
in the age group 40-44 years and 45-49 years will increase to 93 and 90 per cent
respectively.
Incidence of Induced Abortion. In Madhya Pradesh, legal abortion facilities are
confined to only selected hospitals more of which are located in metropolitan towns
and other large urban settlements. In the rural areas of the state, there are practically
no abortion services available. It is therefore doubted that legal abortions have any
telling effect on the levels of fertility in the state. A zero abortion rate has therefore
been assumed for the base year of the projection period.
For the end year of the projection period, an abortion rate. of 0.2 per cent has been
assumed. This ass\\UIlption is based on the fact that .there will be a rapid increase in
the Urban population'ofthe state in the years to come and th~t government of Madhya
Pradesh has launched a major programme of providing safe abortion facilities under
the reproductive and child health programme. ,
Mean puration o[Post-partum Amen6rrhea. Xhe estiniat~ pfmean duration of post-
partum amenorrhea for the state areavailab~c;through,the.Nati9nal Family Health
Survey only. A~cording to the informationa~~ilablethough this survey, mean
duration of post-partum amenorrhea in the .state is about 11 ~onths. As regar~s
trends in the mean duration, twoscenarios;ha-ye been',made.' The, first scenario
assum~s that the mean·· duration of post-par!um amenorrhea wi~l .decrease by
approximately two months by the year 2021. This .,assumption· is based .on the
negativ~ relationship between the mean duration ofpost-partum amenorrhea and the
level of modernization. The recent findings that transmission ofHIV IAIDS infection
is possible through breast milk is also expected to contribute to a decrease in-the
mean duration in the future. On the other hand, the second scenario assumes that
there will be no change in the mean duration of post-partum amenorrhea in the years
to come.

8.2 Page 72

▲back to top


Pr~valence of Sterility. Prevalence of sterility is another proximate determinant of
fertility. However, the role of sterility in ~r.ciding the levels of fertility is, at best,
marginal. There are two reasons. First, the proportion of sterile women in the
con;ununity are normally too small to have a telling impact on the levels of fertility.
Second, there is very little change in the prevalence of sterility over time and it
remains more Of less unchanged.
Estimates of the prevalence of sterility are not available for the state. However, it is
assumed tha~ about 6 per cent of the women In the reproductive age group are sterile.
As such, the prevalence of sterility has been assumed to be 6 per cent throughout the
projection span.
Total Fertility Rate. Estimates for total fertility rate in the state for the b~e year
(1991) are available from three sources, thP,Sample Registration System., the census
and the National Family Health ~urvey According to the Sample Registration
System, the total fertility rate for the state, in the year 1991, was approximately 4.6
births per woman. On the.other hand, estimates of total fertiUtyrate for the state on
the basis of children ever born data collected duritlg the 1991 population census
comes out to be 4.9 births per woman where as' National Family Health Survey
estimate of total fertility rat~ of the state for the period 1990-92 is only 3.9. Clearly,
estimates of total fertility rate obtained from the three data source vary widely.
However, a-simple·arithmetic ~verage of the three estimates of total fertility rate is
4.5. births per woman which is very close to the.estimates based on the information
available through the Sample Registration System. Since,the information available
.from the Sample Registration System is based on regular reporting we have assumed
that the total fertility rate in the state, aroun<1t.he year 1991, was approximately 4.6
births per woman.
Findings
With the above set of assumptions we have made 18 projections of possible fertility
trends in the state up to the year 2021. A summary of these projections is given in
table 3. According to these estimates, the total fertility rate in the state is expected to
vary between 2.59 and 3.96 in the year 2021 depending upon the course followed by
the three key proximate detenninants of fertility in the state - contraception, female
age at marriage and mean duration of post-partum amenorrhea resulting from the
practice ofbreast feeding. Since all the t~ proximate determinants are subject to

8.3 Page 73

▲back to top


Population Growth in Madhya Pradesh
managerial control, it is clear that future fertility decline in the state will depend upon
the strength of fertility reduction.
An important observation of table 3 is that the proximate determinants of fertility
other than contraception can playa very significant role in future fertility decline in
the state. This observation has important implications for the implementation of
National Family Welfare Programme in the state. At present, the National Family
Welfare Programme in the state has primarily been focused on the promotion of
contraception only. Efforts directed towards increasing the age at marriage and
promotion of breast feeding have been given only a residual attention. For ensuring
a rapid decline in total fertility rate in the state, it is important that due attention is
paid to these factors as they have important contribution to hastening the pace of
fertility decline;
In'table 4, likely levels ofthe contraceptive prevalence rates that are expected to be
achieved under different assumptions related to the proximate determinants of
fertility have been presented. According to these estimates, the contraceptive
prevalence rate is expected to vary between 51 per cent to 66 per cent depending
upon the projected trends in the age at marriage and in the mean duration of post-
partum amenorrhea as well as in the age specific contraceptives prevalence rates.
Following the established conventions, ifit is assumed that the most probable course
of the proximate determinants of fertility in the state in future will be the medium
term projections of practice of contraception; the medium term projections offemale
age at marriage and high projections of mean duration of post-partum amenorrhea
then it is expected that the contraceptive prevalence rate in the state will be around
58 per cent by the year 2020 and the level of fertility will be around 3.2 births per
woman. This means that in 30 years between 1991 and 2021, the contraceptives
prevalence rate is expected to increase by aro~d 25 absolute points whi~e the total
fertility rate is expected to decrease by 1.4 absolute points. This gives an average
annual of increase of approximately 0.85 absolute points per years in the
contraceptive prevalence rate and an average annual decrease of 0.047 births per
woman per year in the total fertility rate.
From the perspective of the policy, it however appears that the most feasible
approach to rapid fertility decline in the state is the high variant projection of the
contraceptive use coupled with medium variant projection in proportion married and

8.4 Page 74

▲back to top


Prospects of Fertility Decline
maintenance of current breast-feeding patterns. If this combination of proximate
·determinants offertility is pursued in future then, it is expected, that the total fertility
rate will reduce to 2.78 births per woman by the year 2021. This means that over a
period of 30 years, a reduction of almost 1.8 births per woman could be achieved in
the total fertility rate in the state. Alternatively, this meanS an average annual
· reduction of 0.6 births per woman in the total fertility' rate. In' this scenario, the
contraceptives prevalence rate in the state is expected to increase to more then 64 per
cent by the year 2021 per cent or an increase of28 absolute points from the level that
prevailed in 1991.
Conclusions
Madhya Pradesh is one of those states of India where fertility transition since
Independence has been slow. The state, today has third highest birth rate amongst the
major states of the country. Reducing fertility in the state, therefore, is a major
· concern not only for the state but for the country as well.
The present analysis clearly brings out the fact that future fertility decline in the state
will depend on the direction of and efforts under the National Family Welfare
Programme in the state. For ensuring rapid fertility decline, it is essential that the
programmes and interventions are multidimensional in nature. At present, this is not
the case. Nearly all the efforts under the National Family Welfare Programme in the
state are directed towards the promotion of contraception only. Other proximate
determinants of fertility have been given only a residual attention. This approach,
obviously, needs to be changed to a more balanced approach. But this requires strong
political commitment and support to the cause of fertility decline in the state.

8.5 Page 75

▲back to top


Population Growth in Madhya Pradesh
Age group
15-19
20-24
25-29
30-34
35-39
40-44
45-49
Projected levels of contraceptives prevalence rate in Madhya Pradesh
fcor the year· 2021 .
Contraceptives use in 2021
Level in
1991
High
. Medium
Low
4
30
20
15
13
50
40
30
35
65
60
50
58
70
65
63
61
75
70
70
61
75
70
70
.
53
65
60
60

8.6 Page 76

▲back to top


Age group
15-19
20-24
25-29
30-34
35-39
40-44
45-49
Current and future trends in the proportion of females married in
Mdah lya Pradhes .
Proportion of females currently married
In 1991
Project level in 202 i
High
Medium
Low
50
20
30
40
90
70
80
85
96
96
96
96
96
96
96
96
96
96 '
96
96
91
93
93
. 93
88
90
90
90

8.7 Page 77

▲back to top


Population Growth in Madhya Pradesh
Table 3:
Proiected levels of total fertility rate in Madhva Pradesh ..
Proximate determinants
Total fertility rate
Contraception
High
Marriage
High
Breast
feeding
High
!
2001
3.84
2011
2021
3.19
2.59
High
High
Low
3.93
3.34
2.77
High
Medium
High
3.93
3.33
2.78
High
Medium
Low
4.02
3.49
2.98
High
Low
High
3.99
3.44
2.92
High
Medium
Low
High
Low
High
4.08
3.61
3.13
3.98
3.44
2.94
Med.ium
Medium
High
Medium
Low
High
4.07
3.60
3.16
4.07
3.60
3.16
Medium
Medium
Medium
Low
Low
High.
4.16
3.77'
3.39
4.13
3.72 . 3.32
Medium
Low
Low
4.23
3.90
3.57
Low
High
High
4.10
3.68
3.27
Low
High
Low
4.20
3.85
3.51
Low
Medium
High
4.19
.3.85
3.52
Low
Medium
Low
4.29
4.03
3.77
Low
Low
High
4.26
3.97
3.69
Low
Low
Low
4.36
4.16
3.96

8.8 Page 78

▲back to top


ae
rOJecte eve s 0 preva ence 0 contraception m a lya ra es .
Proximate determinants
Contraceptives prevalence rate
Contraception
Marriage
Breast
feeding
2001
2011
2021
High
High
High
42.99
53.63
65.38
High
High
Low
42.99
53.62
65.29
High
Medium
High
42.58
52.89
64.18
High
Medium
Low
42.58
52.87
64.07
High
Low
High
42.25
52.29
63.20
High
.
Medium'
Low
High
Low
High
42.25
40.97
52.27
-49.61
63.07
59.25
Medium
High
Low
40.97
49.60
59.14
Medium
.
Mediuni
Medium
Medium
High
Low
40.55
40.55
48.79
48.77
57.82
57.69
Medium
Medium
Low
High
40.20
48.13
56.68
".
Low
Low
40.20
48.11
56.53
Low
High
High
39.55
46.62
55.03
Low
High
Low
39.55
46.60
54.89-
Low
Medium
High
39.11
45.73
53.40
Low
Medium
Low
39.11
45.71
53.24
.
Low
Low
High
38.75
45.04
52.13
Low
Low
Low
38.75
45.02
51.95

8.9 Page 79

▲back to top


Population Growth in Madhya P~adesh '

8.10 Page 80

▲back to top


A Comparison of Fertility Transition in
India and Madhya Pradesh
Introduction
. Madhya Pradesh is one of those stateS of the Indian Republic where the demographic
situation ·continues to be aserio\\iS, cause of concern to development planners and
population policy makers. It is .one ·of the few states of the country. which have
recorded an increase in the average annual population growth rate during the decade
1981-91 aScompared to that in 1971-81'. This rapid population growth in the state
. continu~ to be a major concern not only to its social an4 economic development but
,also to ,the POPulati9Jl growth of the country as a whole. ' ' .. '
I
'
t
" '~,~' • ,;\\
Relatively rapid population growth in the state is associated some v~ry sharp within
.state diversities in terms of culture and tradition, social and economicaevelopment
and in the area of population control. These within state diversities are perhaps
sharpest in the country. Although, the state is very rich in terms 9fnaturalresources,
yet tliis potential could not be tapped up to its optimum level so far. In fact, the state
is rated aSon,eofthe least developed states of the country. AS a result, the society in
'the stjit~ '~~gely remains traditional and orthodox in behaviour. ~tever
modermsationefIect is there, it is confined mostly to selected urban areas~
Main cause of poor demographic transition in the state lies in a slower reduction in
the crude birth rate as compared to the crude death rate. According to the latest
estimates released by the Registrar General of India on the basis of sample

9 Pages 81-90

▲back to top


9.1 Page 81

▲back to top


Population a/Madhya Pradesh
registration system, the crude birth rate in the state, around 1996, was third highest
amongst all the major states of the country. It appears that the fertility reduction
efforts initiated through the National family Welfare programme in the state have not
been very much effective in bringing down the birth rate in the state.
In this paper, we have made an attempt to compare the process of fertility transition
in the state with that in India since 1975. One of the objectives of this comparison is
to identify salient features of the fertility transition path in the state as well as in the
country and the factors that appear to have been responsible for particular paths
followed by the birth rate in the state and in the country. A second objective of the
present analysis is to discuss the future prospects of fertility decline in the state in the
light of fertility transition that has taken place in the state so far.
Methodology
The key indicator used in this analysis is the growth rate of the number of births. This
indicator has been selected in place of conventional indicator, growth rate of total
population because it is very sensitive to fertility reduction efforts. Growth rate of
total population, incidently, is not directly affected by these efforts. Since, in the
country as well as in the state, a major determinant of fertility transition has been the
official programme to red~ce fertility, an analysis based on the growth rate of number
of births rather than growth rate oftotal population is expected to give a better insight
into the fertility transition process.
Number of births in a particular yearin any population is determined by the level of
fertility ahd size and structure of the population. Following Horiuchi (1991), total
number of births in a particular year in a population can be represented as
where B is the total number of births in a year, N is the total population in that year,
TFR is the total fertility rate andCBR is the crude birth rate. Denoting by r the
growth rate, it is simple to show that

9.2 Page 82

▲back to top


Comparison of Fertility Transition
where f stands for total fertility rate and bf stands fof the ratio CBR/TFR. Horiuchi
has also shown that the ratio CBR/TFR may be regarded as a measure of the age
structure effect on the crude birth rate .
.The above formulation suggests that the growth rate of total number of births in a
population is the algebraic sum of the growth rate oftotal population, growth rate of
total fertility rate and growth rate of the age structure effect on the crude birth rate.
This means that the process of transition in the total number of births should be
analysed in the context of the process of transition in total population size, level of
fertility and in the process of transition in the age structure effect on the crude birth
rate.
It is possible to improve the above formulation by observing that not the whole
population is exposed to the risk of a birth. Since only females in the reproductive
age are exposed to the risk of a.birth, equations (I) and (2) can be plodified as under:
where Wstands for total number of females in the reproductive age group and GFR
is the general fertility rate. Here gf stands for the age structure effect on the general
fertility rate.
Above formulation can also be used in decomposing relative change in the annual
number of births into relative change in the population size, women in reproductive
age group, total fertility rate, general fertility rate and age structure effects on the
crude birth rate and general fertility rate. In fact,
BiB, = NiN, + TFRiTFR, + AS~/ASE,
(5)
= W/W, + TFR/TFR, + ASE'/ASE',
(6)
where subscripts stand for the beginning and the end of the period of reference and
ASE and ASE' are age structure effects on crude birth rate and general fertility rate
respectively.

9.3 Page 83

▲back to top


Population of Madhya Pradesh
Data Source
Data for the present analysis have been drawn mainly from the sample registration
system which is being maintained by the Registrar General of India. The sample
registration system provides information on crude birth rate, total fertility rate and
general fertility rate for the country as a whole as well as for its constituent states.
The sample registration system, however, does not provide information on the size
of the population as well as on the number of females in the reproductive age group
which is required for the analysis. This information has been drawn from the
population censuses of 1971, 1981 and 1991 and was extrapolated beyond the
year1991.
Information available through the sample registration system, however, is found to
be associated with yearly random fluctuations which are often substantial and so need
to be removed first. In order to remove the effect of these random fluctuations from
the analysis, we have used the average figures rather than the annual estimates. We
have assumed that these average figures correspond to the mid point of the period
under consideration. It may, however, be mentioned here that both different estimates
of fertility as well as estimates of population size are based on different approaches.
As such there may be some discrepancy in the results based on equation (1) and the
results based on equation (3). This discrepancy, however, is nothing to do with the
methodology used as th~ purpose of the analysis, primarily, is to analyse the trend
in the growth of total number of births and not to estimate the number of births.
Moreover, the trend obtained from the use of equation (1) or from the use of equation
(3) is almost the same. Therefore, problems with the data used, have little implication
on the findings of the analysis.
Results
Basic information on number of births per year, total fertility rate, crude birth rate
etc. for India and Madhya Pradesh is summarised in table 1· for different periods
beginning from 1975 up to 1993. Around 1977, estimated number of live births in
India were 21.210 million which increased to 25.527 million live births around the
year 1993. This· means that during the 16 years between 1977 and 1993, total number
oflive births in the country increased at an average ~ual rate of1.158 per cent per
year. This rate of increase in the total number of live births has been associated with
an average annual rate of increase of2.155 per cent in total population; 2.602 per
cent in females in the reproductive age group. Similarly, this rate of increase in the
number of live births has been associated with an average annual rate of decrease of

9.4 Page 84

▲back to top


-0.997 per cent in crude birth rate; -1.203 per c~t in general fertility rate and -1.708
per cent per year in total fertility rate. Clearly, increase in the total number of live
births in the country during the period.Wlderreference has been due to the increase
in the n\\H1lberof females in the reproductive age group as the .number of live births
per woman, measured by the total fertility rate has actually decreased over time.
In comparison to India, the increase in the total number of live ~irths in Madhya
Pradesh has been faster. Between 1977and 1993, total number of live births in the
state increased from 1.844 million in 1977 to 2.381 million in 1993 which gives an
average annual increase Gf 1.596 per cent per year. This relatively faster increase in
total number of live births in the state has been due to both a relatively more rapid
increase in·the population (2.350 per cent per year) and in females in the reProductive
age group (2.645 per cent per year) as well as a relatively slower decrease in the
crude birth rate (-0.754 per cent per year); general Jertility rate (-1.088 per cent per
year) and total fertility rate (-1.651 per cent per year).
The trend in the growth of total number of live births, however,.has been different
in Madhya Pradesh as compared to India. In India, growth rate in the n\\lJ1lberoftive
births has decreased sharply during the period 1975 through 1990. During 1975-79/
1979-83, the average annual growth rate in the total number of live births. for the
country was 2.063 per cent per year which decreased to 1.463 per cent during the
, period 1979-83/1983-87 and to 0.485 during the period 1983-8711988-90. However,
during the period 1988-90/1992-94, this growth rate, iristead of decreasing, increased
marginally.
By contrast in Madhya Pradesh, the growth rate in the total number of live births
increased from 1.724 per cent per year during 1975-79/1979-83 to 2.252 per Cent
during the period 1979-83/1983-87 ..But, after .1986, this growth rate' has decreased -
rather sharply to. 1.576 per cent per year during the period 1983-87/1988':90 and to
0.8l0per cent per Year dUring.the period 1988-90/1992-94.
, As already discusSed. the increase or decrease in the total number oflive births in any
population over time is the result of the combined effect of either the lllte of change
in the size of the populaijon and the rate of change in the levels of crode birth rate or
the rate of change in females in the reproductive age group and the rate of change in
the.general fertility rate. In figure 2, trend in the rate of change in the erode birth rate
in India and in Madhya Pradesh has been presented. In India, the groWth rate in the
crude birth rate has decreased during the 1970s and 1980s but has shown an

9.5 Page 85

▲back to top


Population of Madhya Pradesh
increasing trend during the 1990s. By contrast.in Madhya Pradesh, the growth rate
in the crude birth rate has increased in the 1970s. However, since 1981, the growth
rate of the crude birth rate has decreased regularly. During the period 1988-90/1992-
94, the rate of decrease in the crude birth rate has been highest in the state.
In contrast to the crude birth rate, the trend in the rate of change in the general
fertility rate has been more or less similar in the country as well as in the state. In
both the country and the state, the growth rate of the general fertility rate increased
during the 1970s but decreased during the 1980s. In the 1990s, however, the rate of
decrease in the general fertility rate in the country as a whole has slowed down but
it continued to increase in Madhya Pradesh. As the result, the rate of decrease in
general fertility rate during the period 1988-90/1992-94 has been higher in the state
as compared to the country as a whole .
. The trend in the rate of decrease in the total fertility rate, however, has been found
to be different in India and in Madhya Pradesh. In India, the rate of decrease in the
total fertility rate has almost monitonically increased over time. During the 1970s,
the total fertility rate in the country decreased at an average annual rate of 0.549 per
cent per year. This rate increase to 2.705 per cent per year during the 19901. In
Madhya Pradesh, the rate of decrease in the total fertility rate has been relatively
faster in 1970s and early 1980s. But there has been consideral>le slowdown in the
rate of decrease in total fertility rate during the period 1983-87/1988-90. However,
the decrease in the total fertility rate appears to have picked up the momentum in the
early nineties. In comparison to the country as a whole, the decline in total fertility
rate in the Madhya Pradesh during the late 1980s and early 1990s has been rapid.
Besides the level of fertility as measured by the general fertility rate and the total
fertility rate, levels of the crude birth rate and total number of live births are also
influenced by the age structure effects on the general fertility rate as well as on the
crude birth rate. For both India and Madhya Pradesh, the age structure effects on
general fertility rate have always been positive indicating that these etTectshave
contributed towards increasing the crude birth rate as well as the total number oflive
births. Similarly, the trend in the rate of change in the age structure effects on general
as fertility rate has followed more or less similar pattern in India well as in Madhya
Pradesh. The only point of divergence is that the age structure effects on general
fertility rate in Madhya Pradesh decreased marginally during the late 1980s as
compared to early 1980s.

9.6 Page 86

▲back to top


2.50
2.00
$e 1.50
e~
C) 1.00
0.50
0.00
Comparison of Fertility Transition
Figure 1
Growth Rate in Number of Live Births
As regards the rate of change in the age structure effects on the crude birth rate, the
trend has been found to be very different in Madhya Pradesh as compared to India.
For the country as a whole, the age structure effects on crude birth rate have
increased over time, first slowly and then rapidly. In Madhya Pradesh, the age
structure effects on crude birth rate have increased but there has been a considerable
slowdown in this increase during the late 1980s. However, after 1989, the age
structure effects on the crude birth rate have again increased rapidly in the state.
The contribution of the size of population to the relative change in the annual number
of live births in the country as well as in the state has been found to be substantial
and, expectedly, acts towards increasing the annual number of births. In Madhya
Pradesh as well as in India, reduction in the total number of live births as the result
of the reduction in total fertility rate has not been found to be sufficient enough to
offset the increase in the number of live births as the result of the increase in the
number of females in the reproductive age group. Clearly, mostofthe increase in the

9.7 Page 87

▲back to top


Population of Madhya Pradesh
number of live births in Madhya Pradesh as well as in the country is due to the
population momentum which is generated due to the influx of an increase number of
females in the reproductive age group. This influx is the result of exceptionally high
fertility in the past.
Figure 2
Trends in Rate of Change in Crude Birth Rate
0.00
-0.20
-0.40
-0.60
Se
.c
-0.80
le -1.00
C>
-1.20
-1.40
-1.60
.-
-1.80
1977-81
1981·85 ..
Period
In brief, despite reductions in fertility levels as measured by the total fertility rate,
total number oflive births have shown an increasing trend in Madhya Pradesh as well
as in India. This increase in the total number oflive births is primarily due to the fact
that the reduction in the number oflive births as the result of the fertility decline has
not been sufficient enough to offset the increase in the number of live births as the
result of the influx of females in the reproductive age group. On the other hand, a
secular decline in the average annual growth rate of number of births in the country
as a whole during 1975-89 seems to be mainly attributable to a secular decline in the
level of fertility as measured by the total· fertility rate.

9.8 Page 88

▲back to top


Comparison of Fertility Transition
FigureJ
Trend in the Rate of Change in General Fertility Rate
0.50
0.00
.s -0.50
l!!
I-1.00
C)
-1.50
-2.00
-2.50
19n-81
The analysis also shows very clearly that a decline in the total fertility rate may not
be associated with a decline in the total nUDiber of live births. In fact, in Madhya
Pradesh, a steep decline in the fertility level has been found to be associated with a
steep increase in the total number of births. The reason is that the steep decline in the
level of fertility has been offset by a very rapid positive increase in the age structure
effects on crude birth rate and general fertility rate.'" " t
the age structure· effects seemattributilble mainly to the accelerated growth of
female population ~nthe reproductive age gro~. This accelerated growth may be due
.to the influx into the reproductive period of the cohorts born in the 19508 and 19608 -
the period of so-called "population explosion". In addition, decreasing proportion of
young population, caused by fertility decline, has also raised the proportion of other
age groups, in~luding the reproductive period.

9.9 Page 89

▲back to top


Population of Madhya Pradesh
Figure 4
Trend in the Rate of Change in Total fertility Rate
-0.50
-1.00
S
!!!
-1.50
.c
le
C> -2.00
-2.50
-3.00
1977-81
But the age structure effects do not explain the short-term rise of growth rate of
number of births in the country as well as in the state. At best they can be considered
03S a medium term trend contributing significantly to. the relatively high level of
growth rate of number of births.
.
Conclusions
The analysis presented in the foregoing pages reveals that main reason for relatively
slow transition in fertility in Madhya Pradesh as compared to the country !is a whole
may be seen in both a relatively slow decline in the levels of fertility as well as
relatively high age structure effects on crude birth rate. Levels of fertility in the state
have shown a declining trend but this trend could not be translated into a declining
trend in the totaillumber of live births mainly because the age structure of the
population of the state has been conducive to larger number of births than those
predicted by the levels of fertility. Dominance of age structure effects in fertility
transition in the state is clear from the fact that the growth of age structure effects on

9.10 Page 90

▲back to top


Comparison of Fertility Transition
crude birth rate as weUas on general fertilityratecand growth of total number of
births covary. This is in quite contrasUo the couqtrY,,~ a~pole where growpt in the
i total number of births covary with the growth in level of fertility and not with the age
: structure effects on crude birth rate or generalfertility rate. In fact, abrpolute d~line
! in the fertility level as measured through total fertility tate has been almostthe.same
. for the country as well as for the state. But·because of the differing age structure
; effects on the crude birth rate and general fertility tate, growthpattem of number of
births has been entirely different for the country as a whole and for the state.
Interestingly, during the late 1980s, growth rate of age structure effects on crude birth
rate in the state has slowed down considerably. In case of general.fertilityrate, this
growth rate has even turned negative suggesting that the age structure effects on
general fertility rate has become conducive: to .lesser number of births ~ those
predicted by the prevailing levels of fertility.' However, at the same time, the rate of
decline in fertility level has also slowed down consid~bly. As a result, total number
of births in the state continued to increase th,ough at a slower rate. However, in the
early 1990s, the scenarios has changed again; the rate of decline in total fertility rate
as well as the rate of increase in the age structure effects on crude birth rate increased
again.
One may ask at this stage: what are·the future prospects of fertility transition in the
state? The present analysis suggests that much will depend upon the reduction in
: fertility levels. In·fact, the maglritude of the reduction should tJe such that it should
be able to compensate for both the positive effect ofpopulation;growth as well as the
positive age structure effects on crude birth rate and general fertility rate.
Horiuchi, S. (1991) Measurement and analysis of cohort-size variations. Population
Bulletin of the United Nations 30:160-24.

10 Pages 91-100

▲back to top


10.1 Page 91

▲back to top


Population of Madhya Pradesh
ae
Year
. e ec e a a on ertl lty In n la an a lya ra es
~opulation (million)
CBR
GFR
TFR
Total
Females
(15-49)
India
1977
625.666
139.683
33.9
142.8
4.6
1981
683.300
153.360
33.7
140.5
4.5
1985
744.349
170.784
32.8
139.5
4.3
1989
810.852
190.187
30.7
. 127.1
3.9
1993
833.297
211.794
28.9
117.8
3.5
Madhya Pradesh
1977
47.659
10.495
38.7
170.3-
5.6
1981
52.140
11.670
37.9
164.1
S')
1985"
1989
57.358
63.098
12.971
14.417
37.7
164.4
4.9
36.5
155.7
4.7
1993
69.413
16.025
34.3
143.1
4.3

10.2 Page 92

▲back to top


Growth
rate
ro
rN
rw
~
.
rb
rg
rf
rgf
rbf
Comparison ofFerlilily Transition
Growth rates of number oflive births and its decomposition in India
'andM adhlya Pradesh
Countryl
State
Period
1975-79 to 1979-83 to 1983-87 to 1987-89 to
1979-83
1983-87
1987-89
1992-94
India
2.055
1.463
0.485
0.629
MP
1.724
2.252
1.576
0.830
India
2.203
2.139
2.139
2.139
MP
India
2.247
2.335
2.384
2.690
2.384
2.690
2J85
,
2.690
MP
2.653
2.642
2.642
2.644
India
-0.148
-.0677
-1.654
-1.511
MP
-0.522
-0.132
-0.809
-1.554
India
-0.406
-0.179
-2.327
-1.900
MP
-0.927
0.046
-1.359
-2.110
India
-0.549
-1.137
-2.441
-2.705
MP
-1.376
-1.962
-1.042
-2.224
India
." ,~.
MP
0.144
0.449
0.958
2.007
0.114 '
-0.317
.0806
0.114
India
0.402
0.460
0.787
1.195
MP
0.854
1.830
0.233
0.670

10.3 Page 93

▲back to top


10.4 Page 94

▲back to top


Prevalence of Contraception in
Madhya Pradesh
Introduction
In this paper, we present estimates of contraceptives prevalence rate for the districts,
development blocks and towns of the State. The district level estimates are given
separately for rural and urban areas. these estimates have been derived on the basis
of the information collected through the Madhya Pradesh Target Couple Survey,
1996. The Madhya Pradesh Target Couple Survey was organized during April-June,
1996 throughout the state. During the survey; nearly 13 million couples in the
reproductive age group were surveyed and information' on the Use of any of the
family planning methods was collected.
At present, information on the extent of use of family planning methods in the state
is available up to the district level only. This information is derived from the
programme service statistics of the National Family Welfare Programme which is
routinely collected by the programme managers. The programme service statistics,
however, is known fora number of errors, the most important of which is the
duplication over time place and method. Another limitation of the programme service
statistics is that they are related to the services provided by the .family welfare
services provider and not to the actual use by the beneficiaries. Moreover, the
programme service statistics do not take into account the use of family planning
'methods outside the programme.

10.5 Page 95

▲back to top


Population of Madhya Pradesh,
On the other hand, survey based information and estimates on the extent of the use
of family planning methods are rare and are available at the State level only. These
estimates are based on very small sample of population surveyed as part of nationally
organized surveys (Operations Research Group, 1971; 1981; 1989; International
Institute for Population Sciences, 1995). However, because of thegeogi"aphical
vastness and cultural diversity of the State, the State averages have little relevance
and usefulness in planning and monitoring family planning services at the grass roots
level. In thi~' context, the estimates of the extent of the use of family planning
methods presented in this paper may be useful not only in planning for National
Family Welfare Programme, but also in~onitoring the performance of the
programme at development block and town level. Such decentralized planning and
monitoring may be very useful in improving the performance of National Family
Welfare Programme in the State.
An important use of the information being presented in this paper is to identify the
development blocks and towns in the state where the progress ofthe National Family
Welfare Programme is not satisfactory in the sense that the prevalence of
contraception is low. Once these development blocks and towns are identified, a
detailed investigation may be carried out tQ identify thereasQns behind the low
prevalence of contraception in these areas. Based on this investigation, especial
efforts may be initiated for universalizing the use of family planning methods in
these areas.
'
The Madhya Pradesh Target Couple Survey was ~,attempt, ~ogenerate information
regarding use of family planning methods below,the distri~t level. The.information
available through the survey makes it possible to estimate contraceptives prevalence
even up, to the village level, in the rural areas and up to the m~cipal ward level in
the urban areas. No additional·inputs were proyided: ~or' Qrganizing the survey.
Despite the fact that the survey covered nearly 13 million couples in spreading over
more than 73 thousand villages and 435 towns of the state, it ,,:as avery highly cost-
effective exercise as ,the existing ,facilities, infr~tructure and manpo,,:er was
mobilized for the survey.
The information available from the survey makes it possible to estimate of method
specific contraceptives prevalence rate for the 458 development blocks and towns of
the state, Estimates of contraceptives prevalence rate ar~available for all
development blocks and towns of the state except the development block Orchha in

10.6 Page 96

▲back to top


Figure 1
Structure of Contraceptives Use
district Bastar and the city of Bhopal as the survey could not be carried out in the two
because of operational reasons.
The contraceptive prevalence rate is defined as the proportion of couples in the
reproductive age group practicing one or the other method of contraception at the
time of the survey. It includes both programme as well as non-programme
contraception.
Main Findings
a. Contraceptives Prevalence at the State level.
Information available through the Madhya Pradesh Target Couple survey suggests
a contraceptive prevalence rate of 53.44 per cent for the state as a whole. The method
specific prevalence has been estimated to be 31.50 percent for sterilization; 4.50 per
cent (or intra-uterine devices; 11.04 per cent for condoms; 5.19 per cent for oral pills;
2.30 per cent for other methods.

10.7 Page 97

▲back to top


The contraceptives prevalence rate obtained from the Madhya Pradesh Target Couple
Survey is only marginally higher than the contraceptives prevalence rate generated
through the programme service statistics. The contraceptive prevalence rate estimated
from the Madhya Pradesh Target Couple Survey for the four methods covered under
the National Family Welfare Programme has been estimated to be 52.23 per cent
while the prevalence rate based on the programme service statistics has been
estimated to be 50.60 per cent as on 31 March 1996.
It may be seen from figure 1that contraceptives use in the State is heavily dominated
by sterilization. Nearly sixty per cent of the couples practising one or ,the other type
of family planning method have been found to be sterilized. Since most of the
contraception in the State is through the National Family Welfare Programme, it is
clear that the Programme continues to concentrate mainly on sterilization. At the
same time, the relative neglect of the other very efficient method, intra-uterine
devices, is very much clear from the structure of the contraceptives use in the State.
Table 1 compares the method specific prevalence rate obtained from the Madhya
Pradesh Target Couple Survey and the prevalence rates generated through the
programme service statistics of National Family Welfare Programme. Intere~tingly,
method specific prevalence rate obtained from the two sources do not tally. The
prevalence rate obtained from the Madhya Pradesh Target Couple Survey is higher
than that. generated from the programme service statistics in case of sterilization,
condom and oral pills. A relatively, higher prevalence rate estimated through the
survey as compared to the programme service statistics is expected as the prdgramme
services statistics do not take into account the non-programme contraception. Thus
the difference between the contraceptive prevalence rate obtained from the survey
and generated from the programme service statistics is indicative of extent of non-
programme contraception in the state.
In case of intra-uterine devices (IUD), however, the prevalence rate obtained from
the survey is significantly lower than that generated from the pro8ram.me service
statistics. It may be pointed out here that the prevalence rate of IUD generated from
the programme service statistics is based on the number of IUD· inserted while that
estimated from the survey is based on the number of IUD in position at the time of
the survey: Thus the difference between the two prevalence rates is an indicator of
a very low retention rate of IUD. If the information given in table 1 is any indicator,
than more than 60 per cent of the IUD inserted have been found removed.

10.8 Page 98

▲back to top


b. Contracejltive Prevalence at the District level.,
Contraceptives prevalence rate has been found to vary widely across the districts of
the State. Highest. contraceptives prevalence rate has been estimated for district
Indore where more than 84 per cent of the couples in the reproductive age group have
b~en found to be practising some form· of contraception. By contrast, in district
Chhatarpur, the contraceptives prevalence rate has been found to be even less than
40 per cent. This prevalence rate is lowest among all the districts of the State. In
addition to Indore and Chhatarpur districts, the contraceptives prevalence rate in the
Figure 2
Distribution of Development Blocks by
Contraceptives Prevalence .Rate
remaining 43 districts has been found to vary widely. In 13 districts, it has been
found to vary beiween40-50 per cent; in 21 districts. it varied between 50~60 per
cent and in the remaining 9 districts, it has been estimated to be more·than 60 per
cent. A contraceptives prevalence rate of 60 per cent,-inc;idently,is the target set
under the National Population Policy to be achieved by ~e year 2000.

10.9 Page 99

▲back to top


Population of Madhya Pradesh
An important feature of the inter-district variations in the contraceptives prevalence
rate is that variation in the prevalenc" of sterilization is more than the prevalence of
all methods combined. By contrast, there is very little variation in the prevalence of
intra-uterine devices, oral pills and other methods. One reason for this· very small
variation is·that the prevalence of these methods is very low.
c.
Contraceptives Prevalence at Development Block level.
The contraceptives prevalence rate for all methods combined as well as for specific
methods of contraception has been found to vary widely across the development
blocks of the State. The all methods contraceptives prevalence rate varies from a
maximum of75.59 per cent to a minimum of22.85 per cent across the development
blocks of the State. Summary measures of the distribution of method specific
contraceptives prevalence rate are given in table 3. It may be seen from the table that
the variations in the contraceptives prevalence rate across the development blocks of
the state is largest in case of sterilization and least in case of oral pills. In case of
intra-uterine devices also, the variations across the development blocks is relatively
low.
d. -Contraceptives Prevalence in Iowns.
The contraceptives prevalence rate varies from a maximum of93.33 to a minimum
of 21.50 per cent across the towns of the State. This range is wider than the range of
contraceptives prevalence across the development blocks of the State. Interestingly,
the minimum contraceptives prevalence rate in the towns of the State is les~ than the
minimum contraceptives prevalence rate for the development blocks of the State.
Summary measures of the distribution· ot all methods and method specific
contraceptives prevalence rate across the towns and cities of the State are given in
table 4. Once again, most of the variation in all methods contraceptives prevalence
rate is accounted by the variation in the prevalence of sterilization which varies from
a high of 68.82 per cent to a minimum of just 4.41 per cent.
Conclusions
Wide variations in the prevalence of contraception across the districts, development
blocks and towns of the State calls for a detailed investigation of the determinants of
contraceptives use. Since, most of the contraceptives USein the State is through the
National Family Welfare Programme, it would be useful to assess the performance
ofthe programme as well as to analyze the determinants of programme performance

10.10 Page 100

▲back to top


Prevalence of Contraception
at the development block and town levels in the State. In this context, assessment of
the strength of the efforts and activities being carried out in different development
blocks and towns of the State and an analysis of the relationship of level of the
strength of the effort with the prevalence of contraception will be useful to
identifying the reasons for wide variations in the contraceptives prevalence rate.
The development block and town level estimates of contraceptives prevalence rate
also bring out the need for a decentralized approach of planning, management and
evaluation of activities and programmes directed towards the promotion of
contraception in the state. This is not the case at present. Recently, in order to
promote decentralized approach of planning and implementation of National Family
Welfare Programme, the system of allocation of targets to the state government has
Figure 3
Distribution of Towns by
Contraceptives prevalence Rate
been abolished by the Government of India. Instead, a community needs based
approach is now being professed under the Programme. In this context, any exercise
like the Madhya Pradesh Target Couple Survey may be useful in building a grass
roots level data base which can constitute the basis for decentralized village level

11 Pages 101-110

▲back to top


11.1 Page 101

▲back to top


planning for the promotion of the use of family planning methods. Since, the survey
was carried out with little outside input and· efforts, such type of exercise can easily
be institutionalized within the existing system.
.
Government of Madhya Pradesh (1996) Madhya Pradesh Target Couple Survey,
1996, Vol I. Bhopal, Department of Health and Family Welfare.
International" Institute for Population Sciences (1995) National Family Health
Survey: Madhya Pradesh. Mumbai, International Institute for Population Sciences.
Operations Research Group (1972) An Analysis of Family Planning Practices in
India: The First All India Survey Report. Baroda, Operations Research Group.
Operations Research Group ( 1985) Family Planning Practices in India: Second All
India Survey Report. Baroda, Operations Research Group.
Operations Research Group (1990) Family Planning Practices in India: Third All
India Survey Report. Baroda, Operations Research Group.
.

11.2 Page 102

▲back to top


ae
Method
Sterilization
IUD
Condom
Oral Pills
Total
ontraceptlve reva ence atem a lya raes,
CPR obtained
fromMPTCS
CPR generated
from programme
service statistics
31.50
28.30
4.50
10.70
11.04
7.70
5.19
3.90
52.23
50.60 .
Difference
3.20
-6.20
3.34
1.29
1.63

11.3 Page 103

▲back to top


Population of Madhya Pradesh
Measure
Summary measures of the distribution of prevalence rate of different
methods of contracep~ion across the development blocks ofthe State,
1996.
Sterilization IUD Condom Oral Pill Other
All
methods •Methods
Maximum
Q3
Q2
Ql
Minimum
QR
Range
Mean
SD
~V
56.41
38.14
29.56
22.42
10.22
15.72
46.19
30.39
10.29
0.34
16.99
4.70
3.27
2.03
0.09
2.67
16.91
3.58
2.14
0.60
24.35
14.10
10.94
7.72
0.93
6.38
23.41
11.01
4.29
0.39
16.20
6.34
5.15
4.03
0.68
2.31
15.53
5.38
1.97
0.37
21.96
1.56
0.52
0.04
0.00
1.52
21.96
1.20
2.00
1.67
75.$9
58.77
51.91
44.96
22.85
13.82
52.74
51.56
10.17
0.20

11.4 Page 104

▲back to top


Measure
Summary measures of distribution of method specific contraceptives
preva Ience rate across the towns 0fth e Statet 1996
Sterilization IUD Condom Oral Pill Others
All
methods Methods
Maximum
Q3
Median
Ql
Minimum
QR
Range
Mean
SD
CV
68.82
41;03 .
..34.41
25.55
4.41
15.48
64.41
33.71
10.84 ..
0.32
32.49
6.08
3.75
2.40
0.00
3.68
32.49
4.86
3.89
0.80
37.40
14.20
8.98
5.70
0.00 .
8.50
37.40
10.30
6.25
0.61
22.46
5.82
3.77
2.33
0.00
3.49
22.46
4.55
3.11
0.68
32.34
1.81
0.32
0.00
0.00
1.81
32.34
1.98
4.28
2.16
93.33
63.74
55.24
47.04
21.50
16.70
71.83
55.38
12.63
0.23

11.5 Page 105

▲back to top


Population of Madhya Pradesh
Contraceptives Prevalence Rate by method in the districts of
Madhya Pradesh, 1996.
District
Total population
Sterilization IUD Condom Oral Pill Others
Bastar
30.92
2.77 11.68 6.10
0.60
Bhopal
Sehore
22.67
4.70 14.96 8.19
1.10
30.41
5.05 14.29 4.68
1.24
Raisen
25.28
3.17 11.38 5.27
2.80
Rajgarh
23.93
4.56 13.81 5.87
0.63
Vidisha
18.37
2.92 12.86 5.49
0.86
Betul
36.96
3.59 11.09 4.78
1.32
HoshanJ;tabad
33.01
3.81 13.02 4.36
1.14
Bilaspur
24.59
3.71 7.95
4.90
1.16
Raigarh
33.84
4.25 9.7()
6.17
2.15
Surguia
23.99
4.83 8.77
5.84
4.17
Gwalior
29.99
7.24 14.12 7.11
1.63
Shivpuri
19.96
7.63 16.21 6.37
0.34
Guna
23.15
4.74 14.43 6.49
0.08
Datia
28.05
4.34 16.88 7.65
2.45
Morena
18.53
5.87 14.83 7.07
2.03
Bhind
Indore
18.58
5.77 11.89 4.90
1.37
,,43.43 22.00 11.34 6.73
0.60
Dhar
38.90
2.75 6.40
3.68
0.82
Jhabua
20.98
3.15 9.99
5.51
3.41
W Niniar
38.48
2.28 7.19
3.64
1.36
E Nimar
39.73
3.91 10.07 5.85
1.16
Jabalpur
35.95
4.04 . 8.88
5.28
1.25
Narsimhapur
43.22
4.00 11.51 5.28
0.54
Chhindwara
39.39
4.62 11.18 5.91
0.59
Seoni
40.93
3.86 10.05 6.01
1.22
All
Methods
52.07
51.60
55.68
47.89
48.79
40.50
57.74
55.35
42.30
56.11
47.60
60.09
50.51
48.87
59.38
48.33
42.51
84.10
52.55
43.03
52.95
60.72
55.40
64.56
61.69
62.08

11.6 Page 106

▲back to top


District
Mandla
Balaghat
Raipur
Durg
Rajnandgaon
Rewa
Shahdol
Sidhi
Satna
Sagar
Damoh
Panna
Chhatarpur
Tikamgarh
Dewas
Ratlam
Shajapur
Mandsaur
Ujjain
Total population
Sterilization IUD Condom Oral Pill Others
39.54
2.69 8.56
5.87
0.92
39.42
0.95 6.08
4.31
0.49
36.63
2.91 10.72 4.19
0.58
47.18
2.59 6.24
3.79
0.20
35.89
4.02 8.32
5.81
0.15
20.57
5.77 12.26 5.53
1.87
26.08
3.30 10.08 4.39
1.18
19.23
4.31 11.21 6.25
0.73
23.09
3.60 ·10.65 4.76
0.76
27.31
3.85 14.23 5.40
1.34
36.56
2.78 12.21 4.48
0.53
21.42
8.11 14.31 4.76
1.55
17.31" 4.68 12.20 4.39
1.39
30.07
5.46 18.70 5.15
0.95
42.02
2.23 7.59
3.08
1.21
35.58- 4.99 12.99 5.25
1.45
30.91
3.72 15.00 4.80
2.57
31.07
4.39 15.75 4.80
1.77
39.04
3.90 13.38 4.24
0.84
All
Methods
57.58
51.25
55.03
60.00
54.19
46.01
45.04
41.73
42.86
52.13
56.56
50.14
39.98
60.33
56.13
60.28
57.00
57.78
61.39

11.7 Page 107

▲back to top


Population of Madhya Pradesh
District
Bastar
Bhopal
Sehore
Raisen
Rajgarh
Vidisha
Betul
- Hoshangabad
Bilaspur
Raigarh
Surguja
Gwalior
Shivpuri
Guna
Datia
Morena
Bhind
Indore
Dhar
Jhabua
WNimar
E Nimar
Jabalpur
Narsimhapur
Chhindwara
Seoni
Mandla
Contraceptives Prevalence Rate by method in urban areas of
Madhlya Pradesh , 1996
-
Urban J: opulation
Sterilization IUD Condom Oral Pill Others
39.58
2.61 5.82
5.22
1.84
20.10
7.42 15.81 9.26
0.00
33.52
6.10 12.49 4.42
1.34
26.31
4.74 12.76 5.06
5.47
31.01
5.25 11.75 7.13
1.44
20.82
4.92 19.43 9.57
0.07
42.04
5.04 9.96
3.49
0.68
")6.76
5.57 11.71 4.47
1.7J
32.86
5.31 7.33
5.32
1.17
35.41
3.75 5.15
2.99
5.59
All
Methods
55.07
52.59
57.85
54.35
56.58
54.82·
61.20
60.24
51.99
52.89
3~.41
5.07 6.98
5.00
3.82
32.42
8.98 16.01 9.86
1.40
27.39
19.43 i9.98
11.09
0.33
29.22
4.52 13.96 4.19
0.46
55.27
68.67
78.23
52.36
28.03
3.39 10.63 ·5.90
2.68
50.64
23.06
5.25 13.44 5.33
3.51
50.58
15.69
6.14 9.04
3.71
1.25
35.84
40.54 29.68 12.17 7.79
0.61
90.78
39.14
4.55 8.54
3.57
3.24
59.03
37.43
4.67 9.46
3.61
1.46
56.64
43.70
3.85 7.33
3.37
3.24
61.49
35.90
9.82 11.45 7.91
1.55
66.64
38.91
5.69 10.21 5.06
2.04
61.90
39.81
6.66 15.12 4.11
2.74
68.45
36.51
7.63 12.93 4.67
2.08
63.82
48.21
4.10 6.55
3.31
1.55
63.72
42.11
2.56 8.46
5.84
0.55
59.51

11.8 Page 108

▲back to top


District
Balaghat
Raipur
Durg
Rainandgaon
Rewa
Shahdol
Sidhi
Satna
Sagar
Damoh
Panna
Chhatarpur
Tikam,garh
Dewas
Ratlam
Shajapur
Mandsaur
Ujjain
Urban 1= opulation
Sterilization IUD Condom Oral Pill Others
44.06
1.35 3.26
2.40
39.07
3.34 5.27
2.26
49.75
3.50 5.34
2.83
44.36
3.26 6.61
3.48
14.76
7.06 11.00 7.12
26.66
6.07 7.57
4.93
36.54
5.28 5.20
2.86
24.59
5.10 9.18
3.25
28.33
3.99 13.56 5.66
36.17
3.23 7.95
3.32
19.38
10.62 .13.97
4.21
21.55
5.01 12.88 4.10
30.50- 5.49 15.87 4.71
41.11
4.15 11.70 2.95
40.52
31.68
7.84 14.63 3.65
3.63 14.96 4.72
35.70
5.31 15.57 4.63
39.71
4.93 17.84 4.21
0.32
0.31
0.05
0.47
5.99
0.88
1.78
0.45
3.04
0.71
0.48
0.53
2.71
1.45
1.90.
3.62
1.31
0.72
All
Methods
51.38
50.24
61.47
58.19
45.92
46.10
51.67
42.56
54.58
51.38
48.68
44.07
59.27
61.35
68.54
58.60
62.51
67.42

11.9 Page 109

▲back to top


Population of Madhya Pradesh
District
~
Bastar
Bbopal
Sehore
Raisen
Rajgarh
Vidisha
Betul
Hoshangabad
Bilaspur
Raigarh
Surguja .
Gwalior
Shivuuri
Guna
Datia
Morena
Bhind
Indore
Dhar
Jhabua
WNimar
ENimar
Jabalpur
Narsimhapur
Chhindwara
Seoni
Mandla
Contraceptives Prevalence Rate by method in rural areas of
Madblya Pradesh, 1996
Rural population
Sterilization IUD Condom Oral Pill Others
All
Methods
30.44
2.78 12.01 6.15
0.53
51.90
23.21
4.12 14.78 7.96
1.33
51.40
29.63
4.79 14.75 4.74
1.22
55.13
25.11
2.91 11.15 5.31
2.36
46.84
22.76
4.44 14.15 5.66
0.49
47.50
17.67
2.35 11.00· '4.33
1.08
36.43
35.87
3.28 11.33 5.06
1.46
57.00
31.24 ·2.98 .13.63
4.31
0.86
53.03
23.31
3.46 8.05
4.83
1.15
40.81
33.70' . 4.30 10.11 6.46
1.84
56.40
22.75
4.80 8.99
5.94
4.21
46.69
27.45 '5.42
12.13 4.23
1.86
51.09
18.64
5.53 '15.53 ,5.53
0.34
45.57.
21.95
4.78· 14.52 6.94
0.00
.48.19
28.06
4.57 18.34 -8.06
2.39
61.42
17.89
5.96 15.02 7.32
1.82
48.02
19.42 ,5.66 12.73 5.25
1.41
44.46
50.52
3.14 . 9.30
4.14
0.56
67.66
38.86
2.49 6.09
3.69
0.46
51.60
19.38
3.00 10.04 5.69
3.60
41.71.
37.73
2.05 7.17
3.68
1.09
51.71
41.23
1.58 9.53
5.04
1.01
58.39
34.02
2.97 8.02
5.42
0.74
51.16
43.93
3.45 10.76 5.52
0.09
40.13
3.84 10.73 6.23
0.21
63.75
61.14 .
40.28
3.83 10.37 6.26
1.19
61.93
39.35
2.70 8.57
5.87
0.95
57.43

11.10 Page 110

▲back to top


Prevalence o(Contraception
District
Rural population
Sterilization IUD Condom Oral Pill
Balaghat
Raipur
Durg
--
Rajnandgaon
Rewa
Shahdol
Sidhi
Satna
Sagar
Damoh
Panna
Chhatarpur
Tikamgarh
Dewas
Ratlam
ShajaP1l.1"
Mandsaur
Uiiain
38;9!1 0,,91 6.36
4.50
36.14
2.82 11.80 4.57
45.92
2.14 6.68
4.27
34.90
4.11 8.52
6.08
21.45
5.57 12.46 5.29
25.97
2.76 10.58 4.29
18.48
4.27 11.47
6.39
22.95
26.98
3.46 10.79 4.90
3.80 14.45 5.32
36.62
2.71 12.93 4.68
21.64
7.84 14.34 4.81
16.39
4.61 12.06 4.46
29.98- 5.45 19.32 5.25
42.31
1.61 6.26
3.13
33.74 . 3.93 12.38 5.85
30.54
3.76 15.02 4.84
29.88
4.15 15.80 4.85
38.79
3.53 11.78 4.25
Others
0.51
0.64
0.21
.
0.11
1.25
1.24
0.69
0.79
0.79
0.49
1.66
1.57
0.57
1.13
1.29
2.06
1.89
0.88
All
Methods
51.23
55.98
59.27
53.72
46.02
44.83
41.29
42.88
51.33
57.44
50.30
39.09
,60.57
54.44
51.19
56.22
56.56
59.23

12 Pages 111-120

▲back to top


12.1 Page 111

▲back to top


Population of Madhya Pradesh

12.2 Page 112

▲back to top


Maternal Mortality in
Madhya Pradesh
Introduction
Deaths due to complicatio~s related to pregnancy and child birth, commonly known
as maternal deaths, are among the leading causes of mortality for women in
reproductive ages in developing countries including India. These deaths have very
serious consequences within the family given the crucial role of the mother in her
children's health and welfare. According to the information collected by the Registrar
General ofIndia on the causes of death in rural areas ofthe country, maternal deaths
account for more than 15 per cent of the total female deaths in the reproductive age
group; almost 3 per cent oftotal female deaths; and 1.3 per cent of total deaths during
the year 1993 (Government of India, 1995). What is even more alarming is the fact
that these proportions are increasing over the years implying that reduction in
maternal deaths is not keeping pace with the reduction in female deaths from other
causes in the reproductive age group as well as in other population groups. The
maternal mortality ratio, the most common index used for measuring the risk of death
due to complications related to pregnancy and child birth, in India has been estimated
to be 555 per 100,000 live births (Marl Bhat et aI., 1992) which is about fifty times
higher than that of man)' industrialized countries and six times as high as that of
neighbouring Sri t.anka (UNICEF, 1991; Ascadi and Johnson.,Ascadi, 1990). It has
been estimated that India accounts for almost 27 per cent of all maternal deaths in the·
world.

12.3 Page 113

▲back to top


Population of Madhya Pradesh
In Madhya Pradesh, the available evidence suggests that the situation regarding
maternal mortality appears to beeyen worse than the national average. In 1993,
according to the sample registration system, matern~l deaths accounted for more than
2 per cent of the total deaths - a proportion which is significantly higher than the
national average. Similarly, maternal deaths accounted for more than 4 per cent of
the total female deaths in the state and almost one fifth of the total female deaths in
the reproductive age group (Government of Madhya Pradesh, 1996). The maternal
mortality ratio for t~ state during the period 1982-86 has been estimated to be 507
per 100,000 lwe births by using an indirect approach (Mari Bhat et at, 1992). On the
other hand, UNICEF has estimated a maternal mortality ratio of 738 deaths per
100,000 live births on the basis of empirical association that exists between maternal
mortality ratio and infant mortality rate (UNICEF, 1995). UNICEF, however, rates
its estimate of maternal mortality ratio as an under estimate ofthe actual risk ofdeath
due to complications of pregnancy and child birth prevailing in the state. On the other
hand, information available from the survey of causes of death suggest ,a maternal
mortality ratio of 416 maternal deaths per 100000 live births for the period 1970-72.
District level estimates of maternal mortality ratio in. Madhya Pradesh are not
available. However, it is expected that like the national level, risk of death due to
complications of pregnancy and child birth varies widely in the districts ofthe state
too. In any case, a near total lack of information about maternal mortality ratio at the
district level is a major hindrance in developing, implementing and monitoring
programme for reproductive health in the state.
In this paper, we obtain estimates of maternal mortality ratio for Madhya Pradesh and
for"each ofits 45 districts through an indirect regression estimation procedure based
,on commonly available information at the district level. Estimates of maternal
mortality ratio so obtained are then u$ed to'discuss inter-district variations in the risk
of death due to comPlications of pt:egnancy and child birth in the state. Lastly, ~e
paper suggests a decentralized cOmniunity based participatory approach to bring
down maternal mortality in the country.
A Method for Estimating Maternal Mortality
.
.
The method developed in this paper to estimate the risk of death due to complications
of pregnancy and child birth is based on the determinants of maternal mortality. A
considered review of the proximate determinants ofmaternal mortality suggests that
nearly all determinants of maternal mortality can be grouped into two broad

12.4 Page 114

▲back to top


categories - 1) social and economic conditions and cultural, societal and religious
contexts which influence the life style pattern and dictate, to a significant extent, the
health seeking behaviour of the population, and 2) extent of appropriate medical
attention and care during pregnancy-and at the time of delivery. This appropriate
medical care and attention includes both availability of appropriate and affordable
medical technology and use ofthe available technology by the community at large.
A regression of some indicator of the risk of death due to complications of pregnancy
and child birth on some indicator of social and economic conditions and on some
indicator of the extent of medical attention and care during pregnancy and at the time
of delivery, therefore, may provide an estimating equation which can help in
assessing the risk of death due to complications of pregnancy and child birth.
In this paper, we have measured the level of social and economic conditions by infant
mortality rate. It is well known that infant mortality rate is the most sensitive
indicator of social and economic conditions in the early stages of development.
Causes of infant mortality can be grouped into two categories. The first category of
,cause ofinfant mortality is generally termed as the soft rock of infant mortality. This
category includes primarily those causes which are the result of poor living
conditions - poverty, illiteracy, insanitary conditions, malnutrition, etc. Most ofthese
causes are easily preventable through the application of appropriate, low-cost
medical technology such as immunization and oral rehydration therapy. These causes
are widely prevalent in high infant mortality conditions. On the other hand, the hard
rock of infailt mortality includes those causes which are virtually independent of the
living conditions. These causes of infant death require very advanced, highly
expensive medical technology: At' the early stages of social and economic
development, it is the soft rock of infant mortality which dominates the scene and,
accordingly, reflects the prevailIng social and economic conditions in a very sensitive
manner .
.A simple, yet crude measure of appropriate medical .attention and care during
pregnancy and at the t4ne of child birth is the proportion of births attended by trained
persOns which may include doctor, nurse, or even a trained- birth attendant.
Conduction of delivery by a trained person signifies two things, at least First, it
reflects the knowledge and awareness of the woman and her family members about
the potential risks that may be associated with the delivery and, second, itis normally
associated with th~ examirilltion of the woman during pregnancy: Both these factors
are significant in identifying potential high risk women and initiating appropriate

12.5 Page 115

▲back to top


Population of Madhya Pradesh
remedial action and so are crucial in reducing the risk of death due complications of
pregnancy and at the time of delivery.
Finally. the risk of death due to complications of pregnancy and child birth haS Qeen
measured by the maternal mortality ratio which is the universally accepted indiCJltor
of this risk. Maternal mortality ratio presents the number of deaths to Women per
100000 live births that result from conditions relateq to pregnancy. delivery and
related complications (UNlCEFlWorld Health Organization. 1996). .
Data for the analysis of the regression of maternal mortality ratio on infant mortality
rate and proportion ofbirths attended by trained persons has been taken from the data
bank maintained by United Nations Fund for Population Activities (UNFP A. 1996).
In this analysis. only those countries were included which are at the middle of
demographic and social and economic transition. Countries with exceptionaliy poor
and exceptionally good experience of mortality transition were excluded from the
analysis in order to exclude the extreme values from the analysis. This regression
analysis, based on the information available from 96 developing countries of Asia
and Latin America selected for the purpose revealed the following relationship:
MMR = 6.26(IMR) - 8.56(TRA) + 681.10
(0.88)
(1.22)
_ltz
=
:'\\
0.85
F = 274.52
Where MMRJs the'maternal mortality ratio, IMR is infant mortality rate and TRA
is the proportion of births attended by trained persons. Figures given in parentheses
in equation (1) are the standard errors of regression coefficients.
It is clear from the coefficient of determination and standard errors of regression
coefficients that equation (1) provides an excellent fit to the data. The regression
coefficients of maternal mortality ratio on both infant mortality rate and on
proportion of births attended by trained persons are highly statistically significant and
the sign of these coefficient are in expected direction. Moreover, equation (1)
expl~s more than 8S per cent of the variation in the maternal mortality ratio across
the countries of Asia and Latin America. As such, equation (1) provides a simple way
of estimating maternal mortality ratio in situations where infonnation' on infant
mortality rate and proportion of births attended by trained persons is available. This
is what we do in this paper.

12.6 Page 116

▲back to top


Levels or Maternal Mortality in Madhya Pradesh
Equation (1) has been used to measure maternal mortality ratio for Madhya Pradesh
as well as for its constituent districts. It may be pointed out that the estimate of
maternal mortality ratio based on equation (l) depends upon the level of infant
mortality rate and proportion of births attended by trained persons. In this paper, we
have used estimates of infant mortality and proportion of births attended by trained
persons from various sources to obtain different estimates of maternal mortality ratio
at the state level. For the districts of the state, estimates of infant mortality are
prepared by the author on the basis of information collected during the Madhya
P.radesh Target Couple S\\lrvey (Shukla and Chaurasia, 1996) whereas estimates of
proportion of births attended by trained persons is available through the programme
service statistics of Child Survival and Safe Motherhood Programme only. Estimates
of the proportion of births attended by trained persons based on the programme
service may not be a good indicator of the medical attention and care during
pregnancy and child birth because several women particularly those who are better
educated and socioeconomically better placed, will be excluded as they utilize private
outlets more often. However, especially in the context of Madhya Pradesh, error due
to thiS'factor may not be significantly high as the state has a very high prevalence of
poverty and non-government facilities for maternal care are confined practically to
major urban areas only. Only about 10 per cent of the population ofthe state live in
those towns where adequate maternal care facilities in the non-government sector are
available.
Estimates of maternal mortality ratio based on the estimates infant mortality rate and
proportion of births attended by trained persons obtained through different sources
are given in table 1. The National Family Health Survey suggests that average
maternal mortality ratio in the state for the period 1988-92 has been around 616
maternal deaths per 100000 live births. On the other hand estimates of infant
mortality rate and proportion of births attended by trained persons obtained from
Sample Registration System suggest a maternal mortality ratio of 1098 maternal
deaths per 100000 live births around the year 1992. Lastly estimates of infant
mortality rate based on Madhya Pradesh Target Couple Survey and estimates of
proportion ofbirths attended by trained persons derived from the service statistics of
National Safe Motherhood and Child Survival Programme suggest a maternal
mortality ratio of 828 maternal deaths per 100000 live births. Man Bhat and others,
using a different methodology, has estimated a maternal mortality ratio of 535 deaths
per 100000 live births when the dependent variabl~ is sex ratio of death rate. When

12.7 Page 117

▲back to top


Population of Madhya Pradesh
female death rate was taken as the. dependent variable, they estimated a maternal
mortality ratio of 476 maternal deaths per 100000 live births for the state. Taking the
average of the two estimates, Mari Bhat and others suggest a maternal mortality ratio
of 507 maternal deaths per 100000· live births for the state for the period 1982-86.
UNICEF, on the other hand, has estimated a maternal mortality ratio of738 maternal
deaths per 100000 live births on. the basis of the correlation between maternal
mortality ratio and infant mortality rate. Clearly, estimates of maternal mortality ratio
vary widely depending upon the methodology adopted.
Information available through the Sample Registration System permit us to assess
the trend in maternal mortality ratio. Using the equation (1) and SRS estimates of
infant mortality and proportion of birth attended by trained persons, maternal
mortality ratio for the state has been estimated to be 1264 maternal deaths per 100000
live births. This ratio has reduced to 1098 maternal deaths per 100000 live births by
the year 1992. This mean~ that over a period often years, maternal mortality ratio in
the state reduced by an absolute amount of 169 maternal deaths for every 100000 live
births. In other words, over the past 10 years, for every 100000 live born, life of 169
mothers could be saved. Most of the reduction in maternal mortality ratio has taken
place only recently - after 1990.
Information available through the National Family Health Survey and the Sample
Registration System also permits to analyze rural-urban differentials in maternal
mortality ratio in the state. There exists a wide gap. in the risk of death· associated
with complic~tions of pregnancy and child birth in the rural and urban areas of the
state. Accofding to the. National Family Healtlt Survey, maternal mortality ratio in
the rural areas of the state around the year 1990 was 793 maternal deaths per 100000
live births which was significantly higher than the maternal mortality ratio of 342
maternal deaths per 100000 live births in the urban areas. This means that in
~omparison to urban areas, almost 450 more maternal deaths take place in the rural
areas of the state for every lOOOOOlive' born. Estimates of mat~mal mortality ratio
based on tP~ SRS data suggest that this gap is even. mo~ wide. Around. the year
1992, SRS based ·maternal mortality ratio in.-the rural areas of the state 'was 1194
maternal deaths per 100000 live births whereas as in the urban areas of the state,
according to our estimates, there were only 526 maternal deaths per 100000 live
births.

12.8 Page 118

▲back to top


For the districts of the state, recent estimates of infant mortality are available from
Madhya Pradesh Target Couple Survey. On the other hand, district level, survey
based infonnation on proportion of births attended by trairtedpersons is not
available. The only infonnation that is available for the dh,tricts of the state is the
programme service statistics of National Child Survival and Safe Motherhood
Programme in the state. Infonnation available thr6ugh the programme service
statistics does not include the infonnation related to the non-government sector.
Since it is widely beli~ved that better educated and socially and 'economically better
placed women utilize private outlets more often, any estimate of proportion of births
attended by trained persons based on programme service statistics may underestimate
the actual proportion. However, we have used the estimates available tJu'ough
programme service statistics mainly because no other source of inf~nnation is
. available currently.
0
Estimates of maternal mortality ratio for the districts of the state around the year
1995 are given in table 3. Itmay be seen from th~ table that the risk of a maternal
death v,aries widely across the districts of the stat~..Highest maternal mortality ratio
has been obtained in district Tikamgarh closely followed by district Chhatarpur. In
both these districts, almost"1200 mothers die of complications of pregnancy and child
birth for every 100,000 live births in a year. Other districts where maternal mortality
ratio has been estimated to be more than 1000 per 100,000 population are Guna,
Raisen. Sidhi, Sagar, Shivpuri. Panna. Satna and k.ewa.
Lowest maternal mortality ratio, on the other hand, has been estimated for district
Indore where only about" 3 mothers are estimated to die of complications of
pregnancy and child birth for'every 100,000 live births in a year. Other districts
where maternal mortality ratio has been found to be relatively low in comparison to
other districts of the state are Bhopal,Ujjain, Shajapur,Raigarh. Mandsaur and
Gwalior. In all these district$, maternal mortality ratio has been ~timated to be less
·than 700 ~atemal deaths for every 100000 live births in a year which is substantially
lower· than the state av.erage. Other districts, where maternal mortality ratio 'has been
found to be less than the state average are Bilaspur, Seoni, Rajgarh,Raipur, West
Nimar, Oewas, Mo~ BhiD;d,~oshangabad, Durg arid Rajnandgaon. .
i,
It is clear from 4 tableo as well as. from figure 1 th~t, barring district Indore, the
situation in regard to the risk of death due to complicatioris of pregnancy and child
birth are peor to extremely poor in all the districts of the state. Both social and

12.9 Page 119

▲back to top


~ Population of Madhya Pradesh
as D
.
economic conditions as measured by infant mprtality, rate well as appropriate
medical care and attention during pregnancy and at the time (lfdelivery as me.~~
by the proportion of births attend~ by trained persons; ap~t9 h4W8,their
contribution to this situation. However. as may be seen from equatiQJl(l).therole
of appropriate medical care and attention duril}g~pregnancy and at the time. of
delivery plays a much more signi,ficant role than the social and economic conditioI)S
in deciding the level of risk of death due tocompJi~ations of pregnancy and child
birth.;
,
",
;' ,
,',.'
Causes of Maternal Mortality
v
~.
,Cause of a maternal deaths can be either direc~ indirect. A direct cause of maternal
death is one which is associated with complications ofpr!gnancy, delivery or the
postpartum period including abortion co~plications. Haentorrhage, infection. sequels
of induced abortion. pregnancy induced hypertension. obstructed labour etc. are so.me
of the important direlt causes of maternal death. In most of the situations, there is a
'considerable Imount of overlap between these.causes; for example. a haemo"_ge
may result from a ruptured uterus or a serious infection could be, a seq~l~ of
prolonged and obstructed labour.
"
'
Indirect causes of Iitatenial death, on the other hand are dlle to existing medical
an conditions that are made .worse by the pregnancy or delivery. These causes are
primarily associated ,with 'women's health status. They are largely outcome of
environmental, social and economic conditions that ,prevm.l in the community.
Perhaps, the most' important, of these causes 'IS malnutrition, that is very widely
prevalent among India women: Malnutritiop. results is severeanatmic conditions
during pregnancy and at the' time of delivery that ultimately result in the death.
According to World Health Organization, approximately three fourth of the total
maternal death in the developing countries are due to direct causes'and the remaining
one fourth are due to indirect caulles (WHO, 1985). Another interesting pattern of
causes of maternal death is that a very limited nwnber of complications are
:nus 'responsible for the vast majority of maternal deaths. typical pattern of causes of
maternal mortality makes reduction of maternal mortality is relatively easy if these
causes are addressed effectively.
Very little community based or hospital based infonnation is currently available
about the causes of maternal mortality in the state. The survey of causes of death

12.10 Page 120

▲back to top


carried out by the Registrar General of India in all states of the country including
.Madhya Pradesh provides some information on the causes of maternal mortality in
the state. This survey is carried out in rural areas only and is based on the concept of
lay reporting of health information and not on medical certification of the cause of
death. Even this lay reporting is based on the verbal autopsy ofthe death. Moreover,
the size of the sample selected for the survey is too small to provide reliable
information on causes of maternal mortality. On the other hand, no information is
available about the pattern of causes of death across the districts of the state. One
possible source of information related tt>causes of maternal death at the district level
is the hospital data but little attempt, has been made to analyze the cause of death
data of hospitals and health institutions.
Proportional distribution of maternal deaths by cause during the year 1989 and 1993
derived from the survey of causes of death in rural areas of the state is presented in
table 5 for the state as well as for the country. Abortion, toxaemia, anaemia and
haemorrhage and fever during pregnancy are responsible for more than one fifth of
the total maternal deaths in the state. Moreover, there appears to be a significant
increase in the proportion of death due to puerperal sepsis in the recent years. By
contrast, the proportion of deaths due to mal-position of the child has decreased over
time. A similar pattern and trend prevails in the country as a whole also.
It may also be seen from table 5 that there has been some significant increase in the
proportion of death due to toxaemia and haemorrhage and fever during pregnancy in
the state during the last decade whereas proportion of deaths associated with mal-
position of the child and abortions has come down. However, because of very small
size of the sample and the approach adopted to ascertain the cause of death,
information given in table 5 is only broadly suggestive in nature. The only
observation that can be made here with a some degree of cert~nty is that the cause
of death pattern in-the state is not very significantly d~fferent from that 0f the country.
It would be of interest here to discuss the feasibility of various interventions
suggested to prevent main causes of maternal mortality. In case ofhaemorrhage, for
instance, except for.a few women who experience bleeding in the third trimester or
who have had previous problems with post partum haemorrhage, the occurrence of
haemorrhage cannot be predicted accurately. Moreover, the mainstay ofhaemorrhage
therapy remains access to safe blood and blood products and availability of facilities
for blood transfusion which are accessible by the community at a very short notice.

13 Pages 121-130

▲back to top


13.1 Page 121

▲back to top


Population of Madhya Pradesh
Infections, on the other hand may be prevented by better obstetric procedures.
including attention to sterilization of instruments and limitation of vaginal
examination. An essential prerequisite for ensuring better obstetric procedures is the
availability and use dfinstitutional delivery facilities in place of the current practice
of home delivery and conduction of the delivery by trained persons rather than by
untrained persons, especially the family members.';
For preventing deaths from pre-eclampsia and eclampsia, identification during pre-
natal period is most crucial whereas referral of complicated cases is necessary while
cesarean sections is the only way to prevent deaths from obstructed labour. Finally,
abortion complications can be prevented first by extensive availability of family
pUmning services and then by providing safe abortion services which are accessible
_ and affordable to the community.
.
This brief resume of the available approaches to deal with the known causes of
maternal mortality clearly suggests that preventive and health promotive approach
ofimproving health'status and addressing health problems, alone, is not sufficient in
preventingmos~ of the maternat deaths. Along with the preventive and health
promotive services efIit:ient and effective clinical and curative services are necessary
to ensure a speedy reduction in the risk' of death due to.complications of pregnancy
and child birth. A,comprehensive reproductive health care system, essential to reduce
maternal mortality, therefore, must take into account both preveritive and curative
di~ensions of reproductive health.
Determinants of Maternal Mortality
Causes of maternal mortality described and discussed in the previous section are,
basically, manifestations of the prevailing social, economic and cultural factors that
influence the health seeking behaviour of the community: As such, an examination
. of the underlying or secondary social, economic and cultural causes as well as health
conditions is essential for understanding the dynamics of maternal mortality.
There are a number of factors that lead to maternal morbidity which, if not attended
properly, leads to maternal death. These include ali~~a, malnutrition, other specific-
nutritional deficiency diseases, and many infections and metabolic disorders like
malaria and diabetes that affect pregnant women more seriously than other women
or men. On the other hand, social causes of poor maternal health include poverty and
illiteracy, 'low status'"expected role as bearer of many children and low age at

13.2 Page 122

▲back to top


Maternal Mortality
marriage. Social nonns, cUstoms and beliefs prevalent in the society also harm
women's health. Maternal health problems are allowed to persist in part because
women lack access and confidence in health services.
We have used the district level estimates of maternal mortality ratio to establish th~
relationship between the risk of death due to complications of pregnancy and child
birth with. three underlying cO,mmunity fac~rs - proportion of births .attended by
trained persons, female literacy rate and feniale mean age at marriage; Information
on proportion of births attended, by trained persons is for the year 1995-96.
Information on female literacy and female mean age at marriage has been taken from
1991 census.
In order to establish the association, we have carried out a two way classification of
the districts of the state. The-first classification, obviously was according to the level
of maternal mortality ratio. The second classification, on the other hand, was
according to one of the above three social factors. In each classification, the districts
were grouped into four categories - very low, low, high and very high. The important
point is that the nomenc1at»re very low, low, high and very high was done in relative
terms and not in absolute terms.
Results of our classification exercise are summarized in tables 6 through 8. An
indicator of the association between two variables in such tables is the number of
districts lying on the diagonal of the table. A large number of districts lying on the
diagonal of the table indicates a strong association between the two variables. On the
other hand, if this number is small then this means that the association between the
two variables is not strong.
According to the above criteria, it may be seen from tables 6 to 8 that association of
maternal mortality ratio with the extent of the deliveries attended by trained persons
is strongest while that with the female mean age at marriage'is the least. In case of
proportion of births attended by trained persons, 30 of the 45 districts are located on
the diagonal of the table while in case of female mean age at marriage, this number
is only 18.
It is also possible: froin tables 6 to 8 to identify districts where level of mortality is
better or poorer than 'that expected on the basis ofthe prevailing level of proportion
of births attended by trained persons, female literacy rate and female mean age at

13.3 Page 123

▲back to top


Populaliono{ Madhya Pradesh
marriage. As already mentioned, if the level of maternal mortality ratio in a district
is commensurate weiththe prevailing level of either proportion of births attended by
trained persons, or female literacy rate or female mean age at marriage than that
district should be on the diagonal ofthe table. If any district is located on the left of
the diagonal or below the diagonal ofthe table then it implies that the prevailing level
of maternal mortality rate is better than that expected. Similarly, if a district is
located on the right or above the diagonal than this means that the level of maternal
mortality r~tio in that district is poorer than expected.
According to the above criteria, maternal mortality ratio appears to be better than
expected in Balaghat, Chhindwara, Morena, Bhind, Hoshangabad, Durg, Mandsaur
and Shajapur districts and poorer than expected in Jhabua, Datia, Ratlam and Bastar
districts on the basis of proportion of births attended by trained persons. On the other
hand, if classification is done according to female literacy rate then in 13 districts of
the state, prevailing level of maternal mortality ratio appears to be better than that
expected, whereas in 10 districts, prevailing maternal mortality ratio appears to be
poorer than that expected from the prevailing levels of female literacy rate. Incase
of female mean age at marriage, these numbers are 17 and 11 respectively.
It is clear from the abov~ analysis that closest association of maternal mortality ratio
in the state is with the proportion ofbirtbs attended by trained-persons followed by
female literacy rate. Association with the female mean age at marriage appears to be
rather weak. In order to confirm this association, maternal mortality ratio was
regressed on proportion of births attended by trained persons, female literacy rate and
female mean age at marriage. Results of the regression analysis are given in table 9.
The regression coefficient of proportion of births attended by trained persons has
been found to be largest among the three independent variables whereas the
regression coefficient of female mean age at marriage has not been found to be
statistically significant. Moreover, inter-district variation in .the three independent
variables accounted for about.66 per cent of the inter-district variation in maternal
mortality ratio.
A close examination of table 6 through 8 reveals that district Morena is the only
district in the state where prevailing level of maternal mortality appears to be better
than that is expected on the basis of the prevailing level of any of the three
independent variables' - proportion of births attended by trained persons, female
lite~acy rate and female mean age at marriage. In view of the fact that a very high

13.4 Page 124

▲back to top


maternal mortality ratio has been estimated for the district, it implies that the social
and cultural environment is not at all conducive in this district as far as reduction in
maternal mortality is concerned. By contrast, there appears no district in the state
where prevailing maternal mortality ratio is poorer than expected in the context of
all the three independent variables.
Existing Approaeh to Maternal Care
Aithough maternal and child health has been a priority area on the health and family
welfare agenda of the state, yet the real impetus to maternal care could be given only
when the Child Survival and Safe Motherhood Programme was launched in 1992.
The Programme focused on the provision of essential obstetric care to the
community, although it also addressed emergency obstetric to some extent. It
identified the following interventions for reducing the risk of death due to
complications of pregnancy and child birth:
a. Early registration of pregnancy
b. Universal coverage of all pregnant women by immunization against tetanus
and iron and folic acid supplementation
c. Timely identification and treatment of complications during pregnancy
'd. Promotion of clean deliveries and delivery by trained persons
e. Promotion of institutional deliveries
f.
Management of birth spacing
g. Birth spacing.
The interventions identified and applied under the Child, Survival and Safe
Motherhood programme is based on what is known as the 'risk approach'. This
approach is a component of Risk Approach in Maternal and Child Health and Family
Planning developed by the World Health Organization (Backett et al., .1984; WHO,
1984) as part of a strategy to achieve the goal of 'Health for All by the Year 2000' -
a strategy by which health care systems can provide something for all, '''ut more to
those in need .... in proportion to that need. It is based on the CQncept that special
vulnerability to illness results from the possession of a number of interacting
biologic, genetic, environmental, psycho-social and other characteristics that can be
measured and converted into scores as 'a: shorthand expression of the probability for
future need and care'. The 'risk strategY' uses theseestiniates of mother's "need for
help 'as guides to action, to resource allocation, to better coverage and 'referral and
to family and clinical care'.

13.5 Page 125

▲back to top


Population or Madhya Pradesh
The 'risk approach' may be viewed as both a method measuring the need of
individuals and groups for care (thus providing a means of assisting them to
determine their priorities) and a tool for reappraisal and reorganization of health and
other services to meet that need (Backett et al., 1984).
The four fundamental steps in the risk approach suggested by World Health
Organization are: 1) use of epidemiological methods to identify priority health
problems and risk factors associated with those problems, 2) assessing the
performance of the local health care systems as regards prevention and treatment of
identified problems, 3) developing and implementing strategies to modify the risk
factors and to improve the performance of the health care system, and 4) monitoring
and evaluating the effectiveness, efficiency and acceptability of. the intervention
strategy. The results of this monitoring and evaluation then become the basis for
redefining the problem (Yan et al., 1989). It begins by determining which health pose
the ptest risk of the health of individuals and commwrities; in this way, the risk
approach identifies which subgroups within the society have the greatest needs. It
involves a continuing cycle of data collection and response to the information
obtained from the data.
Following the conceptual formulations ofthe risk approach developed by the World
Health OrgaQization, reproductive risk has been J,lsedin designing services for the
delivery of maternity care and for reducing risk of death due to complications of
pregnancy and childbirth. Yet,. very littla. has been done to evaluate critically the
experiences to date in using this paradigm of service delivery to bring down the risk
of a maternal death.
Recently, the risk approach of maternal care was the subject of discussion and debate
in a seminar organized by the Population Council (Rooks and Winikoff, 1990). The
seminar concluded that while it is possible to identify a group of women' that will ,
experience a higher or lower incidence of problems and bad outcomes associated
with pregnancy, it is not possible to predict accurately which individual WOmenwill
experience serious complications during labour and delivery. In other words, it is
possible to make predictions for a grmm, but not for individuals who comprise the
group. Risk assessment can be used to categorize individual women into such groups.
Once that is done, it is possible and reasonable to develop health services appropriate
to each group. However, it must be realized that some of the women in-the so-called
low-risk group will experience serious problems and that some of the women in the

13.6 Page 126

▲back to top


high-risk group will not. In many instances, most of the problems arise among
women in the low-risk group.
Another important conclusion of the seminar is that it is neither useful nor ethical to
identify high-risk women unless there is a functional referral system including
transportation, and accessible, effective services to meet their special needs. The bare
truth is that risk assessment can not substitute for quality medical care or for the
.ongoing provision of basic services to the community. The usefulness of the risk
approach depends on its operation within a functioning health care delivery system.
Another critical review of the existing approach to maternal care has been carried out
by Winikoffand others (Winikoffet aI., 1991). This review emphasizes that many
maternal deaths are not avoidable by traditional preventive health care that is,
availability offamily planning programmes to avoid unwanted pregnancies and good
prenatal care to improve general health and nutritional status. It has been stressed
that, in order to save a maximum number of mothers' lives, good quality medical
services need to be available when emergencies leading to death are most likely to
occur - near the timeoflabour and delivery. The authors argue that in order to ensure
a reduction hi maternal mortality, the reproductive health Clu,'emust take into account
both preventive and curative aspects of maternal health. certainly, attention must be
paid to family planning ~d prenatal care, but there also must be a system of access
to immediate referral and emergency care, especially during the critical times of
labour and delivery, if maternal mortality is to be reduced.
These comprehensive r~views Qf existing approaches of addressing the problem of
risk of death due to complications of pregnancy and child birth clearly indicates
,towards a need of a reorganization of existing maternal care servic~s; There are two
important areas in this regard: 1) establishment ·of appropriate training ·for all
category of health workers, and 2) design of referral netWorks. It maybe emphasized
that training is a broad concept that encompasses improvement inperfonnance and
expansion of responsibility from the lowest level health worker through the senior
professionals. For example, the seminar organized by the 'Population Council
identified that' even the traditional birth attendants must be able to provide some
emergency care at the tifbe of need such as breech deliveries and measures to stop
post partum haemorrhage. Another important recommendation put forwarded by the
same seminar is that women must be provided with accurate information about
absolute rather than relative risk.

13.7 Page 127

▲back to top


Population of Madhya Pradesh
Referral networks, on the other hand, are important because they are, in effect, the
gateways to. the services for patients in need. Availability of referral networks that
are easily accessible to patients needing care is absolutely necessary. It is also
important that these referral networks must operate efficiently. Otherwise, even the
most well-equipped and highly specialized maternal serVices will be inaccessible to
as patients in emergency. For the efficient functiQJling of"the referral system, it is
important that the referral systems must be constructed so not to over identify
patients needing referrals and extra medical attention. In this context, there is a need
to define risk cl~gories, so that only women'truly at high risk are referred. At the
same time, it is also necessary that attractive alternative sources of maternity care for
. low-risk women are also developed as even' the low •r.isk women may develop'
compljcations during labour.
!;
.
Under the Child Survival and Safe Motherhood Programmet the issue of referral
networks has been addressed by establishing First Referral Units. The basic idea in
establishing the First Referral Unit was to strengthen existing health care delivery
institutions by identifying gaps in the care being provided and filling up this gap by
providing support in terms of essential equipments, medicines, filing up vacancies
and tr~g (Government of India, 1994). In Madhya Prades~ 223 First Referral
Units have been established under the Programme. However, in view of the vastness
of the state in terms of area and resulting low ,population density t provisions made
under the Child Survival and Safe Motherhood Programme appear: inadequate. Total
area of the state, according to. the 1991 population census, is 443A46 square
kilometer. This means that, on average, one First Referral Unit covers approximately
2000 square kilometer of area. This means tha~ on average, a pregnant woman in
need of special medical-eare and services will have to travel a radial distance of more
than 25 kilometer to reach a First Referral Unit. Obviously, the First Referral Unit
remains beyond the reach of majority of poor women in the rural areas.
An important requirement for the efficient.fuI1ctioning of referral network is that it
should be designed so as not to over identify patients needing referrals and extra
medical attention. To avoid over identification and over loading of referral system,
it is essential that attractive alternatiye sources of maternity care should be provided
for those who are at low risk. At the same time, since' a number of low-risk women
have the likelihood of developing co~plications at the tIme Qf onset of labour - a
stage when transportation of the patient to the referral unit is either no l'ongerpos~ible

13.8 Page 128

▲back to top


.j,·l~
Maternal
,"-\\jtA·
Morta/it:_r0,-:~
or ,~tremely risky - availability of maternity care, services-~ithin tPe reach of the;
convnunityi$ crucial for reducing the risk of m~a1 dea.'.~, ,'l ~
j
,~:,
, r ~n1)i
. It is apparent'from the foregoing discussion thatcurrtnt effort$ to,~tft~e risk:tW~:
death due t? com~lic~tions of pregnancy an~ child,b~rth itl ~e stat~ imlina~1~f~1
as well as ;mappropnate. The concept of Fmt Referral Unit, promotedundetCffiel1
Child Survival ~d Safe Motherhood Programme mlly not be very effeeBve in a state'~
like M~ya Pradesh where population denSity is~ low and where infrastructure .
related to'transport and access remains poor. FQr\\the reduction of this risk, it is
necessary that preventive and health promotive appi'cJaChis supported effectively and
follo'Yed efficiently through a maternity' Cate system that' can provide quality
maternity care services and that is within the access of the community. Community
access to such maternity care, system is very important asa number of pregnant
women who are classified as low risk dUring-the course of pregnancy may develop
high risk symptoms at the onset of labour and may requite immediate emergency
care. For such women, preventive and health promotive approach to reduce risk of
death will not be sufficient. The only way to save life of these women is that basic i
maternity care services is within theit reach and there existS an effidiet1t r¢fefiaf"
network to provide support to basic maternity services to address the d~t1iWictJt8fli
emergency services.
A Framework for heducing Maternal,Mortality
One problem with the development, of need based policies and ,programmes for
reducing the risk of death due to complications of pregnancy and child birth is that
.there is no well-defined framework or model for the deterrttinants of maternal
mortality. A conceptual framework linking the primary and secondary causes of risk
of deaths due to complications of pregnancy and child birth with maternal death is
necessary to provide a basis for understanding mat~mal mortality in a way that can
lead to' development of specific policies and,programmes for its reduction. The
understanding of other demographic events, notably fertility"and child survival has
been advanced by the development of such models:(Davis and Blake, 1956;
Bongaarts, 1978; Mosley and Chain, 1984). In this seetio~, a fram,ework for the
analysis of mortality is:p~esented. This framework may provide the conceptual basis
a for developing policies apd programmes for a rapid reduction ofthe risk of death due
to, complications ofpreSnancy and child birth - risk':wJ;rich,till very recently, has
remained a.'neglected tragedy'.

13.9 Page 129

▲back to top


Population d/Madhya Prade.th
In recent years, a number of 8tudi~havc been earned out to focUs on a divetse set
of taetors1hat.arethought to be 8$sociated with maternal morHdity. Through these
studie$, efforts have been made to ic1eatifycauses and riSks of'inatel'ual mortality,
which are usuall)' or88llize(L~tq .$\\Ufh, Fategt).riclJ Q #etric, health services,
reproductive, socioeconomic and transportation factors (M8iJ[e etd., 1987; Royston
and Armstrong, 1989). Among the interventions being promoted are those that offer
family planning pre-natal care, nutritional supplementation, and tetanus
immunization; programmes that provide effective linkages between traditional birth
attendants" and modem health systems; and programmes that undertake overall
improvements in access to and the quality of emergency obstetric care (WHO, 1989;
Boerma, 1987). However, these causal factors and potential intervention operate at
quite different levels of proximity to the event of a maternal death. Some of these
factors are direct biological factors in nature while others are related to aspects of
social organization: cultural tradition and availability of appropriate" mec11calcare
oC services. However, a systematically defined causal 'JX'OCeiS "coDfisting distant and
intermediate or proximate determinants- that culminates in either" the death of a
woman due" to complications of pregnancy and delivery or to serious maternal
morbidity has rarely been developed.
As discussed earlier, there are two critical issues in reducing the risk of a maternal
death - 1) proper medical attention and care during pregnancy and delivery, and
2) social and economic conditions and. life style patterns. Among the two, the
importance of proper medical care and.attention during pregnancy and delivery lies
in the fact that most of the affect of social and economic conditions and life style
patterns operate through the care and attention during pregnancy and delivery.
Another reason of relatively more importance to medical care and attention compared
to social and economic conditions and life style patterns is that even those women
who have no signs of high risk during pregnancy may develop complications at the
time of delivery and may require immediate medical CaFeand attention.
o
Proper medical care and attention during pregnancy and delivery, in turn, depends
upon two crucial factors - a) efficiency and quality of maternal care services and
2) access to these services. Efficiency and quality of services are necessary to make
these services effective. Effectiveness of the services, in addition to having a telling
impact on the risk ot:.a maternal death, plays a vital role in building up the confidence
of the co~unity in the services made available. On the other hand, access to
maternal care services includes both availability of services and their use by the

13.10 Page 130

▲back to top


Maternal Mortality
community. If maternal care services are beyond the reach of the common people,
it will contribute little to reducing the risk ofthe maternal death even ifthese services
. are highly efficient and provide high quality services.
A necessary. condition for ensuring that appropriate maternal care services are
available and accessible to all sections ofthe community is a well spread out delivery
system as the necessary technology for reducing the risk of death during pregnancy
and delivery is freely available. There is now ample evidence to suggest that this
medical technology has the potential of reducing the risk of death due to
complications of pregooncy and delivery by 70 to 80 per cent if it can be made
available to all pregnant women. This reduction, incidently, is independent ofthe life
style patterns and social and economic conditions.
On the other hand, social and economic conditions and life style patterns shape the
health seeking behaviour ofthe population. Critical factors that influence the social
and economic conditions and life style patterns are povert)'> and illiteracy, social
segregation of females, their dependence on males in monetary terms, cultural
orthodoxy and preference to traditional system of attention and care during
pregnancy and child birth over the modern health care system. Scarcity of resources
in the family, in general, leads to one or the other form of discrimination against
females, especially mothers who are literally forced to subsist upon the residuals of
family resources. This living on the residuals of family resources lead to rampant
anaemia and problems related with the nutrition and persistence of even minor health
related ailments.
Given the important role of access to appropriate maternal care services in bringing
down the risk of death due to complications of pregnancy and delivery, the next
section outlines a framework for improving access to quality maternity care to the
community.
One possible approach to improving access to quality maternity care services is to
strengthen the midwifery services through an appropriate infrastructure and human
resources development programme. Strengthening midwifery services may go a long
way in extending emergency obstetric care services nearer to the community.
Moreover, by linking the midwifery services network with the First Referral Units
established under the Child Survival and Safe Motherhood Programme, an efficient
and effective referral network can be established at a relatively low cost and efforts.

14 Pages 131-140

▲back to top


14.1 Page 131

▲back to top


Poplllation of Madhya Pradesh
Development of an efficient and effective referral network, incidently, is critical to .
reducing maternal mortality.
Despite their vast potential in addressing the felt reproductive health needs of the
community, midwifery services have been given little at~ention in the evolution of
both government as well as non-government health· care delivery system. This
neglect has been at both policy as well as operational levels. Although the Auxiliary
Nurse cum Midwife was equipped with midwifery kits through the assistance from
UNICEF as early as in the 1970s, yet this important initiative could not be sustained
because of the lack of an appropriate human resources development programme and
an effective monitoring and evaluation system.
Midwifery services are classified as intermediate level obstetric care services. They
have their place somewhere between full obstetric and gynaecological services and
the nursing services. They constitute an important link between the nursing services
provided by health workers and health assistants in the field and medical graduates
and experts in the field of obstetrics and gynaecology who work in hospitals.
Developing and strengthening midwifery services, therefore, is crucial for developing
referral networks.
Some of the issues that need to be considered for developing and establishing a
midwifery services network are the following:
1. Evolution of a cadre of midwives. These midwives will be more skilled than
an Auxiliary Nurse cum Midwife or a Lady Health Visitor in providing both
essential as well as emergency obstetric care services to the community.
2. Development of a comprehensive human resources development programme
for midwives. At present, there is no such programme in the state.
3. Establishment offully developed and fully functional Maternity Care Centres
manned and managed by Midwives in the rural areas so that quality maternity
care services are within the reach of the community. Similar maternity care
centres may also be established in urban slums and small towns.
4. An analysis ofthe determinants of the risk of death due to cbmplications of
pregnancy and delivery. Current knowledge ofthe levels, trends, differentials

14.2 Page 132

▲back to top


and determinants of maternal mortality is. too poor to be of any help in
chalking out any effective programme of bringing down levels of maternal
mortality.
5. Development of a comprehensive reproductive health monitoring and
evaluation system. At present, there is no such system in existence. A
monitoring and evaluation system is necessary to measure transition in
maternal mortality and for ensuring necessary changes in the implementation
strategy.
Conclusions
This paper had two objectives. The first was to estimate the risk of death due to
complications of pregnancy and child birth for the state as a whole and for its
constituent districts. An indirect, regression based, approach has been used to
estimate maternal mortalit.y ratio for Madhya Pradesh and for each of its 45 districts.
These estimates suggest that the risk of death due to complications of pregnancy and
. child birth in the state is extremely high and there is very wide v~ation ,in this risk
across the districts ofthe state. For the state as a whole, the maternal mortality ratio
has been estimated to be 828 maternal deaths per 100,000 live births and in all but
two districts of the state, maternal mortality ratio is more than 600 deaths per
100,000 live births which, by any standard, is exceptionally high.
The second objective of the paper was to identify. major causes of mate mal deaths
and analyze the association of the prevailing levels of risk of death due to
complications of pregnancy and child birth with some intermediate variables and to
suggest a framework that may help in analysing determinants of maternal morta:Iity
and to suggest ways for reducing the risk of death due to complications of pregnancy
and child birth. The analysis has revealed that variation in maternal mortality ratio
is closely associated with 'the proportion of births attended by trained persons and,
to some extent, with female literacy rate but not with female mean age at marriage.
The paper has also reviewed the existing approach ofreducing maternal mortality in
the context of feasibility of medical interventions in preventing main causes of
maternal mortality. The available evidence suggests that the existing risk approach
of addressing the problem of maternal mortality, is not sufficient enough to ensure a
reduction in this risk and a reorganization of the existing health care services is
necessary. In this.-..:context,the paper for developing midwifery services as a link

14.3 Page 133

▲back to top


Population of Madhya Pradesh
between the primary level nursing care services and tertiary level obstetric and
gynaecological services. In view of the importance of appropriate medical care and
attention during pregnancy in reducing the risk of death due to complications of
pregnancy and delivery, the midwifery services based approach is probably the only
alternative.
-
1. Ascadi GTF, Johnson-Ascadi G, -1990, Safe motherhood in South Asia:
Socio-cultural and demographic aspects of maternal health. Background
Paper, Safe Motherhood South Asia Conference, Lahore.
2. Backett EM, Davies AM, Petro-Barvazian, 1984, The Risk Approach in
Health Care: With special reference to maternal and child health including
family planning. Public Health Papers No. 76. Geneva, World health
Organization.
3. Government ofIndia, 1995 Survey of Causes of Death (Rural) 1993. New
Delhi, Registrar General.
4. Government of Madhya Pradesh, 1996 Survey of Causes of Death (Rural)
1993. Bhopal, Department of Economics and Statistics.
5. Marl Bhat PN, Navaneetham K, Irudaya Rajan S, 1992, Maternal mortality
in India: Estimates from an econometric model. Dharwad, Population
Research Centre.
6. Rooks J, WinikoffB, 1990, A Reassessment of the Concept of Reproductive
Riskin Maternity Care and Family Planning SerVices. New York, The
. Population Council. .
7. .• Shukla A, Chaurasia AR, 1996, Madhya Pradesh Target Couple Survey:
Analysis offertility, infant and child mortality and practice.of contraception.
Bhopal, Government of Madhya Pradesh.

14.4 Page 134

▲back to top


9. United Nations Children's Fund, lc.'Jl, Children and Women in India: A
situation Inalysis. New Delhi, UNICEF.
10. United Nations Children's Fund, 1995, The Progress of Indian States. New
Delhi, UNICEF.
11. WinikoffB, Carignan C, Bemardik E, Semeraro P, 1991, Medical Services
to Save Mothers' Lives: Feasible approaches to reducing maternal mortality.
Workipg Paper No.4, Programmes Division. New York, The Population
Council.
12. World Health Organizations, 1984, A Workbook on How to Plan and Carry
Out Research on the Risk Approach in Maternal and Child Health Including
Family Planning. Geneva, Division of Family Health, World Health
Organization.
13. Van RY, McCarthy BJ, Ye HF, Qu CY, Li Z, Chen TX, Kowal D, 1989 The
Risk Approach in Perinatal Health: Sunyi County, People's Republic of
China. US Department of Health and Human Services Publication No. HHS
89-8412. Atlanta GA, Centre for Disease Control.

14.5 Page 135

▲back to top


Populationo[ Madhya Pradesh
ab e .
Estimates 0 materna mortality ratio In Madhya Pra es .
Period
Maternal mortality ratio
Combined
Rural
Urban
Source of information on
IMRandTRA
1988-92 616
793
342
National Family Health
Survey
1992
1098
1194
526
Sample Registration
System
1995
828
NA
NA
Madhya Pradesh Target
Couple Survey

14.6 Page 136

▲back to top


ae:
Year
1983
1984
19~5
1986
1987
1988 .
1989
1990
1991 -
1992
ren s m materna morta lty ratio m a lya ra es .
Maternal mortality ratio '
Combined
Rural
Urban
1227
1412
622
1257
1387
631
1267'
1391
660
1204
1343
'667
1244
1365
659
1239
1353
647
~
1207
1326
612
1161
1285
481
1193
1320
545
1098
1194
526

14.7 Page 137

▲back to top


Population of Madhya Pradesh
Estimates of infant mortality rate, proportion of deliveries attended
by trained persons and resulting maternal mortality rate (per 100,000.
live births) in Madhya Pradesh.
District
Infant
Mortality Rate
Proportion of
births atte~ded
by trained
persons
,(per cent)
Maternal
Mortality
Ratio
Tikamgarh
120
29.76
1178
Chhatarour
125
34.08
1172
Guna
98
19.25
1130
Raisen
104
25.8
1112
Sidhi
123
39.88
1110
Sagar
Shivpiui
92
! 20.07
85
17.48
1086
1064
Panna
·82
16.72
1052
Satna
105
35.78
1032
Rewa
Shahdol
East Nimar
Sehore
••
Balaghat
83
22.71
107
42.48
87
, 33.36
82
30.92
67
20.48
1007
988
940
.930
925
Chhindwara
Jhabua
71
25.19
. 910
118
61.02
898
Narsimhapur
88
39.41
895
Jabalpur
96
45.89
889
Dhar
83
38.28
873

14.8 Page 138

▲back to top


District
Vidisha
Surguja
Damoh
Datia
Ratlam
Betul
Bastar .
Mandla
Bilaspur
Seoni
Rajgarh
Raipur
West Nimar
Dewas
Morena
Bhind
Hoshangabad
Durg
Rajnandgaon
Gwalior
Mandsaur
Maternal Mortality
Infant
Mortality Rate
Proportion of
births attended
by trained
persons
(Per cent)
94
47.08
77
35.54
78
36.58
103
56.32
94
50.31
79
39.65
98
54.09
90
48.53
70
34.28
77
39.97
71
36.75
84
46.66
80
43.89.
'70
37.18
66
35.86
69
41.48
67
40.93
70
44.58
87
61.45
89
66.14
50
37.96
Maternal
Mortality
Ratio
867
859
856
844
839
836
832
829
826
821
811
808
806
801
787
758
750
738
700
672
669

14.9 Page 139

▲back to top


Population o/Madhya Pradesh
District
Raigarh
Shaiapur
Ujjain
Bhopal
Indore
Madhva Pradesh
Infant
Mortality Rate
Proportion of
births attended
by trained
persons
(Per cent)
77
59.39
56
49.64
70
60.38
73
73.66
50
82.07
80
41.31
Maternal
Mortality
Ratio
655
607
603
508
292
828

14.10 Page 140

▲back to top


Level of
maternal
mortality
ratio
>= 1000
800-900
600-800
<600
Maternal Mortality
Inter-district variation in maternal mortality ratio in Madhya Pradesh,
1996
Number
of
districts
Name of districts
10 Tikamgarh, Chhatarpur, Guna, Raisen, Sidhi, Sagar,
Shivpuri, Panna, Satna, Rewa
23 Shahdol, East Nimar, Sehore, Balaghat, Chhindwara,
Jhabua, Narsimhapur, Jabalpur, Dhar, Vidisha, Surguja,
Damoh, Datia, Ratlam, Betul, Bastar, Mandla,
Bilaspur, Seoni, Rajgarh, Raipur, West Nimar, Dewas
10 Morena, Bhind, Hoshangabad,·Durg, Rajnandgaon .•
Gwalior, Mandsaur. Rai~arh, Shaiapur,Ujiain
2
Bhopal, Indore

15 Pages 141-150

▲back to top


15.1 Page 141

▲back to top


Population of Madhya Pradesh
ae
auses 0 materna eat SIn a .lya ra es :
an
Cause of death
Madhya Pradesh
India
Abortion
Toxaemi~
1989
21.7
4.4
1993 ..
14.3
19.0
1989
10.9
7.9
1993
11.7
12.8
Anaemia
26.1
23.8
20.3
20.3
Haemorrhage and
fever during
pre2nancy
13.0
2..6.2
23.8
22.6
.
Mal-position of child
30.5
2.4
10.9
5.5
Puerperal sepsis
4.3
9.5
5.9
12.5
Not classifiable
0.0
4.8
20.3
14.6

15.2 Page 142

▲back to top


Maternal Mortality
Maternal
mortality ratio
Very High
>= 1000
High
800-1000
Low
600-800
Very Low
<600
Relationship of maternal mortality ratio with proportion of birth
attendedb)y tramed.persons.
Prooortion of births attended bv trained persons
Very Low
<30
Low
30-50
High
50-70
Very High
>=70
Tikamgarh
Guna
Raisen
Sagar
$hivpuri
Panna
Rewa
Balaghat
Chhindwara
-
Chhal3fJl\\1I
Sidhi
Sallia
Shahdol
ENimar
Sehore
Narsimhapur
Jabalpur
WNimar
Dhar
Vidisha
Surguja
Damoh
Betul
Dewas
Mandla
IJilaspur
Seoni
Rajgarh
Raipur
Jhabua
Datia
Ratlam
BIIStaI'
Morena
Bhind
Hoshangabad
Ourg
Mandsaur
Shaiaour
Rajnandgaon
Gwalior
Raigarh
Ujjain
Bhopal
Indore

15.3 Page 143

▲back to top


Population' of Madhya Pradesh
Table 7:
Maternal
mortality ratio
Very High
>= 1000
High
800-1000
Low
600-800
Very Low
<600
Association of maternal mortality ratio with female literacy rate.
Female literacy rate
Very Low
<25
Low
25·35
High
35-45
Very High
>-4S
Ouna
Shivpuri
Sidhi
Chhatarpur
Panna
Tikamgarh
Raisen
Rewa
, Satna
,
Sagar
i
Bastar
Betul
Balaghat
Rajgarh
Vidisha
Jabalpur
Sehore
Bilaspur
Narsimhapur
Surguja
ENimar
Dhar
Dewas'
.
Jhabua
Chhindwara
WNimar
Seoni
Mandla
Raipur
Shahdol
Ratlam
Damoh
!
Datia
Morena
~hajapur
,
Raigarh,
Bhind
Rajnandgaon
Mandsaur
Ujjain
,
Owalior
Hoshangab~
Durg
Bhopal
Indore

15.4 Page 144

▲back to top


Maternal Mortality
Association of maternal mortality ratio with female mean age at
marna2e I'Mn dha lya Pdrah es .
.
Maternal
mortality ratio
Female mean aile at rnirrialle (vears)
Very Low
< 16
Low
16-17
High
17-18
Very High
>-18
Very High
>= 1000
Shivpuri
Tikamgarh
Chhatarpur
Sagar
Satna
Rewa
Sidhi
Panna
Ouna
Raisen
High
800-1000
Shahdol
Rajgarh
,
Datia
Damoh
Dewas
Ratlam
Jabalpur
Narsimhapur
Surguja
Bilaspur
Vidisha
Sehore
Dhar
WNimar
BNimar
Betul
Chhindwara
Seoni
Balaghat
Mandla
Raipur
Jhabua
Dutar
Low
600-800
Morena
Bhind
Mandsaur
Shajapur .
Owalior
Ujjain
Hoshangabad
Durg
Rajnand280n
Raigarh
Very Low
<600
Bhopal
Indore
!
POPULATION FOUNDATION OF INDIA

15.5 Page 145

▲back to top


Population o(Madhya Pradesh
Regression of maternal mortality ratio on proportion of births
- attended by trained persons (TRA), female literacy rate (FLIT) and
female mean a2e at marria2e. (FMAM).
Variable
B
SE(B)
B
T
FMAM
-2.80
19.10
-0.014
0.147
FLIT
-4.92
TRA
-8.21
Constant
1377.46
R2 = 0.66, F = 28.86
• = p < 0.05; •• = p < 0,001
1.71
1.20
281.09
-0.275
-0.678
2.882·
6.823··

15.6 Page 146

▲back to top


Analysis of Patterns and Changes
in Labour Force in
Madhya Pradesh: 1981-91
Introduction
The purpose of this article is to analyze patterns and change in labour foree in
Madhya Pradesh during the decade 1981-91. We do this by anaIY8ing the levels,
trends and differentials in labour force growth as well in participation rates and
changes in its structure that have taken place between 1981 and 1991,'The analysis
is based on the information on work status of the population QOllected during the
1991 census. In the 1991 census, work has been defined as participation in any
economically productive activity and involves not only actual work but also eff~tive
supervision and direction of work. It also includes unpaid work on the fann or in
family enterprise. Such participation may be physical in nature.
The definition of work in the Indian population censuses has ch8ll8ed frequently. In
the 1961 and 1971 censuses, economic questions were based on usual status and
current status approach with reference period of one year and one week for seasonal
and for regular work respectively. In addition, an individual was classified as
"worker" or "nonworker" 00 the basis of his or her work status. In the 1981 census,
this approach was dispensed away with but the concept of work remained unchanged.
The reference period for seasonal as well as regular work was one full year preceding
the date of enumeration. Moreover, the dichotomous classification of workers and
nonworkers of 1971 census was replaced by a trichot9mous classification of4'main

15.7 Page 147

▲back to top


Populationo[Madhy(l~ir
n to } ~..: f; k:,f~W'l) i ,t~>.t ,f' £? ,{,~';) "
workers," "marginal workers" and "nonworker~.~1A:~fi~r\\vaiij~gbnzdd
8$:a.
"main w~rker" if he or she had. wt~~if~~jOf'~l~~.9fE~~~:P!~,qin~
~e
enumeration; he or she was classIfied as margmal worKer ITheol she worked for less '
than the major part of the year - six months (183 days) or more.
In the 1991 census both the concept as well as trichotomous classification of work
were retained to improve data comparability. However, a conscious and deliberate
attempt was made to enumerate woman unpaid family workers. In addition, the
definition of work was made more explicit and this aspect was also printed on the
individual slips below the economic questions.
Growth in Labour Force 1981-91
In between 1981 and 1991, working population in the state increased roughly by 5.84
million from 22.40 million to 28.24 million. This amounts to an average annual
growth rate of2.316 per cent. Growth in the labour force has relatively been rapid in
females (2.921 per cent) as compared to males (1.983 per cent). Similarly, growth of
labour force has been more rapid in urban areas (3.669 per cent) as compared to th~t
in rural area,s (Z.Q69 per, c~nt). .
,.,,<;, i,
?.rnn ,:': ~:L'J1'\\...~.•~':i~i()0,GtL\\'~_·"i~,~{n;~;[L}
.~
:mtefusttilgrft~'~~8i4t6t,te:t (~~h rrat~'~:lrttn~isb\\te·lut~.-been "slower itharF the
;;'pbpUlmidit~¥«1ei#~tin~
d{~tleBaae..1'~is:sugge:sts.t4athaathere.lbe~m,eitfrerno
t,!kcfii(ii;~llpr~I~Jl!ft~e;ab6!tiS#tI<?tt;~r,~ioncrea~ei'n:the~al'it~pl~r~9rk:er,the
.pr&\\\\imi\\reJ~~ar;ttHty:tltP' Hijplfa:3bf'th€'~e~On6my'hasa~¢liriedbe~etri' t~8J and
"199t rHiH~Uii~tiij~htJtf~iHat"1;p'P~v~ih'ttleurbah?areas'ofilie st~te;'ak:H:tIhe rural
:;ar'ii~,taWtihHg(t;~;gfb\\VjhftMWll~[ijtreHY)Hl)dtilir~hl~t1yhigItedli~tlthepoptilation
. gtd~Yai~:Bllitrth~(ft~tU~~~tijisHQ~e'c~n~'ried;(otriale~o.r~~ro'h1y;a dedline in
the productive cap,it'2HrpeFd~itifHfthe e~ono'rri:yhfth:eStateuhder cdndHions of no
techIlOlogi~ change and no increase i~ capital per worker is very much ~vident from
t~t)i~l:.'T}iete;'8fl?t~aSdhs¥{fb~:~eUnfisctission'ontnale.labom fotee only. First
,"f.ediaie fabbUTtdrbegtfiWthnte Irlatnuttefleet thenue~fncreasebecauseof increased
riettt~gdf~o'rltfui'.iitipai"faiiiily wdtker,s"durlngthe 1991 'census,'-Second, as we shall
see1at~i'~~roo~Sib(Vhefema}elilbout'tdrc'e is inmarghuil occupation and therefore its
, coniril1iifiQrfrP.lhC? eCbhQihy bftfie'State fuay atbest be termed as marginal.
,
~~"-::Jrnf,c:~:i';~(t-::':l,._',"--/~
:(;-::<i;':~' ,'j
-,
,;
-.
,;
SulJ'n~fi;\\p~l~'*~ijf~~I'~?,t~efsiPthestatehavegro\\Vn
extremely slowly during
the'Uecatf~;14~ne'Wbariareas' oftHErstate, in faett'the male marginal work force has
• deciirie<t'dttnng 'tffedecade',' Tlii~ eitrertlely slow 'growth of man~!marginal workers

15.8 Page 148

▲back to top


when combined with the relatively slow growth of male main workers in the state
during the decade suggests that an increasing number of male adults in the state are
unable to enter the work force. One straightforward reason for this observation is that
the economic and social production systems in the state have not been able to expand
enough during the decade so as to create more jobs in relation to the increase in the
working age population.
Since main workers of 1981 and 1991 censuses correspond to workers of the 1971
census, it is possible to estimate the trend in the growth rate of main labour force in
the state. It is clear from table 2 that growth rate of main labour force has declined
in 1981-91 as compared to 1971-81 in both sexes as well as in rural arid urban areas
of the state. It is only in case of rural males that the growth rate has shown some
tendency to increase. This is true not only for the state as a whole but also for its
different regions.
Among different categories of main workers, growth rate has declined in all
categories except agricultural labourers. But the most remarkable feature of table 2
is the near stagnation of increase in labour force in the house hold industry in the
rural areas of the state. Similarly, growth rate of female other workers in rural areas
has been extremely slow during the decade. This trend isa clear indicator ola
stagnant rural economy in the state.
In general, the trend in the growth rate of various categories of labour force in the
state clearly. indicates towards a worsening of the opportunities for employment,
particularly in the rural areas. The fact that there has practically been no· growth in
the labour force in the house hold industry sector in rural areas of the state suggests
poor performance of rural economy. This is so despite a huge investment in the rural
industrial sector in the name of rural development. On the other hand, a relatively
faster growth of agricultural labourers is suggestive ofthe fact that the opportunities
for employment in other sectors of the economy have actually reduced.
An interesting observation of table 2 is exceptionally high growth of cultivators and
agricultural labourers in the urban areas of the state. There are two possibilities for
this rapid growth. First, it appears that more and more urbanites are turning towards
agriculture for earning their livelihood. Such a trend is again indicative of the poor
growth of other sectors of the economy. Second, a heavy migration from rural to
urban areas and classification of rural areas into urban areas as a result of population

15.9 Page 149

▲back to top


Population of Madhya Pradesh
, {~
increase also appear to playa role. There has been a tendency of family migration
from rural to urban areas of the state not in search of job and secure livelihood but
for social security; and improved living. At the same tilne, in every census, a large
number of grown-up villages are classified as urban only because of population
. increase and despite the fact that majority of population as well as work force in
these areas continues to be engaged in agricultural pursuit.
Structure of the Labour Force
Around 1991, about 88 per cent of the labour force in the state was classified as main
workers. This proportion was 86.67 per cent in rural areas and 97.38 per cent in
urban.areas.·BlJ,ta more important observation of table 3 is that proportion of main
workeI'$ in the total labour force of the state has declined. This decline is attributed
IJ¥linly to the decrease. in this proportion among the male workers in the rural areas
of the state. In. the· urban areas of the state, proportion of main workers to total
workers has increased but this increase has, at best, been marginal.
Trends in the structure. of work force also indicates towards poor growth of the
economy of $e state particularly in the rural areas during the decade. It is clear that
growth in the economy of the state during the decade has'not been able to' keep pace
with the growing labour demand generated by the increase in population. As the
result, more and more labour force appears to have been pushed into marginal work
as work for one complete year was not available in the economy.
~~e bas also been. shift in ruraVurban composition of the labour force because of
different labour force growth rates in the two areas. In the rural areas, the proportion
of main workers has declined. This decline in.the proportion of rural workers to total
.main workers has taken place in all the categories of main workers, but it has
typically been rapid in case of household industrY where proportion of rural workers
to total workers declined by more than 5 per cent points during the 9ecad~. In other
workers category too there has been a steep fall in the proportion of rural workers
suggesting that growth of service and manufacturing sector in the rural areas of the
state has been poor.
Because of this. shift in the rural/urban composition of labour force, distribution of
main workers for the state as a whole according to different categories has shifted
towards non-agriculture pursuits. But no such shift is visible when rural and urban
areas are considered separately. If the structure of the labour force is any indication

15.10 Page 150

▲back to top


then it is clear from the table 3 that there has practically been notran8ition in the '
economy of the state during the decade. It continues to be almost entirely dependent
upon the agriculture sector as far as provision of employment is concerned. Growth
in non-agricultural sector of the economy of the state, whatever it may be, has not
been able to change the structure of the labour force in the state.
Sex structure ofthe labour force and its change over time in the state are interesting,
,For the total labour force, male workers heavily out· number .female workera, In the
urban areas of the state, this domination is at its extreme - there were only 197 fcmalo
workers for every 1000 male workers. The sex structure of main and mqinal
workers is also entirely different. The main work force is heavily 40minated ~y~e
workers but the marginal work force is heavily dominated by females ;,;there ~ing
11491 female marginal workers ,for every 1000 male marginal workers., '
Sex structure 'of the labour force also varies widely among, different "tegories of
main workers. Lowest sex ratio has been found in other workers catego!')' .. By
contrast, highest sex ratio has been observed hi agriculture labountt~ where JQ1~ and
females are very nearly in 1: 1 proportion.
In general, there has been a substantial incre~ in the sex ratio of workers of all
categories during the decade. For the 'labour force as a whole, number 'of (.we
workers for every 1000 male workers increased by 52 points during the decad •• This
increase has particularly been faster in the rural areas where labour force lOX I1Itio
increased by 77 points. On the other hand, in the urban areas, labour force sex ratio
increased by only 17 points. It was only in other workers eate~ry in the rural areas
where sex ratio has increased during the decade.
'
Increase in the sex ratio of marginal workers has been astron()~caJ.)y1Ugb when
compared to sex ratio of .main workers. Thus whereasmBin wode •• _mio
increased by 25 points, marginal workers sex ratio increased by3340poiJ:lta.TlUs
increase has been highest in the rural areas where,sex ratio incre¥ed.by 3512 points
during the decade. It appears that the increase in sex ratjo of the labour force in the
state during the decade is largely due to the increased netting of female unpaid family
worker during the 1991 'census. There are two reasons for this presumption. First
most of the increase in s.ex ratio is confined tQ marginal 'wo*ersand ~ot to main
workers. Second, there is no evidence of any speciat programme. or Jetivity fot
employment of women that would have increased the ratio;

16 Pages 151-160

▲back to top


16.1 Page 151

▲back to top


P.opulationofMadhxa Pradesh
Pal:tl'cip~tion Rate .
A.rbtihd t:99l;lthecrude participation rate in the state was 42.70 per cent meaning
that out of every 100 persons in the state approximately 43 persons were engaged in
some type of work - either main or marginal. For the rural'areas of the state, this
figure was 46.69 per cent where as in the urban areas only 29.49 per cent population
was found to be in the work force. Similarly, the crude participation rate for males
and females were 52.17 per cent and 32.53 per cent respectively. Both male as well
as female crude participation rates were higher in rural areas as compared to urban
areas.
Over the years,crude participation rate has shown a decline although the rate of
decline is slow. Interestingly, this decline has taken place only among the male
workers; in female workers the crude participation rate has increased. This increase
may be attributed to the increased netting of female unpaid family worker during the
·1991 census.
.
·Amorig m~in workers, in general, crude participation rate has declined over time but
in case of marginal workers·, the crude participation rate has increased. In case of
female main workerlt, however, there has been a rapid increase in the crude
participation rate in the urban areas. However, at the same time, the female marginal
workers participation rate in the urban areas has decreased. This indicates that the
,y ~~portuility of full time employment for females in urban areas of the state has
. increased.
..
Inter-district Variations
Considerable variations from the state average exist at the district level in both
growth as well as structure of the labour force. Highest labour force growth rate of
4.029 per cent per year has been recorded. in district Bhopal whereas in district
·Balaghat, the labour force growth rate has been estimated to be only 1.269 per cent
per year .;the lowest among all the districts ofthe state. In most ofthe districts ofthe
·state, labour growth rate has been between 2 to 3 per cent during the period 1981-91.
On the other hand, in 11 districts, growth of labour force has been very slow while
itfonly~ districts growth of labour force has been more than 3 per cent per years.
:futer-district variations in the growth of main workers is very much similar to that
oJ total workers but inter-district variations in the growth of marginal workers are
interesting. Growth of marginal workers was negative in 3 districts of the state while

16.2 Page 152

▲back to top


Labour Force
in 15 districts of the state marginal workers grew at an average annual growth rate
of4 per cent and more. In district Datia, highest marginal workers growth rate of 11
per cent per year has been recorded which indicates a very seriQUSpaucity of full
time employment in the district. District Datia, incidently, is a very small district and
there is little industrialization.
Like the labour force growth rate, crude participation rate also varies widely across
the districts of the state. Lowest crude participation rate has been observed ,irJ. district
Bhind where only 27 per cent of the population was in the labour force. On ihe other
hand, in district Jhabua, about 54 per cent of the population was ig.the laboUr force.
This proportion is highest among all the districts of the state. However. in majority
of the districts, crude participation rate varied between 35 to 45 per cent. There were
only 5 districts in which crude participation rate was below 35 per cent. On the other
hand, in only 4 districts, the crude participation was found to be more than 50 per
cent.
Bhind continues to be the district with lowest crude participation rate when the
discussion is restricted to main workers only. On the other hand,highest crude
participation rate for main workers was obtained in district Rajnandgaon where
almost half of the total population was classified as main worker at the time of 1991
census. Other districts with extremely low main workers crude participation rate were
Morena and Gwatior whereas in district Mandla, main workers crude participation
rate was second highest in the state.
Conclusions
Levels and trends in growth of labo~ force as well as in participation rate may be
regarded as an indicator ofthe growth and development of the economy of the state
at least for those economies which are labour intensive. The demand for job is
generated by the increasing population which puts an increasing number of adults in
the group of job seeker. This demand for job is met by the growth of economy which
creates additional job opportunities to meet this demand.
Viewed in the above perspective, it is clear from the foregoing analysis that the
economy or the state has not able to meet the job demand of the increasing
population ofthe state. The labour force growth rate has declined in the state during
the decade 1981-91 as compared to that during the period 1971-81. At the same time,
the proportion of population in marginal jobs has also increased. The situation

16.3 Page 153

▲back to top


Population of Madhya Pradesh
appears to be typically poor in the rural areas of the state where there has practically
been no growth oflabour force in the household industry sector and relatively faster
growth or agricultural labourers.
Perhaps the only silver lining in the growth pattern of labour force in the state is the
growth of female labour force. But the growth of female labour force appears to be
reflective more of the increased netting of female unpaid family workers rather than
any the actual increase in the number of female workers in the state. Unfortunately,
~ere is no way to measure the extent of growth in (emale labour force due to this
increased netting. But if the growth of male labour force is any indication, certainly
the employment scenario in the state has worsened during the decade.

16.4 Page 154

▲back to top


Labour Force
Population and labour force growth rates in Madhya Pradesh: 1981-
91.
Population
growth rate
Labour force
growth rate
Main workers'
growth rate
MargittaI
workers' growth
rate
Person
Male
Female
Person
Male
Female
Person
Male
Female
Person.
Male
Female
All
2.370
2.415
2.322 .
2.316
1.983
2.921
2.195
2.012
2.645
3.296
0.193
3.628
Rural
1.997
2.057 . ')
1.934
2.079
1.606
2.813
1.898
1.630
2.476
3.340
0.284
3.633
Urban
3.714
3.665
3.769
3.669
3.527
4.424
3.706
3.562
4.570
2.417
-0.603
3.450

16.5 Page 155

▲back to top


,
Population of Madhya Pradesh
year).
Person
1971-81 1981-91
Main workers
All
2.702
2;1 95
Rural
Urban
2.386
4.678
1.898
3.705
Cultivators
All
2.532
Rural
2.472
Urban
5.713
Agricultural labourers
All
1.788
Rural
1.658
2.177
2.105
5.013
1.882
1.735
Urban
5.626
Household industry
4.938
All
2.371
0.854
Rural
Urban
2.02
3.404
0.067
2.747
Other workers
All
Rural
4.497
4.314
2.806
1.586
Urban
4.621
3.542
Male
1971-81
1981-91
Female
1971-81 1981-91
2.216
1.77
4.501
2.012
1.63
3.562
4.058
3.927
5.886
2.645
2.476
4.57
1.692
1.616
5.303
1.719
1.632
4.678
5.461
5.429
8.306
3.398
3.347
6.664
1.399
1.241
5.548
1.953
l,781
-5.044
2.242
2.14
'5.744
1.803
1.682
4.777
1.423
0.942
2.813
0.694
-0.068
2.459
4.816
4.755
5.005
1.195
0.344
3.414
4.293
3.987
4.494
2.809
\\.742
30439
6.25
6.476
5.833
2.777
0.509
4.41g

16.6 Page 156

▲back to top


ae
tructure 0 a our orce In a lya ra es .
Category
Year
Rural
Urban
Main workers
1981
88.52
96.73
..
1991
86.67
97.38
Cultivators
1981
51.96
. 59.95
1991
51.87
61.20
Agriculturil1
labourers
1981
1991
24.24
23.50
24.75
27.00
House hold
industry
..
Other
workers
1981
1991
1981_
1991
3.52
3.04
3.08
2.54
20.28
6.56
21.55
9.26
Marginal workers
1981
11.48
3.27
1991
13.33
2.62.
Total
89.47
88.39
7.36
8.39
6.30
7.12
6.18
5.62
80.16
78.87
10.53
11.61

16.7 Page 157

▲back to top


Population of Madhya Pradesh
ae:
ex structure 0 e a our orce In a lya ra es .
Category
Female workers per 1000 male workers
Year
Total
Rural
Urban
All workers
1981
529
607
180
1991
581
684
197
Main workers
1981
393
446
157
Cultivators
- 1991
..1981
418
485
174
345
349
183
1991
408
415
223
Agricultural
labourers
".-f.i.'.• ~ •
.'
" House hold
industry
1981
1991
1981
1991
896
906
670
882
897
652
458
476
412
482
496
453
Other workers
1981
128.
154
112
Marginal workers
1991
. 1981
.128
136
124
8151
8836
2395
1991
1149i
12352
3591

16.8 Page 158

▲back to top


ae
Region
. ru epl lClpatlon rates 10 Mdah;lya Pradesh
..
". All work~rs·.
.. Maiifworkers
'"
Mar.nllal workers
and sex ., .. 1981
···1991 ...···198l .. ·1991· 1981 " ...•
1991
A.'ll
regions
.
:
':: ..;•.1' ,',c,>
: 1.
.
:.1-,
Person
42.92
42.70
38.41
37.74
4.51
4.96
Male
Female
54.48
52.17
53.52
51.40
0.96
0.77
30:64
32~·53 22.34
23.08
8.30
9.45
Rural
.
Person
Male
46.31
56.38
46.69
53.89
40.87
55.30
40.47
52.98
5.44
6.22
..
1.08
0.91
Female.
..
Urban
35.78
39.07 25.78
27.21
10.00
11.86
Person
29.62
29.49 28.74
28.72
0.88
0.77
Male
47.29
46.64
46.80
46.32
0.49
0.32
Female
9.63
10.28
8.31
9.00
1.32
1.28

16.9 Page 159

▲back to top


Population of Madhya Pradesh
InteNlistrict variations in labour force growth rate in Madhya
Pradesh: 1981-91
Labour force
growth rate
All workers
Number of d.$triets
Main workers Marginal workers
<0
3
0-1
3
1-2
11
14
7
2-3
30
29
9
3-4
3
2
8
>=4
1
15

16.10 Page 160

▲back to top


Inter-district variations in crude participation rate in Madhya Pradesh
1981-91
Crude participation
rrate
Number of districts
All workers
Main workers
25-30
1
3
30-35
4
11
35-40
10
18
40-45
15
11
45-50
11
.
2
>=50
4
.-

17 Pages 161-170

▲back to top


17.1 Page 161

▲back to top


Population or Madhya Pradesh

17.2 Page 162

▲back to top


Urbanisation in Madhya Pra~esh:
Results of 1991 Population Census
Introduction
In Madhya Pradesh both level and pace of urbanisation is low. This is because of
very low level· of social and economic development in the state. During the British
rule, the state, ·_s· it exists today, remained largely underdeveloped divided into
numerous' princely states called Riyasat in the local language. The Rulers of these
-princely states rarely did anything for the upliftmentof their populace. Even after
independence, the state remained divided into numerous administrative units and the
present boundaries were formed only in 1952 when four erstwhile provinces and all
the princely states of the region were merg¢ together.
Despite the fact that both the levels as well as the pace of urbani sat ion in the state is
low, the results· of· 1981 population census had indicated towards a rather faint
visibility of the end of urbani sation cycle in some of the distriCts of the state (Dubey
1981). Chaurasia (1987) has also concludedlhat urban population in sOlllerelativel)'
developed districts of the state is growing at a slower rate than other districts.
It is in the above context, we analyse here the information on urban population
distribution in the state which have been released recently (Government of India,
1991). Itis expected that the analysis will be able to provide useful insight on the
spatial distribution of the population in the state.

17.3 Page 163

▲back to top


Population of Madhya Pradesh
.
.
Projections of urban population in the state have earlier been carried out on the basis
of the results of 1981 population census (Chaurasia, 1987). An additional objective
of the present analysis is to compare actual urban population growth in the districts
of the state during the decade 1981-91.with that projected earlier on the basis of the
1981 .population census. Such a comparison will also help in analysis urban
population growth patterns in the state.
Increase in Urban Population
Low level and slow pace of urbani sation in the state can be judged from the fact that
as late as in 1941, more than 98 per cent of the population was living in the rural
areas. Since then, urban population in the state has shown a regular increase. By
1991, about 23 per cent population of tlle state was living in areas classified as urban
by·the Census Commissioner of India. At the time of 1971 population census, th~s
proportion was 16 per cent suggesting that during the last twenty years, proportion
of population living in urban areas of the state has increased by about seven absolute
points. In terms of the count of the people, this means that during the last twenty
years, nearly 2600 thousand people were added to the 1971 urban populati~n of the
state. Incidently, this net addition in the urban population of the state "Wing the last
.twenty years' is more than the total urban population in the state a~the time of 1971
.population censu~. The year 1971 has purposely been take~_as the reference date for
comparison. The reason is that the definition of the urban area in the Indian census
varied widely prior to the 1971 population. It was only from, 1971 'pop~lation census
onwards that the same definition of the urban area has been'ret8med in ~ll ptlpulation
.:.censuses.I' ...
.
."
. ,. , .1, i!! .. /·'H.·P·'i'
'1,,::; ",,1'1 ,'J:,{t' ';' . ,
Ill,
. , <OJ ,if :;")
\\l'i! .,.! ~
\\ "'
..
,
.~
,~.
.
Unlike the trend in the proportion of population urban, trend in the average annual
rate of urban population growth shows a different pattern. Though this rate increased
substantially since 1921, the rate.ofincrease has not been uniform in all the census
,decades. Trend in this rate may be characterisedby a rapid increase in one decade
(ollowed by a near stagnation or even a decline in the next d~e and, than it sharp
'.increase again. During the decade 1981-91, the rate of urban population growtl in
the state averaged 3.71 per cent per year which is substantially lower than that
recorded during the decade 1971-81. buring' the decade 1961-71 too this rate .
'declined as compared to the rate during the decade 1951-61 but then amount of
d;~line ,was very small.
.
'

17.4 Page 164

▲back to top


Fluctuations in the average annual rate of urban population growth notwithstanding,
net lUldition to the urban population of the state continues to increase 'in every
decade. Though the growth rate of urban population decreased substantially during
the decade .l981~91, yet 955 thousand more people were 'added to the urban
population of the state in this decade than those added during the decade .1911~81.
Moreover, the growth rate of urban population has been consistently higher than Q1e
growth rate oftotal population of the state. The gap between the two rat~ however,
has narrowed down substantially during the 1980s because of both an increase in the
as growth rate of total population well as a decrease in the growth rate of urban
population. This gap is due to both the gap in the rate of lUltural increase of urban and
total population as well as due to the movement of people from rural areas to urban .
areas. The available infonnation is not adequate enough to ascertain how much of
this gap is due to the difference in the rate of natural ins:rease and how much it is due
to the movement of population.
'
.,..' .<
.1 ~
;: ~ I
I)
Most of the urban population oftbe state is concentrated in big towns and cities and
this is expected. Not only nearly half of the urban population of the state was
concentrated in size class I towns ~with a population of 10000 and more ~but also
net addition to population of these towns has been highest in this ,class. By contrast,
proportion of urban population living in other towns is muCh lower and so is the net
addition of urban population to these towns during the last twenty years. ',
As far as the average annual rate of growth of urban population of different size class
;of towns is concerned, except size class I and, to some extent, s~ class IV towns,
the' trend in. the growth rate has been fluctuating. The 'case of size; class Il and III
towns is noteworthy in this regard. In size class II towns, average annual rate of
growth was very high during the deeade 1971 ~81 but it reduced very' sharply during
the decade 1981~91. On the other hand a completely reversed trend has been noticed
in the growth of population in size class III and V towns. By contrast, both size class .
I and IV show a fairly consistent growth rate during the past twenty years. This
consistency in average annual rate of growth is well reflected in P1enet addition to
population of different size class of towns. Net addition to size class IV towns has
been greater than the net addition to.$ize class Il and Iq towns.
'
. During the last twenty years, there has been a pbenoIll:enal increase in the urban
dwelling units in the state. The increase has been most prominent in size class IV in

17.5 Page 165

▲back to top


Population of Madhya Pradesh
which number of dwelling units increased from 72 to 177 between 1971 and 1991.
r Similarly, in size class and II also the number of dwelling units more than doubled
during this period .. On the other hand, the growth of dwelling units in class III towns
h~ been very slow where as the number of dwelling units of size class VI decreased
during the last twenty years.
An analysis of the factors responsible for differential pattern of growth in different
size class of towns in the state is not the scope of this paper. Differences in the rate
of growth may be attributed to many factors. Some of the important ones are:
migration between different size class oftowns, reclassification, and differential rate
of natural increase in diffetent size class of towns. Unfortunately; it is not possible
to comment on these factors simply because the relevant information is not available
at present.
Inter-district Variation in Urban Growth
District level statistics on urban population are presented in appendix table to this
paper and are surnrnarised in tables 4,5" and 6 respectively in terms of proportion of
total urban population, per cent urban and average annual growth rate of urban
. population. Over the districts of the state, urban population is well spread. However,
there are signs of urban population concentration in some districts of the state. There
are seven such districts - Gwalior, Bilaspur, Durg, Raipur, Indore, Bhopal and
Jabalpur. All these districts have large metropolitan cities having divisional
administrative headquarters. These metropolitan cities have also been the traditional
growth centres since distance past. The pull factors associated with these cities
appear to be primarily responsible for the concentration of the urban population in
th~se towns and hence in these districts.
In nine districts ofthe state, on the other hand, proportion of urban population to total
urban population ofthe state was less than one per cent with least proportion of 0.58
per cent observed in Panna and Sidhi districts, Others districts" in this group are:
" , Datia,Jhabua, Sehore, Raisen, Narsimhapur, Seoni,Mandla and Balaghat. All these
districts are among the least developed districts of the state. Four of these nine
districts are the smallest districts of the state in terms of both area as well as
population. The small size of population of these districts appears to be responsible
for this low proportion. This fact is brought out more clearly in table 4 in which the
distribution of districts according to the proportion of the total urban population of
the state is presented.

17.6 Page 166

▲back to top


Urbanization
In general, in only 11 districts of the state, twenty-five pet cent or more of the
population of the district was living in urban areas at the time of 1991 population
Census. The highest proportion of urban population in the district has been observed
in district Bhopal. In this district, more than four fifth of the total population of the
district was living in urban areas, In ahnost all the districts having large metropolitan
cities - Bhopal, Indore, Gwalior, Jabalpur,Durg - the leyelofurbanization is quite
high. By contrast in districts where the majority of population is constituted by the
tribal population, level of urbanization is low. Such a pattern is expected as the tribal
people are usually forest-based people. They earn their livelihood from the forest
produce and usually live in isolated settlements deep in the forest away from the
current stream of social and economic progress.
In majority of the districts in the state, average annl,lal rate of growth of urban
. population has been between 3 to 5 per cent per year during the 1980s.In 8 districts,
this rate was below 3 per cent per year with lowest growth rate of 1.96 per cent per
year re~orded in district Jabalpur - where nearly halfofthe population was living in
urban areas as of 1981. On the other hand in 9 districts of the state, the growth rate
has been higher than 5 per cent per year with highest growth rate of more than 15 per
cent per year recorded in district Sidhi ..the least urbanized district of the state.
In district Bhopal, however, urban population continues to grow at a very rapid pace
despite very high level of urbanization in the district.The state capital city of Bhopal
is located in this district which is the hub of the poli~ical, social and economic
activities of the state. The level ofinfrastructure development in and around the city
of Bhopal and the attraction ofliving in the state capital along with the diverse nature
of opportunities both in employment and in enterprise available at the central place
appear to have attracted large number of people from the surrounding districts to
migrate to this district, particularly to the city of Bhopal.
Though urban population growth rate has been higher than the total population
growth rate in all the districts of the state during the 1980s yet there is considerable
variation in the difference between urban and total population growth rate. A positive
relationship between the difference in urbanjJ1d total population growth rate and the
urban population growth rate can easily be verified from table 6. In all districts where
urban population growth rate was less than 3 per cent per year, the difference was
also less than one per cent point. On the other hand in all districts with an average
urban population growth rate was more 5 per cent per year, the difference was also

17.7 Page 167

▲back to top


Population of Madhya Pradesh
more then 3 per cent point. Interestingly, in a number of highly as well as lowly
urbanized districts of the state, the difference between urban and total population
growth rate has been found to be relatively small. The reason is that in the earlier
case the growth of urban population is determined primarily by the growth of urban
population while in the later case it is determined primarily by the gt"9wth of rural
population. However, very little is known about this pattern of difference between
the growth rates of urban and total population of the state.
The fact that the growth of urban population has declined during the 1980s as
compared to 1970s is also supported by the district level data. In 30 ofthe 45 districts
ofthe states, the average annual rate of growth of urban population declined in 1981-
91 as compared to 1971-81. Quite interestingly, in all but two of those fifteen
districts where the ur\\lan population growth rate has followed an increasing trend, the
level of urbanization as of 1991 was less than 20 per cent. The only exceptions are
district Dewas and district Mandsaur. In both these districts, the level of urbanization
is relatively high. This observation also supports the negative relationship between
the rate of urban population growth and level'ofurbanization in a particular district.
Comparison of Actual and Projected Trends
On the basis of the results of 1981 pop\\!lation census, district level projections of
urban population growth were prepared lChaurasia, 1987) by using the projection
methodology of the United Nations (United Nations, 1985). A comparison of the
projected urban population growth with the actual one reveals that in 20 districts of
the state, actual urban population growth has been equal to the projected one as
measured by the proportion of urban population in the district while in 20 other
districts, the actual growth of urban population has been slower than the projected
one. In only 5 districts, the actual growth of urban population ,has been higher than
the projected urban population growth as arrived at on the basis of the 1981
population census results. Of these five districts, two - Panna and Sidhi - are the least
urbanized districts of the state. On the other hand, the actual growth of the urban
population has been higher than the projected one in district Dewas, Morena and
Guna. District Dewas is a relatively urbanized district whereas in Morena and Guna,
there -has been a spurt in the industrial activity during the decade.
lj
Conclusions
The results of 1991 population census suggests a considerable slowdown in the
process of urbanization in the state'during the decade 1981-91 as compared to the

17.8 Page 168

▲back to top


Urbanization
decade 1971-81. Reasons for the slowdown of the urbanization process in the state
are not known at present. But this slowdown of the urban,ization process at a
relatively low level of urbanization is rather surprising and supports the view of the
end of urbanization cycle as suggested at the time of 1981 population census. It is
also premature to suggest at this stage whether this slowdown ofthe urban population
growth in the state is due to a decrease in the rate of natural increase of the urban
population or due to a change in the pattern of the flow of population from rural to
urban areas.
Despite, the fact that, in general, the urban population of the state is now growing at
a substantially slower rate than in the past, in some districts of the state, the rate of
urban population growth is very rapid. Since such a rapid increase in urban
population growth cannot be due to rate natural increase along, there is every
possibility of substantial migration from rural to urban areas in these districts. In any
case, the very rapid rate of urban population growth in these districts suggests that
in the near future, there will be very substantial increase in the urban population in
these districts. There is therefore the need for the initiation of an urban planning
policy in these districts of the state.
Reclassification of rural areas into urban areas has been found to be one of the most
important reasons for abnormally high and abnormally low rate of urban population
growth in the districts of the state (Chaurasia, 1987). On the basis of the analysis
based on the population census it has been found that. nearly 78 per cent of the
increase in the urban population in district Tikarngarh - the district which observed
highest rate of urban population growth during 1971-81 - was due to reclassification
of rural areas into urban areas. It will be an interesting exercise to carry out a similar
analysis on the basis oftbe 1991 population census.
1. Chaurasia AR (1987) Levels, Trends and Projections of Urbanization in
Madhya Pradesh, 1901 - 2001_Shyam Studies in Population and
Development, No.6, Datia, Shyam Sansthan.
2. Dubey KC (1981) Census of India 1981. Series - 11 MP. Provisional
population Totals. Bhopal office of Census Operations.

17.9 Page 169

▲back to top


Population of Madhya Pradesh
3. Government of India (1991) Census of India 1991, Series -1 India:
Provisional population Totals: Rural - Urban. Distribution. New Delhi,
Office of Registrar General.
4. United Nations (1985) Estimates and Projections of Urban Rural and City
Population, 1950 - 2025: The 1982 Assessment. New York, United Nations.

17.10 Page 170

▲back to top


3e:
Year
1901
1911
1921
1931
1941
1951
1961
1971
1981
1991
row ouranpo
Population
Total
(000)
16861
19441
19172
21356
23991
26072
32372
41654
52179
66136
Urban
(000)
1458
1299
1440
1772
2353
3133
4627
6785
10589
15348
)U a Ion 10 a lya ra es 1.
.
Per
cent
urban
Average annual
growth rate
(per cent)
Total Urban
Growth in
urban
population
. (000)
8.65
6.68
7.51
8.3
9.81
12.02
14.29
16.29
20.31
23.21
1.42
-0.14
1.08
1.16
0.83
2.16
2.52
2.37
2.37
-1.15
1.03
2.07
2.84
2.86
3.9
3.85
4.45
3.71
.-159
141
332
531
780
1494
2158
3804
4759

18 Pages 171-180

▲back to top


18.1 Page 171

▲back to top


Population of Madhya Pradesh
Urban population distribution by size class of towns in Madhya -
Pradesh-, 1971-91
Size
Number of urban
Absolute Population
Per cent
class agglomeration, cities & population
addition
addition
towns
1971
1991
1991
(000)
1971-91
(000) .
I
11
23
7733
4671
54.54
II
11
29
2139
1.387
16.2
III
41
69
1968
655
7.65
IV
72
177
2478
1519
17.74
V
90
130
1010
340
3.97
VI
7
5
20
-8
-0.09
Total
232
433
15348
8564·
100

18.2 Page 172

▲back to top


ae
Size
class
I
II
III
IV
V
VI
Total
r an popu a ion grow )YSize c ass 0 towns.
Contribution to total population
Avera2e annual growth rate
1971
1991
1971-81
1981-91
45.05
10.26
50.38
13.94
4.81
4.45
. 9.31
1.14
19.81
12.82
-0.13
4.17
14.37
16.15
5.14
4.36
10.09
6.58
1.92
2.18
0.42
0.13
-7.67
4.31
100.00
100.0
4.45
3.17.

18.3 Page 173

▲back to top


Population of Madhya Pradesh
Proportion
(per cent)
<2
2-4
4-6
>;"'6
Distribution of districts according to the proportion of urban
DOt u1ah.on to tota I urbanpopu Ia' bon 10 tehstate, 1991
Districts
Number Name
29
Bhind, Datia, Shivpuri, Guna, Tikamgarh,
Chhatarpur, Panna, Damoh, Satna, Rewa,
Sidhi, Shajapur, Dewas, Dhar, West Nimar,
Raigarh, Vidisha, Sehore, Raisen, Betul,
Narsimhapur, Mandla, Seoni, Balaghat,
Surguja, Raigarh, Rajnandgaon, Bastar.
9
Morena, Sagar, Shahdol, Mandsaur, Ratlam,
Ujjain, East Nimar, Hoshangabad,
Chhindwara.
4
Gwalior, Bilaspur, Durg,Raipur
~3
Indore, Bhopal, Jabalpur
-------_ ....•'"------:
POPULATION FOUNDATION OF INDIA

18.4 Page 174

▲back to top


Urbanization
Proportion
(per cent)
< 10
10 - 20
25 - 50
>=50
Distribution of districts according to the proportion of population
urban, 1991.
Districts
Number
Name
7
Sidhi, Jhabua, Mandla, Seoni, Balaghat,
Raigarh, Bastar
27
Shivpuri, Guna, Tikamgarh, Chhatarpur,
Panna, Damoh, Satna, Rewa, Shajapur,
Dhar, West Nimar, Rajgarh, Sehore,
Raisen, Betul, Narsimhapur, Surguja,
Bilaspur, Rajnandgaon, Raipur, Morena,
Bhind, Datia, Shahdol, Mandsaur,
Vidisha, Chhindwara
8
Sagar, Dewas, East Nimar, Hoshangabad,
Ratlam, Ujjain, Jabalpur, Durg
3
Gwalior, Indore, Bhopal

18.5 Page 175

▲back to top


Population of Madhya Pradesh
Distribution of districts according to the average rate of growth of
urban popu Iaflon, 1981-91
Growth rate
Districts
Number
Name
<3
8
Sagar, Ratlam, Ujjain, West Nimar, East
Nimar, Jabalpur, Balaghat, Narsimhapur
3-5
' 28
Bhind; Gwalior, Datia, Shivpuri, Chhatarpur,
Damoh, Satna, Rewa, Shahdol, Mandsaur,
Sbajapur, Jhabua, Dhar, Indore, Rajgarh,
Vidisha, Bhopal, Betul, Hoshangabad,
Mandla, Chhindwara, Seoni, Bilaspur,
Raigarh, Rajnandgaon, Durg, Raipur, Bastar
5-7
7
Morena, Guna, Tikamgarh, Dewas, Sehore,
Raisen, Surguja
>=7
-2
Panna, Sidhi
POPULATION FOUNDATION OF INDIA

18.6 Page 176

▲back to top


Urban
growth rate
Distribution of districts according to the difference between urban
- and tota1popu 1afIon grow th rate, 1981 91
Difference between urban and total population growth rate
<I
I -2
2-4
>=4
<3
Sagar
Ratlam
Ujjain
W. Nimar
E. Nimar
Jabalpur
Narsimhapur
Balaghat
3-5
Gwalior
Jhabua
Dhar
Indore
Bhopal
Hoshangabad
Mandla
Chhindwara
Datia
Shivpuri
Satna
Rewa
Shahdol
Mandsaur
Shajapur
Vidisha
Bilaspur
Raigarh
Durg
Raipur
Bastar
Bhind
Chhatarpur
Damoh
Rajgarh
Betul
Seoni
Rajnandgaon
5-7
Guna
Morena
Tikamgarh
Raisen
Sehore
Surguja
>=7
Panna
Sidhi

18.7 Page 177

▲back to top


Growth rate
during 1971-
81
<3
36223
36286
>=7
Distribution of districts according to the trend in the urban population
growt h rate, 1971- 91
Trend during 1971-91
Increased
Decreased
Damoh
Mandsaur
Narsimhapur
Ratlam
WNimar
Guna
Dewas
Vidisha
Seoni
Bilaspur
Rajnandgaon
Morena
Panna
Jhabua
Sehore
Surguja
Gwalior
Hoshangabad
Shivpuri
Sagar
Ujjain
Chhindwara
Raigarh
Dhar
Chhatarpur
Rajgarh
..'l Durg
E Nimar
Datia
Jabalpur
Mandla
Shajapur
Balaghat
Raipur
Indore
Satna
Bhopal
Bastar
Sidhi
Bhind
Rewa
Raisen
Tikamgarh
Shahdol
Betul

18.8 Page 178

▲back to top


Extent of
deviation
Comparison of actual and projected urban population growth in the
dOIStonc ts 0 fM adblya Pradesh °
Districts
Number Name
Less than
projected
20
Bhind, Datia, Tikamgarh, Sagar, Satna, Rewa,
Shahdol, Jhabua, Dhar, West Nimar, East
Nimar, Betul, Jabalpur, Mandla, Chhindwara,
Balaghat, Raigarh, Durg, Raipur, Bastar
.
Equal to
projected
20
Gwalior, Shivpuri, Chhatarpur, Damoh,
Mandsaur, Ratlam, Ujjain, Shajapur, Indore,
Rajgarh, Vidisha, Bhopal, Sehore,
Raisen, Hoshangabad, Narsimhapur, Seoni,
Surguja, Bilaspur, Rajnandgaon
Higher than
projected
5
Morena, Guna, Panna, Sidhi,Dewas

18.9 Page 179

▲back to top


18.10 Page 180

▲back to top


Demography and Development in
Madhya Pradesh
Introduction
Madhya Pradesh is one, of those states of the country where both demographic
situation and level of sociai and economic development remains far from satisfactory.
During the decade 1981-91, the average annual population growth rate in the state
had been of the order of2.38 per cent per year. This growth rate was third highest in
the countryt next only to Rajasthan and Haryana. Even" more alarmingly and unlike
Rajasthan and Haryana, the average annual population growth rate in the state has
shown an increasing trend. This pattern of rapid popula~ion growth in the state is
y largJf the result of persistent high fertility and high mortality situation that prevails
in the state. According to the estimates based on the sample registration system,
Madhya Pradesh has the dubious distinction of having highest crude death rate and
. highest infant mortality rate in the country around the year 1996. On the other hand,
the crude birth rate in the state is third highest, next only to Uttar Pradesh and
Rajasthan.
'.
•$
The situation of social and economic progress is also no better in the state. According
to the latest information available, the state ranks twelfth in terms of per capita
income amopgst the ·ftfteen major states of the country. In terms of registered
industries per lakfl,population and in terms of literacy, it ranks eleventh whereas in
terms of proportion of net sown area irrigated, it ranks thirteen (Government of
Madhya Pradesh, 1997). The state is rich in natural resources but this natural wealth

19 Pages 181-190

▲back to top


19.1 Page 181

▲back to top


Populatioll of Madhya Pradesh
has not been utilized for the social and economic progress of the state. Whatever
social and economic progress that has taken place in the state during the 50 years
. period since independence, it has literally been confined to regions surrounding the
traditional growth centers and administrative headquarters. Large tracts of rural areas
of the state are still devoid of even the basic minimum services and facilities in
critical areas of health, education and sanitation. During' rains, a substantial
proportion of the rural areas of the state remain cut-off from the rest of the country
for want of all weather transport and communication facilities. The state has highest
pllOportion of tribal population in the country. The peculiar nature of life style and
living patterns of tribal population adds another dimension to the process of social
and economic development in the state.
Is there any relationship between the poor level of social and economic development
and poor demographic situation in the state? We attempt to explore this relationship
on the basis of district level information on demography and development in the
state. In order to explore this relationship, we first rank the districts according to the
demographic situation and according to the level of development and then attempt
to establish the relationship between the rank of a district in demographic situation
and the rank of a district in terms of social and economic development.
Methodology
Analysis of the relationship between social and economic development and
demographic situation is compounded by the fact that there is no single measure of
social and economic development. Similarly, there is no single index that can
effectively capture the demographic situation. Both social and economic
development and demographic situation are actually multi-dimensional processes and
each dimension of development as well as demographic change has its own specific
determinants.
In view of the multi-dimensional nature of both social and economic development
and demographic situation, a multi-indicator approach has been adopted for capturing
both social and economic progress and demographic situation in a district. The level
of social and economic development in a district has been captured through a set of
fifteen indicators grouped into five dimensions of social and economic development:
1) Population structure and distribution; 2) Status of women; 3) Agriculture; 4)
Industrialization and urbanization; and 5) Social development. The list of indicators
used in the present analysis is given in the appendix.

19.2 Page 182

▲back to top


Demovaphy and Development
On the other hand, demographic situation has been captured through a set of six
indicators, two of which are related to fertility, three to mortality and one to practice
of contraception. The list of demographic indicators used in this analysis is also
given in the appendix.
A ranking approach has been used in this analysis to analyze the association between
the demographic situation and the level of social and economic development.
Essential features of this approach are as under:
1. Each of the 45 districts of the state were first ranked according to specific
indicators of social and economic development and of demographic situation.
2. Ranks obtained by each district were added to obtained the total rank score
of a district in each of the five dimensions of social and economic
development as well as in demographic situation. This total rank score was
divided by the number of indicators in the dimension to obtain average rank
of the district. This average rank score served as the indicator of relative
development of a given district.
3. Rank correlation coefficient was calculated to find out the association
between the average rank of a district in terrils of social and economic
development as well as in terms of its five dimensions and the average rank
of a district in terfns of demographic situation that prevails in the dis~rict.
Data Source
The analysis presented here is built upon two data sources. First data source is related
to the level social and economic development which is maintained by the Department
of Economics and Statistics of Government of Madhya Pradesh for each of the 45
districts ofthe state (Government of Madhya Pradesh, 1996). This data source covers
almost all dimensions of social and economic development.
It may be pointed out here that one ofthe major problem in analyzing the relationship
between social and economic development and demographic situation at the district
level is the paucity of information on demographic situation at the district level. The
civil registration system in the state is too poor to provide any reasonable assessment
. of demographic situation.· The sample registration system, on the other hand,
provides estimates of basic demographic indicators at the state level only. The

19.3 Page 183

▲back to top


Population of Madhya Pradesh
Registrar General of India has estimated demographic indicators for the districts of
the state on the basis of the 1981 and 1991 population censuses (Government of
India, 1987; 1997). Recently, the author has prepared estimates offertility and infant,
child and maternal mortality for the districts of the state on the basis of the
information generated through the Madhya Pradesh Target Couple SurVey
(Chaurasia, 1996). These indicators have been used in the present analysis.
Social and Economic Development And Demographic Situation in
Madhya Pradesh
Table 1 summarizes information on the levels of social and economic development
in Madhya Pradesh and in India as a whole. For each indicator, rank of the state
amongst the 15 major states ofthe country is also given in the table. It may be seen
from the·table that out o'fthirteen indicators for which nationallevel·estimates are
available, Madhya Pradesh ranks in bottom third in eight variables. If the tribal
population is also taken as a deterrent to social and eConomic development than the
number of variables in which the state ranks in bottom third amongst the major states
of the country increases to nine. Poor level of social and economic development in
the state, in comparison to other states of the country is very much clear from the
table.
The demographic scenario of the state is no better than the development scenario.
Rather, it is even worse. The state ranks in bottom third in all the indicators of
demographic situation compiled in table 2 when compared to the demographic
situation in other major states of the country. Mortality levels in the state are highest
in the country as reflected through crude death rate and infant mortality rate. In terms
of fertility also, the state has the third highest crude birth rate and third highest total
fertility rate in the country. The prevailing fertility and mortality situation has
resulted in a low life expectancy for the people ofthe state.
The above brief review of level of social and economic development and
demographic situation in Madhya Pradesh and its comparison with other major states
of the country clearly suggests that Madhya Pradesh may be regarded as one of the
backward states of the country in terms of both demography and development. .
However, because of the vastness and diversity in the society and economy of the
state, any state level analysis of population and development related issues inhibit
strong yet persisting inequalities and disparities that are prevalent within the state.
To understand the dynamics of population and social and economic development in

19.4 Page 184

▲back to top


DemoGraphy and Development
a the state, distiict level analysis of both demographic situation and level of social
and economic development is necessary. This analysis has been presented in the next
section.:111e,district'level data and its-analysis has also been used for analyzing the
relationship"of':·the:inter--districtvariationin the level of soCial and economic
" development'and theinter-distliet variation in demographic situation.:'
Social.and EeoDoIDie Situationaad-Demographic Situation in the Districts of
Madhya>'Pradesb,
,
-
"
,Rank of each the 45 districts of the state in 'respect of specific indicators of social and
economic development, its five dimensions as mentioned above and in respect of six
demographic variables art given in the appendix tables. Average rank of districts in
respect to 15 indicators of social and economic development and in respect to six
indiclttn1l of demographic'situation are giveriiri table 3. Similarly, average rank of
dil;tricfs.inr.espect 0t fivedifuensionsof social and.economic development are given
'st]>dtatetY'iiHable 4. Thetailking is'done'in a descending order meaning that the
district·havmg ·best situationamorlgthe 45 districts is given a rank of one while the
district bavmg the',poorcsfsituanon was 'given a rBnk of 45. In other words, the lower
;.is the"tBrlk·the:poor is the situation in the district in respect to variable or dimension
,·urtder·coIisi<;leration; TwO' or more districts having same level for any specific
variable have been given same rank.
-AIl examination of. -table 3' suggests that the level, of social and economic
, development is relativelY ..pOorest in district Surguja followed by district Sidhi and
district Panna. In Jhabua, Rajgarh, Guna and Bastar districts also, the level of social
and economic development appears to be very poor in relation to.other districts ofthe
state~,OIl the other hand, soeialand ecopornic developmentappears!t~ be relatively .
better in distriet Durg and in Rmpur, M1lIlds~ur,.Bhopal and Indore districts.
,,
.:: --" ;-~, " ,
In the demo8f8p1Uc context, on the other hand, the situation appears',to ,be worst in
. district ChffiltarpUf:Other districtswheredemographic situation is relatively poor are
Sidhi~ Satna;iRBisen:' Shahdol and Tikamgarh. By contrast, in Indore district, the
demographib'$ifuatiort,ppears to be the b~st in relation to aU other districts of the
state~InMaridsatit, Hoshangabad and Raigarh districts also, the pace of demographic
transitioriappears to be relative faster than other districts of the state.
Average rank of each district for each of the five dimensions of socilll and economic
development is pre~ented in table 4. A general observation of the table is that rank

19.5 Page 185

▲back to top


Population of Madhya Pradesh
of the districts vary widely across different dimensions ot social and economic
development. This implies that the process of development in mO$t of the districts
of the state is not same in all the five dimensions of social and economic
dev.elopment as identified above. A district may be ahead in one dimension of
development but has been found to be lagging behind in other dimensions in relation
to other districts ofthe state. It is because ofthis reason that highest average rank in
social and economic development obtained by any district is only 11, in district Durg,
which is substantially lower the theoretically best rank of one. Similarly, the poorest
rank obtained by any district is 31 in district Sidhi which is well above the
theoretically poorest AUlkof 45.
The Spearman's rank order correlation coefficient between the rank of a district in
terms of social and economic development and its rank in the demographic situation
has been estimated to be 0.8024 which is statistically highly significant. This implies
that relative position of a district in terms of social and economic development and
its relative position in terms of demographic situation are closely related. Districts
which are relatively at an advanced stage of social and economic development are
also the districts which are relatively at an advanced stage of demographic transition
and vice versa. Thus, at least in Madhya Pradesh, demographic situatio,n appears to
be.closely related to the level of social and economic development. Moreover, the
correlation coefficient is positive suggesting that improvement in the level oC social
and economic development is expected to result in an .increase in the pace. of
demographic transition.
The rank order correlation coefficient has also been calculated between the average
rank of demographic situation and the five dimensions of social and economic
development. The rank order correlation of demographic situation with the first
dimension of social and economic development namely population structure and
distribution has been found to be 0.7489. Similarly, the rank order correlation
coefficient of demographic situation with the remaining dimensions has been found
t9 be 0.6287, 0.7055, 0.6824 and 0.7023 respectively. All these correlation
coefficients are statistically significant indicating that demographic situation in the
state has strong linkages with all dimensions of social and economic development.
Clearly, social and economic development remains a strong influencing factor behind
demographic situation in the districts of the state.

19.6 Page 186

▲back to top


Demography and Development
It may be ofinterest ~ojdentify those districts where demographic transition is slower
than that predicted by the prevailing levels of socialand economic development. If
the· average rank of a district in respect of demographic si~tion and in respect of
~social and economic development is same, it may be argued that the demographic
situation ~ the' districtJs keeping pace with the prevailisg level of social and
economic development. There are three such. districts in the state iJlwhich the rank
of demogtlJ)hicsituation is same as the rank of social and econOmic development.
These districts "are: Datia, Shahdol and Tikarngarh. On the other hanc:iif rank of a
district in respect of ~osraphic,.ituation is poorer than the rank in respect of social
and economic development the.nit'may be argued that demographic transition is not
keeping pace.·with the ,prevailing level pfsocial and economic development in. the
district. TJble. 3 $uggests that there are four such districts in the state· Chhatarpur,
Raipur, Raisen:8I).dSam..In the remaining distriCts, pace. of demographic transition,
appears to be faster than that dictated by the prevailing levels of ~ial and economic
development.
The above.observations,have important implications for a polioytowards population
contr9fin the state. It .i$clear that in those districts where the pace of demographic
transition is:faster than that dictated by. the prevailing level of social and economic
development, focusing on population control programme, specifically family welfare
programme alone may not be sufficient in hastening the pace of 4emographic
situation further. In these districts, it is important that duo attention is paid in
removing 'inequaliti~ in ,the process of social and economic development in these
districts so that developme.nt becomes more conducive to demographic change. Most
of the districts oftbe State fall inthis.categol)'.
On the other band in those few districts, where demographic $ituation,is Iaggin~
behind' the ..prevailing' level of social and economic developmeni,a thorough
introspection and analysis of the administrative .capacity and or.ganizational
efficiency ofth~ health and f~ily welfare servicesdelivCl)' organization is the need
of the time. There 'i~ e~ery probability that by improving the management of health
and family we1fip'eprogrammes in these districts, the pace of demographictrmsitioll
can be increased at least up to the leve~ which is commensurate with the prevailing
level of social and economic development.
A similar exercise has also been earned out separately for each of the five
dimensions of social and economic development. Names of the districts where the

19.7 Page 187

▲back to top


pace of demographic transition is slower than that dictated by a particular dimension
of social and economic development are compiled in table 5 separately for each of
the five dimensions of social and economic development. In case of dimensions one·
and two.- the dimerision of population distribution and structure and the dimension
of. status of women, there are eight such districts. In case of the dimension of
agriculture, in eleven. districts, the pace of demographic transition has been found to
be slower than that dictated by the level agriculture development. Similarly, in case
. of dimension three -the dimension of industrialization and urbanization and related
modernization - there are fifteen such districts. Finally, in case of dimension five -
the dimension of social development, in two districts, the pace of demographic
situation has not been found to be keeping pace with the level of development.
'very interestingly, in 28 of the 4S distIl()ts of the state, the demographic transition
is lagging behind the prevailing .levels of development in at least one or more
dimensions of social and economic development. Names of these districts according
to the number of dimensions in respect of which, demographic transition is lagging
behind the expected are given, in table 6. In district Stttna, the demographic situation
appears to be lagging.behind the.expected in four of the five dimensions of social and
economic development. Even in case of the fifth dimension, the demographic
transition iS,at best, equal to, not faster than the expected.
In addition t08atna, in three districts - Chhatarpw, Datia and Shahdol, the
demographic situation has b~n found to be lagging behind the expected in respect
of three of the :five' dimensions. On the other hand _n' 8 more districts, the
demographic situation appears to be laggingbehincf the expected in respect of two
dimensions. These districts are Bhopal, Dur$, Gwalior, Iabalpur, Jhabua, Raipur,
Raisen and Tikamgarh. Five of these eight districts are, having relatively higher
rarikings, in the dime~~· of industrialization," urbanization', and related
modernization indicating the'industrial· development' and related urbanization and
moderi1ization has contribut~ little towards demographic situation in these distrigs.
Finally, there are 16·districtsin the state in which demographic situation appears to
be lagging behind the' expected in only one of the five dimensions !ofsocial and
economic development and in most of these districts, the dimension concerned is the .
dimension of industrialization and related urbanization and modernization.

19.8 Page 188

▲back to top


DemoFaphy and Development
".~oDclusloDI
.
!JsJ'A"l ~,'
~..
. The present.analysis provides suffi~ien~e.J1lp~~e
ttu'18&"St that social and
economic development in the districts of the state is, at best, lep !sided. It lacks
comprehensiveness and completeness .. A district may be fairly advanced ill one
dimension of social and economic deyelopment but may, be laggingtBbilUl in otbtr
dimension(~).~~ause Qf this lopsidedness 0( 1M\\process:ofsoclal and economic
,developm.ent,.it~.not, b~ena~ U>have, telli~act
on demo&fappioftansition.
In majority of the districts ofthe state, demogrNWQM'anSitionlappears to be lagging
behind the expected in one or more dimensions of social and economic development.
To be effective, it appears necessary that there is little inequality in the process of
development in different· dimensions of economy and society. This means that all
dimensions of social and economic development should be paid equal attention.
As regards population control, the analysis highlights the role of social and economic
development as far as the state of Madhya Pradesh is concerned. In order to make
population control efforts effective in reducing fertility levels and hence bringing
down population growth rate, due considerations to the process of social and
economic development appears to be necessary. Already, performance in terms of
demographic situation in Inost of the districts of the state is far better than that
dictated by the prevailing levels of social and economic development. In such a
situation, mere focusing upon promotion of contraception, unfortunately, may not be
sufficient enough to address population related issues as far as Madhya Pradesh is
concerned.
1. ChaurasiaAR (1996) Madhya Pradesh Targel Couple Survey 1996: Fertility,
Child and Maternal Mortality, Family Planning. Bhopal, Government of
Madhya Pradesh, Rajiv Gandhi Mission for Elimination ofIodine deficiency •..
Disorders.
3. Government of Madhya Pradesh (1996a) Inter-state Indicators of Social and
Economic Development. Bhopal, Directorate of Economics and Statistics.
POPULATION FOUNDATION,OF INDIA

19.9 Page 189

▲back to top


Government of Madhya Pradesh (1996b) District Level Indicators of Social
and Economic Development. Bhopal, Directorate of Economics and
Statistics.
Government of Madhya Pradesh and International Institute for Population
Sciences (1995) National Family Health Survey Madhya Pradesh 1992.
Bhopal, Department of Economics and Statistics and Bombay, International
Institute for Population Sciences.

19.10 Page 190

▲back to top


Demography and pevelopment
Development Scenario in Madhya Pradesh as Compared to India
Dimension and variables
India
I
Population Structure and Distribution
Population density, 1991
273
(Persons per SQ. kIn.)
Proportion of Scheduled Caste
population, 1991
(Per cent)
16.48
Proportion of Scheduled Tribe
8.08
Population, 1991
(Per cent)
II
Status of Women
Sex ratio, 1991
927
(Females per 1000 males)
Labour force sex ratio, 1991
NA
(Females. per 1000 males)
Female literacy rate, 1991
(Per cent)
39.19
III AJUiculture
Per capita net sown area, 1989-90
1.26
(Hector)
Per capita net sown area irrigated,
33.1
1989-90
(Per cent)
Value of agriculture produce at
NA
current prices, 1992-93
(Rupees)
MP
Level
Rank
149
14
14.55
n
23.27"
1
931
7
529
NA
28.85
12
1.49
8
18.9
,
5708
13
NA "

20 Pages 191-200

▲back to top


20.1 Page 191

▲back to top


Dimension and variables
India
..
IV Industrialization and Urbanization
·MP
Level
Rank
Proportion of urban population,
1991
(Per cent)
26
23
12
Industries per lakh population, 1990
2444
1452
11
Per capita electricity consumption,
254
254
8
1992-93
(kWh} .
V Social Development
Popuhltion below poverty line,
1987-88
(Per cent)
29.9
36.7
13
.
Work participation rate, 1991
(Per cent)
37.5
42.82
4
Literacy rate, 1991
(Per cent)
52.21
44.2
11

20.2 Page 192

▲back to top


a e ..
emOimlDJ c 1m. onm
Demography and Development
lva ra es as Ol'l1Dar 0 la
Indicator
India
MP
Total fertility rate. 1990-92
Level
Rank
3.39
. 3.90
13
General fertility rate. 1990-92
123
146
Crude death rate, 1995
9.0
11.1
15
Infant mortality rate. 1995
74
99
14
Under five mortality rate.
1990-92
109
130
13
Maternal mortality rate. 1995
NA
828
NA
Contraceptives prevalence rate,
1990-92
40.6
36.S
n
. Source: Government of India (1996)
Intemationallnstitute for Population Sciences (1995)
Chaurasia (1996)

20.3 Page 193

▲back to top


Population ofMadhm Prgdesh'
Development and DemoJU"aphic Situation
District
Average rank in the
demographic
situation
Average rank in the
.social and economic
development
Balaghat
10'
16
Bastar
16
26
Betul
15
20
Bhind
,
12
20
Bhopal
12
14
BilasPtir
9
20
Chhatarour
30
25
Chhindwara
,.,
15
:
17
Damoh
11
23
Datia
22
2J,
Dewas
11
19
Dhar
18
20
Durg
9
11
E Nirnar
17
17
Guna
22
27
Gwalior
14
16
Hoshangabad
8
18
Indore
1
15
Jabalpur
19
20
Jhabua
23
28
Mandla
14
25

20.4 Page 194

▲back to top


District
Mandsaur
Morena
Narsimhapur
Panna
Raigarh
Raiour
Raisen
Raigarh
Rajnandgaon
Ratlam
Rewa
Sagar
Satna
Sehore
Seoni
Shahdol
Shaiaour
Shivpuri
Sidhi
Surguia
Tikamgarh
Uiiain
'.
"
Demograehland Development
n" ~"
.••.."..,
',-,
"c
c,
,
Average rank'in the Average rank in the
demographic
social and economic
situation
development
'.
.,
5
13
I",
~. ' ,.",
?
'13 " '
15'"
-,
"
23
'·18
16
31
7
23
13
12
26
24
9
26
12
.,
21
14
16
17
24
22 j
23
26
21
18
21
13
24
2S
2S
8
21
21
27
29
31
12
32
25
25
10
16

20.5 Page 195

▲back to top


Population 01Madhya Pradesh
District
Vidisha
WNimar
Average rank in the
demographic
situation
Average rank in the
social and economic
develooment
.
21
. . 25
15
21

20.6 Page 196

▲back to top


Demography and Development
Ranking of Districts According to Different Dimensions of Social and
Beonomic. Deve 1opment
District
Dimensions of Social And Economic Development
I
II
III
IV
V
Balaghat
19
5
15
29
14
Bastar
28
19
29
35
19
Betul
26
9
27
22
16
Bhind
15
35
16
14
19
Bhopal
.9
24
17
6
16
Bilaspur
24
12
22
21
22
ChhataIJ)ur
24
35
17
26
23
Chhindwara
24
15
17
15
15
Damoh
27
24
25
22
17
Datia
19
36
8
18
28
Dewas
26
22
19
8
22
Dhar
20
18
17
14
29
Dun~
13
6
18
6
12
E Nimar
23
15
16
9
20
Guna
25
38
23
23
28
Gwalior
16
30
11
8
17
Hoshangabad
25
24
7
11
21
Indore
Jabalour
13
22
12
4
21
17
19
27
9
:26
Jhabua
20
22
31
31
35
Mandla
26
13
33
36
19

20.7 Page 197

▲back to top


Population of Madhya Pradesh
District
Mandsaur
Morena
Narsimhapur
Panna
Raigarh
Raipur
Raisen
Rajgarh
Rajnandgaon
Ratlam
Rewa
Sagar
Satna
Sehore
Seoni
Shahdol
Shaiapur
Shivpuri
Sidhi
Surguja
Tikamgarh
Uiiain
Dimensions of Social And Economic Development
I
II
III
IV
V
17
15
12
9
13
22
39
8
19
27
21
19
6
18
25
32
33
27
34
25
25
16
25
30
19
20
8
10
12
10
27
31
l~
16
30
17
30
24
25
32.
22
7
30
28
18
19
16
15
9
22
16
20
29
23
30
23
24
24
15·
27
0
20
21
26
14
22
.
.
26
28
12
21
19
..
26
11
26
33
23
24
25
34
19
23
20
27
13
17
30
27
39
14
29
28
24
30
34
33
33
27
29
34
33
36
21
34
10
30
31
18
19
13
6
23

20.8 Page 198

▲back to top


District
Vidisha
WNimar
Dimensions of Social And Economic Development
I
II
III
IV
V
23
32
19
24
26
22
18
22
21
24

20.9 Page 199

▲back to top


ae
IstrtCtsw ere emo21'apt c ltuatlon a~s e n e xpec e
Dimension of social
and economic
development
Number .Name
Districts
I: Population
structure and
distribution
8 Bhopal, Chhatarpur, Datia, Jabalpur,
Jhabua, Satna, Shahdol, Tikamgarh
II: Status of
women
8 Balaghat, Betul, Durg, Jhabua, Mandla,
Raipur, Satna, Seoni
III: Agriculture
11 Chhatarpur, Datia, Gwalior, Hoshangabad,
Morena, Narsimhapur, Raipur, Sehore,
Shivpuri, Tikamgarh, Vidisha
IV: Industrializati
on and
urbanization
15 Bhopal, Chhatarpur, Datia, Dewas, Dhar,
Durg, E Nimar, Gwalior, Jabalpur, Raisen,
Ratlam, Sa~ar,'Satna, Shahdol, Ujjain
V: Social
development
2
Satna, Shahdol

20.10 Page 200

▲back to top


Demography and Development
Number of
dimensions
Districts by Number of Dimensions in which Demographic.
Laas bheidtnhE e xpeete d
Districts
Situation
f
Number Name
4
1
Satna
,.
3
3
Chhatarpui, Datia, Shahdol
2
7
Bhopal, Durg, Gwalior, Jabalpur, Jhabua, Raipur,
Raisen, Tikamgarh
1
17
Balaghat, Betul, Dewas, Dhar, E Nimar,
Hoshangabad, Mandla, Morena, Narsimhapur,
Ratlam, Sagar, Sehore, Seoni, Shivptlri, Ujjain,
Vidisha

21 Pages 201-210

▲back to top


21.1 Page 201

▲back to top


Appendix Table 1: Indicators of Social and Economic Development in Districts
0fM adhlya Pradesh
District
Population
Density
Proportion of
Scheduled Castes
Population
Proportion of
Scheduled Tribe
Population
Balaghat
Level
148
Rank
20
Level
8.30
Rank
7
Level
..
21.92
Rank
29
Bastar
58
37
5.85
4
67.38
44
Betul
Bhind
118
30
10.80
11
37.54
37
".
272
4
21.42
40
0.27
1
Bhopal
487
1
13.81
19
3.05
6
Bilaspur
191
11
18.10
30
23.01
30
Chhatarpur
133
22
23.68
43
3.75
8
Chhindwara
132
23
12.24
15
34.59
35
Damoh
123
29
20.09
34
12.38
18
Datia
195
10
24.59
45
1.70
2
Dewas
147
21
18.18
31
15.06
25
Dhar
168
14
6.94
5
53.51
41
Dur2
281
3
12.75
16
12.43
19
ENimar
133
22
11.39
14
26.75
33
Guna
118
30
18.09
29
12.02
17
Gwalior
271
5
20.41
37
2.90
5
Hoshan2abad 126
27
16.30
23
17.38
26
Indore
470
2
16.70
26
5.51
12
Jabalpur
260
6
12.85
17
17.94
27
Jhabua
167
15
3.07
1
85.75
45

21.2 Page 202

▲back to top


District
Mandla
Mandsaur
Morena
Narsimhapur
Panna
Rai2arh
Raipur
Raisen
Rai2arh
Rajnandgaon
Ratlam
Rewa
Sa2ar
Satna
Sehore
Seoni
Shahdol
Shajapur
Shivpuri
Sidhi
Sure:uia
Population
Density
Level
97
159
147
153
96·
133
184
104
161
129
200
246
161
195
128
114
124
167
110
130
93
Rank
34
17
21
18
35
22
13
33
16
25
9
7
16
10
26
31
28
15
32
24
36
Proportion of
Scheduled Castes
Population
Level Rank
5.23
2
15.86
22
19.92
33
16.61
25
20.50
38
11.36
12
14.44
20
16.54
24
18.01
28
10.28
9
13.73
18
14.83
21
21.11
39
17.88
27
20.32
36
10.78
10
7.70
6
22.36.
41
19.38
32
11.38
13
5.51
3
Proportion of '
Scheduled Tribe
Population
Level Rank
60.84
43
4.80
11
5.58
13
12.92
21
14.97
24
47.64
40
18.30
28
14.39
23
3.30
7
25.17
32
23.28
31
12.46
20
8.47
14
13.84
22
10.19
15
36.99
36
46.34
39
2.37
4
11.29
16
30.47
34
53.65
42

21.3 Page 203

▲back to top


District
Tikamgarh
Ujjain
Vidisha
WNimar
Population
Density
Level
Rank
186
12
228
8
132
23
151
19
Proportion of
Scheduled Castes
PODulation
Level
Rank
22.76 42
24.50 44
20.29 35
9.77
8
Proportion of
Scheduled Tribe
PODulation
Level
Rank
4.13
9
2.10
3
4.40
10
46.28
38

21.4 Page 204

▲back to top


Demography and Development
Appendix Table 1: (Contd.)Indicators of Social and Economic Development in
D"lStrictS0fM adblya Pradesh
District
Sex Ratio
'Labour Force Sex
Ratio
Female Literacy
Rate
Level Rank Level Rank Level
Rank
Balagbat
1003
2
612
5
38.95
7
Bastar
1002
3
529
10
15.3
43
Betul
967
11
575
7- 33.9
10
Bhind
822
42
39
45
28.2
19
Bhopal
891
31
194
40 54.17
1
Bilaspur
978
7
580
6
27.26
23
Chhatarpur
854
37
255
36 21.32
32
Chhindwara
948
16
418
17 32.52
12
Damoh
906
28
318
28 30.46
16
Datia
853
38
168
41 23.69
28
Dewas
923
22
400
19 25.57
26
Dhar
952
13
545
8
20.71
34
Durg
970
10
659
3
42.78
4
E Nimar
941
18
469
13 31.53
13
Guna
876
34
164
42
17.99
39
Gwalior
831
40
113
44- 41.72
5
Hoshangabad 899
29
270
33 37.63
9
Indore
908
27
247
38 53.35
2
Jabalpur
916
25
313
29 45.02
3
Jhabua
977
8
450
14
11.52
45

21.5 Page 205

▲back to top


District
Mandla
Mandsaur
Morena
. Narsimhaour
Panna
Rai~arh
Raipur
Raisen
Rajgarh
Rainand~aon
Ratlam
Rewa
Sa~ar
Satna
Sehore
Seoni
Shahdol
Shajapur
Shivpuri
Sidhi
Surguja
Tikam2arh
Sex Ratio
Level Rank
988
6
944
17
828
41
913
26
898
30
998
4
994
5
883
32
924
21
1012
1
949
15
936
19
881
33
920
23
898
30
974
9
941
18
919
24
849
39
923
22
955
12
871
36
Labour Force Sex
Ratio
Level Rank
690
2
516
11
120
43
330
26
280
32
398
20
656
4
258
35
324
27
846
1
442
15
435
16
309
30
406
18
381
22
530
9
380
23
388
21
251
37
372
24
262
34
302
31
Female Literacy
Rate
Level
Rank
22.24
30
28.32
18
20.81
33
41.59
6
19.41
38
26.46
25
31.04
]5
25.47
27
15.62
42
27.83
20
29.13
17
26.88
24
37.78
8
27.8
22
21.99
31
31.14
14
20.09
35
19.77
37
15.64 .~.r.. _T..·.~4_~.1.~....·.,_.,.,_ ._.'i,
13.61
17.4
,
."'__
I
•.H;...••••..•••':"·.·~o·,·,•'•. ,";
40 I
19.96 36

21.6 Page 206

▲back to top


District
Uiiain
Vidisha
WNimar
Demography a~d Development
Sex Ratio
Level Rank
932
20
872 35
951
14
Labour Force Sex
Ratio
Level Rank
353
25
211
39
510
12
Female Literacy
Rate
Level
Rank
32.74
11
27.81
21
23.23 29

21.7 Page 207

▲back to top


Population o( Madhya Pradesh·
Appendix Table 1: (Contd.)Indicators of Social and Economic Development in
D"lstncts 0fM adhl}a Praeds h
District
Per Capita Net
Sown Area
Proportion of Net
Sown Area
IrriJ,~ated
Value of
Agricultural
Produce
Level
Rank Level Rank Level Rank
Balaghat
0.19
22
43.86
7
6111
17
Bastar
0.36
7
2.92
45
4704
36
Betul
0.32
11
20.62
31
4606
38
Bhind
Bhopal
0.26
16
33.52
18
6544
13
0.1
26
35.32
14
6551
12
Bilaspur
0.2
21
29.31
22
5727
23
Chhatal'pur
0.29
14
37.08
10
5391
28
Chhindwara
0.29
14
18.21
34
8005
2
Damoh
0.3
13
20.68
30
4971
32
Datia
0.31
12
40.68
8
7346
5
Dewas
Dhar
0.33
10
30.78
21
5433
26
0.34
9
31.78
20
5824
21
Durg
0.21
20
36.8
11
5788
22
E Nimar
Guna
0.29
14
22.7
27
7238
7
0.44
3
17.67
35
5104
30
Gwalior
0.18
Hoshan~abad
0.34
23
45.86
6
7984
3
9
66.26
1
6642
11
Indore
0.13
25
49.61
4
7108
8
Jabalpur
0.17
24
18.28
33
5508
25
Jhabua
0.28
15
16.95
37
4539
40

21.8 Page 208

▲back to top


District
Mandla
Mandsaur
Morena
Narsimhapur
Panna
Rai~arh
Raipur
Raisen
Rajgarh
Rajnandgaon
Ratlam
Rewa
Sa~ar
Satna
Sehore
Seoni
Shahdol
Shajapur
Shivpuri
Sidhi
Sureuia
Per Capita Net
Sown Area
Level
Rank
0.32
11
0.33
10
0.23
18
0.35
8
0.32
11
0.3
13
0.22
19
0.45
2
0.38
6
0.32
11
0.31
12
0.22
19
0.3
13
0.23
18
0.41
4
0.35
8
0.25
17
0.39
5
0.33
10
0.25
17
0.26
16
Proportion oCNet .
Sown Area
Irri~ated
Value of
Agricultural
Produce
Level Rank Level Rank
3.45 44 3003 45
34.5
16 6918
9
59.14
J
1923
4
39.09 9
8219
1
15.96 38 4958 33
7.13 41 5829 20
46.05
5
7324
G
28.14 23 5669 24
27.6 25- 4237 41
15.11 39 4580 39
32.02 19 6294 15
20.42 32 4672 37
21.92 28 5094 31
23.03 26 4786 34
36.64 12 6027 19
17.19 36 4742 35
6.78 42 3554 43
35.1
15 6045 18
34.3 17 6326 14
11.3 40 3130 44
4.4
43 4123 42

21.9 Page 209

▲back to top


District
Tikam~arh
Ujjain
Vidisha
WNimar
-
Per Capita Net
Sown Area
Level
0.25
0.32
0.51
0.3
Rank
17
11
1
13
Proportion of Net
Sown Area
Irrigated
Level Rank
59.44
2
35.76
13
20.88
29
28.01
24
Value of
r,
Agricultural
Produce
Level Rank
6908
10
6130
16
5409
27
5382
29

21.10 Page 210

▲back to top


Demography and Development
Appendix Table 1: (Contd.)Indicators..ofSoclal and Economic Development in
D'ISt'nc ts 0 fMdah lya Pradesh
District
Proportion of
Urban Population
Industries per
OneLakh
Population
Per Capita
Electricity
Consumption
Level Rank Level Rank Level
Rank
Balagbat
952
40
15
12
121
36
Bastar
7.13 44
5
21
76
41
Betul
18.71 ·23
6
20
200
23
Bhind
20.67 16
16
11
293
14
Bhopal
80.10 1
26
5
320.
11
Bilaspur
17.08 27
12
15
229
20
Chhatarour
19.28 22.
5
21
122·
35 ..
Chhindwara
23.18
12
16
11
222.
21
Damoh
18.15 24.
6
20
201
··22.
Datia
.22.63 14
12
15
180
26
Dewas
25.86 .11
19
8
526·
4
Dhar
13.14 36
28
4
551
2
Dun~
35.37
16
11
623
1
ENimar
27.51 9
17
10'- 334
9
Guna
19.51 21
6
20
173
28
Gwalior
58.94 3
32
3
261
18
Hoshangabad 27.44
10
15
12
111
12
Indore
69.32 2
64
1
481
8
Jabalpur
45.53 4
34
2
222
21
Jhabua
8.65 42
6
20
152
30

22 Pages 211-220

▲back to top


22.1 Page 211

▲back to top


Population of Madhya Pradesh
District
Mandla .
Mandsaur
Morena
Narsimhapur
Panna
Raigarh
Raipur
Raisen
Rajgarh
Rainandgaon
Ratlam
Rewa
Sagar
Satna
.,
Sehore
Seoni
Shahdol
Shaiapur
Shivpuri
Sidhi
Suri!uia
Proportion of
-
.
Urban Population
Industries per
One Lakh
Population
Level
Rank Level Rank
7.67 . 43
5
21
23.08 13
20
7
20.54 17
9
17
14.88 35
14
13
13.07 37
2
24
9.59 39
7
19
19.75 20
32
3
15.88 30
13
14
16.81 29
10
16
15.75 31
14
13
31.88 7
16
11
15.27 32
7
19
.
29.22 8
17
10
19.75 19
18
9
·18.00 25
6
20
9.46 41
8
18
,
21.12 15
8
18
17.70 26
13
14
15.20 33
4
22
6.47 45
2
24
12.04 38
3
23
Per Capita
Electricity
Consumption
Level
Rank
41
43
496
7
185
24
521
5
42
42
126
33
294
13
548
3
149
31
107
39
.332
10
265
17
178
27
289
15
236
19
100
40
181
25
320
11
135
32
165
29
118
37

22.2 Page 212

▲back to top


District
Tikam~arh
Ujjain
Vidisha
WNimar
Proportion of
Urban Population
.Level
16.90
39.74
20.08
15.06
Rank
28
5
18
34
-
Industries per
OneLakh
Population
Level Rank
3
23
21
6
5
21
13
14
Per Capita
Electricity
Consumption
Level
Rank
108
38
518
6
125
34
277
16

22.3 Page 213

▲back to top


Population of Madhya Pradesh
District
Balaghat
Bastar
Betul
Bhind
Bhopal
Bilaspur
Chhatarpur
Chhindwara
Damoh
Datia
Dewas
Dhar
Durg
E Nimar
Guna
Gwalior
Hoshangabad
Indore
Jabalpur
Jhabua
(Concld.)Indicators of Social and Economic Development in
D"lstncts 0fM adh va Pradesh
Population below
Poverty Line
Work
Participation Rate
Total Literacy
Rate
Level
Rank
Level
Rank Level Rank
65.54
30
43.10
5
53.23
8
47.16
9
43.99
3
24.89
44
63.31
27
42.02
7
45.99
15
33.44
2
26.47
45
49.23
10
41.35
4
30,16
42
64.27
2
76.02
37
40.68
11 45.26
17
32.18
1
34.33
33
35.2
34
46.47
7
37.56
19
44.9
18
48.81
10
35.83
28 46.27
14
56.76
17
31.27
41 43.57
26
58.39
21
36.71
21 44.08
24
79.12
39
41.33
10 34.54
38
62.54
25
42.34
6
58.7
4
66.54
31
39.67
14 45.49
16
45.32
6
31.57
40
34.58
37
39.71
3
28.52
44
57.7
5
56.84
61.28
18
33.65
36
52.54
9-
24
33.18
38
66.32 , 1
79.33
40
33.82
35
59.11
3
87.6
44
39.34
16
19.01
45

22.4 Page 214

▲back to top


District
Mandla
Mandsaur
Morena
Narsimhapur
Panna
Raigarh
Raipur
Raisen
RaiRarh
RainandRaon
Ratlam
Rewa
Sagar"
Satna
Sehore
Seoni
Shahdol
Shaiapur
Shivpuri
Sidhi
Surguja
Tikaulllarh
Population below
Poverty Line
Level
Rank
59.53
22
57.51
19
49.54
11
99.26
45
46.55
8
55.56
15
49.61
12
60.79
23
68.26
35
67.11
32
64.06
29
67.77
34
81.45
42
57.72
20
43.07
5
81.07
41
56.03
16
81..69
43
52.93-
14
67.67
33
77.36
38
63.97
28
Work
Participation Rate
Level Rank
46.52
2
41.91
8
28.93
43
36.13
25
35.47
29
39.60
15
43.92
4
33.56
37
37.07
20
49.51
1
39.73
13
33.87
34
34.54
32
36.04
26
36.40
22
41.45
9
37.62
la
38.36
17
35.25
30
36.14
24
35.93
27
35.10
31
Total Literacy
Rate
Level Rank
37.29
32
48.67
12
41.33
27
55.65
6
33.68
39
41.22
28
48.08
13
40.76
29
31.81
41
44.39
21
44.15
23
44.38
22
53.44
7
44.65
19
40.43
30
44.49
20
34.78
36
39.2
31
33.03
40
29.15
43
30.09
42
34.78
35

22.5 Page 215

▲back to top


Population of Madhya Pradesh
District
Ujjain
Vidisha
WNimar
Population below-
Povertv Line
Level
Rank
73.62
36
50.95
13
63.04
26
Work
Particioation Rate
Level R8nk
36.22
23
33.07
39
40.01
12
Total Literacy
Rate
Level Rank
49.06
11
44.08
25
35.95
33

22.6 Page 216

▲back to top


Demography and Development
Indicators of Demographic Situation in Districts of Madhya
Pradesh
District
Total Fertility Rate General Fertility
Rate
Infant Mortality
Rate
Level
Rank Level Rank
Level
Rank
Balaghat
2.9
3
107
4
67
4
Bastar
3.2
5
112
6
98
24
Betul
4.1
13
139
27
79
11
Bhind
3.7
10
131
21
69
5
Bhopal
4.2
14
137
25
73
8
Bilaspur
2.8
2
Chhatarpur
4.4 - 16
Chhindwara . 4.1
13
Damoh
3.3
6
97
2
152
32
143
29
112- 6
70
6
125
32
71
7
78
10
Datia
4.7
17
166
33
103
25
Dewas
Dhar
. 3.7
10
128
18
70
6
3.9
12
138
26
83
14
Durg
3.6
9
124
15
70
6
ENimar
Guna
Gwalior
3.7
10
127
17
87
17
3.4
7
121
13
98
24
3.5
8
130
20
89
19
Hoshangabad
3.6
9
115
8
67
4
Indore
2.6
1
93
1
50
1
Jabalpur
3.7
10
125
16
96
23
Jhabua
3.7
10
127
17
118
29

22.7 Page 217

▲back to top


Population of Madhya Pradesh
District
Mandla
Mandsaur
Morena
Narsimhapur
Panna
Raigarh
Raipur
Raisen
Rajgarh
Rajnandgaon
Ratlam
Rewa
Sagar
Satna
Sehore
Seoni
Shahdol
Shajapur
Shivpuri
Sidhi
Surguja
Tikaml!arh
Total Fertility Rate-
Level
Rank
3.2
5
3.2
5
4.2
14
3.5
8
3.2
5
2.8
2
3.4
7
4.1
13
3.1
4
3.3
6
3.1
4
3.2
5
3.9
12
4.2
14
3.9
12
3.9
12
3.8
11
3.7
10
4.1
13
4.3
15
3.2
5
3.7
10
General Fertility
Rate
Level Rank
116
9
114
7
142
28
123
14
118
11
102
3
119
12
144
30
107
4
119
12
108
5
117
10
134
23
.
138
26
135
24
137
25
133
22
129
19
143
29
151
31
114
7
134
23
t Infant Mortality
Rate
Level Rank
90
20
50
1
66
3
88
18
82
13
77
9
84
15
104
26
71
7
87
17
94
22
83
14
92
21
105
27
82
13
77
9
107
28
56
2
85
16
123
31
77
9
120
30

22.8 Page 218

▲back to top


District
Uiiain
Vidisha
WNimar
Demography and Development
Total Fertility Rate
Level
3.2
3.9
3.9
Rank
5
12
12
General Fertility
Rate
Level Rank
108
5
131
21
137
25
Infant Mortality
Rate
Level
Rank
92
21
94
22
80
12

22.9 Page 219

▲back to top


Population of Madhya Pradesh
District
Balaghat
Bastar
Betul
Bhind
Bhopal
Bilaspur
Chhatarpur
Chhindwara
Damoh
Datia
Dewas
Dhar
Durg
E Nimar
Guna
Gwalior
Hoshangabad
Indore
Jabalpur
Jhabua
(Concld.)Indicators of Demographic Situation in Districts of
Mdah lya Prdah es
-
Un~er 5 Mortality
Rate
Maternal
Mortality Rate
Couple rrotection
Rate
Level Rank
Level
Rank
Level
Rank
94
5
925
32
51
14
148
28
832
20
52·
13
115
13
836
21
58
7
97
6
785
11
42
21
105
9
508
2
52
13
99
7
826
18
42
21
219
36
1172
44
40
22
100
8
910
31
62
3
112
12
856
24
57
8
158
29
844
23
59
6
99
7
801
13
56
9
122
16
873
27
53 12
99
7
738
9
128
19
940
34
:
148
28
1130
43
60
5
61
4
. 49
16
132
22
672
-7
60
5
94
5
750
10
55
10
69
2
292
1
84
1
145
27
889
28
55
10
186
33
898
30
43
20

22.10 Page 220

▲back to top


; District
.
Mandla
Mandsaur
Morena
Narsimhapur
Panna
Raigarh
Raipur
Raisen
Rajgarh
Rajnandgaon
Ratlam
Rewa
Sagar
Satna
Sehore
Seom
Shahdol
Shaiapur
Under 5 Mortality
Rate
Level Rank
136
23
66
1
92
4
130.
21
119
15
111
11
125
18
160
30
100
8
.
129
20
141
26
122
16
137
24
161
31
119
15
110
10
165
32
76
3
Maternal
MortalityRate
Level Rank
829
19
669
6
787
12
895
29
1052
38
655
5
808
15
1112
42
811
16
700
8
839
22
1007
36
1086
40
1032
37
930
33
821
17
988
35
607
4
Couple Protection
Rate
Level Rank
58
7
58
7
48
17
65
2
50
15
56
9
55
10
48
17
49
16
54
11
60
5
46
18
52
13
43
20
56
9
62
3
45
19
57
8

23 Pages 221-230

▲back to top


23.1 Page 221

▲back to top


Population of Madhya Pradesh
District
Ujjain
Vidisha
WNimar
Under 5 Mortality·
Rate
Level Rank
136
23
140
25
117
14
Mat~mal
Mortality Rate
Level Rank
603
3
867
26
806
14
Couple Prot~ction
Rate
Level Rank
61
4
40
22
53
12