JRD Tata Award 1997

JRD Tata Award 1997


1 Pages 1-10

▲back to top


1.1 Page 1

▲back to top


1.2 Page 2

▲back to top


The Man and
fruits of development were not rendered inconse-
quential by the sheer magnitude of numbers. He
believed strongly in promoting human welfare
through family planning.
His Vision
Jehangir Ratanji Dadabhai Tata will be regarded
as one of the stalwarts among Indians in the 20th
century, who stamped his personality on the
country's affairs both before and after inde-
pendence.
He was infused with dynamism in whatever he
did in life and these were many and varied. A
dashing pioneer aviator, captain of the biggest
industrial house in India, philanthropist, pace setter
in scientific and technological activities, patron of
arts and crafts and a patriot eager to se'ethe country
strong and prosperous, JRD Tata became a legend
in his lifetime. In his last named role, JRD's most
magnificent obsession was firm arid planned
regulation ofIndia's rising population so that the
India was the first country to adopt an official
family planning programme in 1951 as part of its
first Five- Year Plan after independence. Yet, the
leaders were uncertain both about the nature and
magnitude of the issue and the policy of the pro-
gramme. JRD Tata had a clear foresight in this
respect. The young, dynamic visionary who was
leading the house of Tatas lost no time to put his
ideas into practice. It was at his personal initiative
that a component of family planning was included
in the health cover ofthe Tata steel factory, TISCO,
.at Jamshedpur in 1950. Within a year, as Chairman
of the Company, he was seen addressing the
shareholders drawing their attention to the
population problem and urging them to seek a
solution. He pointedly said "I am aware how
closely this population problem is bound up with
the traditional concepts of a people with so ancient
a civilisation as ours, but I am not one of those
who believe that nothing effective can be done. In
fact, the problem is capable of being tackled in a
number of ways once its magnitude and urgency
are recognised." He proposed that a high power
Population Commission should be set up by the

1.3 Page 3

▲back to top


Government of India involving scientists,
economists and sociologists. No other industrialist
in the world, at that time, could even think in those
terms, let alone suggesting a plan of action.
in this direction. It was re-christened the Population
Foundation of India in 1993 to reflect the wider
dimensions of the population issue in a changing
world.
JRD Tata's zeal and determination only grew
with years. Along with some who shared his
concern, he set up in 1970 the Family Planning
Foundation as an independent" non-government
organisation to complement and strengthen official
efforts and to promote non-governmental efforts
For his many splendoured achievements, India
conferred on him "Bharat Ratna", the highest
civilian award of the nation, in 1992. The same
year United Nations conferred on him its presti-
gious Population Award for his unique life long
services for the cause of population stabilisation.
IT]
Population Foundation oflndia

1.4 Page 4

▲back to top


The
Foundation
The Population Foundation of India (formerly
known as Family Planning Foundation) was
established in 1970 by a dedicated group of
industrialists and population activists led by Bharat
Ratna the late Mr JRD Tata who guided it as the
founder Chairman until his death in 1993. The
Foundation has been in the forefront of non-
governmental effortsto check the runaway growth
.of population of the country and establish a balance
between resource, environment apd population.
The founding fathers believed that a movement
of social development such as family planning
should not and cannot remain the sole concern of
the Government and it ought to .be supported and
supplemented by private voluntary enterprises.
The Foundation has always worked in close co-
operation and co-ordination with official agencies
and programmes, both at the centre and in the
States. In its independent role, it has tried to guide
and influence the national population policy and to
serve as a catalytic agent to promote programmes
at different levels directed towards the ultimate goal
of population stabilisation. It follows the ideal of
advancing the cause of human welfare through
family planning.
In pursuit of its basic objectives, the Foundation
endeavours to raise the level of family planning
beyond its traditional confines by focusing on
critical variables reflecting its operation. It supports
innovative research, experimentation and social
action to further the cause of population stab-
ilisation and provides a forum for pooling of
experience and sharing of professional expertise
to strengthen and enlarge the operational base of
the family planning programme.
IT]
Population Foundation of India

1.5 Page 5

▲back to top


The Award
When the guiding star of the Foundation MrJRD Tata passed away in
1993, having laid a strong base for a social movement to stabilise the
growth of population in India as an essential prerequisite to attain higher
qualities of life for the Indian people, the Foundation felt that it would
be a fitting tribute to the great man if national awards were instituted in
his name to further the cause for which he was a champion acknowledged
all over the world.
In February 1996, the Governing Board formally decided to institute
national awards for the best State and the best districts with outstanding
performance in population and reproductive health and family planning
programme through programme intervention.
IT]
Population Foundation oflndia

1.6 Page 6

▲back to top


Awards
Committee
A very high level Awards Committee was
constituted to go into the issue in depth and set
standards and ground rules for the awards.
Ms Justice Leila Seth, former Chief Justice of
Himachal Pradesh, was the Chairperson of the
,noted Agricultural
Award winner and former
ommission
ngaswami, National Research
1India Institute of Medical
a Buch, former Advisor to the
vernor
, Vice-Chancellor, Pune
er Scientific Advisor to the
ia
Dr K Srinivasan, Executive Director, PFI,
Member Secretary.
IT]
Population Foundation of India

1.7 Page 7

▲back to top


The
Methodology
Trze Awards Committee held three meetings to
The performances ofthe States were evaluated
in relation to ten factors. These were:
(a) Total Fertility Rate
(b) Birth interval reflecting spacing between
births
(c) Proportion of higher order births
(d) Skilled attention provided at the time of
delivery
(e) Expectation of life at birth, sexwise
(f) Infant Mortality Rate, sexwise
(g) Adult literacy rate, sexwise, in the prime
adult age group 15-34
(h) Enrollment ratio in middle classes, sexwise
(i) Continuation rate from class VI to VIII,
seXWlse
(j) Percentage of expenditure on public health,
family planning, sanitation and water
supply, and education to State's total ex-
penditure.
A composite index on the basis of the 1993
level of these ten indicators, and the change bet-
ween the 1983-1993 levels of nine indicators
(except spacing between births, for which the 1983
level was not available) weighted in the ratio of
1:2 was used to select the best performing State.
W
Population Foundation oflndia

1.8 Page 8

▲back to top


The year 1993 was chosen as it was the latest
year for which the data were available. The
Awards committee decided that the change on a
ten-year period should be considered, hence
1983 was selected as the base year.
In the case of districts, the selection was
based on three indicators - adult literacy rate,
infant mortality rate and total fertility rate - for
which data are available at the district level from
the Census.
The composite index based on the above
indicators involving the levels in 1991 and
changes between 1981 and 1991 weighted in the
ratio of 1:2 was used for selection of the best
districts within each category of population size.
The committee recognised the large
variations in population size of the districts and
decided to divide them into three categories -
large, medium and small- on the basis of 1991
census.
The best performing State is to get a rolling
trophy in addition to cash award of Rs. 10 lakhs.
Each of the best performing districts will receive a
rolling shield and a cash award ofRs. 2 lakhs. The
awards will be declared once in 2 years.
The Foundation felt that while the State was
free to utilise the cash award in a manner it deemed
fit, it might consider recognising the creditable
performance of institutions and individuals who had
contributedto the State's achievements.The Stateaward
is to be presented to the Chief Minister of the State.
The awards for the districts are to be presented to
the Chairperson of the respective Zilla Parishad, or to
the administrative head of the district where the
panchayat system does not exist. The Foundation felt
that the districts might utilise the cash award for
furtheranceof reproductivehealth and family planning
programme in their own areas
IT]
Population Foundation of India

1.9 Page 9

▲back to top


The Winners
he inaugural JRD Tata Awards for Population and Reproductive Health Programmes were announced on July 29, 1997,
The following were the winners:
Award for the best State: KERALA
Award for the best district in the large population category (more then 2.31 million): PALAKKAD in Kerala
Award for the best district in medium category (1.22 to 2.31 million): CHIDAMBARANAR (now Toothukudi) in Tamil Nadu
Award for the best district in small category (below 1.22 million): KURUKSHETRA in Haryana
rn
Population Foundation oflndia

1.10 Page 10

▲back to top


The Design
The form of the trophy and shield has been evolved
from the triangular shape which has been used for
long to represent family planning. The design
opaque material. A combination of sandwiching an
versa has been a major' design feature.
population growth rate. The materials used are optical
rn
Population Foundation of India

2 Pages 11-20

▲back to top


2.1 Page 11

▲back to top


The Significance
of the Award
1
here could be some misgivings as to the validity
of instituting awards for performance in family
planning when the overall achievement of the
country on this front has been far from encou-
raging, despite having a country-wide official
programme almost since independence. Infact, the
earlier scheme of awards for States for target
achievement under the Central Ministry of Health
& Family Welfare was discontinued in the wake of
the target free approaches adopted by the country
following the World Population Conference in
Cairo in 1994 .
Selection of winners in the present scheme does
not rely just on current level of performance in a
number of crucial indicators. It lays greater
emphasis on the change factor signifying the rate
of progress achieved over aperiod of time through
conscious programme intervention. It is well known
that despite the indifferent performance of the
country as a whole, there are States within the
country, and there are small geographical and
administrative units within several Stales, which
are doing wonders in this field and their
achievements are compa~able to the best even in
much advanced societies. These are not only
laudable feats but they emphatically demonstrate
that, given the leadership, will and conditions,
the success can be repeated in other regions. The
pre-sent awards are recognition of this sustained
effort and will hopefully generate the much needed
impe-tus and confidence amongst the others that
they could also achieve the same standards.
The criteria for the award were meticulously
determined to be in conformity with the much
larger concept of reproductive health andfamily
planning as they give due importance to
education, quality of services and gender equity.
The criteria adopted for the selection cover the
human develop-ment index, gender related health
index as well as reproductive health index.
[ill
Population Foundation oflndia

2.2 Page 12

▲back to top


2.3 Page 13

▲back to top


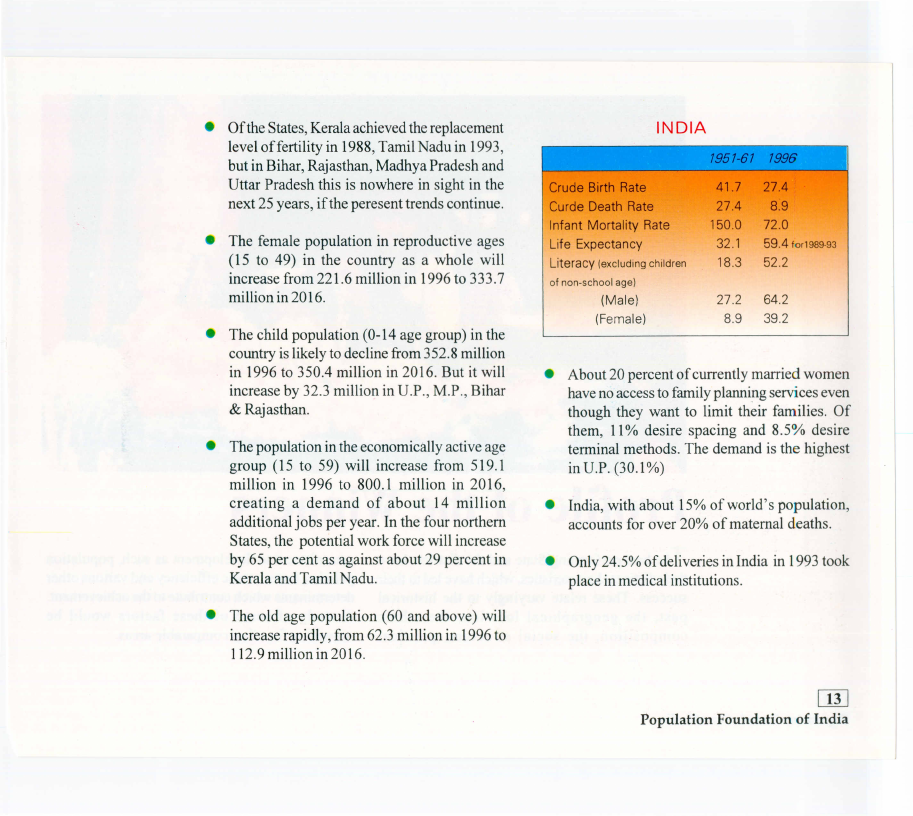
The population of India in 1996 was
estimated at 934.2 million. By 2000, it is
expected to reach the billion mark (1000
million) and by 2016 it could rise to 1263.5
million.
In 1996, the largest populatIOn among the
States was in Uttar Pradesh - 156.7 million,
and lowest in Sikkim - 0.49 million.
In 1996, the birth rate was 27.4 and the death
rate 8.9 per 1000 population - or a growth rate
of 1.85% per year, with the potential to double
the population in 37 years.
Some populous northern States such as Uttar
Pradesh, Madhya Pradesh, Rajasthan and
Bihar, which together account for over 40%
of India's population, record persistent high
growth rates, pushing up the national average.
In 20 years from 1996, there will be an addition
of 329.9 million more people, the addition
almost equalling the population of India at
independence.
More than half ofthe addition will come from
just four States - UP. (86.2 m), Bihar (39.3
m), M.P. (31 m) and Rajasthan (21.7 m)
India had set in 1985 a target to achieve
Replacement Level of Fertility (or two-child
norm) by 2000; now it has to wait till 2026 to
achieve it.
[IT]
Population Foundation ofIndia

2.4 Page 14

▲back to top


Of the States, Kerala achieved the replacement
level of fertility in 1988, Tamil Nadu in 1993,
but in Bihar, Rajasthan, Madhya Pradesh and
Uttar Pradesh this is nowhere in sight in the
next 25 years, ifthe peresent trends continue.
The female population in reproductive ages
(15 to 49) in the country as a whole will
increase from 221.6 million in 1996 to 333.7
million in 2016.
The child population (0-14 age group) in the
country is likely to decline from 352.8 million
in 1996 to 350.4 million in 2016. But it will
increase by 32.3 million in D.P., M.P., Bihar
& Rajasthan.
The population in the economically active age
group (15 to 59) will increase from 519.1
million in 1996 to 800.1 million in 2016,
creating a demand of about 14 million
additional jobs per year. In the four northern
States, the potential work force will increase
by 65 per cent as against about 29 percent in
Kerala and Tamil Nadu.
The old age population (60 and above) will
increase rapidly, from 62.3 million in 1996 to
112.9 million in 2016.
,
Crude Birth Rate
Curde Death Rate
Infant Mortality Rate
Life Expectancy
Literacy (excluding children
of non-school age)
(Male)
(Female)
.,
I
.'
:'
\\
41.7
27.4
150.0
32.1
18.3
27.4
8.9
72.0
59.4 lor1989-93
52.2
27.2 64.2
8.9 39.2
About 20 percent of currently married women
have no access to family planning services even
though they want to limit their families. Of
them, 11% desire spacing and 8.5% desire
terminal methods. The demand is the highest
in D.P. (30.1 %)
India, with about 15% of world's population,
accounts for over 20% of maternal deaths.
Only 24.5% of deliveries in India in 1993 took
place in medical institutions.
[ill
Population Foundation of India

2.5 Page 15

▲back to top


Profile of the Winners
he best performing State and the districts have
their distinct characteristics, which have led to their
success. These relate varyingly to the historical
past, the geographical location, the ethnic
composition, the social structure, political
commitment to development as such, population
policies, bureaucratic efficiency and various other
determinants which contribute to the achievement.
A study of some of these factors would be
rewarding for other comparable areas.
[TI]
Population Foundation oflndia

2.6 Page 16

▲back to top


Kerala - the Winner State
It will hardly come as a surprise to anyone that
the first JRD Tata Memorial Award for excellence
in reproductive health and population programmes
by a State should be won by Kerala. The State's
achievements are so well recognised, nationally
and internationally, that it is only in the fitness of
things that Kerala should be honoured with the
inaugural award in memory of one of the most
illustrious sons of India and a crusader for the
cause of population stabilisation, acknowledged
by the world community.
The outstanding feature of Kerala's perfor-
mance is that the State not only reached a high
level of success in a short time but continues to
improve upon it to match standards attained by
many developed countries in the world. As would
be seen from the exacting criteria for selection of
the award mentioned separately, some ten crucial
factors were considered with greater weightage
given to the change factor than the current level
of achievement, and Kerala proved to be the most
dynamic.
It will be interesting to recall some of the
achievements. Demographically, the State had, in
in 1990, a Crude Birth Rate of 19, Crude Death
Rate of 5.9 and Infant Mortality Rate of 17, far
exceeding the goals set for the entire country to
be achieved by 2001 A.D. The replacement level
of fertility (TFR 2.1) was achieved as early as 1988
while most States in the country may not achieve
it before 2016. The expectancy of life at birth is
over 72 today; women live even longer.
Kerala has become the cynosure of population
activists all over the world, and there is wide
reference to the Kerala model at all important inter-
national deliberations. Understandably, these
demographic end results are the products of various
factors, a complex interaction of historical, geo-
graphical, socio-economic, cultural, policy plan-
ning, organisational and structural changes, and
bureaucratic efficienc.y, which triggered the inner
urges of the Kerala people to mould their demo-
graphic behaviour. A brief background of Kerala
will help us to understand the phenomenon in
clearer terms.
Background
The modem Kerala State came into being on
November 1, 1956, following reorganisation of
States in independent India on linguistic basis. The
Malayalam speaking areas of the erstwhile Madras
[ill
Population Foundation of India

2.7 Page 17

▲back to top


Province and former princely states in the
Malabar coastal area constituted the new entity.
Among the States, Kerala is one of the
smaller geographical units with an area of38863
sq.km. and a population of 29.1 million as per
1991 census. It is a strip of fertile land, stretching
580 km from north to south along the south-
west coast, a width of 16 km in 'the north,
widening to 102 km in the middle before tapering
off in the south. The State has picturesque
topography, with high mountains in the east, dense
forests, undulating hills and valleys constituting the
midlands and then the coastal lowlands with the
Arabian Sea backwaters making inroads into the
land. The State is criss-crossed by some 44 rivers.
It has a typical monsoon climate of the tropics,
has both the highest amount of rainfall and highest
number of rainy days in the
country.
Kerala primarily is an agrarian State with a high
density of population living in closely knit villages.
It also has a long maritime history. The early
contacts of trade and commerce' started with the
Phoenicians, Babylonians, Arabs, Greek and the
Chinese. The later contacts were with the Portuguese,
Dutch and English. These contacts and exchanges
have left deep roots into the cultural development
of the Kerala people. Christianity came to Kerala
much earlier than when it found strong roots even
in the modem Christian countries. Similarly, Islam
found acceptance in Kerala much earlier than in
other parts of India. With tolerance and under-
standing, the majority Hindus have lived for cen-
turies in peace with Christians, Muslims and follo-
wers of other religions, and a composite culture has
evolved under the guidance of benevolent Kings,
Christian missionaries, and other social leaders.
rnJ
Population Foundation oflndia

2.8 Page 18

▲back to top


Kerala stands out as a unique example of the
capability of low income agrarian societies to
attain and sustain high quality of living levels.
With no big industry to boost the economy, the
per capita income of Rs. 4032 in 1990-91 was
lower than the national average ofRs. 4523. But
the State is way ahead in terms of social
development.
The literacy rate including female literacy, was
always high, unlike in other States. Today, there
is universal literacy, the notable factor being that
there is little difference between men-women or
urban-rural levels of literacy. There, is a high
average level of schooling, girls showing greater
keenness than boys. A number of newspapers
enjoy wide circulation among avid readers.
The National Family Health Survey conducted
in 1992-93 has brought out the strength of the
State's health services and people's motivation
for better health. In Kerala there are 1036 females
per 1000 males, a gender ratio uncommon in India.
Seventy-two percent of the population lives in
villages, but on living standards there is not much
urban-rural difference.
In January 1991, there were 2037 full fledged
hospitalsintheState,14400fwhichwereinruralareas.
Remarkably, 90% of all hospitals are run by private
agencies. In April 1992, the Government ran 54
Community Health Centres, 911 Primary Health
Centres and 5094 sub-centres mainly to cater to the
rural population. Even in 1988, Kerala provided 259
hospital beds per 1lakh population (All India only 77)
and 56%ofthese beds were inruralareas (lndiaaverage-
18%). Forty-sevenpercentofthevillages hadahealth
centre within 2 km distance (India average -12%).
Marriage is universal but the age of marriage is
high - 28.1 years for male and 22.1 years for girls.
The total fertility rate is steadily declining and heading
towards below replacement level, with the level in
1994 at 1.7. Most children are born between 25 and
29 years of the age of the mother. Ninety percent
result in live births.
Knowledge offamily planning is universal. Ofthe
.currently married women, 63% use one or the other
contraceptive method, public sector health units
taking care of75% of the supply. Women have the
support of their husbands, with a high degree of inter-
em
Population Foundation of India

2.9 Page 19

▲back to top


occur in hospitals or health clinics and 97% mothers
receive ante-natal care.
Other Developments
These features are to be viewed in the context
of certain other developments. Along with educa-
tion and health, there has been development of
infrastructure of services meeting other basic needs
of the people. This came about due to two reasons;
people's political awareness and the people-friendly
policies of successive governments reflecting a
vibrancy in political participation. No doubt, these
had their roots in the long and sustained social
movements and the genius of the Keralan people
to assimilate progressive ideas to master adversities.
measures, strong labour movements and allocation
of funds for welfare activities. It is no wonder that
Kerala's expenditure on health, family welfare,
sanitation and education as percentage of the
State's total expenditure, highest in India in
1983, continued to remain so even ten years later
in 1993.
Highest HDI
With an admittedly low per capita income, the
proportion of population below the poverty line
was surprisingly low at 17% in 1987-88 against
the national average of 30%, signifying less dis-
parity of wealth even in conditions of poverty, or
better sharing of resources. The transport system
is good with every village having a bus-stop within
2 km (India average 40%) ensuring accessibility
of facilities. A good public distribution system
provides every village with a food shop within 2
kms. The fairly equitable distribution of income
and services are the products of land reform
[IT]
Population Foundation ofIndia

2.10 Page 20

▲back to top


against India's 42.79, the State coming closest to
Kerala being Maharashtra with an HDI of 55.49.
This, then, is the profile of Kerala, the
deserving winner of the JRD Tata Award for
excellence in reproductive health and family
planning perfor-mance in its inaugural year.
Certain seeds of its success could be traced to its
history and tradition - an early exposure to the
wide world, higher status of women, low infant
mortality, greater spread of literacy, social
movements for social equity etc. Yet, it should
not be forgotten that until 1971, Kerala had a
high population growth rate, even higher than all
India average. Once the favourable factors started
having multiplying effects function-ing in a
favourable political atmosphere, the signs of
fertility decline unmistakably manifested them-
selves around 1968. There was no stopping Kerala
after that.
What is the secret of Kerala in effecting a
radical demographic change in so short a time.
The National Family Health Survey rightly
concludes that the success is substantially due to
programmes not just related to health. Fortunately,
people frien-dly governments had laid emphasis
on fulfilling the basic needs ofthe people through
land reforms and creation of basic infrastructure
such as power supply, sanitation, roads, banking
Kerala
..
Tamil Nadu
Himachal Pradesh
..
Maharashtra
-
Gujarat
-
-
Punjab
Haryana
Ul
~
~
Andhra Pradesh
(J)
West Bengal
-
Karnataka
Orissa
Rajasthan
-
Uttar Pradesh -
-
Bihar
-I
Madhya Pradesh
3
32.31
31.87
..• 28.97
27.57
26.53
2572
25.68
22.93
1971
1802
17.85
1758
14.56
--,--
30 35
[ill
Population Foundation of India

3 Pages 21-30

▲back to top


3.1 Page 21

▲back to top


such as power supply, sanitation, roads, banking
and credit facilities, food distribution housing etc.
along with good health and family planning
services. There was higher allocation for social
sectors including education, particularly female
education. The private sector was motivated to
provide health services supplementing State efforts.
The administrative services focused on community
needs and economic activities laid stress on creating
employment opportunities to meet the growing
demans to the extent possible. Of course, there
was greater allocation of the State budget to public
health programmes. In short, there was an effort
to improve the quality of life of the people, as a
whole.
literacy and high social and political consciousness,
people demanded more health facilities, made greater
use of the health system and used it better. Mass literacy
in Kerala has covered every section of the population
including the oppressed classes, women, the working
people, and the urban and rural poor.
Kerala typifies a balanced "top-down" and
"bottom-up" forces operating for fertility decline. The
"top-down" part is the egalitarian outlook in the society
as a whole, political capacity of the ruling parties and
efficiency in the organisation of the national family
planning programme in the state; the "bottom-up" forces
are the demand for such services generated by the
population, especially from the women, because of
better education, higher status, and other factors.
Political will and administrative measures also
helped close, in a short span of time, the develop-
ment gap that existed between the Travancore Cochin
area and the interior districts before independence.
The disparities in terms of education and health were
quickly removed through mass schooling and creation
of medical facilities, along with other infrastructural
developments.
The existence of more widespread medical facilities
in Kerala than in other States is also attributable to the
fact that the socio-economic arrangements were better
placed in Kerala to absorb the modern international
advances in epidemiology and public health. With mass
Could there be a Kerala model for others to follow?
Perhaps not in identical terms. The more likely lesson
is that each State or region in India will have to rely on
the ethos of the local people and strengthen the positive
elements in their attitudes in harmony with each other
to generate a quest for better life to derive the quickest
and richest results. Attempts to improve the overall
quality oflife seems to be important. A good quality of
people friendly services to meet their basic needs would
be the sine qua non. A few essential ingredients would
be, provision of basic educational and public health
services within the means and reach of the people,
education particularly for girls, reduction ~fdisparities
and a strong political will to bring about the changes
through concerted action at the grass-root level.
[IT]
Population Foundation oflndia

3.2 Page 22

▲back to top


:J).rslr.rcls
Palakkad
In the coastal State ofKerala, Palakkad is one of the
interior districts bordering on the State of Tamil Nadu to
the east. It was earlier known as Palaghat. Accord ing to
1991 census, the total population of the district was
2382235 persons with a male female ratio of 1061 females
per 1000 males. The annual exponential growth rate of
population of the district between 1981-1991 was 1.53,
exceeding the State figure of 1.34.
Palakkad District in Kerala is the proud winner of
the first prize for large population districts which have
a population above 2.31 million.
Palakkad's success is an indication ofthe demo-
graphic changes brought about in this district largely
by socio-economic transformation and well organised,
better managed maternal and child health and family
planning services.
Palakkad district is said to be the granary of Kerala
State .. It is predominantly an agricultural area and
industrially backward. Literacy among women was
generally low compared to the State level. Palakkad was
one of the four districts in Kerala which were identified as
backward in terms offamily planning.
Palakkad was considered as one of the two most
backward districts of Kerala, the other being Mala-
puram. THese two were part of the former Madras
Presidency before the new Kerala State came into being
in 1956. The area was well behind the former princely
states of Trvancore and Cochin in terms of level of
development in health and education. But a conscious
political and administrative effort was at work to remove
the imbalance. Palakkad was brought almost to the level
ofTrvancore and Cochin by the end of 1990, bridging
the gap created by centuries of neglect in the time span
of just a generation.
[ill
Population Foundation of India

3.3 Page 23

▲back to top


During 1980's, three significant health related
developments were introduced in the district. These
were-
one dose of measles vaccine. All pregnant women were
to be given 2 doses of TT early in her pregnancy. A
survey conducted in 1991 indicated that in Palakkad,
around 60% of the pregnant women had received TT
and 56% of the deliveries occurred in Institutions.
Around 53% of children were fully immunised~i.e. given
three doses ofDPT and 3 doses of Polio. The coverage
for BCG vaccine was higher at 70%.
Universal immunization programme supported by
WHOwas started in 1985. By 1989, alLthe districts in
Kerala including Palakkad had been covered. Under
this programme, attempt was made to cover all children
with 3 doses ofDPT and OPY, one dose ofBCG and
India Population Project - Kerala was started in
1984 and concluded in March 1990; in four backward
districts of Kerala of which, Palakkad was one. The
main objective was to reduce fertility and mortality rates
through well organised and better managed maternal,
child health and family planning programme. As part
of the project infrastructural health facilities, such as
buildings, equipments, other supplies, vehicles, addi-
tional staff training facilities and support for promoting
IEC were provided. Independent evaluation through
sample survey indicated that the programme helped in
reducing the fertility rates and IMR substantially .
. Palakkad also had a number of households who
had at least one member outside the country, mostly in
Gulf countries. A survey conducted in the three districts
of Ernakulam, Palakkad and Malappuram in 1991
indicated that 10% of the households had one or more
members working abroad. This had an important impact
on status of women, particularly Muslim women who
constitute about 25% ofPalakkad's population.
[TI]
Population Foundation oflndia

3.4 Page 24

▲back to top


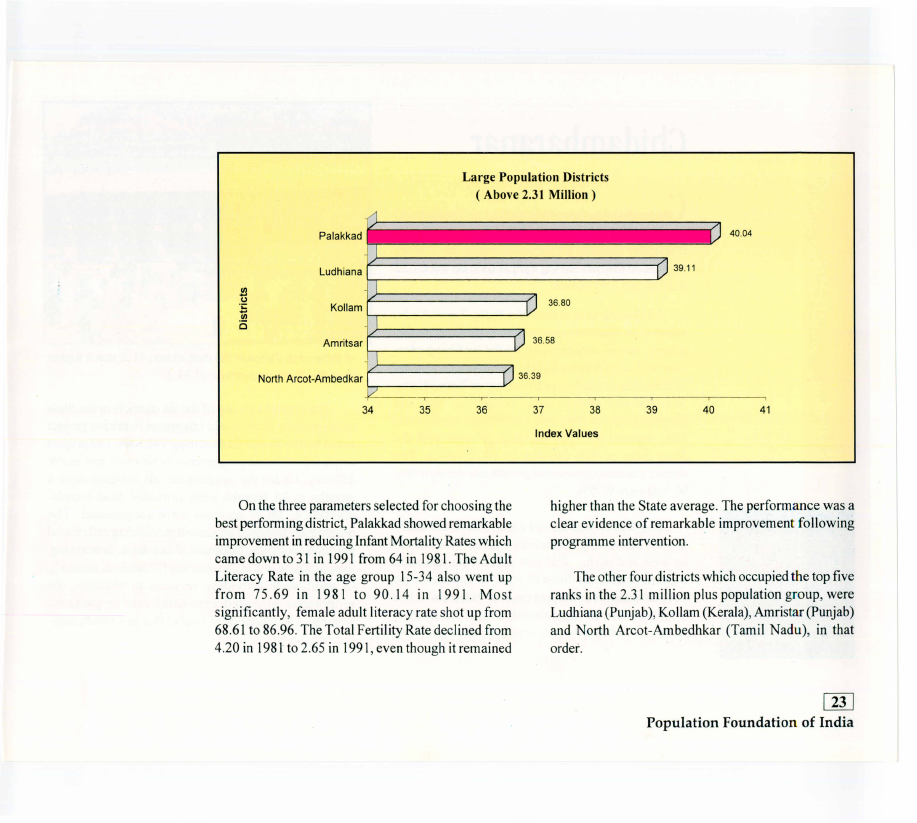
Large Population Districts
( Above 2.31 Million)
On the three parameters selected for choosing the
best performing district, Palakkad showed remarkable
improvement in reducing Infant Mortality Rates which
came down to 31 in 1991 from 64 in 1981. The Adult
Literacy Rate in the age group 15-34 also went up
from 75.69 in 1981 to 90.14 in 1991. Most
significantly, female adult literacy rate shot up from
68.61 to 86.96. The Total Fertility Rate declined from
4.20 in 1981 to 2.65 in 1991, even though it remained
higher than the State average. The performance was a
clear evidence of remarkable improvement following
programme intervention.
The other four districts which occupied the top five
ranks in the 2.31 million plus population group, were
Ludhiana (Punjab), Kollam (Kerala), Amristar (Punjab)
and North Arcot-Ambedhkar (Tamil Nadu), in that
order.
em
Population Foundation of India

3.5 Page 25

▲back to top


Chidambaranar
Chidambaranar (currently named as Toothukudi)
district in Tamil Nadu ranked first in terms of health
and family planning performance among the medium
population districts having a population between 1.22
million and 2.31 million.
Chidambaranar is part of a State, Tamil Nadu,
which is another forerunner in family planning perfor-
man'ce, well on way to repeating the credible perfor-
mance of neighbouring Kerala. The district is situated
in the extreme south~eastem comer of Tamil Nadu.
The total area of this district is 4621 sq. kms. and
the population in 1991 was 1455920 persons. It had
1051 females per 1000 males in contrast with the
State ratio of 974 females to 1000 males. The
district's annual exponential growth rate during 1981-
91 was only 0.75%.
The district was carved out as a separate entity
in 1986 bifurcating Tirunelveli district which lies to
its west and north. The new district has adequate
communication facilities by road, rail and sea with
its head-quarters at the port town ofTuticorin. It has
a fair mixture of agricultural, animal husbandry,
fishing as well as industrial activities. The percentage
41
of urban population in the district was 41.2, much higher
than the State percentage of34.2.
The district was one of the six districts in the State
to implement Tamil Nadu Integrated Nutrition project
aided by the World Bank during 1982-89. The project
consisted of linked programmes of nutrition and health
delivery. Under the programme, all children aged 6
months to 36 months were provided food supple-
mentation. MCH services were emphasised. The
programme focussed on growth monitoring and rel~ted
nutrition education, treatment of diarrhoea, dewormmg,
immunisation and micro-nutrient (Vitamin & mineral).
In addition to providing services to children, the
programme provided ante-natal. care to pr..egnant
women. An evaluation indicated that as a:result, ante-
WJ
Population Foundation oflndia

3.6 Page 26

▲back to top


Medium Population Districts
(2.31 - 1.22 Million)
Chidambarnar
41.08
Kanniyakumari
Ul
CII·
E
Kannur
I/)
Gurdaspur
39.67
38.72
38.64
Jalandhar
37.60
35
36
37
38
39
40
41
42
natal registration and immunisation of pregnant women
and children went up sharply in the project area and
proportion of malnourished children reduced con-
siderably. The community nutrition workers based in
rural areas had close contact with mothers. This helped
the family planning workers to nily on them to identify
villagers with unmet need for family planning.
Almost parallely, Chief Minister's mid-day meal
scheme was introduced throughout Tamil Nadu. This
scheme seems to have resulted in increase in school
attendance in general and improvement of female
literacy in particular.
[ill
Population Foundation of India

3.7 Page 27

▲back to top


lliJ
Population Foundation oflndia
In terms of the three criteria of selection, Chidam-
baranar registered a remarkable drop in Infant Mor-
tality, which came down to 43 in 1991 from 105 in 1981.
The Total Fertility Rate showed a decline from 4.7 in
1981 to 3.05 in 1991. In respect of Adult Literacy, the
percentage rose from 67.39 in 1981 to 78.96 in 1991.
Much ofthis could be attributed to the rise in female
literacy rate, which went up to 73.14 in 1991 from
56.51 ten years ago.
The four other districts which comprised the top
five positions in this population bracket, were Kannya-
kumari (Tamil Nadu), Kannur (Kerala), Gurdaspur
(Punjab) and Jalandhar (Punjab), in that order.

3.8 Page 28

▲back to top


Kurukshetra
Kurukshetra in Haryana came on top in terms of health
and family planning performance among the low
population districts with a population below 1.22
million.
Kurukshetra is so deeply rooted in history that it
requires no fresh introduction. It was here that the
famous battle described in the epic of Mahabharat was
fought between the Kauravas and Pandavas. It lies close
to the capital territory of Delhi in north India.
Haryana is a thriving State in terms of agriculture
and industry and has been marked by high fertility rates.
However, the fertility rate is steadily coming down. It
has declined to 2.8 for females with high school
education but is still high at 4.7 for woman with no
education. The National Family Health Survey found
that knowledge of family planning is universal in the
State but practice is only by 50% of the currently
married women. The Infant Mortality Rate is high at
75 per 1000 live births. The literacy rate stands at 56%.
To many keen observers of demographic scenario
of the country, the choice of district Kurukshetra in
Haryana State may come as a surprise. The district
Kurukshetra has an area of 1217 sq. kms. with a
population of 641,940 in 1991. The annual exponential
growth rate of population during 1981-91 for the district
was 2.10 per annum as against Haryana State average
of2.42 and all India average of2.14. The district which
is predominantly agricultural. is a very prosperous
district in Haryana with a population density of 527
persons per sq. km. against national average of 274
persons and State average of372 persons. 96.25% of
area sown is irrigated. According to Centre for
Monitoring Indian Economy, relative index of
development of district is 293 as against 136 for
Haryana. Per capita food grain production is 2016 kgs
against national average of 173 kgs and Haryana
em
Population Foundation of India

3.9 Page 29

▲back to top


average of 474 kgs. Growing of commercial crops such
as sugarcane and cultivation of vegetables, particularly
potato is very popular. Dairy farming is another
important activity.
The rapid rise in productivity and per capita income
have been accompanied by development of a modem
sector covering transport, communications, electricity
and water supply, trade and commerce, educational and
other services. By 1991, all villages were covered with
metallic roads and buses plied to all the villages. 80%
of households have electricity and 93.71 % had safe
drinking ,water. As a result, in 1991, 29.53% of the
workforce was engaged in tertiary sector as against
10.53% in manufacturing and construction.
While the economic indicators point out all round
prosperity, the social indicators indicated otherwise. In
1981, Total Fertility Rate (TFR) was 5.50 and Infant
Mortality Rate (IMR) was 91 and the adult literacy
rate in the age group 15-34 was only 44.94%, female
literacy being 29.65% only.
ern
Population Foundation oflndia

3.10 Page 30

▲back to top


Low Population Districts
( Below 1.22 Million)
Kurukshetra
Wayanad
J!l
:us
Daman
III
2i
Una
Hamirpur
36
37
38
The achievements ofKurukshetra which is a high
population density area in the State is to be viewed in
this context. Its Infant Mortality Rate came down to
35 in 1991 from 91 ten years earlier. The Total Fertility
Rate declined to 3.82 in 1991 from the 1981 TFR of
5.50. In terms of Adult Literacy, the performance was
impressive. In 1981, the literacy rate was 44.94%
whereas in 1991 it went up to 64.07%, much of it due
to an increase in female literacy, which went up from
29.65% in 1981 to 51.73% in 1991. These indicate
that though the levels in 1991 are still high, the process of
change has started in the district. It is the weightage to
change rather than absolute level which has resulted in
the district getting the award.
The other districts which came into the top five bracket
among the low population districts showing good
performance in family planning, were Wayanad (Kerala),
Daman (Daman), Una (Himachal Pradesh) and Hamirpur
(Himachal Pradesh), in that order.
ill]
Population Foundation of India

4 Pages 31-40

▲back to top


4.1 Page 31

▲back to top


Mahanishtra
Orissa
Punjab
Rajasthan
Tamil Nadu
Uttar Pradesh
West Bengal
81 77
3.7
127 126
4.5
80 81
4.0
115 103
5.9
88 87
3.3
152 160
5.8
85 84
4.1
17.53
51.32
65.45
59.43
84.95
55.93
49.11
51.71
29.88
54.15
16.24
63.41
23.09
32.48
Literacy Rate,
15-34, 1981
M
F
51.39 27.78
NA N.A.
52.86 18.37
70.75 42.81
67.57 30.58
76.75 45.74
63.90 38.38
92.82 85.74
57.67 23.13
77.96 49.48 59.6
62.21 30.48 53.1
63.27 48.40 62.6
52.91 16.94 53.3
74.36 47.88 56.5
57.72 20.61 51.4
64.73 42.18 56.8
Medical attention at
delivery, 1983
Inst. Tr. Prof.
30.3
16.5
15.2
8.2
9.9
11.2
20.2
29.0
14.3
62.4
21.5
12.5
26.3
22.8
61.5
12.8
15.0
12.7
62.1
26.6
32.4
10.7
53.0
32.6
6.4
12.9 32.53
83.55
63.6 . 27.3
5.9
61.7 32.59
77.72
53.8
37.2
30
14.2 35.98
68.29
57.4
22.3
38.4
18.9 33.86
70.53
48.5
44.1
4.0
20.4 30.39
83.83
58.0
33.5
27.8
5.9 34.43
74.95
72.56
74.81
66.95
65.77
78.97
71.70
NOTE;- M - MALES; F - FEMALES; BO - BIRlH ORDER; Inst. -INSTITUTIONAL; Tr. Prof. - TRAINED PROFESSIONALS; EXPENDITURE(%) - EXPENDITURE ON HEALTI-l,FAMILY
WELFARE, SANITATION AND EDUCATION AS PERCENTAGE OF STATE'S TOTAL EXPENDITURE; NA - NOT AVAlLABLE; MSER - MIDDLE SCHOOL ENROLMENT
RATE; IMR -INF ANT MORTALITY RATE; TFR - TOTAL FERTILITY RATE.
[ill
Population Foundation of India

4.2 Page 32

▲back to top


TFR,
Literacy Rate,
1993
IS-34, 1991
I
___
I
Assam
81 81
Bihar
68 72
Gujarat
58 58
Haryana
60 73
Himachal Pradesh 72 53
Kerala
Madhya Pradesh
Maharashtra
16 10
106 106
50 50
Punjab
Rajasthan
Tamil Nadu
Uttar Pradesh
West Bengal
49 62
82 81
57 56
87 100
57 59
58.3
57.9
45.43
78.33
77.82
115.91
74.23
100.61
69.38
89.69
61.78
69.94
67.82
113.52
60.46
60.62
39.89
48.59
19.86
56.73
58.36
85.58
5931
100.48
39.43
72.96
38.65
60.97
23.4
92.74
31.29
45.17
58.48
64.86
57.43
76.26
75.45
85.98
70.52
97.08
.64.55
9033
6784
71.69
63.17
78.59
63.13
70.55
34.77
46.07
23.49
51.60
42.73
64.03
48.16
94.79
30.41
79.42
39.82
59.20
22.24
57.65
27.97
51.18
59.5
61.5
121
55.3 55.3 25.1
59.7 57.2 33.7
59.0 611
181
625
63.7 21.9
63.6
63.6
13.1
602
63.5
19.7
68.8 74.7
6.5
54.1 53.8 25.7
63.0
65.4
18.9
55.7 553
24.4
65.2
67.6
173
57.4 58.5 27.2
61.4 63.4
9.2
56.5 55.1 34.8
60.8 623
24.0
38.1
24.8
20.40 74.23 67.95
35.7
18.4 13.1 25.85
N.A. N.A.
33.6
11.9 16.0 24.09 83.74 7231
40.8
24.8
35.6
22.26 83.56 73.21
27.5
21.8
64.7
1831
94.64 85.98
206
223
247
31.29 92.08 85.97
21.0
42.8 253
23.83 73.63 6621
24.6
923
5.5
3133
9732 102.14
45.5
13.5
14.6
22.08 63.25 57.81
28.7
36.8
163
22.95 8321 76.16
32.2
11.8
19.6
2538
73.92 67.67
31.2
83
89.4
19.87 8201 82.71
23.2
5.2
19.7 27.54 69.69 67.74203
61.3
19.1 25.95 87.76 84.43 . 31.0
53 29.4
21.79
81.82 80.85
30.7
31.2
113
29.09 7336 70.14
35.4
NOTE:- M - MALES.; F - FEMALES; BO - BIRTH ORDER; Inst. - INSTITUTIONAL; Tr. Prof. - TRAINED PROFESSIONALS; EXPENDITURE(%) - EXPENDITURE ON HEALTH,F AMILY
WELFARE, SANITATION AND EDUCATION AS PERCENTAGE OF STATE'S TOTAL EXPENDITURE; N.A. - NOT AVAILABLE; MSER - MIDDLE SCHOOL ENROLMENT
RATE; IMR- INFANT MORTALITY RATE; TFR - TOTAL FERTILITY RATE; BI - BIRTH INTERV ALOF 36+ MONTHS.
[}I]
Population Foundation ofIndia

4.3 Page 33

▲back to top


1991
North Arcot-Ambedkar 121
51
Amritsar
129
49
Ludhiana
123
45
Kollam
46
25
Palakkad
64
31"
TABLE 3:TOP 5 DISTRICTS IN EACH POPULATION SIZE GROUP
Total Fertility
Rate
1981
1991
Adult Literacy Rate,
15·34,1981
MIles Females Persons
Adult Literacy Rate,
15-34,1991
Males Femals Pasons
Large Population Districts: Population above 2.31 millions
Index
Change
1981 1991
Final Rank
Index
4.50
3.46
70.44
3866
54.44
77.67
53.50
65.48
59.34
75.96
16.61 36.39
5
5.30
3.96
6021
49.78 55.33
69.41
5679
63.50
55.45
73.56
18.10 36.59
4
460
3.01
71.73
6308 67.78
76.37
70.33
73.62
63.14
8121
18.06 39.11
2
3.10
2.14
94.07
89.78 9185
97.01
95.29
96.11
86.80
94.67
7.871 36.81
J
420
2.65
83.59
68.61 75.69
93.64
86.96
9014
74.78
89.90
15.11 40.05
Jalandhar
Gurdaspur
Kanniyakumari
Chidambaranar
Wayanad
Kurukshetra
Una
Hamirpur
Daman
122
53
163
75
87
30
105
43
73
54
91
35
149
72
113
65
59
5I
91.99
80.51 86.04
98.24
4.70
3.64
73.01
60.49 67.05
8224
74.59
78.58
6262
79.36
16.73 37.61
5
5.50
3.71
70.72
53.14 62.16
77.63
63.88
70.92
52.66
7376
21.09 38.65
4
4.40
3.05
85.15
78.02 81.53
91.15
88.73
89.93
73.04
88.37
1532 39.68
2
4.70
305
7973
56.5 I 6739
85.69
73.14
78.96
62.99
8308
20.09 41.09
Low Population Districts: Population-below 1.22 millions
4.90
2.61
83.43
67.15 7543
91.71
84.82
8828
6638
86.55
20.16 42.29
2
5.50
382
5814
29.65 4494
75.16
51.73
64.07
47.30
76.07
28.76 44.54
I
4.90
3.50
86.75
6238
73.56
91.74
8001
85.64
60.60
7988
19.26 3947
4
4.30
300
9304
70.29 79.44
96.87
91.10
93.72
69.47
85.43
1595 39.11
5
7.40
3.31
82.45
59.64 71.04
8870
75.86
82.97
61.16
82.38
21.21 41.60
J
[ill
Population Foundation of India

4.4 Page 34

▲back to top


Dr. Bharat Ram
Chairman, PFI
Since its inception the 'Population f"oundation of india has supported or initiated on its-own some
300 projects. 'Prominent non government institutions. research institutions. universities and
individuals with outstanding contribution to their areas of specialisation were associated with these
projects. Of late. it has started developing its ol17nprojects based on in-house research in prioritlj
The areas covered bJj the projects include:
.:. interface with poliCV makers at different levels. programme administrators and the voluntarv
sector to co-ordinate activities .
•:. Promotion of attitudes and opinions in favour of the small familv norm .
•:. Encouragement to groups and communities for active involvement in the programme .
•:. Encouragement to research and experimentation on familv planning determinants .
•:. Development of strategies to take care of existing and fresh challenges .
•:. Promotion offield based action projects as programme supplements .
•:. identification of gaps in action programmes and finding remedies .
•:. Development of contraceptive technolot]V.

4.5 Page 35

▲back to top