MKBKSH Endline Survey Findings_Highlights 25 June 2015

MKBKSH Endline Survey Findings_Highlights 25 June 2015


1 Pages 1-10

▲back to top


1.1 Page 1

▲back to top


MKBKSH
End-line Evaluation of Educational Entertainment
Intervention MKBKSH (Season 1)
Presentation of Key Highlights
25 June 2015
1

1.2 Page 2

▲back to top


Synopsis
Research design and methodology
Reach of the program
Impact of the program
Feedback about MKBKSH
Findings from Unmarried Youth
2

1.3 Page 3

▲back to top


Research design and methodology
3

1.4 Page 4

▲back to top


Objectives
To understand the impact of EEI on the
knowledge, attitudes related to
Age at marriage
Age at first birth
Gender discrimination, sex
selection,
FP issues
To gauge the reach and recall of the
program
44

1.5 Page 5

▲back to top


Research Methodology
Baseline Study
Levels of
Knowledge, Attitude and
Practice
Rapid Assessment
Intervention
Exposed
Not Exposed
End-line Study
Levels of
KAP
Levels of
KAP
Background
Characteristics
Background
Characteristics
Reach and
Recall
Engagement
Interpretation
Call for Action
/ Intention
5

1.6 Page 6

▲back to top


Target Group & Geographical Coverage
Target
Group
Primary Target Group
Married Woman (18-29 yrs) Non-sterilized Currently
Married Male (18-34 yrs) Non-sterilized Currently
Unmarried youth (15-24 yrs)
Secondary Target Group
Mother-in-Law (MIL) of CMW
Front Line Workers (FLW) (ANM, AWW and ASHA workers)
Districts
covered
Region/
Strata
Central
East
North
South
West
Bihar (7 Districts)
Patna, Shekhpura
Bhagalpur, Kishanganj
Darbhanga, Sitamarhi
Rohtas, Gaya
Purbi Champaran, Paschim Champaran
Madhya Pradesh
(9 Districts)
Bhopal, Ashoknagar
Jabalpur, Mandla
Chhatarpur, Morena
Chhindwara, Khandwa
Ratlam, Jhabua
6

1.7 Page 7

▲back to top


Sampling Methodology Multi-stage Cluster Sampling
Stage 1: Selection of Districts: The best and the worst district as per CPR from each strata.
Stage 2: Selection of CD Blocks with District Headquarter: Systematic Random
Sampling method was used for the selection of CD blocks. From each district 4 CD blocks were selected.
Stage 3: Selection of PSUs:
i. 2 PSUs each from District/Bloch HQ and
ii. 2 villages within a radius of 5 Km from the District/Bloch HQ town
iii. Total 20 PSUs selected in a district were,
Stage 4: Selection of HHs exposed HH from the list
7

1.8 Page 8

▲back to top


Sampling Frame
About 200 locations/PSUs were covered in Bihar and MP
In each selected Primary Sampling Unit (PSU)
House listing of TV and radio homes
Screening of homes with C&S
Screening of DD watching homes
Final screening of HH where member(s) exposed to MKBKSH
8

1.9 Page 9

▲back to top


Sample Size Achieved
Target Group
Currently Married
Woman
Currently Married Man
Target/
state/
category
610
Bihar
BL Exp
Endline
Nexp Tot
612 619 679 1298
Madhya Pradesh
Endline
BL Exp Nexp Tot
Overall
Endline
BL Exp Nexp Tot
608 639 669 1308 1220 1258 1348 2606
610 611 537 647 1184 603 614 674 1288 1214 1151 1321 2472
Mother In-law
Total
480 498 393 511 904 479 459 475 934 977 852 986 1838
1700 1814 1549 1837 3386 1786 1712 1818 3530 3600 3261 3655 6916
Front Line Worker
100 93
202 96
200 189
402
Unmarried Youth
Grand Total
480 480
4080
480
4068
480
4210
960
8276
20 IDIs (10 each in Bihar and MP) were also conducted with CMWs and CMMs.
9

1.10 Page 10

▲back to top


Level of analysis
Comparisons
Rationale
Significance
marked by symbol
1 Baseline & End line Changes over time
in the OVERALL
*
sample
2 End line Exposed & Differences due to
Unexposed
exposure
#
3 Multivariate
regression analysis
In progress
10

2 Pages 11-20

▲back to top


2.1 Page 11

▲back to top


Reach of the Program
11

2.2 Page 12

▲back to top


ReachofMain Kuch Bhi Kar Sakti Hoon(As per Listing Phase 1Data)
41.7%
Base: HH with TV (2356)
33.5%
Base: HH with TV (6648)
35.7%
Base: HH with TV (9004)
HH with radio listening to MKBKSH
83.3
71.8
41.1
HH with DTH watching MKBKSH
36.1
41.1
34.5
Overall (N=2886) Bihar (N=784)
MP (N=2102)
Overall (N=8064) Bihar (N=1879) MP (N=6185)
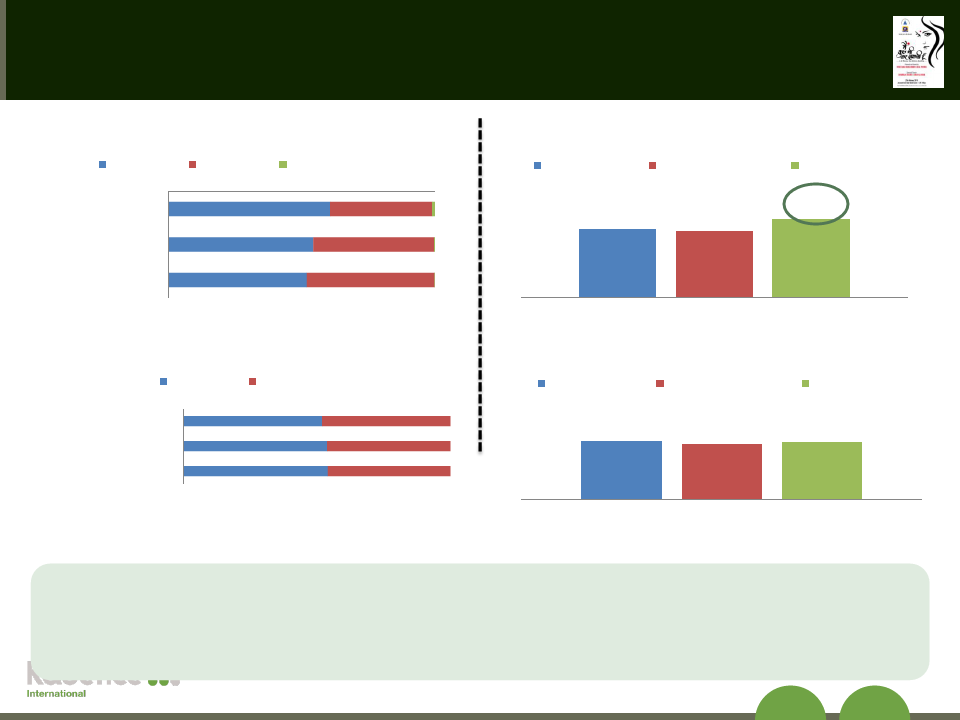
Overall 35.7% TV owning HHs were found to be exposed to MKBKSH
71.8% respondents owning radio listen to MKBKSH
About 45% HHs owned a TV (MP -66% & Bihar -23%)
12

2.3 Page 13

▲back to top


Exposure of MKBKSH Among Youth
Exposed Unmarried Youth Aged 15-24
years
40%
Exposed
Not Exposed
60%
Exposed Population
State wise
39%
41%
Bihar
MP
Base: All respondents
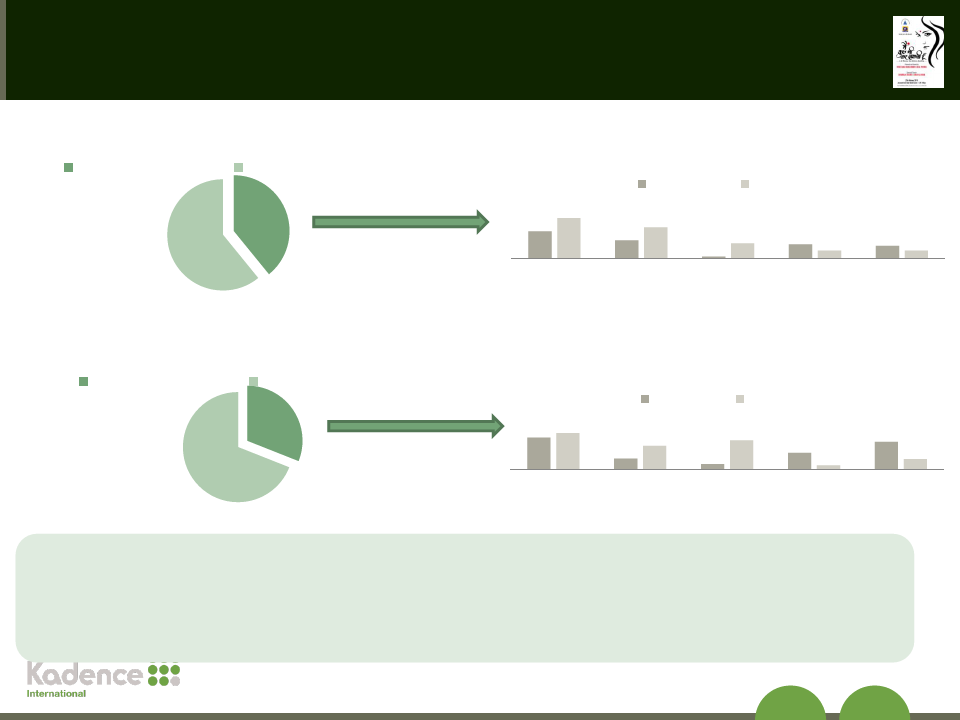
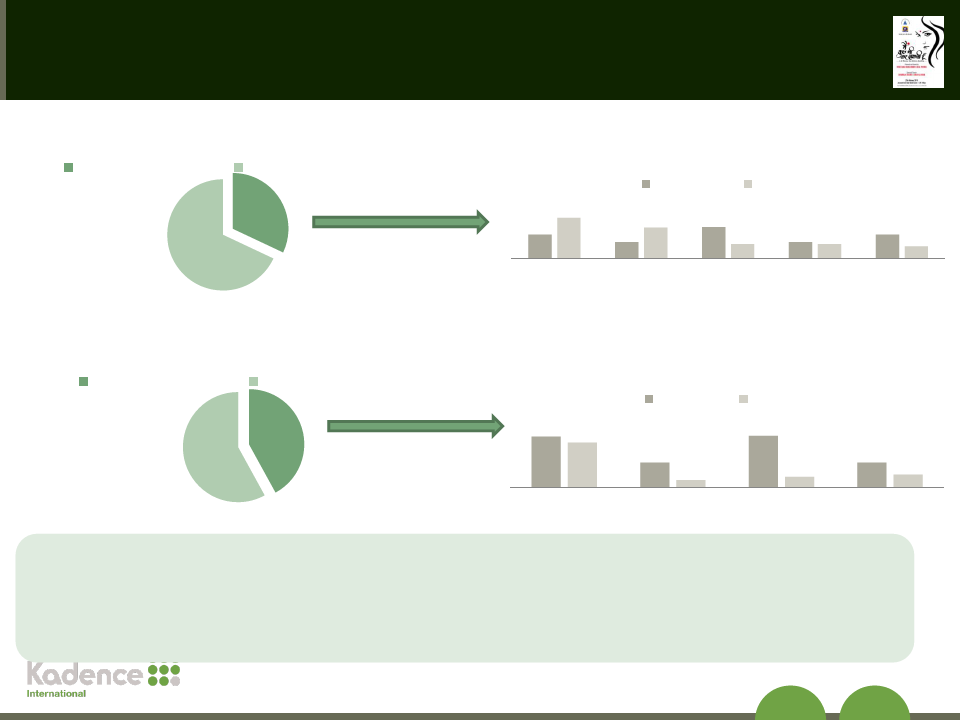
40% unmarried youth were found to be exposed to MKBKSH
13

2.4 Page 14

▲back to top


Exposure of MKBKSH Among Youth (Continued)
Exposed Married Women Aged 18-24 years
49%
Exposed
51%
Not Exposed
Exposed Population
State wise
48%
50%
Bihar
MP
Base: Married women aged 18-24 years
About 50% currently married women under 18-24 years of age were
found to be exposed to MKBKSH
14

2.5 Page 15

▲back to top


Family Planning
15

2.6 Page 16

▲back to top


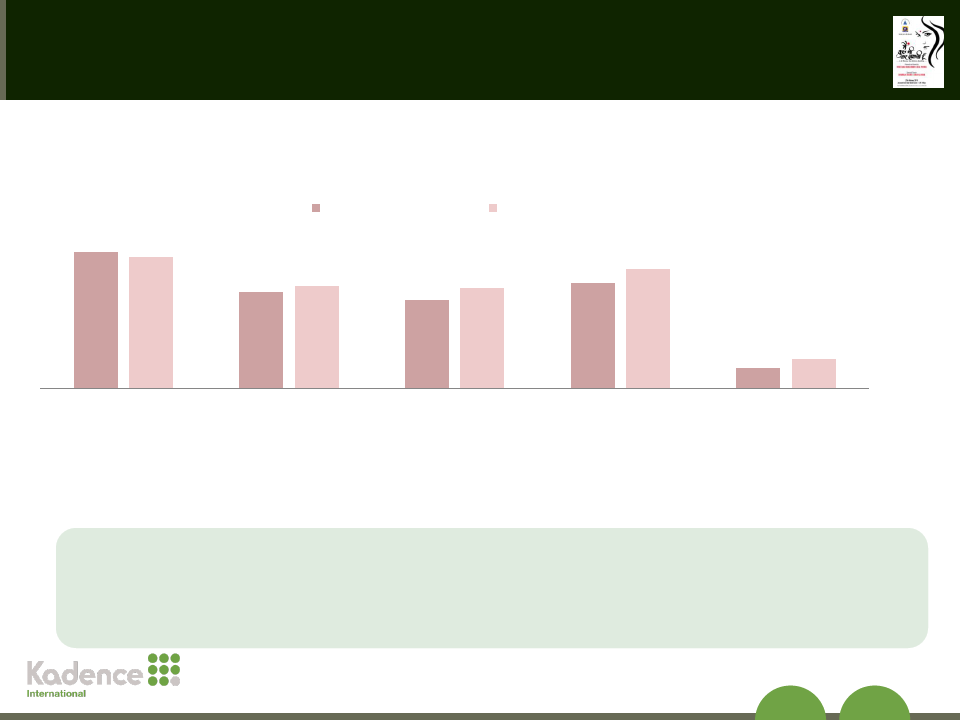
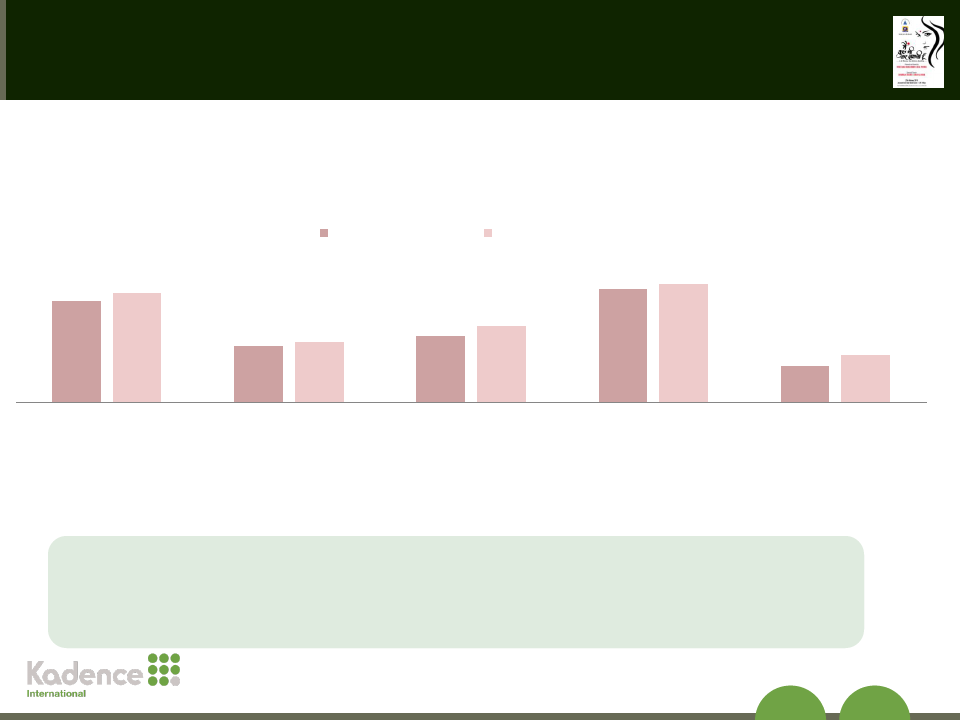
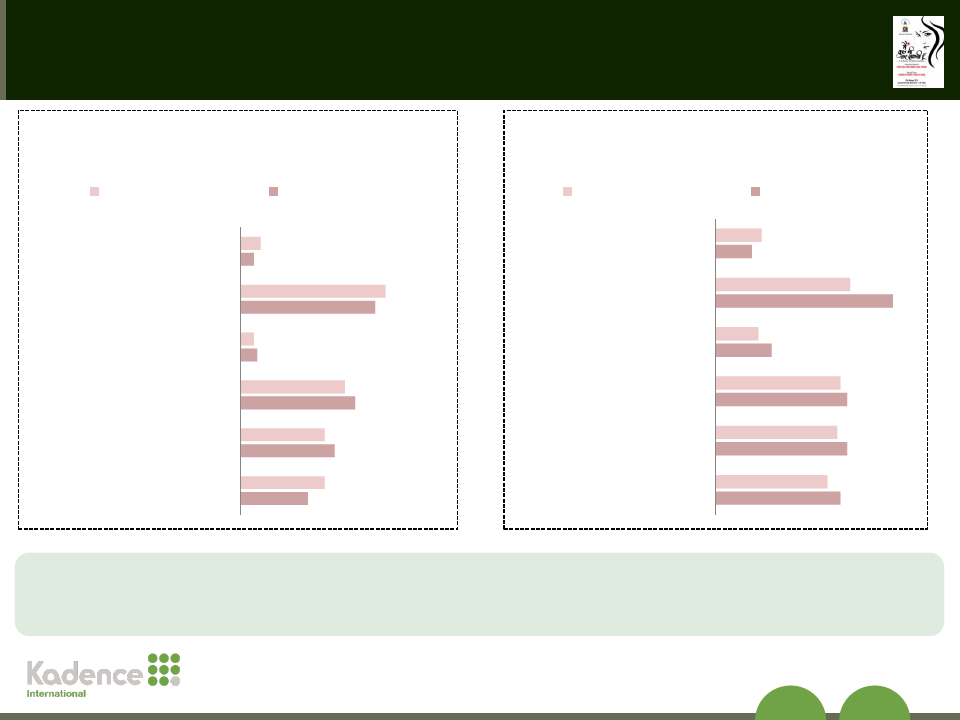
Ideal Age of Mother to have her First Child & Gap between Two Successive
Births
Ideal Age for Birth of First Child Married Women
Ideal Age Gap Between Two Successive Births
should be 2.1 to 4 years Married Women
18-20 years 21-25 years Below 18 years
Baseline (N=1220) Non-Exposed (N=1348) Exposed (N=1258)
Baseline (N=1220)
Non-Exposed (N=1348)
Exposed (N=1258)
61%
51%
50%
38% 1%
42%
46%
74%*#
65%
64%
Ideal Age for Birth of First Child Married Men
21-25 years Below 18 years
Baseline (N=1214)
52%
48%
Non-Exposed (N=1321)
49%
42%
Exposed (N=1151)
50%
42%
Ideal Age Gap Between Two Successive Births
should be 2.1 to 4 years Married Men
Baseline (N=1214) Non-Exposed (N=1321) Exposed (N=1151)
66%
62%
65%
*Significant change from baseline at 95% confidence level
# Significant change from non-exposed at 95% confidence level
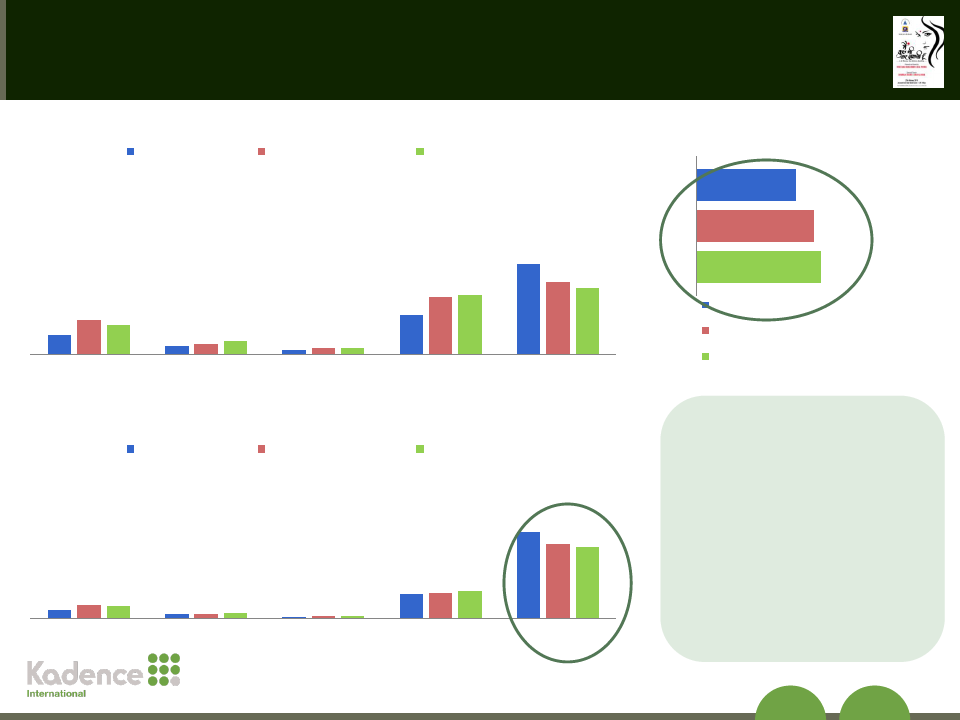
In comparison to baseline, proportion of married women considering 21-25 years as ideal age for first child
birth has increased by 8% in exposed group.
About 3/4th (74%) of the females as compared to 65% in the baseline reported that ideal age gap
between two successive births should be 2.1 to 4 years.
16

2.7 Page 17

▲back to top


Contraceptive Usage - Women
Ever used Modern Contraception - Married Women
Baseline (N=1220)
Non-Exposed (N=1348)
Exposed (N=1258)
20%* 17%*
11%
4% 6% 7%
2% 3% 3%
32%*
23%
34%*
51%
41% 38%*
OCP
IUD
Injectables
Male Condom
Never Used
Currently Using Modern Contraception - Married Women
Baseline (N=1220)
Non-Exposed (N=1348)
Exposed (N=1258)
6% 10%* 9%
OCP
61%
52% 51%*
3% 3% 4%
1% 2% 2%
18% 18% 20%
IUD
Injectables
Male Condom
*Significant at 95% confidence level
Currently not Using
Base: All respondents
Women confident in
accessing FP services
47%
56%*
59%*
Baseline (N=1220)
Non-Exposed (N=1348)
Exposed (N=1258)
Non usage of contraceptive
method has reduced to 38% for
the exposed group from baseline
figure of 51%.
Slight increase was found in
current usage of contraception.
Women who have seen the
program
are
more
confident in accessing
FP services.
17

2.8 Page 18

▲back to top


Discussion of Contraception with Husband
Ever Discussed Use of Contraception
with Husband
Baseline (N=1220)
Exposed (N=1258)
Non-Exposed (N=1348)
Likelihood of Discussing FP with
Husband in Next 6 Months
Baseline (N=1220)
Exposed (N=1258)
Non-Exposed (N=1348)
Likelihood of Adopting FP in Next 6
Months
Baseline (N=1220)
Exposed (N=1258)
Non-Exposed (N=1348)
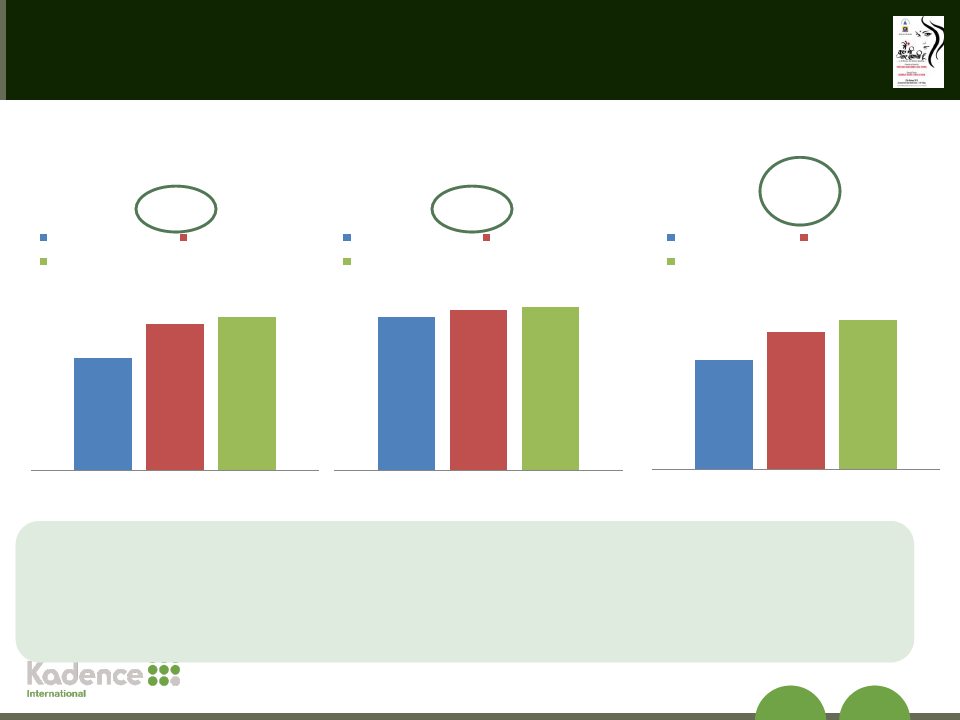
57%*
59%*
46%
18%
22%*
24%*
9%
13%
15%*
*Significant at 95% confidence level
Base: All respondents
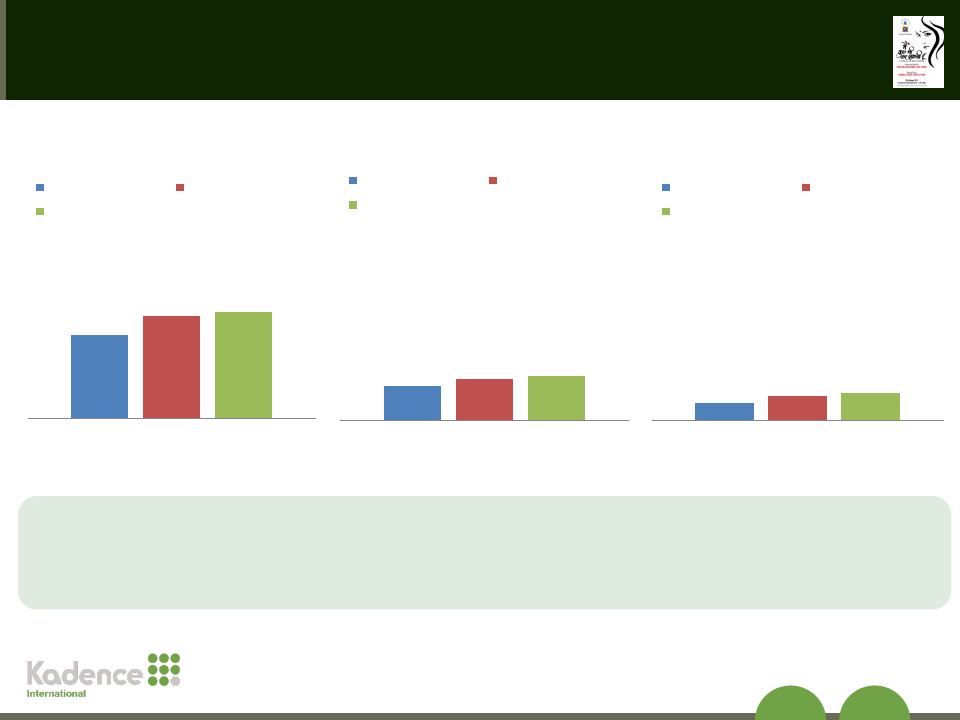
Proportion of respondents reporting to be very likely of discussing FP with their husband were more (24%) in the
exposed group as compared to baseline (18%) and non-exposed group (22%).
A similar trend was observed when asked about the likelihood of adopting FP in next 6 months.
18

2.9 Page 19

▲back to top


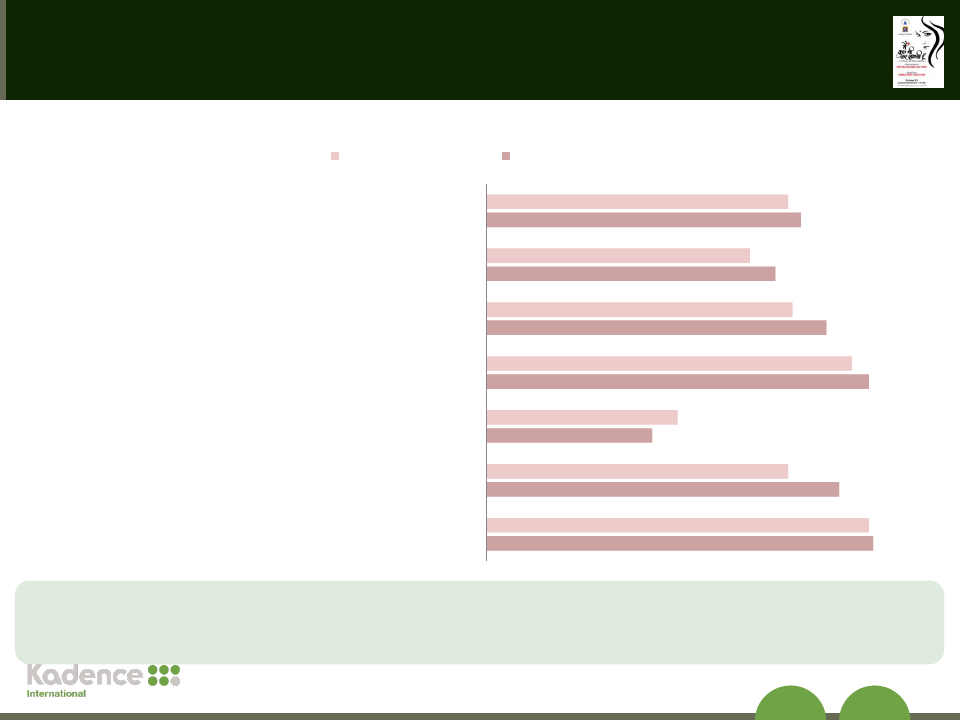
Perception and Attitude towards Family Planning Women
Attitude of women towards FP
Baseline (N=1220) Non-Exposed (N=1348) Exposed (N=1258)
Percentage agreeing
I am confident in initiating discussion about the use of
17%
contraception with my husband
66%
68%*
I am confident in accessing FP services if I wish to access
them, even if it requires going to sources outside of home
47%
56%
59%
I am confident of seeking advice on use of contreceptives
from a health worker.
61%
66%
70%
It is important for a woman to be physically and mentally
prepared before the birth of her first child.
86%
88%
92%
FP methods shouldn't only be used by couples who do not
want any more children
30%
26%
28%
It is the right of the woman to decide how many children
she should have
71%
76%
79%
One should have at least a gap of three years between two
pregnancies
86%
91%
93%*
*Significant at 95% confidence level
Base: All respondents
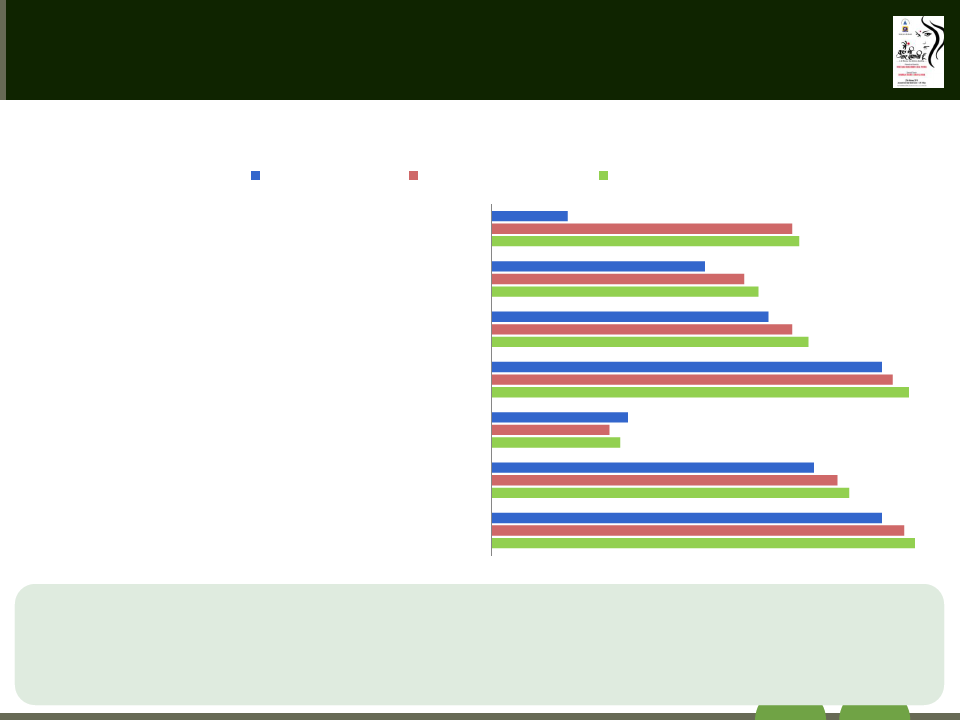
a positive shift in the attitude towards FP of women among exposed as compared to
baseline and unexposed.
no major change observed in the attitude of married men and MIL of the exposed
group, baseline and unexposed group.
19

2.10 Page 20

▲back to top


DomesticViolence & Women Empowerment
20

3 Pages 21-30

▲back to top


3.1 Page 21

▲back to top


Attitude of Women towards Domestic Violence
A woman deserves to be beaten if she…
Baseline (N=1220) Non-Exposed (N=1348) Exposed (N=1258)
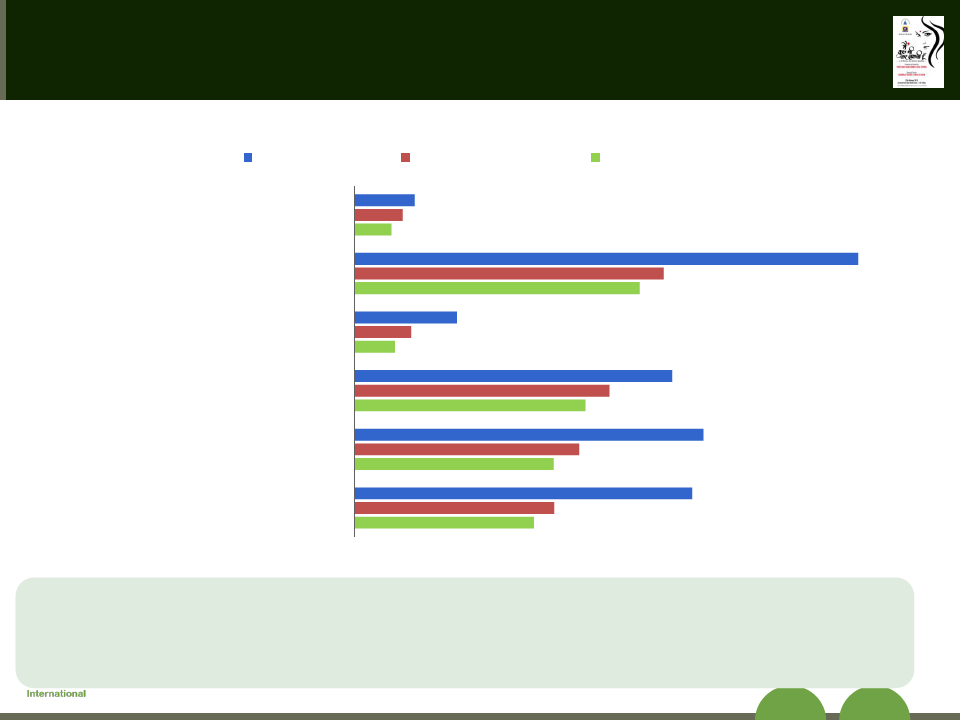
Wants to delay pregnancy*#
9%
7%
5%
If the husband suspects her to be unfaithful*#
71%
44%
40%
Refuses to have sex with her husband*#
14%
8%
6%
Argues with her husband*
45%
36%
33%
Neglects the house or children*#
49%
32%
28%
Goes out without telling her husband*
*Significant change from baseline at 95% confidence level
# Significant change from non-exposed at 95% confidence level
28%
25%
48%
Base: All respondents
A positive shift in attitude of the women was observed when asked about domestic violence.
It was observed that women who have seen the program are more against domestic violence.
In comparison to baseline figures have reduced significantly for many indicators
A positive shift was also observed in the attitude of married men and MIL from the exposed group as
compared to baseline and non-exposed group.
21

3.2 Page 22

▲back to top


Women Empowerment
Belief that compared to men, women have equal ability to hold leadership position
in local government
Percentage agreeing
Women*
Baseline (N=1220)
Exposed (N=1258)
Non-Exposed (N=1348)
Men*
Baseline (N=1214)
Exposed (N=1151)
Non-Exposed (N=1321)
MIL*#
Baseline (N=977)
Exposed (N=852)
Non-Exposed (N=986)
74%
77%
57%
76%
80%
81%
76%
69%
55%
*Significant change from baseline at 95% confidence level
# Significant change from non-exposed at 95% confidence level
Base: All respondents
In comparison to baseline, proportion of MILs who believe that woman have equal ability to hold leadership
position in government has increased significantly for the ones who have seen the program.
As compared to baseline, positive shift in belief of married women was also observed.
22

3.3 Page 23

▲back to top


Feedback about MKBKSH
23

3.4 Page 24

▲back to top


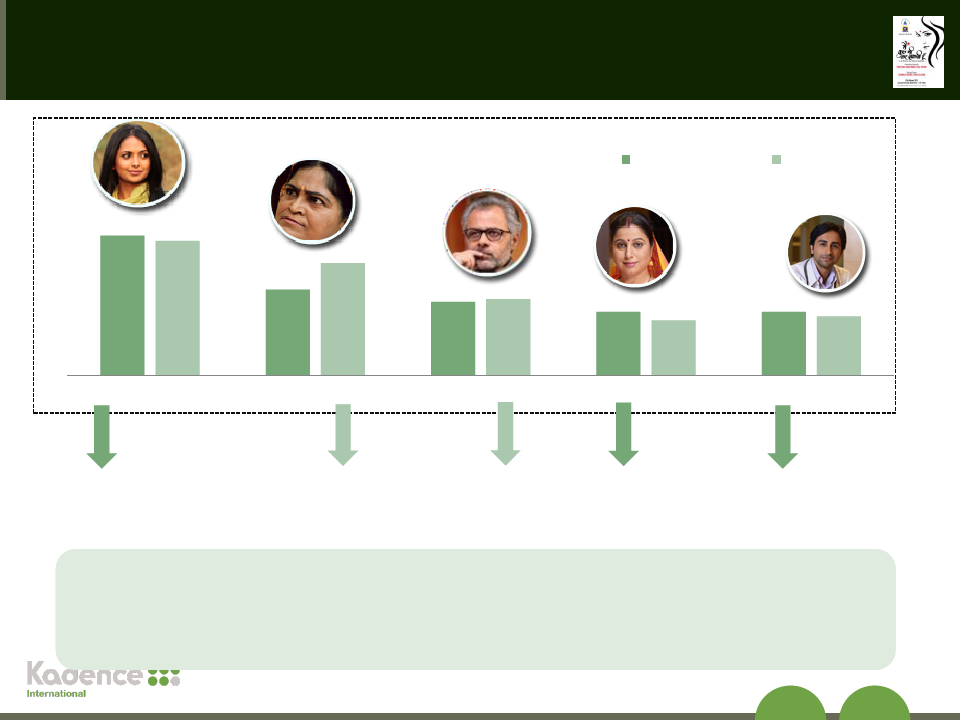
Characters Recalled
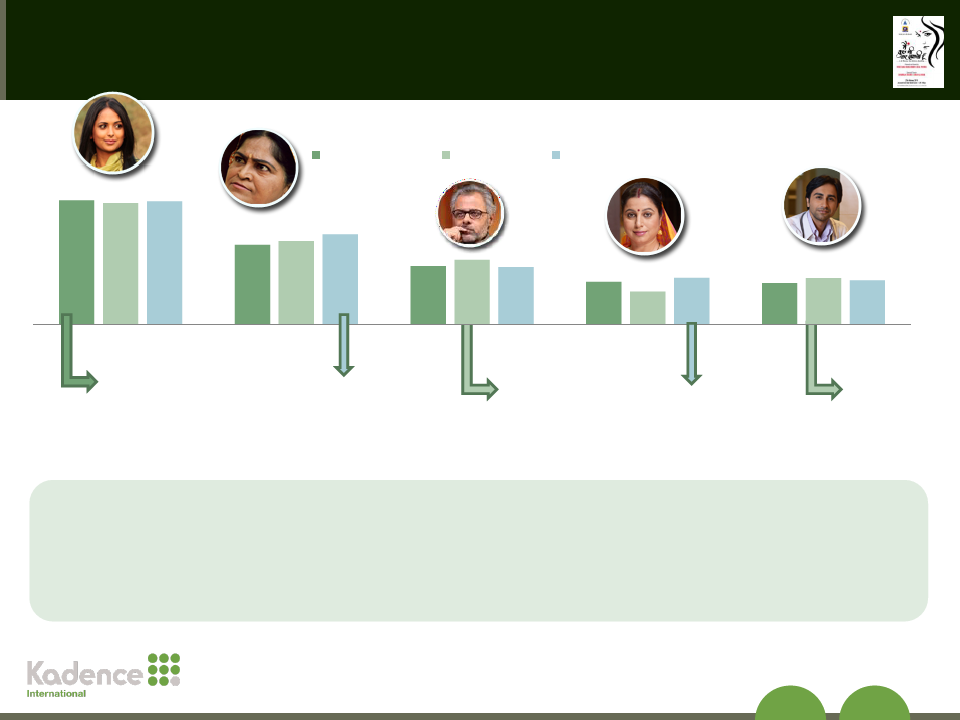
95% 93% 94%
Top Characters Recalled
Women (N=648) Men (N=500) MIL (N=353)
61% 63% 69%
44% 49% 44%
32% 25% 35%
31% 35% 33%
Dr. Sneha Mathur
Bihar: 85%
MP: 99%
Bua Ji
Bihar: 42%
MP: 75%
Keshav Mathur
Bihar: 366%
MP: 55%
Alka Mathur
Dr. Sumit
Bihar: 373%
MP: 35%
Bihar: 34%
MP: 36%
Base: Respondents who have recalled a character
Little more than half (51%) women reported that they remember a character from the program.
Recall of Dr. Sneha’s character was found very high among all the three segments.
After Dr. Sneha, Buaji was the second most recalled character.
24

3.5 Page 25

▲back to top


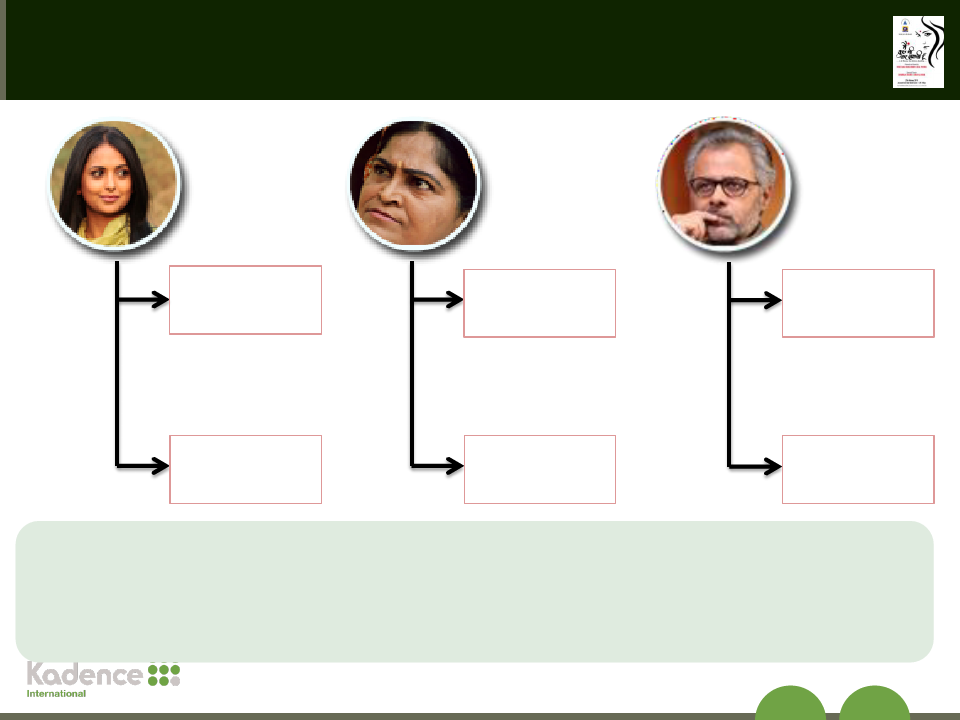
Most liked characters
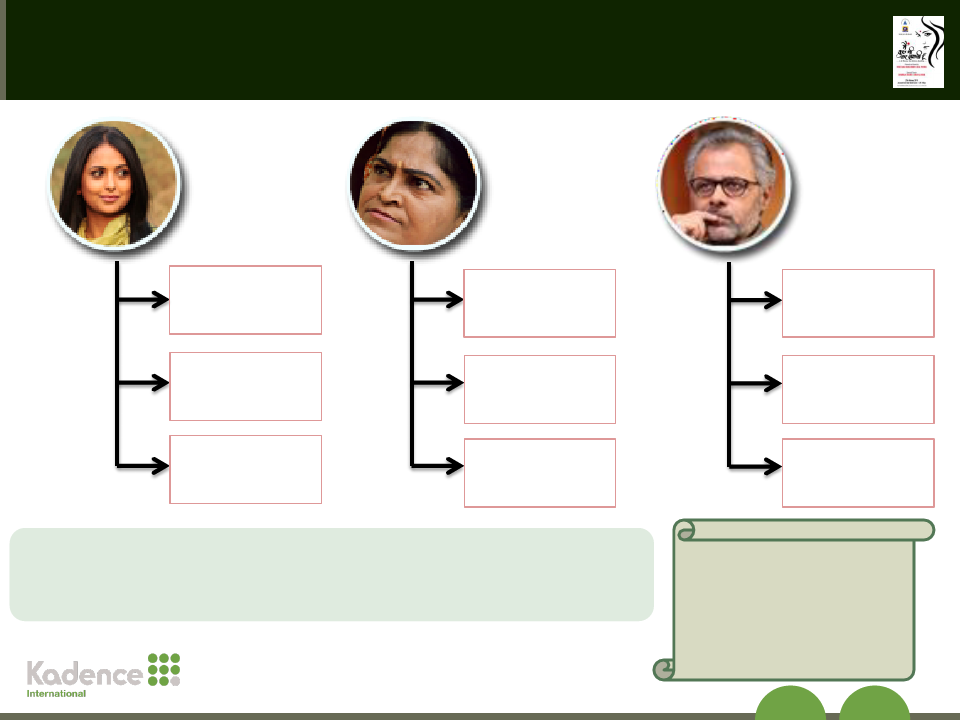
Dr. Sneha Mathur
Bua ji
Keshav Mathur
Women (N=613)
Bihar: 93%
MP: 97%
Husband (N=463)
Bihar: 92%
MP: 80%
MIL (N=331)
Bihar: 100%
MP: 99%
Women (N=393)
Bihar: 61%
MP: 49%
Husband (N=317)
Bihar: 68%
MP: 36%
MIL (N=242)
Bihar: 82%
MP: 68%
Women (N=288)
Bihar: 88%
MP: 73%
Husband (N=246)
Bihar: 96%
MP: 80%
MIL (N=154)
Bihar: 100%
MP: 93%
Dr. Sneha Mathur was the most liked character among all the three categories.
Bua ji was the second most liked character followed by Keshav Mathur’s character.
A women said that Dr.Sneha was
a very encouraging and inspiring
character, who gave them
courage to open and discuss
issues, especially family planning
issues with their husbands
25

3.6 Page 26

▲back to top


Resemblance found with Characters
Women who found resemblance
Resemblance Found No Resemblance Found
39%
61%
Base: 648 (respondents who recalled a character)
Men who found resemblance
Resemblance Found No Resemblance Found
31%
69%
Base: 500 (respondents who recalled a character)
Characters with whom resemblance found
77%
52%
Bihar (N=68) MP (N=186)
59%
34%
29%
3%
27% 15%
24% 15%
Dr. Sneha
Mathur
Bua Ji
Chowdhary Alka Mathur Keshav
Mathur
Characters with whom resemblance found
52% 60%
Bihar (N=4) MP (N=111)
39%
18%
48%
9%
27%
7%
46%
17%
Dr. Sneha
Mathur
Bua Ji
Chowdhary Alka Mathur Keshav
Mathur
About 1/3rd of the respondents reported that they found resemblance of a character in the show with
someone they know.
Most of the people in both MP and Bihar found resemblance with Dr. Sneha’s character followed by Bua ji’s
character.
26

3.7 Page 27

▲back to top


Appeal of the program
Appeal of the Program
Women (N=1258) Men (N=1151) MIL (N=852)
42%
40%
38%
44%
44%
43%
Found the program attractive
Enjoyed watching the program
Base: Respondents exposed to the program
Little more than 2 /5th (42%) women who have seen the program found the program attractive and 44%
reported that they enjoyed watching the program.
The trend was found to be similar among all the three target group when asked whether they enjoyed
watching the program.
One person from Patna was found to have downloaded all the 52
episodes in his smart phone and watches the serial repeatedly.
27

3.8 Page 28

▲back to top


Attitude towards the Program
Attitude of Respondents Towards the Program
Women (N=1258) Men (N=1151) MIL (N=852)
Percentage agreeing
The program gave me a lot of new information
I think the program is relevant for a person like me
The story of the program made me emotional
Events in the program are very realistic
This program deals with the kind of difficult choices
people have to make in real life
I could imagine myself in some of the scenes
I could clearly understand the charaters in the program
76%
68%
70%
73%
64%
65%
64%
55%
57%
61%
67%
59%
62%
66%
62%
52%
54%
39%
75%
87%
67%
Base: Respondents exposed to the program
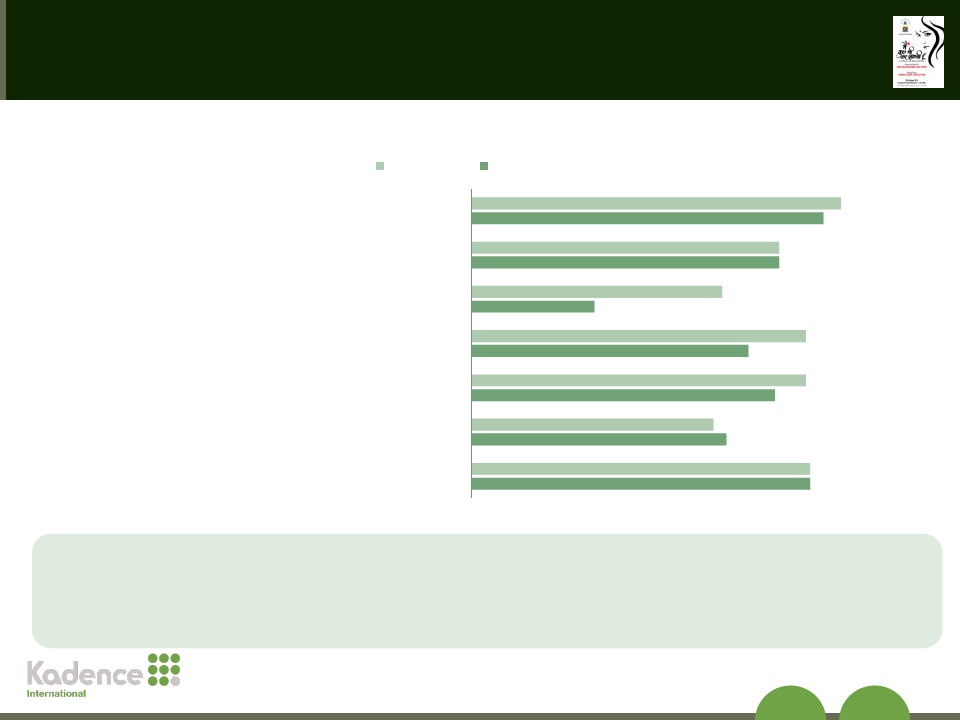
At an overall level it was observed that the attitude of the respondents towards the program was quite positive.
Majority of the respondents from all the three target groups, agreed that they understood the characters in the
program and it gave them new information
More than half of the population also said that the events in the program are very realistic.
28

3.9 Page 29

▲back to top


Call to Action
Action taken after Watching the Program
Women (N=1258)2 Men (N=1151) MIL (N=852)
Percentage agreeing
Base: Respondents exposed to the program
Asked other people to watch the program
37%
38%
52%
Tried to get more information on the issues shown in the program
26%
26%
39%
After watching the program discussed the issues with Friends
433599%%%
After watching the program discussed the issues with Husband
23%
4460%%
After watching the program discussed the issues with MIL
12%23% 22%
Thought about the critical social issues shown in the program
5581%%54%
About 37% women, 52% men and 38% MILs reported that they asked other people to watch the program.
Majority of the respondents in all the three target groups reported that they thought about the critical social issues shown in the
program.
Pehle laga tha yeh ek aam serial
hai kuch din baad laga iski
kahani mere pati aur saas ko bhi
dekhne chahiye - Woman in
Bhopal
Main to TV dekhta hi nehi
hun khas kar ye sab serial
par do teen episode dekhne
ke baad mujhe yeh bahaut
pasand aya hum dono to is
bare me charcha bhi karte
hai ajkal Man in Patna
Main to har shanivaar etowar ko
dekha aur mere pati ko bhi
dikhaya Woman in Patna
29

3.10 Page 30

▲back to top


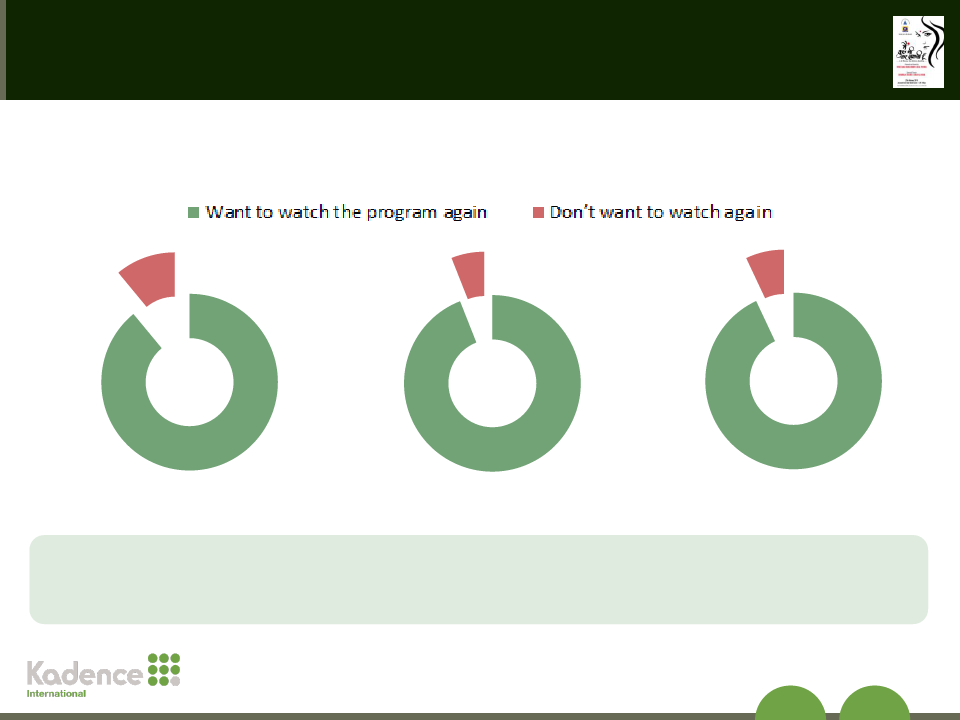
Willingness to watch MKBKSH Again
Women (N=1258)
Men (N=1151)
11%
6%
MIL (N=852)
7%
89%
94%
93%
Base: Respondents exposed to the program
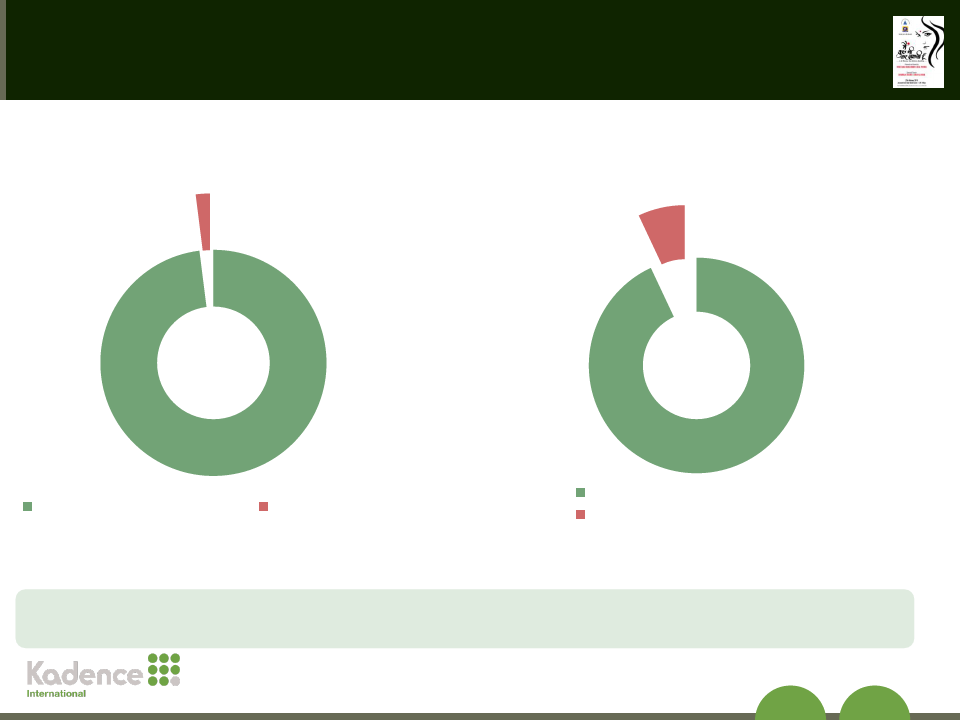
At an overall level it was found the majority of the respondents reported that they want to watch this program
again.
30

4 Pages 31-40

▲back to top


4.1 Page 31

▲back to top


Findings for Unmarried Youth
31

4.2 Page 32

▲back to top


AgeProfile Youth (by Exposure Status)
Age Profile of Female
Non-Exposed (N=367)
76% 75%
Exposed (N=232)
15-18 years
17% 19%
19-21 years
7% 6%
22-24 years
Education Profile of Female
Non-Exposed (N=367)
Exposed (N=232)
3%
14%
9%
27%
23%
32%
32%
24%
36%
Illiterate UptoMPriidmdaleryschool (up to UClpatsos SVeIIcIo) nGdararyduate and above
Age Profile of Male
Non-Exposed (N=209) Exposed (N=152)
47% 56%
29% 25%
24% 19%
Education Profile of Male
Non-Exposed (N=209) Exposed (N=152)
3% 1%
12% 7%
26% 30%
29%
27%
27%
38%
15-18 years
19-21 years
22-24 years
Illiterate UptoMPidridmlearsychool (up toUCpltaossseVcIIoI)nGdrardyuate and above
Base: All respondents
Majority of exposed females were below the age of 21 years.
More than half of the exposed males were below 18 years of age.
More than one-third of exposed unmarried youth was graduate or above.
32

4.3 Page 33

▲back to top


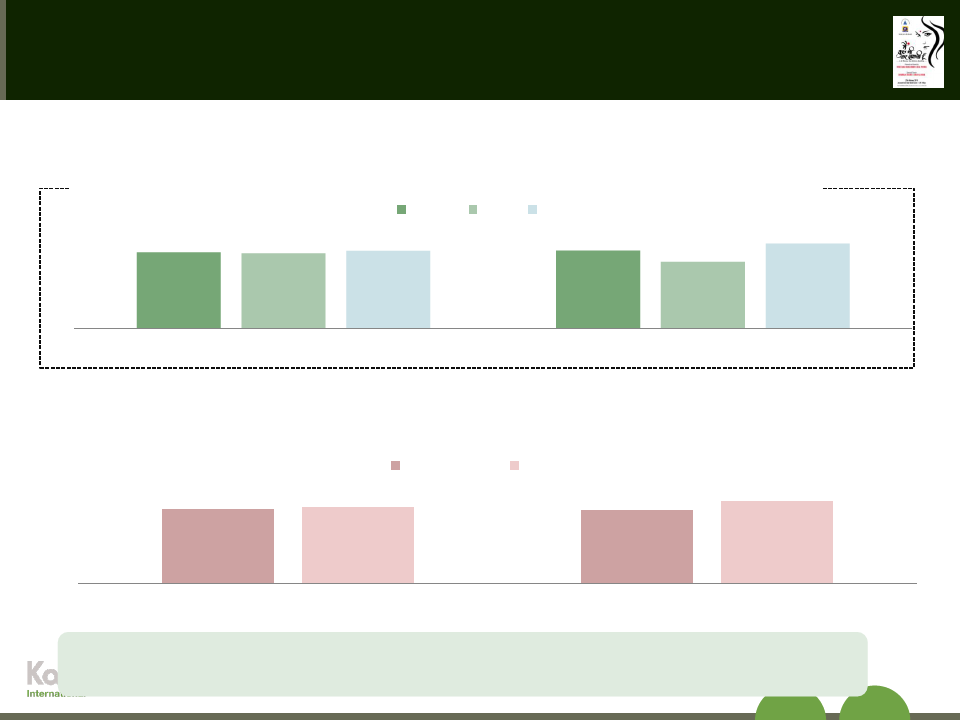
Awareness of Child Marriage Act
Females: Overall = 599, Bihar = 340, MP =259, Exposed 232, Non-Exposed - 367
Males: Overall = 361, Bihar = 140, MP =221, Exposed 152, Non-Exposed - 209
Awareness of Child Marriage Act (by Exposure Status)
Non-Exposed Exposed
87%
90%
85%
88%
Females
Males
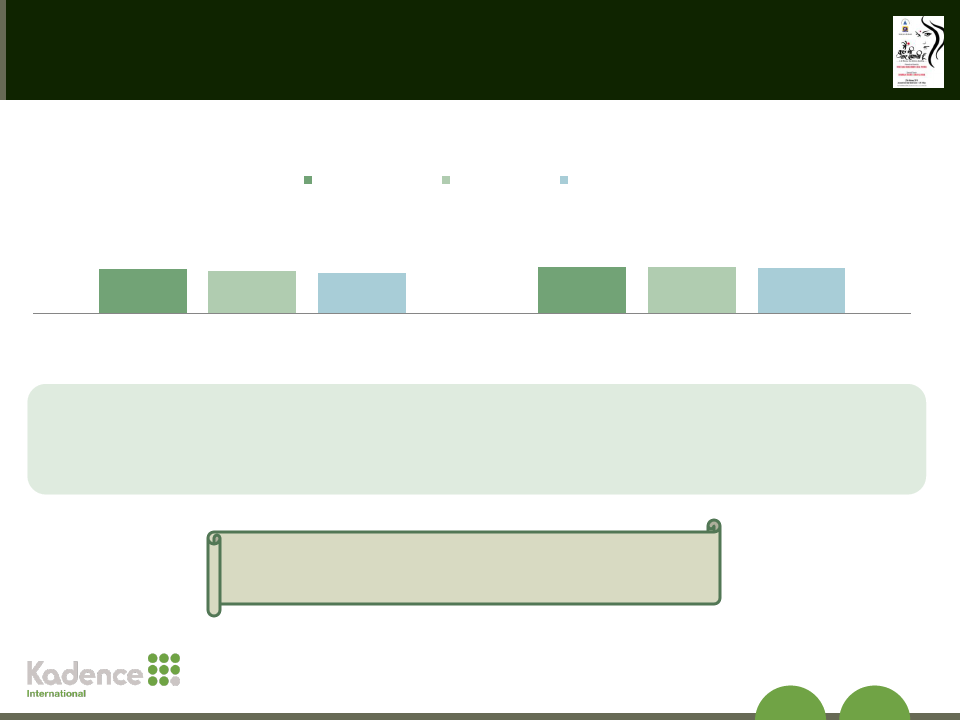
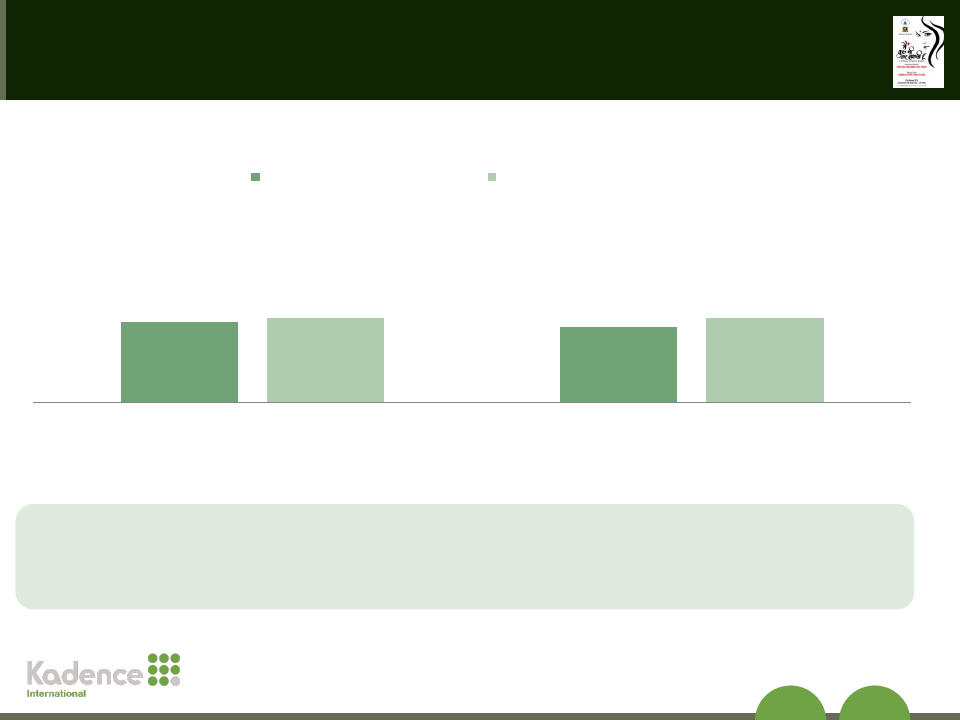
More awareness was found among the unmarried youth exposed to the program.
33

4.4 Page 34

▲back to top


Ideal Age of Mother to have her First Child & Gap between Two Successive
Births (by Exposure Status)
Ideal Age for Birth of First Child should be 21 to 25
years - Female
65%
65%
Ideal Age for Birth of First Child should be 21 to 25
years - Male
57%
59%
Non-Exposed (N=367)
Exposed (N=232)
Ideal Age Gap Between Two Successive Births
should be 2.1 to 4 years - Female
72%
77%
Non-Exposed (N=209)
Exposed (N=152)
Ideal Age Gap Between Two Successive Births
should be 2.1 to 4 years - Male
60%
67%
Non-Exposed (N=367)
Exposed (N=232)
Non-Exposed (N=209)
Exposed (N=152)
Base: All respondents
There was not much difference found among the exposed and non-exposed group when asked about ideal age for first child and gap
between two successive births.
34

4.5 Page 35

▲back to top


Awareness of Family Planning Methods Among Females
Awareness of Modern Spacing Method among Females (SPONTANEOUS + AIDED) (by Exposure Status)
88% 85%
Non-Exposed (N=367)
Exposed (N=232)
62% 66%
65%
57%
77%
68%
13% 19%
OCP
IUD
Injectables
Male Condom
Female Condom
Base: All respondents
It was also found that knowledge about modern contraceptive methods was more among the respondents exposed to the
program.
35

4.6 Page 36

▲back to top


Awareness of Family Planning Methods Among Males
Awareness of Modern Spacing Method among Males (by Exposure Status) (SPONTANEOUS + AIDED)
81%
87%
Non-Exposed (N=209) Exposed (N=152)
45% 48%
53%
61%
94%
90%
38%
29%
OCP
IUD
Injectables
Male Condom
Female Condom
Base: All respondents
It was found that Awareness among males exposed to the program was more than the ones who were not.
36

4.7 Page 37

▲back to top


Perception and Attitude towards Family Planning Females (by Exposure
Status)
Attitude towards Family Planning - Female
Non-Exposed (N=367) Exposed (N=232)
Percentage agreeing
I am confident that after marriage I will be able to initiate discussion
about the use of contraception with my spouse
61%
66%
I am confident that after mariage I will be able to access FP services
61%
if I wish to access them, even if it requires going to sources outside
62%
I am confident that after mariage I will be able to seek advice on
use of contreceptives from a health worker.
68%
70%
It is important for a woman to be physically and mentally prepared
before the birth of her first child.
86%
91%
FP methods shouldn't only be used by couples who do not want any
more children
42%
45%
It is the right of the woman to decide how many children she should
have
81%
77%
One should have at least a gap of three years between two
pregnancies
94%
96%
Base: All respondents
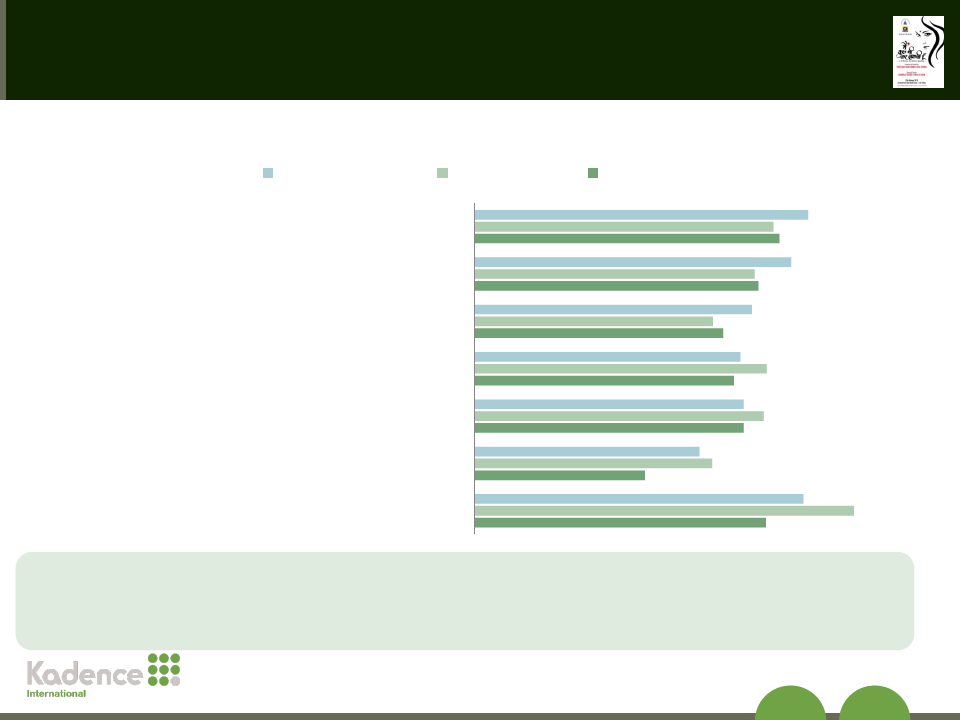
There was not much of a difference found between the attitude of the unmarried youth from the exposed group and non-exposed
group.
37

4.8 Page 38

▲back to top


Perception and Attitude towards Family Planning Males (by Exposure
Status)
Attitude towards Family Planning - Male
Non-Exposed (N=209) Exposed (N=152)
Percentage agreeing
I am confident that after marriage I will be able to initiate discussion
about the use of contraception with my spouse
I am confident that after mariage I will be able to access FP services if I
wish to access them, even if it requires going to sources outside of
I am confident that after mariage I will be able to seek advice on use
of contreceptives from a health worker.
It is important for a woman to be physically and mentally prepared
before the birth of her first child.
FP methods shouldn't only be used by couples who do not want any
more children
It is the right of the woman to decide how many children she should
have
One should have at least a gap of three years between two
pregnancies
45%
39%
71%
74%
62%
68%
72%
80%
86%
90%
71%
83%
90%
91%
Base: All respondents
There was not much of a gap found between the attitude of the respondents from the exposed and non-exposed group.
As compared to 71% in the non-exposed group, 83% respondents from the exposed group believe that it is right of the woman to
decide how many children she should have.
38

4.9 Page 39

▲back to top


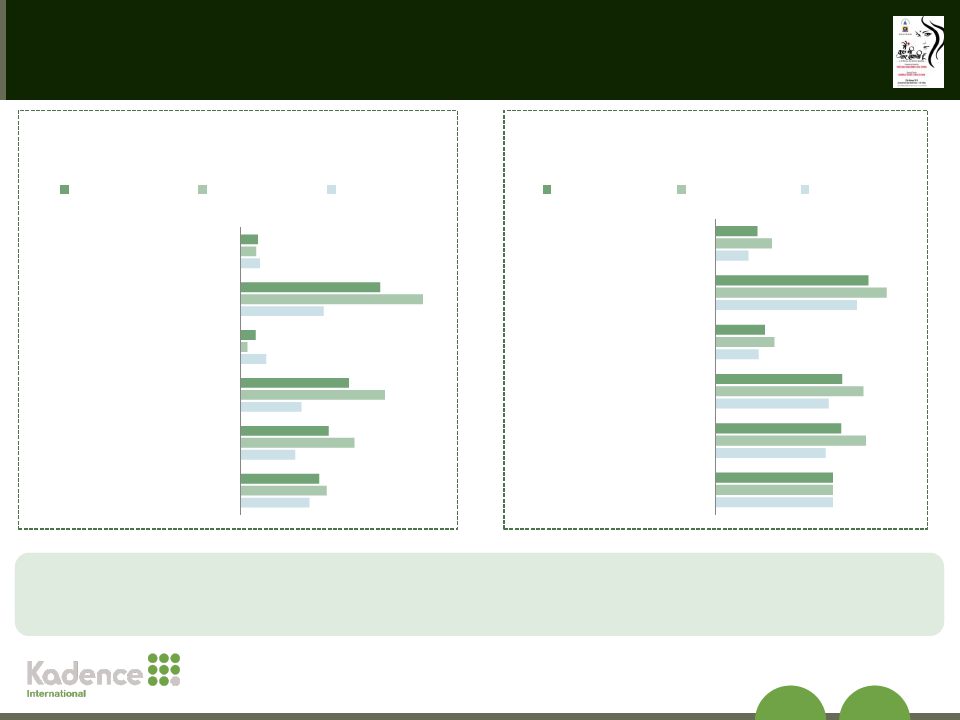
Attitude of towards Domestic Violence (by States)
Female
A woman deserves to be beaten if she…
Overall (N =599) Bihar ( N= 340) MP (N =259)
Male
A woman deserves to be beaten if she…
Overall (N =361) Bihar ( N=140) MP (N =221)
Wants to delay pregnancy
If the husband suspects her to
be unfaithful
Refuses to have sex with her
husband
Argues with her husband
Neglects the house or
children
Goes out without telling her
husband
5%
5%
6%
41%
54%
25%
5%
2%
8%
32%
43%
18%
26%
34%
16%
23%
26%
21%
Wants to delay pregnancy
If the husband suspects her
to be unfaithful
Refuses to have sex with her
husband
Argues with her husband
Neglects the house or
children
Goes out without telling her
husband
13%
17%
10%
15%
18%
13%
47%
52%
43%
39%
45%
34%
38%
46%
34%
36%
36%
36%
Base: All respondents
Majority of youth in Bihar believe that a woman should be beaten if she is found to be unfaithful to her husband.
Only 2% females in Bihar as compared to 8% in MP believe that a women should be beaten if she refuses to have
sex.
39

4.10 Page 40

▲back to top


Attitude of towards Domestic Violence (by Exposure Status)
Female
A woman deserves to be beaten if she…
Non-Exposed (N=367) Exposed (N=232)
Male
A woman deserves to be beaten if she…
Non-Exposed (N=209)2 Exposed (N=152)
Wants to delay pregnancy
If the husband suspects her to
be unfaithful
Refuses to have sex with her
husband
Argues with her husband
Neglects the house or
children
Goes out without telling her
husband
6%
4%
43%
40%
4%
5%
31%
34%
25%
28%
25%
20%
Wants to delay pregnancy
If the husband suspects her
to be unfaithful
Refuses to have sex with her
husband
Argues with her husband
Neglects the house or
children
Goes out without telling her
husband
14%
11%
13%
17%
41%
54%
38%
40%
37%
40%
34%
38%
Base: All respondents
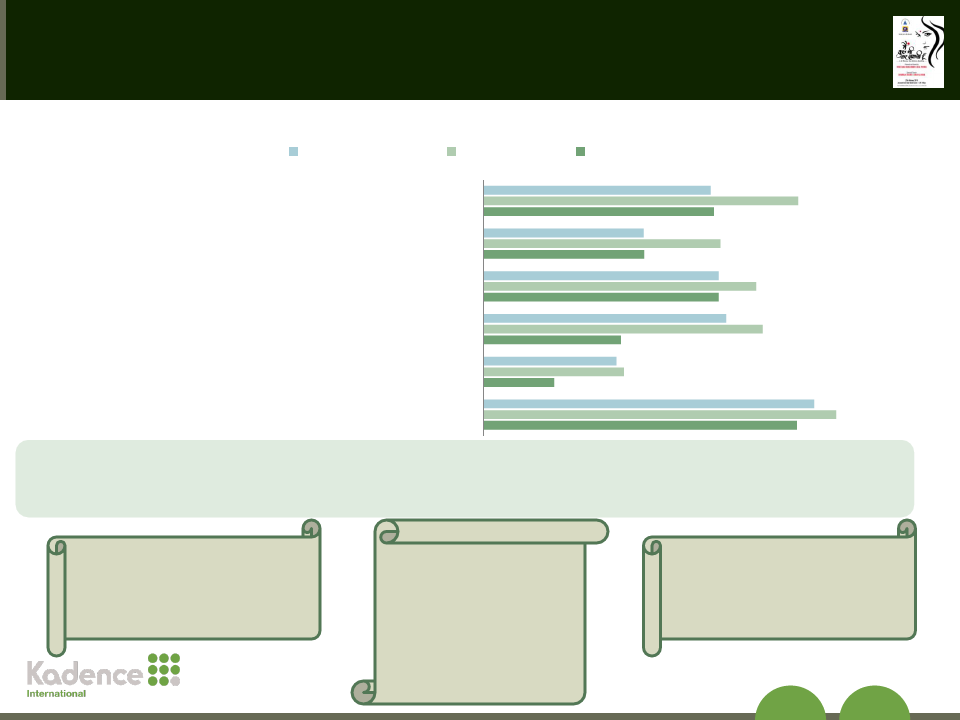
There was not much of a difference found between the attitude of the respondents exposed to the program and
the ones who were not.
40

5 Pages 41-50

▲back to top


5.1 Page 41

▲back to top


Women Empowerment
Females: Overall = 599, Bihar = 340, MP =259
Males: Overall = 361, Bihar = 140, MP =221
Belief that compared to men, women have equal ability to hold leadership position
in local government (by States)
Percentage agreeing
Overall Bihar MP
79%
78%
81%
81%
69%
88%
Females
Males
Belief that compared to men, women have equal ability to hold leadership position
in local government (by Exposure Status)
Non- Exposed Exposed
78%
80%
77%
86%
Females
Males
Majority of the youth stated that women have equal ability to hold leadership position in local
Government as compared to men.
41

5.2 Page 42

▲back to top


Characters Recalled
93%
90%
Dr. Sneha Mathur
Top Characters Recalled
Females (N=136)
Males (N=76)
57% 75%
Bua Ji
49%
51%
Keshav Mathur
43%
37%
Alka mathur
43%
40%
Dr. Sumit
MP 99%
Bihar- 86%
MP 80%
Bihar- 38%
MP 56%
Bihar- 13%
MP 46%
Bihar- 39%
MP 48%
Bihar- 35%
Base: Respondents who have recalled any character
Among youth, 59% female s and 50 % males reported that they remember a character from the
program.
It was also found that almost 9 out of 10 respondents recalled Dr. Sneha’s character.
Bua Ji was found to be the second most popular character among youth.
42

5.3 Page 43

▲back to top


Most liked characters
Dr. Sneha Mathur
Bua Ji
Keshav Mathur
Female (N=127)
Bihar: 96%
MP: 94%
Female (N=78)
Bihar: 42%
MP: 50%
Female (N=67)
Bihar: 100%
MP: 70%
Males (N=68)
Bihar: 67%
MP: 94%
Males (N=57)
Bihar: 33%
MP: 56%
Males (N=68)
Bihar: 100% (N=1)
MP: 76%
The top characters liked by the respondents were Dr. Sneha Mathur followed by Bua Ji and Keshav Mathur
Among females, the likeliness of Dr. Sneha Mathur was found similar across states
All the males in Bihar who have recalled Keshav Mathur as a character liked that character very much
43

5.4 Page 44

▲back to top


Resemblance found with Characters
Women who found resemblance
Resemblance Found No Resemblance Found
32%
68%
Base: 136 (respondents who recalled a character)
Men who found resemblance
Resemblance Found No Resemblance Found
42%
58%
Characters with whom resemblance found
69%
40%
Bihar (N=15) MP (N=29)
52%
27%
53%
24%
27% 24%
40%
20%
Dr. Sneha
Mathur
Bua Ji
Keshav Alka Mathur
Mathur
Preeta
Characters with whom resemblance found
67% 59%
Bihar (N=3)
33%
10%
MP (N=29)
68%
14%
33%
17%
Base: 76 (respondents who recalled a character)
Dr. Sneha Mathur Poorab Mathur
Arjun
Ratna Mathur
At an overall level, about 1/3rd of the respondents reported that they found resemblance of a character in the
show with someone they know.
It was further observed that majority of the respondents in both MP and Bihar found resemblance with Dr.
Sneha’s character.
44

5.5 Page 45

▲back to top


Appeal of the program
Appeal of the Program
Found the program attractive
Enjoyed watching the program
41%
43%
38%
43%
Females (N=232)
Male (N=152)
Base: Respondents exposed to the program
It was reported that 41% females found this program attractive and 43% out of these females enjoyed it also
In the similar manner, 38% males considered this program attractive and 43% of these male enjoyed it.
45

5.6 Page 46

▲back to top


Attitude towards the Program
Attitude of Respondents Towards the Program
Men (N=152) Female (N=232)
Percentage agreeing
The program gave me a lot of new information
I think the program is relevant for a person like me
The story of the program made me emotional
Events in the program are very realistic
This program deals with the kind of difficult choices
I could imagine myself in some of the scenes
I could clearly understand the charaters in the program
84%
80%
70%
70%
57%
28%
76%
63%
76%
69%
55%
58%
77%
77%
Base: Respondents exposed to the program
At an overall level the attitude of the respondents towards the program was found quite positive.
Majority of the respondents, agreed that they understood the characters in the program and it gave them new information
It was reported that 69% females and 76% males agreed that the program deals with the kind of difficult choices people have to
make in real life.
46

5.7 Page 47

▲back to top


Call to Action
Action taken after Watching the Program
Male (N=152) Female (N=232)
Asked other people to watch the program
Tried to get more information on the issues shown in the
program
After watching the program discussed the issues with
Friends
Thought about the critical social issues shown in the
program
52%
47%
43%
30%
59%
60%
78%
61%
Base: Respondents exposed to the program
The program had triggered youth to think about critical issues as 78% males and 61% females agreed to this.
They had discussed the program with their friends and had also asked other people to watch it
47

5.8 Page 48

▲back to top


Want to watch the Program Again
Women (N=232)
2%
Men (N=152)
7%
98%
Want to watch the program again Don’t want to watch again
93%
Want to watch the program again
Don’t want to watch again
Base: Respondents exposed to the program
At an overall level it was found the majority of the respondents reported that they want to watch this program
again.
48

5.9 Page 49

▲back to top


Thank you
49