Infant and Child Mortality in India- District Level Estimates PFI

Infant and Child Mortality in India- District Level Estimates PFI


1 Pages 1-10

▲back to top


1.1 Page 1

▲back to top


Infant and Child Mortality in India
District Level Estimates
S. Irudaya Rajan
P. Mohanachandran Nair
K.L. Sheela
Lalitendu Jagatdeb
Nihar Ranjan Mishra
Population Foundation of India
May 2008

1.2 Page 2

▲back to top


Infant and Child Mortality in India
District Level Estimates
Preparation of the Estimates
Dr. S. Irudaya Rajan
Centre for Development Studies, Kerala
Dr. P. Mohanachandran Nair
Dr. K.L. Sheela
University of Kerala
Preparation of the Report
Dr. Lalitendu Jagatdeb
Mr. Nihar Ranjan Mishra
Population Foundation of India, New Delhi
Designed and Printed by :
Impression Communications
9811116841, 65749684
Population Foundation of India
May 2008

1.3 Page 3

▲back to top


Foreword
True to the physical and socio-economic diversity of the country, the health and development scenario
has never been uniform. The regional diversity in states is reflected both in inter as well as intra district
variation. Keeping in view the policy of decentralized planning, district-the lowest administrative level is
taken as a more appropriate unit of health planning including planning for child survival strategies. Planning
at this level is also more appropriate due to the relative ease of availability of technology and skill necessary
for implementation of health programmes.
India as a signatory to the Millennium Summit Declaration (2000) aims at achieving the Millennium
Development Goals(MDGs) by the year 2015. Reducing child mortality is one of the 8 MDGs. The global
recognition of infant mortaility as an area of concern is well reflected in India’s policy and programme
documents. Reducing Infant Mortality Rate has been given high priority in National Population Policy, 2000
as well as National Rural Health Mission (2005—2012).Although there is good information on estimates of
infant and child mortality available at national and state levels , little evidence exists at the district level.
With the above policy and programme formulation in view, Population Foundation of India(PFI) has
undertaken the current exercise to provide indirect estimates on vital rates of mortality (Infant and Child
Mortality) by sex and place of residence for the states and districts of India based on the 2001 Census
data. This is the first part of the report and the second part of the report with estimates by religion, caste/
tribe, education and occupation will follow.
I would like to place on record our appreciation for the efforts put in by the core authors, Prof S. Irudaya
Rajan from the Center for Development Studies(CDS), Kerala, Dr P Mohanachandran Nair and Dr K.L.
Sheela (both from University of Kerala), Dr Lalitendu Jagatdeb and Mr Nihar Ranjan Mishra (both from
PFI) on this endeavour. Due recognition is given to Mr. Shailendra Singh Negi from PFI for data
management.
We hope the report would be useful to the academia, researchers, policy makers, planners and programme
managers involved in the process of development .
(A.R.Nanda)
Executive Director, PFI
May, 2008

1.4 Page 4

▲back to top


1.5 Page 5

▲back to top


Contents
Page
Abbreviations
vii
List of Tables, Graphs and Maps
ix
Introduction
1
Methodology
2
Levels and Differentials in Infant and Child Mortality
3
Rural-Urban Differential
10
Sex Differential
10
Distribution of Districts by IMR and CMR
11
References
17
Map 1: Infant Mortality Rate (IMR) in India, 2001
18
Map 2: Child Mortality Rate (CMR) in India, 2001
19
District Level Estimates of IMR by Place of Residence and Sex
21
District Level Estimates of CMR by Place of Residence and Sex
45
Appendix-I : Differential in IMR by Place of Residence and Sex
69
Appendix-II : Differential in CMR by Place of Residence and Sex
89
Definition
109
..........................................................................................................................................
V

1.6 Page 6

▲back to top


1.7 Page 7

▲back to top


Abbreviations
CDS
CMR
CEB
CS
DLHS
HDI
IMR
MDG
NFHS
NPP
NRHM
PFI
RGI
SRS
:
Centre for Development Studies
:
Child Mortality Rate
:
Children Ever Born
:
Children Surviving
:
District Level Household Survey
:
Human Development Index
:
Infant Mortality Rate
:
Millennium Development Goal
:
National Family Health Survey
:
National Population Policy
:
National Rural Health Mission
:
Population Foundation of India
:
Registrar General of India
:
Sample Registration System

1.8 Page 8

▲back to top


1.9 Page 9

▲back to top


List of Tables, Graphs and Maps
Tables:
Table-1: Infant Mortality in India, 2001
Table-2: Levels in Infant Mortality
Table-3: Differentials in IMR by Place of Residence & Sex
Table-4: Child Mortality in India, 2001
Table-5: Levels in Child Mortality
Table-6: Differentials in CMR by Place of Residence & Sex
Table-7: Distribution of Districts by Infant Mortality Rate (IMR), 2001
Table-8: Ranking of States in Descending Order of IMR, 2001 (Total)
Table-9: Districts with Minimum and Maximum Values of IMR, 2001
Table-10: Ranking of States in Descending Order of Child Mortality Rate, 2001(Total)
Table-11: Distribution of Districts by Child Mortality Rate, 2001
Table-12: Districts with Minimum and Maximum Values of CMR
Table-13: District Level Statistics for IMR and CMR in India
Table-14: Infant Mortality Rate (IMR) in Districts of India
Table-15: Child Mortality Rate (CMR) in Districts of India
Graphs:
Graph-1: Rural-Urban Differential (R/U Ratio) in IMR for Selected States of India
Graph-2: Sex Differential (M/F Ratio) in IMR for Selected States of India
Graph-3: Infant Mortality Rate (IMR) by Sex, India, 2001
Graph-4: Child Mortality Rate (CMR) by Sex, India, 2001
Graph-5: Distribution of Districts by IMR, India, 2001
Graph-6: Infant Mortality Rate in Selected States of India, 2001
Graph-7: Child Mortality Rate in Selected States of India, 2001
Graph-8: Distribution of Districts by CMR, India, 2001
Maps:
Map-1: Infant Mortality Rate (IMR) in India, 2001
Map-2: Child Mortality Rate (CMR) in India, 2001
Page
4
5
6
7
8
9
11
12
13
13
15
16
16
23
47
10
10
11
11
11
13
15
15
18
19

1.10 Page 10

▲back to top


2 Pages 11-20

▲back to top


2.1 Page 11

▲back to top


Introduction
India’s approach towards integrated development recognizes decentralized planning and programme
implementation as a key strategic intervention . By bringing decision making and implementation of services
closer to people, decentralization promises greater efficiency based on more accurate information. With
73rd and 74th amendment of the Constitution, districts became the focus of planning and programme
intervention. As the states and districts are at different stages of development, the emphasis on local area
planning necessitates to have decentralized database for planning and programme implementation.
The past few decades have witnessed increasing concerns among developing countries including India
on poor state of health and development of children. To underscore the need to position child survival at
the heart of international agenda, reducing child mortality has been focused as one of the eight Millennium
Development Goals ( MDGs.)
MDG Goal-4
Target
Health Indicators
Reduce Child Mortality
Reduce by two thirds, between 1990
and 2015,the under-five mortality rate
1. Under-five mortality rate
2. Infant mortality rate
3. Proportion of one-year-olds
immunized against measles
Although overall gains in child survival in India have been impressive, infant and child mortality levels are
still high. National level figures has it’s own limitation in policy formulation and programme implementation.
The scale and diversity of India present a huge challenge in addressing development goals including child
survival.
The Infant Mortality Rate (IMR) and Child Mortality Rate (CMR) are sensitive indicators not only as
demographic measures but also as key indicators from the programme points of view. Child survival has
been accorded high priority by Government in improving the health situation of the population. This is one
of the priority areas of the National Population Policy (NPP), 2000 .Reduction in IMR is also one of the
goals of National Rural Health Mission (2005-2012).
The estimates on infant and child mortality at national level and for major states of India are provided by
Sample Registration System (SRS) annually. The National Family Health Survey (NFHS) also provides
estimates by mother’s educational level, standard of living of the household as well as other socioeconomic
characteristics of the household. Thus at state level we have good information on these estimates. However
very little evidence exists about the levels and differentials of IMR and CMR at the district level. In India
there is large inter district variation in the level of socio-economic development within a state. The District
Level Household Survey (DLHS) also suggests a large variation in health care indicators at the district
..........................................................................................................................................
Infant and Child Mortality in India : District Level Estimates
1

2.2 Page 12

▲back to top


level. With decentralized planning, it has become inevitable to plan at the district level. Hence, the need for
critical indicators like IMR and CMR . There are some indirect estimates of IMR and CMR by Registrar
General of India for the districts of India for the period 1981 and 1991 using data of children ever born
(CEB) and children surviving (CS).
Understanding the need for indirect estimates of IMR and CMR, Population Foundation of India (PFI) has
undertaken the current study to provide estimates on vital rates of mortality (Infant and Child mortality) by
sex and place of residence for the states and districts of India. IMR/CMR is a health as well as mortality
indicator. It is also an indicator used to reflect the health dimensions of the Human Development Index
(HDI). Since the direct estimates of these indicators are either scanty or has limitations, indirect estimates
is an alternative attempt to make available decentralized data. In fact in India even the state is a large unit
and district level analysis would be best alternative to answer the regional disparities.
Methodology
Pathak et al (1988) suggested a method to estimate infant and child mortality from the data on children
ever born and children surviving by age of the mother. A revised version of the Pathak’s methodology
have been used for providing the present estimates. The 2001 census estimates have been compared
with the 1991 census estimates published in the Economic and Political Weekly (S. Irudya Rajan and P
Mohanachandran Nair, Infant and Child Mortality Estimates-Part I, Economic and Political Weekly, May 9,
1998)
The basic advantage of this procedure however lies in dispensing with the multipliers used by Brass
(1975) and others.
z The probability of survival of children is estimated as:
__
S(X) = CSi / CEBi ————(1)
Where i = 1,2,3,——,7 corresponds to age groups 15-19,20-24………..,45-49
__
and Xi is the average age of the children ever born to the women of the i-th age group.
The average age of the children is estimated using the following procedure,
If f(x) be the age specific fertility rates, the mean age of child bearing for women aged y (x < y < x+5) is
given by
y
z V(x) * f(x) dx
_
x=15
my = ——————––––
y
f(x) dx
x=15
where , V(x) = x+ 2.5 and x = 15, 20, 25…….., 45
..........................................................................................................................................
2
Infant and Child Mortality in India : District Level Estimates

2.3 Page 13

▲back to top


Average age of the children born to mothers of the age group i is then given by,
__
_
X i = w(i) – m(y, y+5) , i = 2,3,…,5, where ,
__
_
my +my+5
m(y, y+5) = —————— , y = 20,25,…….,45, and w(i) is the mid value of the
2
i-th interval.
The estimated X i, need not be an integer value. But once we know S(x) and xi, we can interpolate S(x) for
any integer value of x, using simple regression .
It may however be mentioned that estimated value largely depend on the reported number of children born
to the mother of any age, CEB data suffer from the under reporting bias. This is why the survivorship
probabilities so estimated are overestimated and the child mortality is underestimated.
Brass (1975) found that the relation between the proportion of children dead, D(i) and a life table mortality
measure , q(x), is primarily influenced by the age pattern of fertility, because it is this pattern that determines
the distribution of the children of a group of women by length of exposure to the risk of dying. So a
multiplier was developed to convert the estimated S(x) in to estimates of q(x), the multiplier being selected
according to the values of the average ratios of the weighted parities of mothers at younger ages(<35
years of age). The weights are 1, 7, 7, 6, 4 and 1 which are given by U.N. based on the age pattern of
fertility.
_
Hence q(x) = K (1- S(xi), where x = 1,2,3, 5.
The following variables from the 2001 Census have been utilised in the present study.
(i) The number of children ever born (CEB) classified by sex and five year age group of mothers from
15-49
(ii) The number of children surviving (CS) classified by sex and five year age group of mothers from
15-49
(iii) The total number of women irrespective of mothers or not classified by five year age groups
Findings :
Levels and Differentials in Infant and Child Mortality
Table-1 gives the estimates of infant mortality rates for the states ,union territories as well as for the
country. Table 2 gives absolute percent changes in between 1991-2001. Table 3 provides differentials in
IMR by place of residence and sex. At the state level decline in IMR is very fast in Himachal Pradesh (30
percentage points) where as it is very slow in case of Rajasthan (2 percentage points). It is also noticed
that IMR in rural areas is much higher than the urban areas.
..........................................................................................................................................
Infant and Child Mortality in India : District Level Estimates
3

2.4 Page 14

▲back to top


Table 1: Infant Mortality in India, 2001
State/ UTs
India
Andhra Pradesh
Arunachal Pradesh
Assam
Bihar
Chhattisgarh
Delhi
Goa
Gujarat
Haryana
Himachal Pradesh
Jammu & Kashmir
Jharkhand
Karnataka
Kerala
Madhya Pradesh
Maharashtra
Manipur
Meghalaya
Mizoram
Nagaland
Orissa
Punjab
Rajasthan
Sikkim
Tamil Nadu
Tripura
Uttarakhand
Uttar Pradesh
West Bengal
A & N Island
D & N Haveli
Chandigarh
Daman and Diu
Lakashadweep
Puducherry
1991
Total
Rural
TM F TM F
74 71 75 79 79 82
49 51 45 54 56 50
83 86 79 90 93 86
85 86 83 87 89 86
70 61 79 73 63 82
-----
-
49 49 49 60 60 60
34 37 32 39 41 37
69 63 72 79 72 82
55 52 56 58 56 60
75 76 70 77 82 73
-----
-
-----
-
60 62 57 65 68 63
37 36 38 38 38 39
107 105 110 114 113 118
58 59 55 66 70 62
36 37 35 35 36 34
76 78 74 81 83 79
58 61 52 83 84 82
55 52 56 56 54 57
108 106 110 112 110 115
54 53 55 61 60 61
81 79 83 88 87 91
57 58 56 57 58 57
53 52 53 58 58 58
78 84 71 81 87 74
-----
-
89 84 94 94 90 100
67 65 69 72 70 74
49 50 49 54 55 53
63 70 57 66 73 60
46 50 42 54 59 49
60 63 55 50 52 49
80 94 67 78 98 62
47 52 43 52 55 49
Urban
TM F
48 48 48
31 33 29
48 52 44
57 56 59
48 44 53
---
47 47 48
32 32 29
49 48 50
39 39 39
49 51 46
---
---
45 47 43
30 29 34
74 71 77
39 41 36
38 38 37
50 51 49
25 30 20
51 49 55
76 78 74
37 36 39
53 52 54
49 51 44
42 41 41
60 65 55
---
58 55 61
50 52 48
37 35 38
44 50 37
40 42 38
56 65 46
81 79 83
45 50 39
Total
TM F
54 54 53
43 46 40
61 64 59
70 75 65
57 55 58
68 72 64
40 40 40
28 29 26
59 60 58
40 41 39
45 47 43
47 48 47
50 52 48
54 57 51
18 16 20
94 92 96
49 51 48
31 31 31
58 60 55
41 40 42
39 36 42
90 88 94
43 43 44
79 78 81
43 44 42
44 44 43
64 66 63
63 64 61
84 82 86
59 62 56
41 42 40
46 50 43
44 47 40
32 35 29
60 64 56
28 30 27
2001
Rural
T MF
58 59 58
47 51 43
68 69 66
72 77 67
58 56 60
73 77 69
41 42 40
28 29 26
64 66 63
45 43 47
45 48 43
49 49 49
54 55 52
61 64 57
18 17 20
97 94 99
55 57 53
32 32 32
60 62 59
62 64 61
40 37 43
93 91 96
47 46 47
85 84 87
44 44 43
45 46 45
66 67 64
66 68 63
88 85 91
60 63 56
41 43 39
51 54 47
50 55 45
31 32 30
64 67 60
31 33 28
Urban
TM F
40 40 39
30 31 28
42 48 37
50 52 49
42 41 42
48 50 46
39 39 40
28 29 26
45 43 47
30 29 31
38 39 37
39 38 40
35 37 33
42 43 40
17 16 19
61 58 64
37 39 35
28 27 30
34 33 34
23 27 19
36 33 39
63 66 61
36 36 37
49 47 51
41 43 39
39 40 38
55 56 53
51 53 50
52 49 55
45 47 43
35 33 37
33 37 29
38 40 35
32 39 25
54 51 56
27 38 26
..........................................................................................................................................
4
Infant and Child Mortality in India : District Level Estimates

2.5 Page 15

▲back to top


Table 2: Levels in Infant Mortality
Absolute Difference (1991-2001)
Total
Rural
Urban
T
M
F
T
M
F
T
M
F
India
20
17
22
21
20
24
8
8
9
Andhra Pradesh
6
5
5
7
5
7
1
2
1
Arunachal Pradesh
22
22
20
22
24
20
6
4
7
Assam
15
11
18
15
12
19
7
4
10
Bihar
13
6
21
15
7
22
6
3
11
Chhattisgarh
-
-
-
-
-
-
-
-
-
Delhi
9
9
9
19
18
20
8
8
8
Goa
6
8
6
11
12
11
4
3
3
Gujarat
10
3
14
15
6
19
4
5
3
Haryana
15
11
17
13
13
13
9
10
8
Himachal Pradesh
30
29
27
32
34
30
11
12
9
Jammu & Kashmir
-
-
-
-
-
-
-
-
-
Jharkhand
-
-
-
-
-
-
-
-
-
Karnataka
6
5
6
4
4
6
3
4
3
Kerala
19
20
18
20
21
19
13
13
15
Madhya Pradesh
13
13
14
17
19
19
13
13
13
Maharashtra
9
8
7
11
13
9
2
2
1
Manipur
5
6
4
3
4
2
10
11
7
Meghalaya
18
18
19
21
21
20
16
18
15
Mizoram
17
21
10
21
20
21
2
3
1
Nagaland
16
16
14
16
17
14
15
16
16
Orissa
18
18
16
19
19
19
13
12
13
Punjab
11
10
11
14
14
14
1
0
2
Rajasthan
2
1
2
3
3
4
4
5
3
Sikkim
14
14
14
13
14
14
8
8
5
Tamilnadu
9
8
10
13
12
13
3
1
3
Tripura
14
18
8
15
20
10
5
9
2
Uttarakhand
-
-
-
-
-
-
-
-
-
Uttar Pradesh
5
2
8
6
5
9
6
6
6
West Bengal
8
3
13
12
7
18
5
5
5
A & N Island
8
8
9
13
12
14
2
2
1
D & N Haveli
17
20
14
15
19
13
11
13
8
Chandigraph
2
3
2
4
4
4
2
2
3
Daman and Diu
28
28
26
19
20
19
24
26
21
Lakashadweep
20
30
11
14
31
2
27
28
27
Puducherry
19
22
16
21
22
21
18
12
13
..........................................................................................................................................
Infant and Child Mortality in India : District Level Estimates
5

2.6 Page 16

▲back to top


Table 3: Differentials in IMR by Place of Residence & Sex
1991
2001
Ratio of R/U
Ratio of M/F
Ratio of R/U
Ratio of M/F
States/UT
T
M
F
T
R
U
T
M
F
T
R
U
India
1.6 1.6 1.7
0.9
1.0 1.0 1.5 1.5 1.5 1.0 1.0
1.0
Andhra Pradesh
1.7 1.7 1.7
1.1
1.1 1.1 1.6 1.6 1.5 1.2 1.2
1.1
Arunachal Pradesh
1.9 1.8 2.0
1.1
1.1 1.2 1.6 1.4 1.8 1.1 1.0
1.3
Assam
1.5 1.6 1.5
1.0
1.0 0.9 1.4 1.5 1.4 1.2 1.1
1.1
Bihar
1.5 1.4 1.5
0.8
0.8 0.8 1.4 1.4 1.4 0.9 0.9
1.0
Chhattisgarh
-
-
-
-
-
- 1.5 1.5 1.5 1.1 1.1
1.1
Delhi
1.3 1.3 1.3
1.0
1.0 1.0 1.1 1.1 1.0 1.0 1.1
1.0
Goa
1.2 1.3 1.3
1.2
1.1 1.1 1.0 1.0 1.0 1.1 1.1
1.1
Gujarat
1.6 1.5 1.6
0.9
0.9 1.0 1.4 1.5 1.3 1.0 1.0
0.9
Haryana
1.5 1.4 1.5
0.9
0.9 1.0 1.5 1.5 1.5 1.1 0.9
0.9
Himachal Pradesh
1.6 1.6 1.6
1.1
1.1 1.1 1.2 1.2 1.2 1.1 1.1
1.1
Jammu & Kashmir
-
-
-
-
-
- 1.3 1.3 1.2 1.0 1.0
1.0
Jharkhand
-
-
-
-
-
- 1.5 1.5 1.6 1.1 1.1
1.1
Karnataka
1.4 1.4 1.5
1.1
1.1 1.1 1.5 1.5 1.4 1.1 1.1
1.1
Kerala
1.3 1.3 1.1
0.9
1.0 0.9 1.1 1.1 1.1 0.8 0.9
0.8
Madhya Pradesh
1.5 1.6 1.5
1.0
1.0 0.9 1.6 1.6 1.5 1.0 0.9
0.9
Maharashtra
1.7 1.7 1.7
1.1
1.1 1.1 1.5 1.5 1.5 1.1 1.1
1.1
Manipur
0.9 0.9 0.9
1.1
1.1 1.0 1.1 1.2 1.1 1.0 1.0
0.9
Meghalaya
1.6 1.6 1.6
1.1
1.1 1.0 1.8 1.9 1.7 1.1 1.1
1.0
Mizoram
3.3 2.8 4.1
1.2
1.0 1.5 2.7 2.4 3.2 1.0 1.0
1.4
Nagaland
1.1 1.1 1.0
0.9
0.9 0.9 1.1 1.1 1.1 0.9 0.9
0.8
Orissa
1.5 1.4 1.6
1.0
1.0 1.1 1.5 1.4 1.6 0.9 0.9
1.1
Punjab
1.6 1.7 1.6
1.0
1.0 0.9 1.3 1.3 1.3 1.0 1.0
1.0
Rajasthan
1.7 1.7 1.7
1.0
1.0 1.0 1.7 1.8 1.7 1.0 1.0
0.9
Sikkim
1.2 1.1 1.3
1.0
1.0 1.2 1.1 1.0 1.1 1.0 1.0
1.1
Tamil Nadu
1.4 1.4 1.4
1.0
1.0 1.0 1.2 1.2 1.2 1.0 1.0
1.1
Tripura
1.4 1.3 1.3
1.2
1.2 1.2 1.2 1.2 1.2 1.0 1.0
1.1
Uttarakhand
-
-
-
-
-
- 1.3 1.3 1.3 1.0 1.1
1.1
Uttar Pradesh
1.6 1.6 1.6
0.9
0.9 0.9 1.7 1.7 1.7 1.0 0.9
0.9
West Bengal
1.4 1.3 1.5
0.9
0.9 1.1 1.3 1.3 1.3 1.1 1.1
1.1
A & N Island
1.5 1.6 1.4
1.0
1.0 0.9 1.2 1.3 1.1 1.1 1.1
0.9
D & N Haveli
1.5 1.5 1.6
1.2
1.2 1.4 1.5 1.5 1.6 1.2 1.1
1.3
Chandigarh
1.4 1.4 1.3
1.2
1.2 1.1 1.3 1.4 1.3 1.2 1.2
1.1
Daman & Diu
0.9 0.8 1.1
1.1
1.1 1.4 1.0 0.8 1.2 1.2 1.1
1.6
Lakshadeep
1.0 1.2 0.7
1.4
1.6 1.0 1.2 1.3 1.1 1.1 1.1
0.9
Puducherry
1.2 1.1 1.3
1.2
1.1 1.3 1.1 0.9 1.1 1.1 1.2
1.5
..........................................................................................................................................
6
Infant and Child Mortality in India : District Level Estimates

2.7 Page 17

▲back to top


Table-4 gives the estimates of child mortality rates for the states, union territories as well as for the
country. Table 5 gives the levels in child mortality with absolute percent point changes in between 1991-
2001. Table 6 provides estimates by place of residence and sex. The state of Orissa is experiencing fast
decline (68 percent points) in case of CMR.The north eastern states like Manipur is experiencing less
decline in child mortality rate (10 percent points).The child mortality rate is higher in rural areas as compared
to the urban areas in all the states.
Table 4: Child Mortality in India, 2001
State/ UTs
India
Andhra Pradesh
Arunachal Pradesh
Assam
Bihar
Chhattisgarh
Delhi
Goa
Gujarat
Haryana
Himachal Pradesh
Jammu & Kashmir
Jharkhand
Karnataka
Kerala
Madhya Pradesh
Maharashtra
Manipur
Meghalaya
Mizoram
Nagaland
Orissa
Punjab
Rajasthan
Sikkim
Tamil Nadu
Tripura
Uttarakhand
Uttar Pradesh
West Bengal
A & N Island
D & N Haveli
Chandigarh
Daman and Diu
Lakashadweep
Puducherry
1991
2001
Total
Rural
Urban
Total
Rural
TM F TM F TM F TM F T M F
96 93 103 107 102 115 57 56 59 59 58 61 65
68 68 67 78 78 76 41 43 40 48 50 47 54
139 142 133 152 155 149 62 59 65 76 77 75 82
117 117 115 115 117 119 71 68 78 78 79 76 80
89 76 104 94 80 111 54 48 61 62 57 66 64
-----
- - - - 75 78 73 81
59 58 60 74 73 77 57 55 58 43 41 45 46
49 48 50 56 55 57 36 37 34 30 30 29 31
85 80 94 101 94 110 57 52 61 62 61 63 69
72 66 79 81 73 90 45 44 46 44 44 42 49
97 101 92 99 104 95 61 63 57 66 69 63 67
-----
- - - - 48 49 48 50
-----
- - - - 55 55 56 60
81 80 83 91 89 93 57 56 58 61 62 59 68
46 44 47 48 46 49 39 37 42 20 18 21 20
159 152 166 175 168 180 97 92 104 102 99 104 106
72 72 71 82 86 79 44 46 41 58 61 56 62
42 42 41 41 42 40 43 44 43 32 32 32 33
98 100 97 106 108 104 60 62 59 61 62 60 67
70 73 66 113 113 111 30 35 25 41 42 41 52
67 64 72 66 72 63 63 57 70 40 36 43 41
160 155 166 168 162 173 101 104 98 92 94 90 96
66 65 65 73 75 77 43 42 45 45 44 46 49
109 101 118 121 111 131 66 62 69 88 85 92 95
84 87 81 86 90 85 56 59 52 51 51 50 53
69 66 72 77 72 82 52 52 52 50 50 51 53
101 113 100 103 118 104 73 83 71 71 72 71 73
-----
- - - - 70 70 71 75
120 115 135 132 118 149 73 68 77 94 88 100 100
88 84 92 100 96 104 60 62 58 66 66 65 68
69 72 64 78 82 73 41 42 43 47 48 47 49
91 96 85 94 101 76 51 61 45 53 54 51 58
56 60 50 66 72 59 46 48 44 52 55 48 60
74 77 69 60 62 59 85 85 85 36 39 33 37
108 133 87 104 137 68 109 105 115 67 70 64 69
67 68 66 76 78 73 62 63 61 36 48 35 41
64 67
56 51
83 82
81 79
59 69
84 78
45 47
31 30
68 69
46 53
70 65
49 51
59 61
70 67
19 21
101 110
63 62
32 33
67 66
52 52
37 44
98 94
47 50
91 99
53 52
52 54
73 73
75 75
93 107
69 67
50 48
60 66
67 54
39 36
72 65
43 39
Urban
TM F
42 41 43
35 35 34
50 54 46
54 56 53
44 42 46
51 52 50
41 40 43
29 29 28
50 49 51
31 30 33
40 41 38
41 40 42
37 37 37
45 46 45
18 17 20
65 61 70
42 43 40
29 28 30
37 38 37
27 29 24
37 35 40
67 67 66
37 36 38
60 58 63
43 45 41
46 46 46
58 58 57
54 54 55
69 66 72
56 56 57
38 36 40
35 38 33
43 45 41
33 39 28
59 59 60
34 35 33
..........................................................................................................................................
Infant and Child Mortality in India : District Level Estimates
7

2.8 Page 18

▲back to top


Table 5: Levels in Child Mortality
India
Andhra Pradesh
Arunachal Pradesh
Assam
Bihar
Chhattisgarh
Delhi
Goa
Gujarat
Haryana
Himachal Pradesh
Jammu & Kashmir
Jharkhand
Karnataka
Kerala
Madhya Pradesh
Maharashtra
Manipur
Meghalaya
Mizoram
Nagaland
Orissa
Punjab
Rajasthan
Sikkim
Tamilnadu
Tripura
Uttarakhand
Uttar Pradesh
West Bengal
A & N Island
D & N Haveli
Chandigarh
Daman and Diu
Lakashadweep
Puducherry
Total
T
M
37
35
20
18
63
65
39
38
27
19
-
-
16
17
19
18
23
19
28
22
31
32
-
-
-
-
20
18
26
26
57
53
14
11
10
10
37
38
29
31
27
28
68
61
21
21
21
16
33
36
19
16
30
41
-
-
26
27
22
18
22
24
38
42
4
5
38
38
41
63
31
20
Absolute Difference (1991-2001)
Rural
Urban
F
T
M
F
T
M
F
42
42
38
48
15
15
16
20
24
22
25
6
8
6
58
70
72
67
12
5
19
39
35
36
40
17
12
25
38
30
21
42
10
6
15
-
-
-
-
-
-
-
15
28
28
30
16
15
15
21
25
24
27
7
8
6
31
32
26
41
7
3
10
37
32
27
37
14
14
13
29
32
34
30
21
22
19
-
-
-
-
-
-
-
-
-
-
-
-
-
-
24
23
19
26
12
10
13
26
28
27
28
21
20
22
62
69
67
70
32
31
34
15
20
23
17
2
3
1
9
8
10
7
14
16
13
37
39
41
38
23
24
22
25
61
61
59
3
6
1
29
25
35
19
26
22
30
76
72
64
79
34
37
32
19
24
28
27
6
6
7
26
26
20
32
6
4
6
31
33
37
33
13
14
11
21
24
20
28
6
6
6
29
30
45
31
15
25
14
-
-
-
-
-
-
-
35
32
25
42
4
2
5
27
32
27
37
4
6
1
17
29
32
25
3
6
3
34
36
41
10
16
23
12
2
6
5
5
3
3
3
36
23
23
23
52
46
57
23
35
65
3
50
46
55
31
35
35
34
28
28
28
..........................................................................................................................................
8
Infant and Child Mortality in India : District Level Estimates

2.9 Page 19

▲back to top


Table 6: Differentials in CMR by Place of Residence & Sex
1991
2001
Ratio of R/U
Ratio of M/F
Ratio of R/U
Ratio of M/F
States/UT
T
M
F
T
R
U
T
M
F
T
R
U
India
1.9 1.8 1.9
0.9
0.9 0.9 1.5 1.6 1.6 1.0 1.0
1.0
Andhra Pradesh
1.9 1.8 1.9
1.0
1.0 1.1 1.5 1.6 1.5 1.1 1.1
1.0
Arunachal Pradesh
2.5 2.6 2.3
1.1
1.0 0.9 1.6 1.5 1.8 1.0 1.0
1.2
Assam
1.6 1.7 1.5
1.0
1.0 0.9 1.5 1.4 1.5 1.0 1.0
1.1
Bihar
1.7 1.7 1.8
0.7
0.7 0.8 1.5 1.4 1.5 0.9 0.9
0.9
Chhattisgarh
-
-
-
-
-
- 1.6 1.6 1.6 1.1 1.1
1.0
Delhi
1.3 1.3 1.3
1.0
0.9 0.9 1.1 1.1 1.1 0.9 1.0
0.9
Goa
1.6 1.5 1.7
1.0
1.0 1.1 1.1 1.1 1.1 1.0 1.0
1.0
Gujarat
1.8 1.8 1.8
0.9
0.9 0.9 1.4 1.4 1.4 1.0 1.0
1.0
Haryana
1.8 1.7 2.0
0.8
0.8 1.0 1.6 1.5 1.6 1.0 0.9
0.9
Himachal Pradesh
1.6 1.7 1.7
1.1
1.1 1.1 1.7 1.7 1.7 1.1 1.1
1.1
Jammu & Kashmir
-
-
-
-
-
- 1.2 1.2 1.2 1.0 1.0
1.0
Jharkhand
-
-
-
-
-
- 1.6 1.6 1.6 1.0 1.0
1.0
Karnataka
1.6 1.6 1.6
1.0
1.0 1.0 1.5 1.5 1.5 1.1 1.0
1.0
Kerala
1.2 1.2 1.2
0.9
0.9 0.9 1.1 1.1 1.1 0.9 0.9
0.9
Madhya Pradesh
1.8 1.8 1.7
0.9
0.9 0.9 1.6 1.7 1.6 1.0 0.9
0.9
Maharashtra
1.9 1.9 1.9
1.0
1.1 1.1 1.5 1.5 1.6 1.1 1.0
1.1
Manipur
1.0 1.0 0.9
1.0
1.1 1.0 1.1 1.1 1.1 1.0 1.0
0.9
Meghalaya
1.8 1.7 1.8
1.0
1.0 1.1 1.8 1.8 1.8 1.0 1.0
1.0
Mizoram
3.8 3.2 4.4
1.1
1.0 1.4 1.9 1.8 2.2 1.0 1.0
1.2
Nagaland
1.0 1.3 0.9
0.9
1.1 0.8 1.1 1.1 1.1 0.8 0.8
0.9
Orissa
1.7 1.6 1.8
0.9
0.9 1.1 1.4 1.5 1.4 1.0 1.0
1.0
Punjab
1.7 1.8 1.7
1.0
1.0 0.9 1.3 1.3 1.3 1.0 0.9
0.9
Rajasthan
1.8 1.8 1.9
0.9
0.8 0.9 1.6 1.6 1.6 0.9 0.9
0.9
Sikkim
1.5 1.5 1.6
1.1
1.1 1.1 1.2 1.2 1.3 1.0 1.0
1.1
Tamil Nadu
1.5 1.4 1.6
0.9
0.9 1.0 1.2 1.1 1.2 1.0 1.0
1.0
Tripura
1.4 1.4 1.5
1.1
1.1 1.2 1.3 1.3 1.3 1.0 1.0
1.0
Uttarakhand
-
-
-
-
-
- 1.4 1.4 1.4 1.0 1.0
1.0
Uttar Pradesh
1.8 1.7 1.9
0.9
0.8 0.9 1.4 1.4 1.5 0.9 0.9
0.9
West Bengal
1.7 1.5 1.8
0.9
0.9 1.1 1.2 1.2 1.2 1.0 1.0
1.0
A & N Island
1.9 2.0 1.7
1.1
1.1 1.0 1.3 1.4 1.2 1.0 1.0
0.9
D & N Haveli
1.8 1.7 1.7
1.1
1.3 1.4 1.7 1.6 2.0 1.1 0.9
1.2
Chandigarh
1.4 1.5 1.3
1.2
1.2 1.1 1.4 1.5 1.3 1.1 1.2
1.1
Daman and Diu
0.7 0.7 0.7
1.1
1.1 1.0 1.1 1.0 1.3 1.2 1.1
1.4
Lakashadweep
1.0 1.3 0.6
1.5
2.0 0.9 1.2 1.2 1.1 1.1 1.1
1.0
Puducherry
1.2 1.2 1.2
1.0
1.1 1.0 1.2 1.2 1.2 1.4 1.1
1.1
..........................................................................................................................................
Infant and Child Mortality in India : District Level Estimates
9

2.10 Page 20

▲back to top


Rural-Urban Differential
The rural-urban differential with respect to IMR is very much wide in north eastern states like Mizoram
(1.9) followed by Arunachal Pradesh(1.6). The states like Delhi and Goa are having least differential(1.0).
Graph-1: Rural-Urban Differential (R/U Ratio) in IMR for Selected States of India
Sex Differential
There is also gender differential with respect to infant mortality as well as child mortality as the M/F ratio
moves in both ways. Female CMR is more than male CMR in states like- Madhya Pradesh, Uttar Pradesh,
Rajasthan, Bihar, Gujarat, Tamil Nadu, Punjab, Delhi, and Nagaland
Female IMR is more than male IMR in the states like-Madhya Pradesh, Orissa, Uttar Pradesh, Rajasthan,
Bihar, Mizoram, Nagaland and Kerala. The gender differential in CMR and IMR in the above states needs
further analysis in terms of other socio-economic and demographic variables available from the Census.
In order to find out the state specific plausible factors affecting CMR and IMR multivariate techniques in
terms of regression analysis may be applied.
Graph-2: Sex Differential (M/F Ratio) in IMR for Selected States of India
..........................................................................................................................................
10
Infant and Child Mortality in India : District Level Estimates

3 Pages 21-30

▲back to top


3.1 Page 21

▲back to top


Graph-3: Infant Mortality Rate by sex,
India, 2001
Graph-4: Child Mortality Rate by sex,
India, 2001
Distribution of Districts by IMR and CMR
Table-7: Distribution of Districts by Infant Mortality Rate (IMR) , 2001
Infant Mortality Rate(IMR)
13-40
41-68
69-96
97 & above
More than National IMR(54)
Equal to National IMR(54)
Less than National IMR(54)
Total
Number of districts
109
273
169
42
338
8
247
593
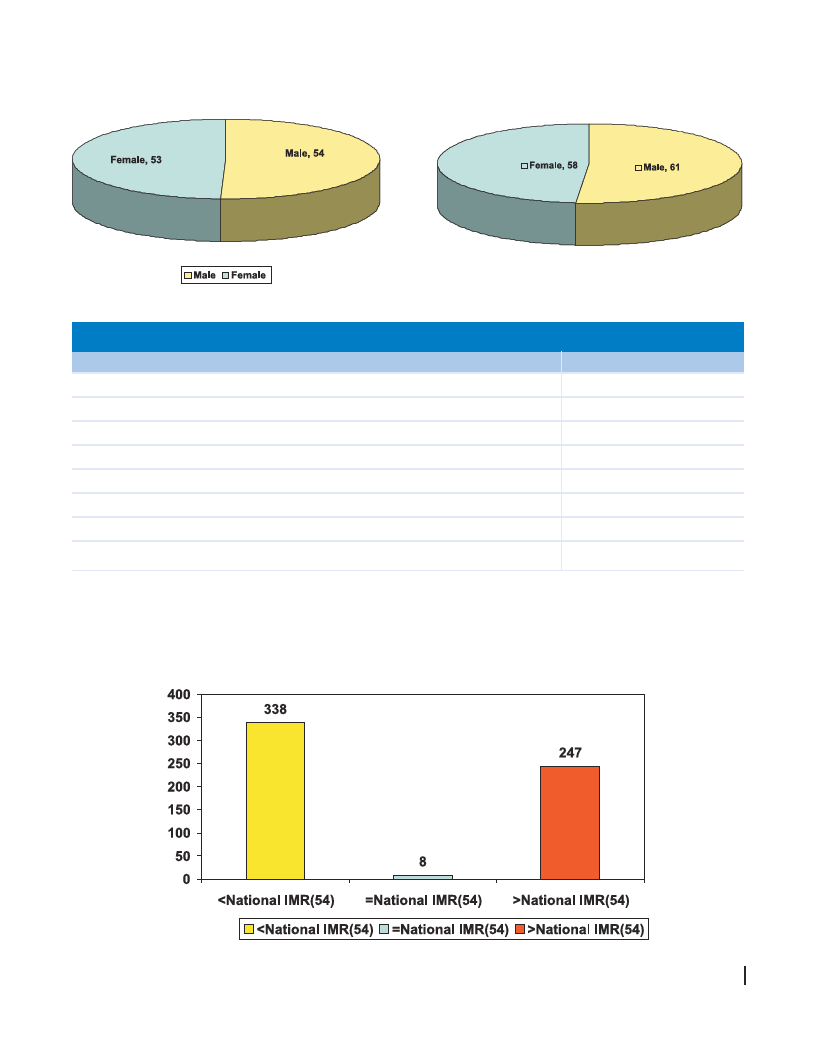
The distribution of districts by IMR shows that there are 42 districts having IMR 97 and above. In case of 8
districts the IMR is equal to the national average of 54 and 338 districts are having IMR more than national
average.
Graph-5: Distribution of Districts by IMR, India, 2001
..........................................................................................................................................
Infant and Child Mortality in India : District Level Estimates
11

3.2 Page 22

▲back to top


Table-8: Ranking of States in Descending Order of IMR, 2001(Total)
State/UT
India
Madhya Pradesh
Orissa
Uttar Pradesh
Rajasthan
Assam
Chhattisgarh
Tripura
Uttarakhand
Arunachal Pradesh
Lakashadweep
West Bengal
Gujarat
Meghalaya
Bihar
Karnataka
Jharkhand
Maharashtra
Jammu & Kashmir
Dadra & Nagar Haveli
Himachal Pradesh
Chandigarh
Tamil Nadu
Andhra Pradesh
Sikkim
Punjab
Andaman & Nicobar Islands
Mizoram
Haryana
Delhi
Nagaland
Daman and Diu
Manipur
Puducherry
Goa
Kerala
Total
54
94
90
84
79
70
68
64
63
61
60
59
59
58
57
54
50
49
47
46
45
44
44
43
43
43
41
41
40
40
39
32
31
28
28
18
Male
54
92
88
82
78
75
72
66
64
64
64
62
60
60
55
57
52
51
48
50
47
47
44
46
44
43
42
40
41
40
36
35
31
30
29
16
Female
53
96
94
86
81
65
64
63
61
59
56
56
58
55
58
51
48
48
47
43
43
40
43
40
42
44
40
42
39
40
42
29
31
27
26
20
..........................................................................................................................................
12
Infant and Child Mortality in India : District Level Estimates

3.3 Page 23

▲back to top


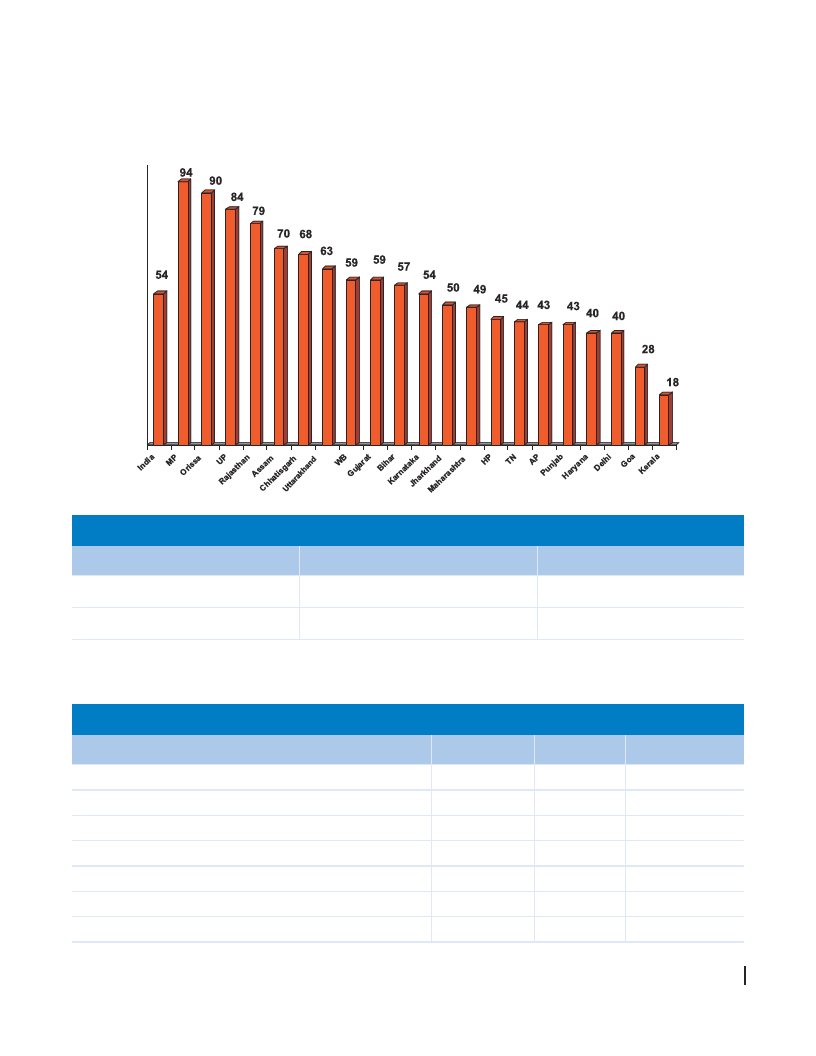
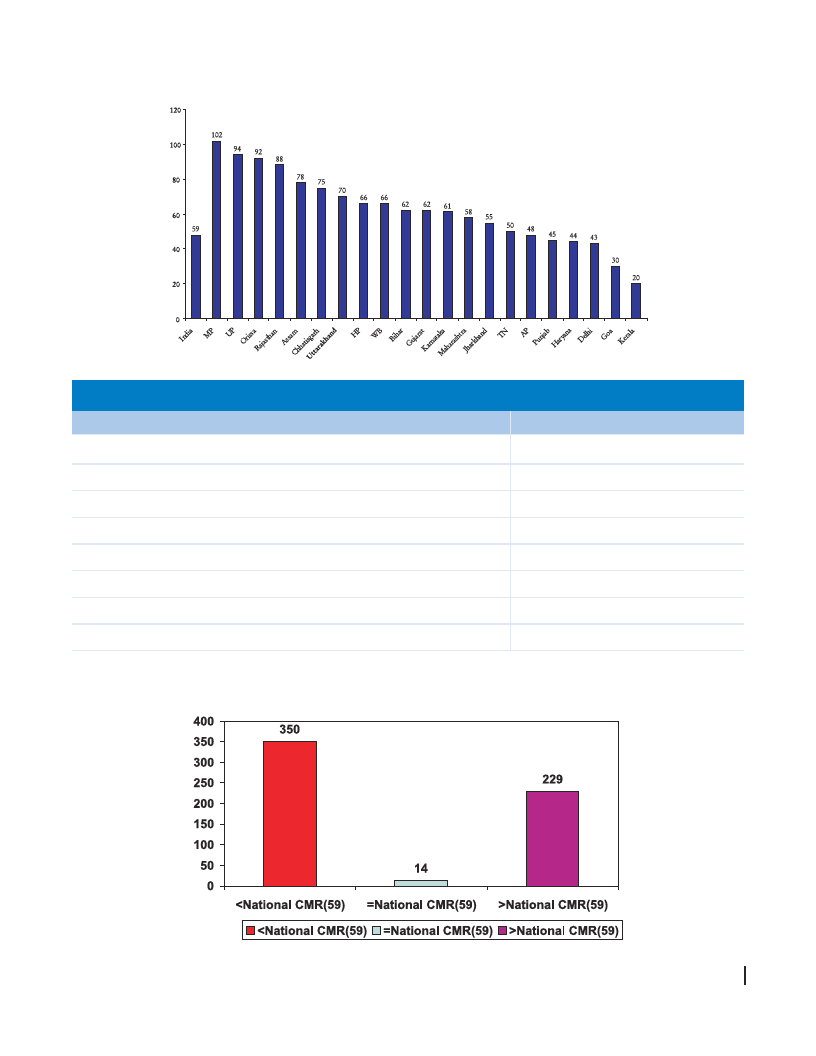
From the table 8 it can be seen that the national IMR is 54. Madhya Pradesh is having the highest IMR (94)
followed by Orissa(90). Kerala is having the lowest IMR(18)
Graph-6: Infant Mortality Rate in Selected States of India, 2001
Maximum
Minimum
Table-9: Districts with Minimum and Maximum Values of IMR, 2001
District
Value
Kandhamal
121
Kottayam
13
Among the 593 districts, Kandhamal district in Orissa is having the highest (121) IMR, where as Kottayam
district in Kerala is having the lowest (13) IMR.
Table-10: Ranking of States in Descending Order of Child Mortality Rate, 2001 (Total)
State/Union Territories
Total
Male
Female
India
59
58
61
Madhya Pradesh
102
99
104
Uttar Pradesh
94
88
100
Orissa
92
94
90
Rajasthan
88
85
92
Assam
78
79
76
Arunachal Pradesh
76
77
75
..........................................................................................................................................
Infant and Child Mortality in India : District Level Estimates
13

3.4 Page 24

▲back to top


State/Union Territories
Chhattisgarh
Tripura
Uttarakhand
Lakashadweep
Himachal Pradesh
West Bengal
Bihar
Gujarat
Karnataka
Meghalaya
Maharashtra
Jharkhand
Dadra & Nagar Haveli
Chandigarh
Sikkim
Tamil Nadu
Andhra Pradesh
Jammu & Kashmir
Andaman & Nicobar Islands
Punjab
Haryana
Delhi
Mizoram
Nagaland
Daman & Diu
Puducherry
Manipur
Goa
Kerala
Total
75
71
70
67
66
66
62
62
61
61
58
55
53
52
51
50
48
48
47
45
44
43
41
40
36
36
32
30
20
Male
78
72
70
70
69
66
57
61
62
62
61
55
54
55
51
50
50
49
48
44
44
41
42
36
39
48
32
30
18
Female
73
71
71
64
63
65
66
63
59
60
56
56
51
48
50
51
47
48
47
46
42
45
41
43
33
35
32
29
21
As per the ranking of states according to Child Mortality Rate, Madhya Pradesh (102) is having the highest
figure followed by Uttar Pradesh (94).The state of Kerala (20) is having the lowest figure preceded by Goa
(30). The national figure is 59.
..........................................................................................................................................
14
Infant and Child Mortality in India : District Level Estimates

3.5 Page 25

▲back to top


Graph-7: Child Mortality Rate in Selected States of India, 2001
Table-11: Distribution of Districts by Child Mortality Rate, 2001
Child Mortality Rate(CMR)
Number of districts
14-46
121
47-79
288
80-112
155
112 & above
27
More than National CMR(59)
350
Equal to National CMR(59)
14
Less than National CMR(59)
229
Total
593
Graph-8: Distribution of Districts by CMR, India 2001
..........................................................................................................................................
Infant and Child Mortality in India : District Level Estimates
15

3.6 Page 26

▲back to top


The distribution of districts by CMR (Table 11) shows that there are 27 districts where the CMR is 112 and
above. In case of 14 districts the CMR is equal to the national average of 59 and 350 districts are having
CMR more than national average.
Maximum
Minimum
Table-12: Districts with Minimum and Maximum Values of CMR
District
Value
East Kameng
141
Kottayam
14
Among the 593 districts, East Kameng district in Arunachal Pradesh is having the highest (141) CMR,
where as Kottayam district in Kerala is having the lowest (14) CMR.
Table-13: District Level Statistics for IMR and CMR in India
Indicators
Median
Percentile 25 Percentile 75 Standard Deviation
Infant Mortality Rate
59
44
77
22.28
Child Mortality Rate
65
49
86
24.78
The median value for IMR and CMR is 59 and 65 respectively per 1000 live births. The district level
variation is quite large, depicting standard deviation at the value of 22 and 25 for IMR and CMR respectively.
The 75 percentile for IMR reveals that a quarter of districts possess the value of IMR above 77 and CMR
above 86. This must be taken as a serious concern by programme managers and policy makers.
..........................................................................................................................................
16
Infant and Child Mortality in India : District Level Estimates

3.7 Page 27

▲back to top


References
Brass, W. 1975, Methods for Estimating Fertility and Mortality from Limited and Defective Data, Occasional
Publication, Laboratories for Population Studies, Chapel Hill, N .C.
International Institute for Population Sciences,1998-99, National Family Health Survey, IIPS, Mumbai and
ORC Macro, Maryland.
International Institute for Population Sciences, 2006, Ranking and Mapping of Districts-Based on Socio-
Economic and Demographic Indicators, IIPS, Mumbai.
National Health Policy, 2002, Ministry of Health and Family Welfare, Government of India, New Delhi.
National Population Policy, 2000, Department of Family Welfare, Ministry of Health and Family Welfare,
Government of India, New Delhi.
Pathak, K.B., Ram, F and Singh, B.S., “A New Method of Estimating Infant and Child Mortality from Data
on Children Ever Born and Children Surviving”, JANASAMKHYA,1988 Dec;6(2):159-68.
Registrar General of India, 1988, Child Mortality Estimates of India, Occasional Paper no.5 of 1988,
Demography Division, Census of India, Ministry of Home Affairs, New Delhi.
S. Irudaya Rajan and P Mohanachandran ,Infant and Child Mortality Estimates-Part I, Economic and
Political Weekly, XXXIII (19),1120-1140, May 9,1998.
United Nations, 1983, Indirect Techniques for Demographic Estimation, Manual X, Department of
International Economic and Social Affairs, Population Studies, No.81,New York.ST/ESA/SER.A/81.
United Nations Children’s Fund, December 2007, The State of the World’s Children 2008, UNICEF,
New York.
..........................................................................................................................................
Infant and Child Mortality in India : District Level Estimates
17

3.8 Page 28

▲back to top


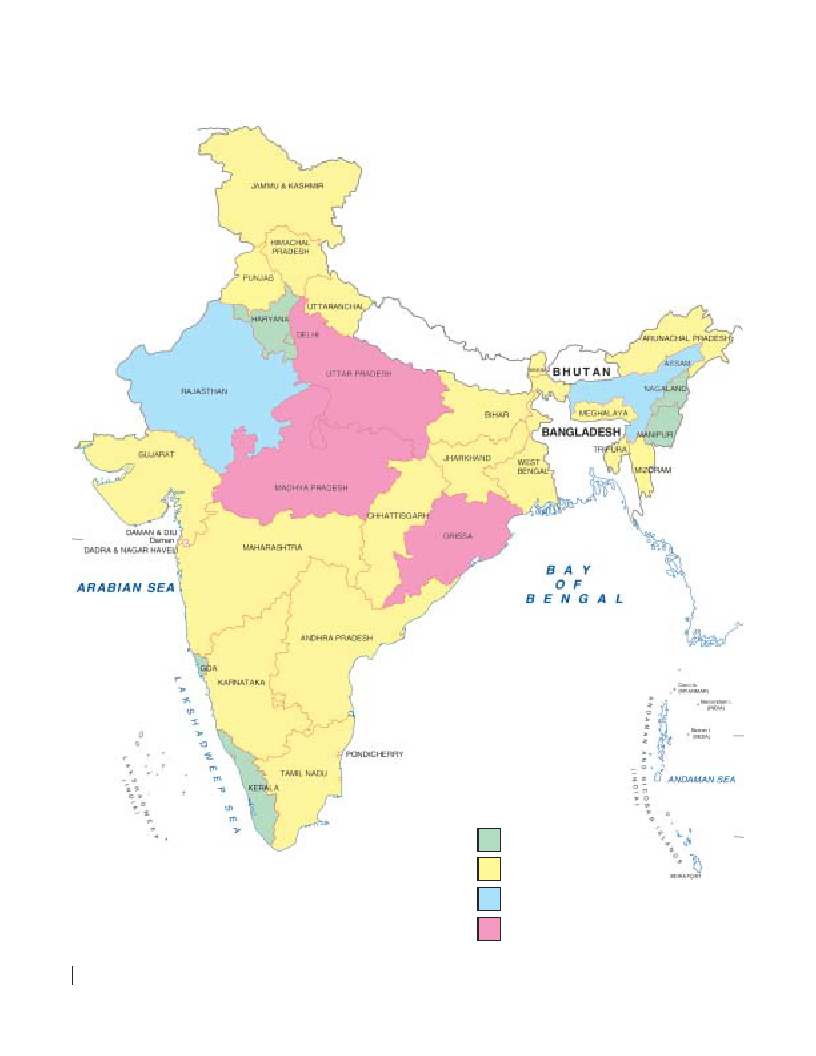
Map 1: Infant Mortality Rate (IMR) in India, 2001
13-40
41-68
69-79
80 and above
..........................................................................................................................................
18
Infant and Child Mortality in India : District Level Estimates

3.9 Page 29

▲back to top


Map 2: Child Mortality Rate (CMR) in India, 2001
14-46
47-79
80-90
91 and above
..........................................................................................................................................
Infant and Child Mortality in India : District Level Estimates
19

3.10 Page 30

▲back to top


4 Pages 31-40

▲back to top


4.1 Page 31

▲back to top


4.2 Page 32

▲back to top


4.3 Page 33

▲back to top


Sr. State/ District
No.
HARYANA
1 Panchkula
2 Ambala
3 Yamunanagar
4 Kurukshetra
5 Kaithal
6 Karnal
7 Panipat
8 Sonipat
9 Jind
10 Fatehabad
11 Sirsa
12 Hisar
13 Bhiwani
14 Rohtak
15 Jhajjar
16 Mahendragarh
17 Rewari
18 Gurgaon
19 Faridabad
UTTARAKHAND
20 Uttarkashi
21 Chamoli
22 Rudraprayag
23 Tehri
24 Dehradun
25 Garhwal
26 Pithoragarh
27 Bageshwar
Table-14 : Infant Mortality Rate (IMR) in Districts of India
IMR 1991
IMR 2001
Total
TM F
Rural
TM F
Urban
TM F
Total
TM F
Rural
T MF
Urban
TM F
-----
- - - - 34 32 36 36
48 49 46 52 56 48 38 32 42 32 34 31 36
52 48 58 65 55 66 31 29 39 35 32 39 45
61 59 62 67 65 69 30 31 28 44 45 42 47
65 58 73 68 58 78 45 56 28 48 43 54 51
50 52 48 55 56 52 31 33 32 39 38 41 42
63 56 71 67 57 78 46 48 44 45 41 50 49
38 42 32 39 40 38 40 42 34 35 38 30 36
67 66 68 70 69 70 67 48 56 48 46 50 51
-----
- - - - 50 49 51 54
60 53 64 59 53 65 58 54 62 41 40 43 45
51 51 50 62 61 64 36 32 38 41 39 43 45
50 47 52 53 52 54 28 23 38 44 43 45 46
52 50 56 56 53 60 36 35 36 38 36 41 43
-----
- - - - 42 39 44 44
57 54 61 60 59 61 37 42 58 45 42 48 47
57 57 58 60 58 61 37 36 37 42 43 41 44
60 59 61 62 59 64 50 58 38 47 45 50 52
50 47 52 60 59 62 36 32 38 37 35 40 44
33 40 30 28 32
46 34 23 20 27
37 52 28 27 30
46 49 23 25 21
46 57 40 42 36
40 45 28 27 30
44 55 37 38 36
39 33 27 26 28
49 54 34 32 36
51 56 32 33 31
44 47 40 38 43
43 48 27 24 31
45 47 24 22 27
40 47 29 27 31
41 48 33 31 35
45 51 30 26 33
44 43 32 34 31
48 56 36 42 30
39 49 31 30 33
98 109 93 99 105 93 54 40 65 82 85 79 85
66 75 56 68 77 59 50 72 31 60 65 54 62
-----
- - - - 59 61 56 59
73 80 67 74 80 68 58 61 48 60 62 58 61
59 64 53 75 82 66 37 38 36 54 55 53 59
48 39 57 50 41 60 22 28 21 47 37 52 46
77 84 70 77 84 70 78 76 80 57 65 51 59
-----
- - - - 53 62 43 53
89 81 43 38 47
67 57 40 59 30
61 56 64 92 26
63 59 51 53 47
64 56 34 36 32
40 50 20 26 18
65 52 56 54 60
63 42 43 36 50
..........................................................................................................................................
Infant and Child Mortality in India : District Level Estimates
23

4.4 Page 34

▲back to top


IMR 1991
IMR 2001
Sr. State/ District
No.
Total
TM F
Rural
TM F
Urban
TM F
Total
TM F
Rural
T MF
Urban
TM F
28 Almora
63 62 63 64 63 65 54 63 45 48 49 47 48 49 47 44 47 38
29 Champawat
-----
- - - - 74 79 69 78 82 74 50 60 39
30 Nainital
85 79 92 92 84 100 67 65 70 67 60 75 74 65 84 48 45 54
31 Udham Singh Nagar - - - - -
- - - - 68 70 65 71 74 68 60 61 60
32 Hardwar
73 72 75 80 80 80 50 42 58 70 68 72 77 75 78 40 38 42
ASSAM
33 Kokrajhar
73 67 79 71 68 74 121 61 177 68 65 70 70 66 72 54 50 57
34 Dhubri
112 117 108 114 119 109 93 90 96 96 101 87 97 103 91 75 71 76
35 Goalpara
92 93 91 94 94 95 56 70 42 78 85 70 78 82 75 50 61 40
36 Bongaigaon
104 106 101 102 104 98 137 129 147 87 92 81 89 93 84 45 43 47
37 Barpeta
99 102 95 100 104 96 66 64 69 80 87 75 82 88 78 56 57 54
38 Kamrup
72 71 72 83 88 80 44 36 52 60 65 55 64 69 59 41 35 47
39 Nalbari
84 88 79 85 90 80 56 53 60 65 71 60 66 73 62 42 41 44
40 Darrang
98 99 98 100 100 100 52 60 44 89 95 83 90 96 85 50 56 42
41 Marigaon
103 105 102 104 105 103 84 93 73 88 92 84 90 93 86 77 86 69
42 Nagaon
85 86 83 87 88 86 54 60 48 76 81 70 78 82 72 51 56 46
43 Sonitpur
71 69 73 72 71 74 51 47 54 64 66 63 66 67 65 48 45 51
44 Lakhimpur
93 92 94 96 95 96 88 76 99 75 74 76 76 76 77 74 63 84
45 Dhemaji
90 104 76 91 105 77 101 64 122 74 80 68 76 82 69 56 63 50
46 Tinsuki
63 61 64 64 63 66 48 50 47 48 52 43 50 54 45 32 35 30
47 Dibrugarh
53 54 51 55 55 55 40 48 30 41 44 37 42 45 39 34 37 28
48 Sibsagar
65 71 60 68 73 63 31 29 36 64 68 58 66 71 61 30 27 34
49 Jorhat
46 41 51 47 39 54 42 51 40 42 36 48 45 38 51 37 38 36
50 Golaghat
68 72 63 70 72 63 44 41 45 54 58 50 55 59 51 40 40 39
51 Karbi Anglong
79 70 88 81 73 89 67 47 88 71 65 76 73 67 77 55 45 66
52 North Cacher Hills 69 74 62 77 82 72 34 47 22 58 60 56 60 62 59 32 40 21
53 Cacher
86 89 85 89 92 87 62 55 67 75 80 70 77 81 73 58 53 62
54 Karimganj
99 104 93 100 106 93 55 56 50 86 89 82 87 90 84 49 51 48
55 Hailakandi
95 102 92 97 104 94 55 61 49 79 84 78 80 85 80 49 52 47
..........................................................................................................................................
24
Infant and Child Mortality in India : District Level Estimates

4.5 Page 35

▲back to top


IMR 1991
IMR 2001
Sr. State/ District
No.
RAJASTHAN
56 Ganganagar
57 Hanumangarh
58 Bikaner
59 Churu
60 Jhunjhunun
61 Alwar
62 Bharatpur
63 Dhaulpur
64 Karauli
65 Sawai Madhopur
66 Dausa
67 Jaipur
68 Sikar
69 Nagaur
70 Jodhpur
71 Jaisalmer
72 Barmer
73 Jalor
74 Sirohi
75 Pali
76 Ajmer
77 Tonk
78 Bundi
79 Bhilwara
80 Rajsamand
81 Udaipur
82 Dungarpur
83 Banswara
Total
TM F
Rural
TM F
Urban
TM F
Total
TM F
Rural
T MF
Urban
TM F
55 53 58 57 54 61 44 47 40 53 51 56 55 53 58 42 46 39
-----
- - - - 61 59 63 62 60 64 51 52 50
59 58 59 71 72 70 39 37 42 56 56 56 58 57 59 38 36 40
65 61 72 68 62 74 62 58 67 63 59 65 67 60 71 57 55 60
61 62 60 60 57 64 65 81 40 55 56 55 58 55 60 52 62 32
82 85 80 86 88 82 63 54 57 74 71 77 74 72 77 55 53 56
83 75 93 87 79 97 63 54 72 76 71 81 76 72 82 60 53 65
100 89 112 - -
- 65 60 71 85 74 96 88 75 101 60 53 66
-----
- - - - 85 76 95 87 77 97 61 54 69
84 76 92 89 82 97 54 43 63 82 75 87 85 80 91 50 40 59
-----
- - - - 83 79 87 83 79 87 67 62 72
69 68 70 81 78 84 46 49 43 68 67 69 80 76 83 45 47 42
60 55 65 63 58 68 47 42 53 58 54 61 59 57 60 45 40 51
74 69 80 78 71 84 54 55 53 72 68 75 74 70 77 52 53 50
72 67 78 83 79 86 54 45 63 70 66 74 72 67 76 53 44 60
80 65 95 91 76 109 42 32 51 70 64 76 79 68 91 39 30 48
94 99 89 98 102 93 72 83 59 78 82 76 83 85 80 62 66 57
92 85 98 97 90 103 49 43 53 88 84 92 91 87 94 47 42 51
101 102 101 110 106 115 42 54 39 87 87 86 92 88 96 40 44 38
102 98 106 112 107 117 70 69 72 102 96 106 107 104 110 64 59 68
85 83 87 100 96 105 60 64 56 81 81 81 92 91 92 57 58 55
97 100 94 104 107 101 68 66 70 94 96 91 101 102 100 63 65 62
85 83 86 88 88 88 65 54 75 81 80 81 84 83 85 55 53 57
97 100 94 107 111 101 64 59 67 95 98 91 102 105 98 61 56 64
-----
- - - - 101 101 101 102 102 102 82 86 77
100 106 93 110 118 102 50 47 54 96 102 91 105 109 99 45 43 48
103 103 102 106 107 105 61 53 70 97 99 94 103 105 102 59 52 66
107 112 102 111 116 106 43 53 30 104 108 99 107 113 101 40 49 29
..........................................................................................................................................
Infant and Child Mortality in India : District Level Estimates
25

4.6 Page 36

▲back to top


IMR 1991
IMR 2001
Sr. State/ District
No.
Total
TM F
Rural
TM F
Urban
TM F
Total
TM F
Rural
T MF
Urban
TM F
84 Chittaurgarh
105 109 101 112 114 108 71 80 61 99 104 95 106 109 104 68 74 60
85 Kota
79 75 83 93 91 97 47 41 54 71 71 72 81 81 81 45 40 49
86 Baran
-----
- - - - 88 86 89 90 89 92 62 64 60
87 Jhalawar
88 90 87 96 97 94 48 49 46 81 81 81 83 83 82 46 47 45
DELHI
88 North West
-----
- - - - 40 40 40 43 43 42 40 39 41
89 North
-----
- - - - 34 35 34 42 45 38 34 34 34
90 North East
-----
- - - - 41 42 39 41 47 35 41 41 40
91 East
-----
- - - - 39 38 39 66 64 69 39 38 39
92 New Delhi
-----
- - - - 37 39 34 0
0 0 37 39 34
93 Central
-----
- - - - 32 32 32 0
0 0 32 32 33
94 West
-----
- - - - 41 41 42 49 55 41 41 39 43
95 South West
-----
- - - - 38 38 39 38 35 40 38 38 39
96 South
-----
- - - - 42 42 41 39 39 39 42 42 42
UTTAR PRADESH
97 Saharanpur
76 76 76 82 81 83 51 56 44 74 72 76 80 79 81 46 51 41
98 Muzaffarnagar
93 86 100 96 91 104 78 69 87 75 72 77 78 75 81 65 62 68
99 Bijnor
87 84 89 94 95 93 57 51 62 72 73 71 77 77 76 55 50 58
100 Moradabad
87 85 91 97 92 101 57 59 54 73 70 76 82 78 85 43 43 44
101 Rampur
101 91 111 104 95 112 84 67 101 95 89 101 100 93 106 74 65 82
102 Jyotiba Phule Nagar - - - - -
- - - - 77 76 78 82 81 83 54 54 53
103 Meerut
70 67 72 77 71 83 56 59 53 64 60 68 74 69 77 53 55 50
104 Baghpat
-----
- - - - 60 58 63 63 60 66 49 51 47
105 Ghaziabad
57 55 60 64 55 74 49 54 44 55 51 59 62 53 70 46 48 43
106 Gautam Buddha
Nagar
-----
- - - - 67 62 72 70 63 77 65 62 68
107 Bulandshahr
75 73 78 79 76 82 61 61 60 69 65 73 72 68 76 51 53 50
108 Aligarh
90 83 97 96 88 104 71 68 75 87 80 93 91 86 94 66 64 69
109 Hathras
-----
- - - - 93 87 100 96 88 105 78 76 80
110 Mathura
71 68 75 75 70 79 59 60 59 70 66 73 74 68 78 55 53 58
..........................................................................................................................................
26
Infant and Child Mortality in India : District Level Estimates

4.7 Page 37

▲back to top


Sr. State/ District
No.
111 Agra
112 Firozabad
113 Etah
114 Mainpuri
115 Budaun
116 Bareilly
117 Pilibhit
118 Shahjahanpur
119 Kheri
120 Sitapur
121 Hardoi
122 Unnao
123 Lucknow
124 Rae Bareli
125 Farrukhabad
126 Kannauj
127 Etawah
128 Auraiya
129 Kanpur Dehat
130 Kanpur Nagar
131 Jalaun
132 Jhansi
133 Lalitpur
134 Hamirpur
135 Mahoba
136 Banda
137 Chitrakoot
138 Fatehpur
139 Pratapgarh
IMR 1991
IMR 2001
Total
TM F
Rural
TM F
Urban
TM F
Total
TM F
Rural
T MF
Urban
TM F
67 61 75 81 74 89 42 36 49 65 60 69 79 72 85 40 35 46
99 89 111 105 94 118 79 71 86 87 83 92 91 82 99 77 70 82
116 103 129 120 106 134 85 78 92 104 98 109 107 100 114 81 76 85
87 75 100 90 78 103 65 56 75 78 73 84 82 76 87 60 54 65
134 132 136 141 138 144 92 94 89 110 106 115 116 114 120 76 80 72
98 92 104 107 103 115 61 60 60 81 80 82 91 87 96 57 56 57
100 94 106 106 100 111 57 46 64 94 87 99 98 92 103 48 42 53
116 106 126 121 115 128 86 58 104 100 94 105 106 100 112 72 56 86
82 85 77 85 84 89 44 36 55 76 75 76 81 80 83 42 35 48
100 96 101 103 101 104 60 52 68 97 95 98 101 100 101 54 50 57
123 121 125 129 126 131 48 57 39 106 104 109 110 107 114 46 51 38
98 94 104 104 101 108 55 44 68 91 90 91 95 94 95 50 42 57
68 64 73 101 93 108 38 37 38 66 62 69 87 84 91 35 33 36
111 108 115 113 110 117 84 80 88 91 89 94 94 92 97 68 63 72
92 88 97 97 93 101 65 60 71 86 82 89 89 85 92 63 58 68
-----
- - - - 82 79 84 84 81 87 69 64 73
96 89 103 101 93 109 55 53 57 80 76 85 84 79 90 50 48 53
-----
- - - - 79 78 80 82 81 83 59 57 63
88 81 95 90 84 96 51 45 57 80 75 86 82 79 87 48 42 52
40 42 38 64 64 63 35 36 30 38 40 37 61 60 62 32 34 29
93 89 98 98 97 99 70 51 90 86 83 89 91 87 94 59 47 70
86 81 90 96 91 102 60 58 64 82 78 87 94 88 98 58 55 62
105 102 109 113 109 116 43 40 44 99 95 104 109 105 113 40 36 43
97 92 102 102 97 108 63 59 66 79 74 86 84 78 91 60 57 63
-----
- - - - 88 86 89 92 91 93 66 62 70
89 89 89 94 95 93 40 34 47 86 85 87 90 88 92 38 33 44
-----
- - - - 94 92 96 97 94 100 67 68 65
104 108 100 108 110 105 59 72 44 89 88 90 92 90 94 55 66 42
100 93 107 101 96 106 78 40 120 84 78 89 86 79 91 50 38 60
..........................................................................................................................................
Infant and Child Mortality in India : District Level Estimates
27

4.8 Page 38

▲back to top


IMR 1991
IMR 2001
Sr. State/ District
No.
Total
TM F
Rural
TM F
Urban
TM F
Total
TM F
Rural
T MF
Urban
TM F
140 Kaushambi
-----
- - - - 94 93 95 96 94 97 72 72 70
141 Allahabad
103 98 110 104 100 108 98 79 118 100 96 103 103 99 107 86 73 98
142 Barabanki
89 83 95 92 85 99 58 60 54 87 80 91 90 84 95 54 58 51
143 Faizabad
75 74 77 77 75 79 47 50 44 70 69 71 73 72 74 45 46 43
144 Ambedkar Nagar
-----
- - - - 74 74 74 75 75 74 56 54 58
145 Sultanpur
103 90 116 105 92 119 64 61 65 92 84 99 94 84 102 55 54 56
146 Bahraich
119 117 121 120 118 123 106 114 98 99 97 100 103 100 105 84 91 77
147 Shrawasti
-----
- - - - 95 87 103 98 89 106 73 75 71
148 Balrampur
-----
- - - - 107 101 113 109 101 117 80 71 90
149 Gonda
110 97 123 109 99 121 106 51 151 92 79 105 95 82 107 47 49 44
150 Siddharthnagar
103 96 110 104 97 111 74 65 86 92 88 96 93 87 99 71 62 78
151 Basti
91 91 92 93 91 95 65 81 46 77 75 79 78 76 80 56 67 43
152 Sant Kabir Nagar
-----
- - - - 83 83 84 84 83 85 66 62 70
153 Maharajganj
104 99 110 106 100 111 82 80 84 99 99 98 99 99 100 80 78 82
154 Gorakhpur
68 67 70 72 70 74 48 52 44 59 59 58 61 62 60 46 48 42
155 Kushinagar
-----
- - - - 69 69 68 69 70 69 53 54 53
156 Deoria
87 77 98 90 79 101 46 40 53 75 72 79 78 74 83 43 38 49
157 Azamgarh
88 82 95 90 84 97 59 61 56 81 81 82 82 82 82 56 58 55
158 Mau
69 71 68 71 71 70 60 62 58 58 59 56 59 60 57 53 54 53
159 Ballia
36 36 38 37 33 39 36 41 29 35 32 36 35 32 37 34 38 28
160 Jaunpur
81 80 82 82 81 83 58 58 57 79 76 81 80 77 82 55 54 55
161 Ghazipur
62 58 65 61 57 66 65 72 59 59 55 62 60 55 63 56 54 58
162 Chandauli
-----
- - - - 74 72 76 76 73 78 56 56 56
163 Varanasi
75 65 85 78 67 89 53 48 58 74 64 80 76 65 84 51 46 55
164 Sant Ravidas Nagar - - - - -
Bhadohi
- - - - 96 91 102 99 92 106 71 69 72
165 Mirzapur
91 77 105 93 80 107 72 55 89 82 74 90 88 78 97 62 54 71
166 Sonbhadra
84 84 81 86 88 84 39 24 45 82 84 81 85 86 82 32 23 41
..........................................................................................................................................
28
Infant and Child Mortality in India : District Level Estimates

4.9 Page 39

▲back to top


IMR 1991
IMR 2001
Sr. State/ District
No.
Total
TM F
Rural
TM F
Urban
TM F
Total
TM F
Rural
T MF
Urban
TM F
BIHAR
167 Pashchim Champaran 73 62 83 75 65 85 50 36 64 57 50 65 60 52 69 41 33 51
168 Purba Champaran 66 53 81 67 53 82 66 53 81 59 51 66 64 52 67 56 51 62
169 Sheohar
-----
- - - - 72 65 79 70 65 76 55 53 58
170 Sitamarhi
95 77 116 98 78 114 51 47 54 74 57 92 77 59 95 46 45 47
171 Madhubani
72 58 85 71 58 85 72 64 79 59 50 68 60 51 70 53 44 62
172 Supaul
-----
- - - - 57 55 59 56 53 59 59 59 59
173 Araria
67 63 71 78 80 74 61 60 63 65 62 69 76 78 73 59 57 60
174 Kishanganj
95 96 100 99 98 103 61 62 60 77 74 79 80 79 82 58 60 55
175 Purnia
77 70 85 79 70 89 56 66 44 63 61 65 66 62 65 45 49 42
176 Katihar
89 89 90 93 91 95 51 60 42 71 70 73 74 73 76 39 35 32
177 Madhepura
82 70 94 82 71 93 78 54 101 60 49 71 63 51 74 48 47 49
178 Saharsa
77 66 89 79 68 91 57 38 67 57 46 68 59 50 71 42 34 51
179 Darbhanga
74 59 90 76 57 92 48 40 54 60 54 69 63 55 73 44 39 48
180 Muzaffarpur
72 66 79 75 67 83 46 49 43 64 62 66 66 64 68 37 34 40
181 Gopalganj
48 45 51 48 46 52 34 26 42 46 44 48 47 45 48 32 25 39
182 Siwan
64 54 74 65 54 76 47 47 47 48 42 55 50 44 59 31 34 28
183 Saran
75 64 86 54 57 65 58 43 137 56 50 63 47 47 48 40 42 38
184 Vaishali
51 42 60 51 42 61 44 40 44 48 40 56 50 41 57 35 34 36
185 Samastipur
69 57 83 69 58 82 65 51 75 54 46 63 58 50 65 47 40 55
186 Begusarai
73 61 86 75 63 89 45 41 50 58 51 66 59 53 68 35 35 34
187 Khagaria
62 62 63 65 64 67 18 24 17 52 49 53 52 49 54 17 18 17
188 Bhagalpur
70 62 77 71 63 80 54 54 53 52 45 60 55 47 64 40 39 40
189 Banka
-----
- - - - 56 54 59 58 56 60 39 35 42
190 Munger
69 58 80 71 60 82 56 41 70 55 44 65 57 46 68 45 37 52
191 Lakhisarai
-----
- - - - 60 60 61 61 61 62 54 50 58
192 Sheikhpura
-----
- - - - 62 57 68 63 57 69 52 51 53
193 Nalanda
71 62 82 71 63 81 60 54 64 62 59 65 62 60 65 48 48 48
194 Patna
56 50 63 56 54 70 50 46 56 50 47 54 54 52 57 36 35 37
..........................................................................................................................................
Infant and Child Mortality in India : District Level Estimates
29

4.10 Page 40

▲back to top


Sr. State/ District
No.
195 Bhojpur
196 Buxar
197 Kaimur (Bhabua)
198 Rohtas
199 Jehanabad
200 Aurangabad
201 Gaya
202 Nawada
203 Jamui
SIKKIM
204 North
205 West
206 South
207 East
NAGALAND
208 Mon
209 Tuensang
210 Mokokchung
211 Zunheboto
212 Wokha
213 Dimapur
214 Kohima
215 Phek
MANIPUR
216 Senapati
217 Tamenglong
218 Churachandpur
219 Bishnupur
220 Thoubal
IMR 1991
IMR 2001
Total
TM F
Rural
TM F
Urban
TM F
Total
TM F
Rural
T MF
Urban
TM F
57 47 69 58 47 70 48 41 56 55 44 63 56 46 65 37 37 37
-----
- - - - 53 50 55 54 51 57 46 46 47
-----
- - - - 68 68 69 69 68 70 23 23 24
68 60 76 67 59 76 72 62 81 55 52 58 56 53 59 52 46 51
70 64 75 71 64 78 54 65 47 60 58 61 61 60 62 50 56 45
68 58 77 68 58 79 61 56 66 63 52 71 66 55 74 54 53 54
75 64 86 77 66 89 58 50 66 59 57 66 60 59 68 46 36 54
73 61 85 74 63 87 43 30 54 59 50 70 60 50 71 36 28 44
-----
- - - - 58 56 61 58 56 61 43 46 40
63 67 59 63 67 59 67 79 55 51 56 46 49
67 67 68 67 67 66 84 73 90 64 63 65 53
60 57 62 60 56 64 62 65 61 48 45 52 51
50 56 48 51 58 51 43 47 39 43 42 43 46
52 45 57 61 52
54 51 76 70 80
51 50 42 44 39
47 45 39 41 37
54 46 58 57 56 59 27 19 36 34 30 40 37
67 62 74 68 61 75 65 54 75 48 42 54 48
34 36 26 38 41 36 21 21 20 30 35 24 36
51 54 50 53 47 55 61 58 65 46 41 52 46
54 55 53 55 54 55 51 56 44 40 38 42 42
54 54 54 55 57 53 51 47 56 38 38 38 38
42 38 45 43 33 45 33 23 41 38 35 41 40
-----
- - - - 35 29 40 35
34 42 26 18 34
43 54 42 34 54
39 34 20 20 19
41 52 52 45 60
40 44 29 34 25
37 38 39 42 37
36 42 31 28 35
30 40 30 19 38
46 45 47 46 45 47 - - - 42 39 45 42
42 38 47 42 38 47 - - - 40 36 43 40
28 27 29 28 27 29 22 25 22 26 26 27 26
28 28 30 29 29 26 31 28 40 27 27 26 27
44 46 42 36 37 35 60 65 56 27 27 26 26
39 45 0 0 0
36 43 0 0 0
26 27 0 0 0
28 26 30 25 34
27 25 27 26 29
..........................................................................................................................................
30
Infant and Child Mortality in India : District Level Estimates

5 Pages 41-50

▲back to top


5.1 Page 41

▲back to top


Sr. State/ District
No.
221 Imphal West
222 Imphal East
223 Ukhrul
224 Chandel
MIZORAM
225 Mamit
226 Kolasib
227 Aizawl
228 Champhai
229 Serchhip
230 Lunglei
231 Lawngtlai
232 Saiha
TRIPURA
233 West Tripura
234 South Tripura
235 Dhalai
236 North Tripura
MEGHALAYA
237 West Garo Hills
238 East Garo Hills
239 South Garo Hills
240 West Khasi Hills
241 Ri Bhoi
242 East Khasi Hills
243 Jaintia Hills
WEST BENGAL
244 Darjiling
245 Jalpaiguri
IMR 1991
IMR 2001
Total
TM F
Rural
TM F
Urban
TM F
Total
TM F
Rural
T MF
Urban
TM F
-----
- - - - 23 24 22 23 24 22 23 24 22
-----
- - - - 29 30 29 28 30 27 31 28 35
42 39 44 42 39 44 - - - 36 31 41 36 31 41 0 0 0
-----
- - - - 34 34 34 37 38 36 32 31 33
-----
- - - - 47 49 45 51
-----
- - - - 41 43 39 48
50 52 49 76 82 73 30 35 27 34 36 32 54
-----
- - - - 31 32 31 35
-----
- - - - 34 38 29 40
63 64 58 80 86 74 32 36 30 44 43 46 59
-----
- - - - 57 55 58 57
-----
- - - - 28 30 25 33
55 47 23 21 26
50 45 34 32 36
58 51 24 22 26
34 35 24 24 24
47 33 27 28 27
58 60 27 25 29
55 58 0 0 0
36 30 18 19 18
68 74 62 72 77 66 54 55 52 56 58 54 56
79 85 74 80 86 74 66 72 62 68 68 67 69
95 102 86 95 103 86 94 93 95 69 73 65 70
-----
- - - - 78 83 74 79
58 54 52 54 50
69 68 52 56 48
74 67 43 54 31
84 76 72 70 73
90 92 88 94 96 91 56 58 55 73 74 76 77
92 92 91 94 95 93 59 58 59 69 71 68 75
-----
- - - - 72 67 77 74
64 69 59 63 68 58 74 83 63 52 50 55 55
-----
- - - - 47 48 45 47
62 63 60 69 71 67 44 45 45 44 47 42 49
76 77 74 78 80 76 51 51 52 59 62 55 61
79 77 38 36 39
76 73 40 38 41
68 79 65 66 64
53 57 52 52 38
49 46 37 47 26
52 47 34 34 34
65 57 32 30 34
56 54 58 59 57 62 43 41 44 55 52 57 57
76 80 72 79 75 83 52 53 52 69 72 65 70
55 60 41 40 43
73 67 50 51 50
..........................................................................................................................................
Infant and Child Mortality in India : District Level Estimates
31

5.2 Page 42

▲back to top


IMR 1991
IMR 2001
Sr. State/ District
No.
246 Koch Bihar
Total
TM F
Rural
TM F
Urban
TM F
92 92 91 93 93 93 47 56 34
Total
TM F
76 79 72
Rural
T MF
76 79 72
Urban
TM F
41 50 33
247 Uttar Dinajpur
-----
- - - - 64 67 61 66 70 62 39 39 40
248 Dakshin Dinajpur
-----
- - - - 77 80 74 78 81 75 61 62 60
249 Maldah
98 91 106 101 93 109 60 55 63 80 75 85 83 79 85 54 50 58
250 Murshidabad
74 74 75 76 76 76 56 52 61 67 71 64 69 72 65 54 50 57
251 Birbhum
76 74 78 77 75 81 78 64 82 61 64 58 61 65 58 60 57 64
252 Barddhaman
54 53 54 58 56 60 44 44 44 52 50 53 56 54 58 42 43 41
253 Nadia
71 74 72 72 72 72 64 60 69 62 65 58 62 65 58 59 59 58
254 North Twenty Four 68 63 73 75 70 80 54 48 57 59 61 55 61
Parganas
63 59 50 47 53
255 Hugli
36 36 36 38 39 37 28 27 29 35 35 35 37 38 36 27 26 28
256 Bankura
55 53 59 58 55 61 27 27 26 50 52 47 50 52 48 25 26 24
257 Puruliya
59 59 57 60 66 58 34 33 39 51 53 49 53 54 51 32 32 31
258 Medinipur
65 63 66 65 65 69 38 39 38 51 53 49 51 53 49 36 37 35
259 Haora
43 42 47 52 51 63 25 26 32 41 41 43 46 49 43 23 25 22
260 Kolkata
25 24 26 - -
- 25 24 26 55 55 56 0
0 0 20 19 21
261 South Twenty Four 80 72 89 90 73 90 71 58 81 65 62 69 67
Parganas
63 71 57 57 58
JHARKHAND
262 Garhwa
-----
- - - - 65 65 65 66 65 66 36 43 29
263 Palamu
91 80 101 91 80 102 86 85 86 75 75 76 77 76 78 55 54 57
264 Chatra
-----
- - - - 60 59 62 62 60 63 32 32 31
265 Hazaribag
58 57 59 60 60 60 86 38 56 46 50 42 49 54 45 33 31 36
266 Kodarma
-----
- - - - 46 49 41 47 51 43 35 40 29
267 Giridih
74 73 75 65 57 72 53 58 47 56 57 55 58 55 60 38 39 37
268 Deoghar
91 80 102 93 83 102 76 56 100 57 58 56 60 61 59 49 48 30
269 Godda
65 63 69 67 64 70 36 43 29 54 53 54 54 53 55 31 34 28
270 Sahibganj
87 86 88 88 86 91 56 74 32 69 70 67 70 72 68 50 52 38
271 Pakaur
65 66 65 68 68 68 18 21 16 56 57 54 56 58 54 17 18 16
272 Dumka
-----
- - - - 47 48 45 48 49 46 36 39 34
..........................................................................................................................................
32
Infant and Child Mortality in India : District Level Estimates

5.3 Page 43

▲back to top


IMR 1991
IMR 2001
Sr. State/ District
No.
273 Dhanbad
Total
TM F
Rural
TM F
Urban
TM F
28 26 32 27 22 32 31 31 30
Total
TM F
27 24 30
Rural
T MF
26 21 30
Urban
TM F
29 29 28
274 Bokaro
-----
- - - - 37 37 37 43 44 41 28 28 29
275 Ranchi
56 59 43 67 79 61 42 32 59 45 48 41 52 57 47 34 30 39
276 Lohardaga
77 68 86 79 69 89 57 52 62 59 50 69 62 54 71 35 32 39
277 Gumla
89 88 95 90 91 88 38 33 39 60 64 57 62 65 58 35 31 38
278 Pashchimi Singhbhum 66 63 71 66 62 73 48 41 56 54 56 51 58 60 55 34 36 33
279 Purbi Singhbhum
38 35 40 48 42 53 24 26 22 36 34 38 46 40 50 22 24 20
ORISSA
280 Bargarh
109 97 122 119 105 132 59 54 63 74 82 65 74 83 66 66 72 58
281 Jharsuguda
-----
- - - - 61 64 57 65 70 60 53 56 50
282 Sambalpur
-----
- - - - 90 83 98 96 86 107 54 50 57
283 Debagarh
-----
- - - - 95 98 93 95 97 92 104 102 105
284 Sundargarh
87 85 89 101 101 101 60 53 68 73 77 70 83 88 78 54 50 58
285 Kendujhar
104 103 104 107 105 109 80 90 69 86 89 84 89 92 88 66 70 61
286 Mayurbhanj
81 75 88 81 73 89 83 103 58 65 64 67 67 66 70 59 62 55
287 Baleshwar
151 115 181 155 116 197 106 103 110 73 75 70 74 76 72 56 59 52
288 Bhadrak
-----
- - - - 73 76 70 73 75 70 74 79 69
289 Kendrapara
-----
- - - - 72 74 70 72 74 70 67 66 69
290 Jagatsinghapur
-----
- - - - 66 69 64 67 71 64 58 53 64
291 Cuttack
114 116 112 118 120 116 78 86 70 76 78 71 80 82 79 65 67 64
292 Jajapur
-----
- - - - 68 71 65 68 71 66 56 61 51
293 Dhenkanal
106 104 107 107 105 109 96 100 91 87 88 85 89 89 87 75 78 71
294 Anugul
-----
- - - - 78 80 76 81 84 78 58 57 60
295 Nayagarh
-----
- - - - 89 91 87 90 91 88 74 91 56
296 Khordha
-----
- - - - 71 72 70 76 76 75 65 64 65
297 Puri
106 102 109 112 108 116 70 74 65 87 84 91 89 86 94 65 66 64
298 Ganjam
104 113 102 109 112 107 68 65 71 86 89 85 90 91 90 64 64 64
299 Gajapati
-----
- - - - 116 121 111 121 126 117 54 62 44
300 Kandhamal
-----
- - - - 121 127 114 123 129 117 72 76 68
..........................................................................................................................................
Infant and Child Mortality in India : District Level Estimates
33

5.4 Page 44

▲back to top


IMR 1991
IMR 2001
Sr. State/ District
No.
Total
TM F
Rural
TM F
Urban
TM F
Total
TM F
Rural
T MF
Urban
TM F
301 Baudh
-----
- - - - 100 107 94 102 108 97 40 39 41
302 Sonapur
-----
- - - - 69 74 64 70 75 65 58 56 60
303 Balangir
104 103 105 107 104 109 78 86 70 87 85 90 90 87 92 63 68 58
304 Nuapada
-----
- - - - 91 100 83 93 100 85 69 92 46
305 Kalahandi
112 119 105 115 121 109 63 81 45 105 112 98 112 119 101 53 62 43
306 Rayagada
-----
- - - - 119 123 114 126 129 122 70 76 63
307 Nabarangapur
-----
- - - - 120 130 109 121 131 111 87 98 77
308 Koraput
108 108 107 111 112 110 84 80 89 98 102 99 101 105 100 82 79 85
309 Malkangiri
-----
- - - - 120 123 117 122 124 120 85 84 86
CHHATTISGARH
310 Koriya
-----
- - - - 75 77 72 85 88 82 44 45 42
311 Surguja
78 79 77 82 82 85 52 57 46 67 70 64 69 73 66 36 38 34
312 Jashpur
-----
- - - - 73 75 70 74 77 72 44 42 46
313 Raigarh
96 98 93 98 101 96 58 57 59 76 80 72 78 83 75 37 35 39
314 Korba
-----
- - - - 69 72 65 81 84 78 47 50 43
315 Janjgir - Champa
-----
- - - - 55 59 51 57 61 53 39 43 36
316 Bilaspur
91 96 88 100 105 94 54 56 51 71 75 68 78 82 73 47 48 46
317 Kawardha
-----
- - - - 88 92 84 91 95 87 50 54 45
318 Rajnandgaon
102 110 94 105 113 98 81 85 75 87 92 83 89 96 84 57 62 53
319 Durg
82 88 76 95 104 87 46 43 50 67 71 62 74 77 70 43 41 46
320 Raipur
98 98 100 102 103 101 75 71 78 80 84 76 86 91 81 59 61 57
321 Mahasamund
-----
- - - - 66 69 64 69 73 66 44 45 42
322 Dhamtari
-----
- - - - 63 66 60 65 69 61 51 52 50
323 Kanker
-----
- - - - 65 68 62 66 70 63 36 33 39
324 Bastar
91 98 88 94 100 89 60 66 54 74 78 69 76 82 71 44 46 42
325 Dantewada
-----
- - - - 80 83 77 81 85 78 57 55 58
MADHYA PRADESH
326 Sheopur
-----
- - - - 84 82 85 89 88 91 51 49 55
327 Morena
101 91 105 107 95 119 75 74 80 86 84 88 88 80 95 58 55 62
..........................................................................................................................................
34
Infant and Child Mortality in India : District Level Estimates

5.5 Page 45

▲back to top


Sr. State/ District
No.
328 Bhind
329 Gwalior
330 Datia
331 Shivpuri
332 Guna
333 Tikamgarh
334 Chhatarpur
335 Panna
336 Sagar
337 Damoh
338 Satna
339 Rewa
340 Umaria
341 Shahdol
342 Sidhi
343 Neemuch
344 Mandsaur
345 Ratlam
346 Ujjain
347 Shajapur
348 Dewas
349 Jhabua
350 Dhar
351 Indore
352 West Nimar
353 Barwani
354 East Nimar
355 Rajgarh
356 Vidisha
IMR 1991
IMR 2001
Total
TM F
Rural
TM F
Urban
TM F
Total
TM F
Rural
T MF
Urban
TM F
102 85 122 107 89 127 78 63 95 92 81 103 92 85 101 61 49 74
76 73 79 98 90 106 55 55 66 60 57 63 75 70 82 43 41 45
116 107 126 123 113 134 80 66 92 96 90 103 101 96 105 62 52 71
145 134 156 151 139 163 100 100 103 114 111 118 120 114 127 73 74 71
128 119 137 130 121 139 114 102 124 104 99 108 107 104 112 83 82 84
132 112 153 136 115 146 109 103 115 105 102 109 109 105 112 79 75 85
141 129 150 146 134 158 115 106 120 103 101 105 111 108 113 89 87 91
131 125 137 136 130 142 85 82 86 111 110 113 116 115 118 64 62 66
117 115 117 129 128 131 79 81 79 103 103 102 108 108 108 62 64 60
122 121 124 131 129 131 77 75 79 116 118 114 120 122 117 60 61 60
137 135 140 145 145 149 96 92 103 119 119 120 123 122 123 78 75 82
128 121 133 132 124 139 96 85 109 100 99 101 102 100 105 78 69 86
-----
- - - - 94 97 91 100 101 97 58 64 51
114 116 102 117 122 113 79 80 77 102 105 99 108 112 105 58 59 56
105 95 107 109 107 111 52 54 51 93 93 92 95 96 95 50 52 47
-----
- - - - 87 89 86 94 95 92 52 57 47
103 100 108 108 106 108 83 81 86 88 89 87 91 93 90 62 61 64
104 109 99 122 123 119 58 63 54 90 92 87 98 101 96 55 59 51
103 95 111 111 102 120 76 74 77 91 92 90 98 99 97 59 59 59
106 118 103 113 118 107 73 62 82 80 80 80 84 85 83 54 50 59
95 91 99 106 105 107 58 54 62 80 79 81 84 82 85 55 52 59
130 120 140 134 125 137 104 100 108 105 109 101 109 112 105 82 80 85
90 87 92 94 90 98 58 62 48 85 84 87 88 87 90 50 50 49
75 67 81 88 82 93 67 60 74 56 57 56 65 61 70 47 42 53
108 106 111 113 110 116 85 68 101 86 90 82 90 93 86 62 51 74
-----
- - - - 110 113 108 114 118 110 64 63 66
105 108 104 117 117 115 63 67 59 99 100 98 104 103 105 57 59 55
123 116 138 128 122 136 97 93 100 97 96 99 101 98 103 72 69 76
125 119 132 135 129 141 77 72 81 112 113 112 115 114 116 64 67 61
..........................................................................................................................................
Infant and Child Mortality in India : District Level Estimates
35

5.6 Page 46

▲back to top


Sr. State/ District
No.
357 Bhopal
358 Sehore
359 Raisen
360 Betul
361 Harda
362 Hoshangabad
363 Katni
364 Jabalpur
365 Narsimhapur
366 Dindori
367 Mandla
368 Chhindwara
369 Seoni
370 Balaghat
GUJARAT
371 Kachchh
372 Banas Kantha
373 Patan
374 Mahesana
375 Sabar Kantha
376 Gandhinagar
377 Ahmadabad
378 Surendranagar
379 Rajkot
380 Jamnagar
381 Porbandar
382 Junagadh
383 Amreli
384 Bhavnagar
IMR 1991
IMR 2001
Total
TM F
Rural
TM F
Urban
TM F
Total
TM F
Rural
T MF
Urban
TM F
78 82 76 129 138 119 62 61 63 70 72 68 105 109 100 48 50 46
121 130 113 128 133 121 93 99 87 92 91 94 106 105 108 64 66 62
120 118 121 125 123 127 89 85 92 94 96 92 98 99 96 64 66 63
133 135 131 143 145 140 91 91 91 93 94 92 103 105 102 60 61 60
-----
- - - - 90 88 92 98 95 101 54 55 53
112 105 119 122 112 129 74 73 65 94 93 95 102 101 103 63 62 64
-----
- - - - 100 103 97 109 112 106 54 54 55
108 111 106 130 138 122 59 60 57 92 93 90 106 112 103 45 45 46
113 103 122 112 105 124 96 83 112 98 95 102 102 98 107 74 64 96
-----
- - - - 96 97 95 97 99 96 67 76 58
92 94 91 93 95 89 81 81 80 86 88 85 87 90 86 57 59 55
110 104 116 116 109 124 81 76 86 93 94 96 99 95 103 61 60 65
105 103 104 106 106 108 70 69 71 86 90 83 88 92 86 51 50 52
111 114 108 114 117 111 74 82 67 97 101 93 101 104 98 52 62 44
74 72 76 76 71 81 56 53 57 57 58 57 61
83 75 89 84 77 92 70 62 77 64 62 66 65
-----
- - - - 81 77 85 84
69 57 75 96 85 107 67 57 74 58 54 63 80
81 76 87 83 77 89 64 61 68 68 69 66 69
70 67 71 75 67 81 56 53 58 68 65 70 72
52 51 52 84 84 85 40 39 40 47 47 46 72
81 77 87 82 82 91 60 57 63 60 57 65 65
50 49 51 64 60 68 36 35 36 48 47 48 50
49 44 59 64 56 74 40 39 40 44 42 46 50
-----
- - - - 41 43 39 44
52 52 53 55 53 57 43 42 45 50 51 49 53
43 46 41 44 46 42 40 40 41 41 42 40 41
58 45 60 53 54 65 42 47 51 47 42 50 49
62 60 48 45 41
64 67 52 49 54
80 88 65 64 67
79 82 48 46 51
71 67 54 53 55
66 77 54 52 56
71 74 38 37 39
63 67 47 48 47
51 50 34 34 33
48 53 38 37 39
43 45 37 43 31
52 55 41 40 43
43 40 35 34 36
50 47 39 38 41
..........................................................................................................................................
36
Infant and Child Mortality in India : District Level Estimates

5.7 Page 47

▲back to top


IMR 1991
IMR 2001
Sr. State/ District
No.
Total
TM F
Rural
TM F
Urban
TM F
Total
TM F
Rural
T MF
Urban
TM F
385 Anand
-----
- - - - 71 72 70 75 76 73 59 60 57
386 Kheda
85 80 90 92 91 93 51 50 53 75 75 76 79 79 79 47 45 48
387 Panch Mahals
88 82 91 91 87 94 61 62 60 71 74 68 72 76 69 57 59 56
388 Dohad
-----
- - - - 81 85 78 83 87 79 56 58 54
389 Vadodara
65 63 69 77 75 79 47 44 51 63 61 66 74 73 75 45 41 48
390 Narmada
-----
- - - - 72 79 65 74 81 67 46 49 43
391 Bharuch
-----
- - - - 57 58 57 61 62 59 47 47 48
392 Surat
54 51 57 47 49 46 59 52 66 44 47 43 45 48 43 43 43 44
393 The Dangs
83 92 74 82 90 73 92 106 76 66 73 60 67 75 61 0 0 0
394 Navsari
-----
- - - - 52 57 46 53 60 46 48 50 46
395 Valsad
40 42 38 45 46 41 25 26 25 38 40 36 42 45 39 24 25 24
MAHARASHTRA
396 Nandurbar
-----
- - - - 68 72 64 72 76 67 43 47 39
397 Dhule
68 70 67 73 75 70 48 46 51 59 58 58 63 64 63 46 44 47
398 Jalgaon
66 70 61 74 74 73 45 45 44 52 51 53 58 57 60 37 36 38
399 Buldana
75 76 72 79 84 77 49 49 49 57 59 54 61 63 58 35 35 35
400 Akola
66 74 64 3 81 68 47 47 47 51 54 47 54 57 50 37 40 34
401 Washim
-----
- - - - 53 58 48 56 61 52 36 42 30
402 Amravati
77 80 73 86 90 83 49 47 51 65 68 61 71 74 68 46 44 49
403 Wardha
70 80 59 77 87 66 43 51 35 56 61 50 59 64 55 38 42 33
404 Nagpur
69 69 69 79 75 80 50 54 46 52 52 50 59 64 58 47 50 44
405 Bhandara
83 90 76 89 92 81 46 49 41 63 68 57 67 72 61 37 42 33
406 Gondiya
-----
- - - - 73 78 67 77 83 70 36 38 35
407 Gadchiroli
106 110 97 108 112 99 83 89 76 87 86 68 79 88 70 53 57 47
408 Chandrapur
86 93 80 96 100 92 58 64 46 69 74 64 79 86 72 47 49 45
409 Yavatmal
96 102 92 105 111 101 63 67 57 60 64 56 63 67 59 40 42 38
410 Nanded
61 64 58 67 70 64 35 37 32 59 61 57 64 67 61 33 35 31
411 Hingoli
-----
- - - - 57 58 55 61 62 60 33 33 32
412 Parbhani
71 73 69 78 80 73 51 53 48 52 54 50 59 61 58 36 38 33
..........................................................................................................................................
Infant and Child Mortality in India : District Level Estimates
37

5.8 Page 48

▲back to top


IMR 1991
IMR 2001
Sr. State/ District
No.
Total
TM F
Rural
TM F
Urban
TM F
Total
TM F
Rural
T MF
Urban
TM F
413 Jalna
64 66 62 69 70 66 41 43 39 61 61 61 64
414 Aurangabad
63 63 58 69 67 70 40 47 31 54 54 55 60
415 Nashik
67 70 59 67 70 65 46 48 42 53 54 52 58
416 Thane
47 48 41 64 68 63 29 33 25 44 47 40 61
417 Mumbai (Suburban) - - - - -
- - - - 42 43 41 0
418 Mumbai
34 35 34 - -
- 34 35 34 37 39 37 0
419 Raigarh
54 62 47 57 64 50 37 39 35 42 44 40 44
420 Pune
54 62 47 57 64 50 37 39 35 33 34 33 36
421 Ahmadnagar
46 50 42 49 52 45 32 37 28 44 47 41 47
422 Bid
59 62 48 62 62 62 37 43 30 46 45 47 49
423 Latur
55 51 58 49 54 44 28 29 26 46 50 42 48
424 Osmanabad
51 47 55 66 64 66 32 32 33 47 45 50 53
425 Solapur
48 52 44 56 56 49 39 44 32 47 48 46 47
426 Satara
39 38 39 39 39 40 33 36 30 34 34 34 34
427 Ratnagiri
44 46 41 46 47 41 26 25 27 35 37 33 35
428 Sindhudurg
43 40 46 43 38 47 38 64 33 33 33 33 34
429 Kolhapur
41 44 38 46 48 44 31 31 30 38 42 37 43
430 Sangli
40 42 36 44 47 40 27 30 24 35 35 34 35
ANDHRA PRADESH
431 Adilabad
50 55 45 55 63 47 35 31 39 44 49 40 51
432 Nizamabad
42 47 35 43 40 36 36 38 30 40 44 35 42
433 Karimnagar
31 31 30 37 37 36 24 24 26 30 30 29 33
434 Medak
48 51 43 52 55 49 24 28 21 40 44 36 43
435 Hyderabad
-----
- 23 24 21 35 35 36 0
436 Rangareddy
46 44 44 56 56 59 26 27 25 38 40 35 46
437 Mahbubnagar
69 64 74 72 77 67 38 37 39 58 62 54 61
438 Nalgonda
52 53 50 53 55 52 38 42 34 48 51 46 51
439 Warangal
53 58 48 56 61 51 39 42 35 41 44 38 45
440 Khammam
43 45 41 47 49 43 30 29 34 42 44 41 46
65 64 40 41 38
60 61 36 41 30
60 56 42 44 40
65 56 27 30 24
0 0 42 43 41
0 0 37 39 37
46 41 33 34 32
37 34 30 31 29
50 44 31 35 27
48 50 35 39 29
52 43 24 26 22
56 51 30 29 31
49 46 36 41 31
35 34 29 28 30
38 33 24 23 25
34 33 27 26 28
46 41 29 30 28
36 34 25 28 23
56 45 28 30 26
46 38 30 32 28
36 31 24 23 25
47 39 23 26 20
0 0 22 23 20
50 42 25 26 24
65 56 35 36 33
54 49 30 32 28
48 41 27 28 26
48 43 29 28 32
..........................................................................................................................................
38
Infant and Child Mortality in India : District Level Estimates

5.9 Page 49

▲back to top


Sr. State/ District
No.
441 Srikakulam
442 Vizianagaram
443 Visakhapatnam
444 East Godavari
445 West Godavari
446 Krishna
447 Guntur
448 Prakasam
449 Nellore
450 Cuddapah
451 Kurnool
452 Anantapur
453 Chittoor
KARNATAKA
454 Belgaum
455 Bagalkot
456 Bijapur
457 Gulbarga
458 Bidar
459 Raichur
460 Koppal
461 Gadag
462 Dharwad
463 Uttara Kannada
464 Haveri
465 Bellary
466 Chitradurga
467 Davanagere
468 Shimoga
IMR 1991
IMR 2001
Total
TM F
Rural
TM F
Urban
TM F
Total
TM F
Rural
T MF
Urban
TM F
71 77 65 74 80 68 54 58 51 53 58 48 55
81 85 77 88 92 84 50 55 46 68 74 61 72
58 60 54 69 73 64 42 43 41 50 54 47 60
51 55 48 53 57 50 44 51 36 37 41 34 39
46 49 43 48 51 44 40 41 37 38 42 35 41
31 32 27 29 38 28 28 31 25 29 30 26 31
31 32 30 37 39 34 26 26 27 30 31 29 35
45 49 44 47 52 43 34 34 34 40 43 37 41
42 44 40 44 46 43 33 35 29 39 42 36 42
41 40 42 44 43 46 28 32 26 39 38 40 43
64 64 65 70 68 72 47 50 43 47 50 43 49
63 65 63 70 72 69 37 37 36 54 57 51 56
----
- - - - 40 42 38 43
60 50 36 40 32
80 65 46 49 43
65 55 36 37 35
43 35 31 32 30
44 37 29 32 26
36 26 27 30 24
37 32 24 24 25
44 38 32 33 30
45 38 30 32 28
41 44 26 28 24
53 46 38 40 35
59 52 34 35 33
46 40 29 32 27
51 53 47 53 56 51 37 42 32 49 51 46 51
59 59 58 63 64 62 49 48 50 64 68 60 70
-----
- - - - 57 56 57 61
61 62 59 65 64 67 49 52 48 59 61 57 63
49 51 45 54 56 51 25 27 24 45 48 42 49
57 59 54 59 62 55 51 53 50 54 57 52 57
-----
- - - - 77 79 75 80
-----
- - - - 62 68 56 67
66 68 64 72 73 71 53 59 46 52 56 49 63
52 55 48 57 60 54 36 34 38 37 40 35 40
-----
- - - - 62 65 58 66
79 80 77 86 89 82 55 50 61 75 77 73 82
70 70 70 79 80 79 41 38 44 67 66 67 71
-----
- - - - 59 64 56 63
64 72 56 71 80 61 42 46 37 42 46 38 46
55 48 34 37 30
75 66 49 52 46
63 58 46 44 47
62 64 47 48 45
52 46 24 26 22
59 53 43 45 40
81 79 60 63 56
73 62 52 58 45
68 58 43 44 41
42 37 30 33 27
70 63 45 47 43
84 81 51 47 54
73 68 38 37 40
67 59 52 55 49
50 41 35 37 32
..........................................................................................................................................
Infant and Child Mortality in India : District Level Estimates
39

5.10 Page 50

▲back to top


IMR 1991
IMR 2001
Sr. State/ District
No.
Total
TM F
Rural
TM F
Urban
TM F
Total
TM F
Rural
T MF
Urban
TM F
469 Udupi
-----
- - - - 25 25 24 25
470 Chikmagalur
65 57 68 63 63 62 58 55 59 53 53 53 54
471 Tumkur
77 75 78 81 79 85 55 58 51 64 68 60 68
472 Kolar
71 74 65 77 79 72 48 56 44 56 60 52 62
473 Bangalore
51 51 54 58 60 56 49 47 50 36 38 35 43
474 Bangalore Rural
48 44 52 49 44 54 46 49 41 45 42 47 47
475 Mandya
52 56 50 57 60 52 30 29 33 52 54 49 53
476 Hassan
56 65 48 57 63 51 48 53 41 44 47 41 46
477 Dakshina Kannada 42 40 45 40 46 36 31 31 32 31 34 28 33
478 Kodagu
44 48 40 45 46 43 39 53 25 34 38 30 33
479 Mysore
69 71 56 67 76 58 51 54 49 61 65 54 62
480 Chamarajanagar
-----
- - - - 66 70 61 70
GOA
481 North Goa
48 46 49 51 50 53 37 37 35 28 29 26 28
482 South Goa
31 34 28 34 37 29 30 32 30 28 29 26 27
KERALA
483 Kasaragod
33 32 29 36 33 37 25 30 22 14 13 16 15
484 Kannur
36 40 27 39 38 39 28 30 26 14 12 17 14
485 Wayanad
36 41 28 37 42 29 34 41 24 21 19 24 21
486 Kozhikode
43 45 41 52 56 48 29 29 28 17 15 19 17
487 Malappuram
36 41 28 36 42 28 30 29 30 16 15 18 16
488 Palakkad
36 30 39 36 30 39 33 28 37 21 20 22 22
489 Thrissur
38 32 44 41 38 44 30 27 30 16 15 18 16
490 Ernakulam
36 31 39 35 31 36 37 29 47 17 15 19 17
491 Idukki
43 47 39 50 49 40 22 19 21 18 18 19 19
492 Kottayam
35 27 41 37 27 39 27 22 43 13 12 15 13
493 Alappuzha
35 30 42 32 29 35 41 32 48 18 16 20 18
494 Pathanamthitta
29 27 34 28 27 30 36 21 47 18 15 20 17
495 Kollam
39 29 44 37 29 40 41 27 54 20 18 23 20
26 25 21 19 23
55 54 47 44 49
72 63 50 54 46
66 58 38 41 35
43 43 35 37 34
43 51 41 45 37
55 50 28 27 31
49 42 35 37 34
37 30 29 29 29
36 31 37 46 24
67 56 43 45 42
75 65 40 42 39
28 28 28 32 24
32 23 28 27 29
13 16 13 12 14
12 16 15 13 17
19 24 22 18 26
15 18 17 15 19
15 17 20 19 21
21 23 14 14 14
15 18 16 15 17
15 18 16 14 18
18 19 14 12 15
11 15 14 13 15
16 20 19 17 21
15 20 18 15 22
17 23 24 22 26
..........................................................................................................................................
40
Infant and Child Mortality in India : District Level Estimates

6 Pages 51-60

▲back to top


6.1 Page 51

▲back to top


IMR 1991
IMR 2001
Sr. State/ District
No.
Total
TM F
Rural
TM F
Urban
TM F
Total
TM F
Rural
T MF
Urban
TM F
496 Thiruvananthapuram 25 27 24 26 28 25 25 26 23 21 19 24 22
TAMIL NADU
497 Thiruvallur
-----
- - - - 38 40 36 41
498 Chennai
-----
- - - - 45 45 46 0
499 Kancheepuram
-----
- - - - 36 38 33 36
500 Vellore
-----
- - - - 47 49 45 49
501 Dharmapuri
60 59 62 61 58 64 52 62 50 50 45 54 52
502 Tiruvannamalai
50 55 44 51 57 45 38 37 39 45 46 43 46
503 Viluppuram
-----
- - - - 46 48 44 47
504 Salem
56 49 57 61 52 62 43 42 45 51 45 55 53
505 Namakkal
-----
- - - - 56 54 58 58
506 Erode
-----
- - - - 42 43 41 44
507 The Nilgiris
41 42 40 37 40 32 44 44 42 39 40 38 34
508 Coimbatore
46 49 44 55 58 51 39 42 33 45 48 43 52
509 Dindigul
67 63 72 71 67 74 55 49 61 52 53 52 54
510 Karur
-----
- - - - 42 43 41 44
511 Tiruchirappalli
52 53 51 56 58 54 41 40 42 41 43 39 44
512 Perambalur
-----
- - - - 47 49 44 50
513 Ariyalur
-----
- - - - 40 42 39 41
514 Cuddalore
-----
- - - - 38 41 36 41
515 Nagapattinam
-----
- - - - 40 41 38 39
516 Thiruvarur
-----
- - - - 33 33 32 33
517 Thanjavur
45 47 43 46 49 43 40 42 41 32 33 32 33
518 Pudukkottai
60 64 55 56 58 56 55 58 54 32 33 30 32
519 Sivaganga
-----
- - - - 43 43 43 44
520 Madurai
52 49 55 58 57 60 43 38 47 49 47 51 55
521 Theni
-----
- - - - 63 59 68 69
522 Virudhunagar
-----
- - - - 49 51 47 52
523 Ramanathapuram 57 52 60 47 50 44 30 32 26 36 36 35 37
20 25 19 16 22
43 39 35 37 33
0 0 45 45 46
39 33 48 37 33
51 48 44 46 42
47 58 36 35 37
49 43 33 34 32
49 45 39 40 37
46 60 41 40 43
54 62 52 51 54
45 42 40 41 39
38 30 41 43 39
55 48 37 40 32
54 54 48 48 47
45 42 39 40 37
45 43 37 39 34
53 47 26 27 25
43 39 35 34 36
44 38 32 34 30
41 38 41 43 38
33 33 30 30 31
33 33 31 32 30
33 30 32 33 31
45 44 39 38 41
54 57 39 35 42
64 75 58 53 62
53 50 46 49 43
38 36 27 28 25
..........................................................................................................................................
Infant and Child Mortality in India : District Level Estimates
41

6.2 Page 52

▲back to top


IMR 1991
IMR 2001
Sr. State/ District
No.
Total
TM F
Rural
TM F
Urban
TM F
Total
TM F
Rural
T MF
Urban
TM F
524 Thoothukkudi
-----
- - - - 41 43 40 43 45 41 39 40 38
525 Tirunelveli
69 72 66 72 77 66 64 62 35 34 37 32 36 38 34 32 35 29
526 Kanniyakumari
34 36 30 34 36 28 37 39 35 23 22 24 23 24 23 23 22 24
HIMACHAL PRADESH
527 Chamba
80 84 76 82 86 78 43 49 38 42 47 41 45 48 42 31 33 29
528 Kangra
52 55 49 52 56 49 43 47 38 35 36 34 36 36 35 32 36 27
529 Lahul & Spiti
83 101 59 83 101 59 - - - 35 38 32 35 38 32 0 0 0
530 Kullu
78 81 75 79 83 76 45 46 45 51 55 48 53 57 49 36 42 30
531 Mandi
68 72 64 69 72 65 49 53 44 48 50 45 48 51 45 34 30 38
532 Hamirpur
51 54 49 52 55 49 30 34 27 39 40 39 39 40 39 28 31 25
533 Una
63 67 60 65 69 60 46 49 42 34 35 34 34 35 33 33 28 37
534 Bilaspur
67 69 66 67 68 66 60 67 52 40 43 38 41 44 38 31 29 34
535 Solan
80 85 74 82 88 76 51 54 49 46 50 42 47 51 42 45 48 41
536 Sirmaur
92 97 87 93 98 89 52 58 45 55 57 53 56 58 54 45 42 48
537 Shimla
91 86 83 94 102 87 59 60 56 54 58 50 58 61 54 38 43 32
538 Kinnaur
102 106 97 102 106 97 - - - 75 82 70 75 82 70 0 0 0
PUNJAB
539 Gurdaspur
53 55 50 53 56 51 50 55 45 37 38 35 38 39 37 31 32 31
540 Amritsar
50 48 53 58 57 59 35 32 39 41 40 42 45 43 48 33 31 34
541 Kapurthala
47 51 43 55 59 50 26 27 24 37 37 36 38 38 38 24 26 22
542 Jalandhar
54 55 52 68 71 65 29 29 29 36 36 36 49 51 48 27 27 28
543 Hoshiarpur
63 58 69 67 64 70 40 25 59 46 45 46 49 48 50 31 23 37
544 Nawanshahr
-----
- - - - 37 37 37 37 36 38 33 33 33
545 Rupnagar
55 57 54 61 62 60 36 37 34 32 32 32 34 33 35 27 29 26
546 Fatehgarh Sahib
-----
- - - - 43 42 45 44 42 46 42 42 42
547 Ludhiana
43 38 47 62 60 64 27 25 28 40 37 42 54 53 55 25 23 26
548 Moga
-----
- - - - 41 42 41 42 42 43 37 38 35
549 Firozpur
58 62 53 62 65 50 45 51 37 47 47 48 49 49 50 39 42 35
550 Muktsar
-----
- - - - 48 47 50 51 51 53 38 36 40
551 Faridkot
53 51 55 54 51 57 49 51 48 45 45 44 50 49 50 36 38 34
552 Bathinda
52 51 53 55 55 57 39 38 41 50 48 51 52 51 54 38 37 39
..........................................................................................................................................
42
Infant and Child Mortality in India : District Level Estimates

6.3 Page 53

▲back to top


IMR 1991
IMR 2001
Sr. State/ District
No.
Total
TM F
Rural
TM F
Urban
TM F
Total
TM F
Rural
T MF
Urban
TM F
553 Mansa
-----
- - - - 57 55 59 61 59 63 41 40 41
554 Sangrur
67 65 68 72 70 75 50 51 48 58 57 58 62 62 63 46 46 47
555 Patiala
56 51 61 61 56 66 41 36 45 42 42 43 45 45 46 36 35 37
ARUNACHAL PRADESH
556 Tawang
71 76 66 71 76 66 - - - 67 65 70 69 73 65 43 33 52
557 West Kameng
96 93 98 98 97 100 62 44 79 62 67 57 66 71 62 45 34 54
558 East Kameng
- - - 158 173 139 - - - 113 111 114 135 134 137 75 83 68
559 Papum Pare
-----
- - - - 51 55 48 65 65 66 37 45 30
560 Lower Subansiri
88 94 80 110 116 103 47 55 39 80 89 73 97 106 90 27 25 29
561 Upper Subansiri
- - - 132 143 123 - - - 75 75 74 101 107 96 51 54 48
562 West Siang
66 66 66 70 71 68 45 39 52 45 48 40 45 48 41 41 38 4
563 East Siang
61 53 68 64 54 74 37 46 28 42 44 41 44 44 45 35 43 27
564 Upper Siang
-----
- - - - 53 56 50 53 55 51 0 0 0
565 Dibang Valley
72 72 72 73 70 75 67 78 57 61 63 59 69 69 68 42 51 35
566 Lohit
72 70 74 73 77 68 47 47 47 46 52 40 50 55 44 33 44 21
567 Changlang
- - - 76 90 65 - - - 52 54 49 55 60 50 62 47 79
568 Tirap
96 93 99 103 100 107 42 44 40 69 72 65 80 78 84 37 39 34
JAMMU AND KASHMIR
569 Kupwara
-----
- - - - 53 52 53 53 51 53 52 53 51
570 Baramula
-----
- - - - 53 52 53 54 54 54 49 48 51
571 Srinagar
-----
- - - - 42 39 45 47 46 47 39 36 41
572 Badgam
-----
- - - - 42 43 40 41 42 41 45 49 40
573 Pulwama
-----
- - - - 35 36 33 35 36 33 30 28 33
574 Anantnag
-----
- - - - 46 43 49 47 44 49 31 25 37
575 Leh (Ladakh)
-----
- - - - 49 47 51 50 49 51 46 43 49
576 Kargil
-----
- - - - 79 80 78 81 81 80 59 56 63
577 Doda
-----
- - - - 51 51 51 53 53 52 30 30 30
578 Udhampur
-----
- - - - 53 56 50 56 59 52 34 35 33
579 Punch
-----
- - - - 59 60 57 58 59 57 46 51 39
580 Rajauri
-----
- - - - 50 51 50 51 51 52 33 43 21
581 Jammu
-----
- - - - 41 42 41 42 41 42 41 42 40
582 Kathua
-----
- - - - 42 44 40 43 45 42 30 32 27
..........................................................................................................................................
Infant and Child Mortality in India : District Level Estimates
43

6.4 Page 54

▲back to top


Sr. State/ District
No.
A&N ISLANDS
583 Andaman
584 Nicobar
DAMAN & DIU
585 Daman
586 Diu
PUDUCHERRY
587 Pondicherry
588 Mahe
589 Yanam
590 Karaikal
CHANDIGARH
591 Chandigarh
D&N HAVELI
592 D&N Haveli
LAKSHADWEEP
593 Lakshadweep
IMR 1991
Total
TM F
Rural
TM F
Urban
TM F
Total
TM F
IMR 2001
Rural
T MF
Urban
TM F
NA NA NA NA NA NA NA NA NA 40 40 40 40
NA NA NA NA NA NA NA NA NA 50 58 42 50
41 39 35 33 37
58 42 NA NA NA
NA NA NA NA NA NA NA NA NA 29 32 25 28
NA NA NA NA NA NA NA NA NA 39 42 36 41
29 26 31 38 23
42 41 34 40 27
47 52 43 52 55 49 45 50 39 28 30 27 31 33 28 27 38 26
NA NA NA NA NA NA NA NA NA 24 24 24 NA NA NA 24 24 24
NA NA NA NA NA NA NA NA NA 43 44 43 NA NA NA 43 44 43
NA NA NA NA NA NA NA NA NA 26 26 26 26 26 27 26 27 25
46 50 42 54 59 49 40 42 38 44 47 40 50 55 45 38 40 35
63 70 57 66 73 60 44 50 37 46 50 43 51 54 47 33 37 29
80 94 67 78 98 62 81 79 83 60 64 56 64 67 60 54 51 56
..........................................................................................................................................
44
Infant and Child Mortality in India : District Level Estimates

6.5 Page 55

▲back to top


6.6 Page 56

▲back to top


6.7 Page 57

▲back to top


Table 15 : Child Mortality Rate (CMR) in Districts of India
CMR 1991
CMR 2001
Sr. State/ District
No.
HARYANA
Total
TM F
Rural
TM F
Urban
TM F
Total
TM F
Rural
T MF
Urban
TM F
1 Panchkula
-----
- - - - 35 33 37 38 34 42 31 30 33
2 Ambala
54 51 59 64 68 58 44 39 50 29 26 32 31 28 35 24 21 28
3 Yamunanagar
65 64 72 82 77 83 41 41 45 36 35 38 41 38 45 29 28 31
4 Kurukshetra
77 74 78 86 83 89 48 51 45 35 36 35 40 40 40 24 26 22
5 Kaithal
83 72 97 87 82 105 54 69 59 50 46 54 54 49 59 52 48 57
6 Karnal
62 62 69 67 69 80 40 40 37 41 39 44 45 42 49 31 30 34
7 Panipat
80 75 93 86 72 104 54 58 52 43 42 44 48 46 51 38 40 37
8 Sonipat
9 Jind
61 50 67 67 46 75 47 50 39 43 40 46 48
95 85 108 103 89 118 95 56 61 54 46 58 59
44 52 29 27 32
54 64 37 34 41
10 Fatehabad
-----
- - - - 53 51 55 57 54 60 33 34 32
11 Sirsa
74 65 83 74 65 84 72 66 78 43 42 45 47 45 49 31 29 34
12 Hisar
13 Bhiwani
72 67 77 78 75 80 48 47 49 45 42 49 51
75 70 81 76 69 84 67 70 63 48 48 50 51
51 56 29 29 33
51 54 36 35 38
14 Rohtak
64 61 70 70 66 76 50 51 49 43 41 44 47 47 52 30 30 32
15 Jhajjar
-----
- - - - 45 45 48 48 48 53 35 35 38
16 Mahendragarh
71 67 101 76 73 104 43 53 72 54 52 56 57 55 59 37 35 39
17 Rewari
79 74 84 87 83 92 42 41 43 47 47 47 50 50 50 33 33 33
18 Gurgaon
86 86 87 96 92 101 61 71 44 52 52 56 57 57 63 29 29 31
19 Faridabad
66 55 73 92 82 104 41 37 45 43 41 45 54 50 57 34 33 35
UTTARAKHAND
20 Uttarkashi
140 147 141 142 152 145 98 46 131 93 94 93 97 98 95 44 38 50
21 Chamoli
84 99 69 89 103 75 62 94 36 69 70 68 69 71 68 60 64 56
22 Rudraprayag
-----
- - - - 68 69 68 68 69 68 74 107 37
23 Tehri
97 106 90 98 107 91 70 77 58 69 70 69 71 72 71 56 58 53
24 Dehradun
73 97 65 98 111 86 41 43 41 57 58 57 65 64 66 48 51 46
25 Garhwal
70 60 80 73 63 83 46 45 48 59 56 65 61 57 66 40 42 38
26 Pithoragarh
103 113 93 104 113 104 106 101 109 61 63 60 64 66 61 47 45 48
27 Bageshwar
-----
- - - - 60 66 54 61 67 54 45 40 52
..........................................................................................................................................
Infant and Child Mortality in India : District Level Estimates
47

6.8 Page 58

▲back to top


CMR 1991
CMR 2001
Sr. State/ District
No.
28 Almora
Total
TM F
Rural
TM F
Urban
TM F
80 79 81 82 80 86 66 82 53
Total
TM F
58 57 60
Rural
T MF
59 58 61
Urban
TM F
49 56 42
29 Champawat
-----
- - - - 89 90 88 92 93 91 68 73 64
30 Nainital
117 105 131 129 113 145 98 83 114 66 66 66 74 74 75 50 51 49
31 Udham Singh Nagar - - - - -
- - - - 77 77 78 82 82 82 66 64 68
32 Hardwar
97 94 100 109 109 108 60 50 72 84 78 88 93 87 98 56 48 62
ASSAM
33 Kokrajhar
97 86 108 92 87 99 185 77 302 80 79 81 82 80 83 49 52 46
34 Dhubri
160 165 155 166 170 161 131 125 138 107 109 104 110 112 108 73 73 74
35 Goalpara
129 134 128 133 137 136 95 89 80 90 94 86 91 94 89 76 83 69
36 Bongaigaon
153 155 149 147 151 142 218 199 239 87 88 85 90 91 89 49 55 44
37 Barpeta
137 141 137 140 144 136 85 81 89 83 85 81 85 86 84 59 59 59
38 Kamrup
94 87 95 113 118 112 52 41 64 66 67 65 72 72 72 50 39 59
39 Nalbari
114 122 115 117 125 116 68 64 75 68 69 67 69 69 68 40 42 38
40 Darrang
141 137 142 145 144 146 101 93 108 99 101 97 100 101 100 68 70 66
41 Marigaon
150 152 150 153 154 153 116 130 97 85 88 81 85 88 82 79 92 75
42 Nagaon
116 117 114 121 122 119 67 74 58 83 85 81 86 87 84 58 60 55
43 Sonitpur
103 108 96 105 111 99 61 55 66 76 78 74 78 79 76 53 54 55
44 Lakhimpur
135 130 135 136 135 138 122 97 150 68 70 65 68 70 65 63 64 63
45 Dhemaji
151 132 131 132 152 104 138 75 187 65 66 63 65 66 65 59 65 55
46 Tinsuki
80 88 82 87 94 86 58 60 56 55 56 54 59 60 58 35 37 34
47 Dibrugarh
73 72 74 82 88 77 46 58 35 47 45 49 48 48 49 43 40 45
48 Sibsagar
84 92 76 91 95 80 36 32 43 69 45 68 70 71 69 34 30 37
49 Jorhat
71 76 67 71 76 67 50 61 48 61 62 60 62 63 61 42 45 39
50 Golaghat
89 92 86 92 95 88 51 46 52 61 61 60 62 62 61 45 44 47
51 Karbi Anglong
106 120 124 106 120 124 86 61 131 81 81 82 84 83 85 53 51 56
52 North Cacher Hills 88 95 80 102 107 97 39 55 25 65 65 66 69 67 71 35 44 24
53 Cacher
119 120 120 124 125 124 71 67 87 80 85 75 82 87 78 65 60 68
54 Karimganj
143 149 135 145 153 137 68 69 60 90 91 89 92 92 92 51 52 50
55 Hailakandi
136 145 131 140 150 135 67 75 59 84 84 84 86 85 87 52 55 50
..........................................................................................................................................
48
Infant and Child Mortality in India : District Level Estimates

6.9 Page 59

▲back to top


CMR 1991
CMR 2001
Sr. State/ District
No.
RAJASTHAN
56 Ganganagar
57 Hanumangarh
58 Bikaner
59 Churu
60 Jhunjhunun
61 Alwar
62 Bharatpur
63 Dhaulpur
64 Karauli
65 Sawai Madhopur
66 Dausa
67 Jaipur
68 Sikar
69 Nagaur
70 Jodhpur
71 Jaisalmer
72 Barmer
73 Jalor
74 Sirohi
75 Pali
76 Ajmer
77 Tonk
78 Bundi
79 Bhilwara
80 Rajsamand
81 Udaipur
82 Dungarpur
83 Banswara
Total
TM F
Rural
TM F
Urban
TM F
Total
TM F
Rural
T MF
Urban
TM F
68 65 72 71 67 77 52 55 48 65 63 68 68 64 72 49 51 46
-----
- - - - 65 62 68 66 63 69 55 54 56
73 73 75 94 94 92 45 42 49 60 58 63 62 59 66 42 39 44
85 78 94 98 86 110 79 72 87 74 73 74 76 77 76 63 61 64
78 77 89 76 71 83 84 110 71 62 60 63 65 65 65 49 50 47
125 115 138 132 122 147 70 66 84 85 80 91 86 81 91 61 59 65
129 112 148 138 121 158 80 67 95 89 78 100 90 79 102 66 60 72
152 130 183 - -
- 86 76 107 100 84 118 104 86 125 78 68 90
-----
- - - - 96 83 110 97 84 113 67 58 78
128 109 151 138 118 163 66 51 81 100 98 102 107 101 112 56 49 62
-----
- - - - 94 88 101 94 88 102 75 68 82
96 89 104 118 110 128 59 59 64 82 79 86 90 86 95 49 51 47
79 75 84 81 75 88 69 72 66 64 60 68 65 62 68 53 48 58
96 89 104 100 92 117 75 70 77 81 77 85 82 78 86 68 63 74
95 86 105 112 106 114 66 53 81 76 71 80 80 75 84 55 50 60
111 90 135 128 100 162 62 59 64 81 77 87 85 80 89 48 44 53
134 142 136 141 147 140 95 122 110 94 91 97 96 94 99 78 74 83
129 126 127 138 125 152 56 50 64 99 94 104 103 98 106 52 46 56
141 133 148 159 152 175 89 123 56 96 94 98 98 96 101 58 62 53
158 141 176 173 155 193 102 95 111 119 117 122 121 119 123 96 92 101
120 115 125 155 146 169 76 81 66 93 91 95 107 105 110 62 61 63
153 130 156 162 155 170 114 124 92 110 108 112 116 115 118 73 71 75
120 115 125 132 127 138 83 66 100 93 90 96 97 94 100 60 61 59
138 138 130 154 154 150 74 74 78 120 123 118 124 126 122 66 59 71
-----
- - - - 111 110 112 113 113 113 85 87 83
-----
- - - - 113 112 114 118 118 119 59 58 60
149 149 150 151 158 154 77 65 92 128 129 126 131 133 129 66 59 73
142 167 146 179 174 152 64 65 63 125 125 124 132 132 131 50 56 43
..........................................................................................................................................
Infant and Child Mortality in India : District Level Estimates
49

6.10 Page 60

▲back to top


CMR 1991
CMR 2001
Sr. State/ District
No.
84 Chittaurgarh
Total
TM F
Rural
TM F
Urban
TM F
Total
TM F
Rural
T MF
146 144 147 160 157 162 93 109 77 121 119 123 126 125 128
Urban
TM F
76 78 72
85 Kota
107 99 114 121 110 140 57 51 66 78 75 81 91 88 94 50 45 56
86 Baran
-----
- - - - 99 95 103 102 98 107 82 84 79
87 Jhalawar
121 125 131 132 121 144 58 62 56 92 90 94 94 92 97 52 56 49
DELHI
88 North West
-----
- - - - 43 42 44 47 46 49 42 41 44
89 North
-----
- - - - 36 37 36 46 46 46 35 35 36
90 North East
-----
- - - - 45 44 45 48 50 46 45 44 46
91 East
-----
- - - - 41 39 43 68 66 71 41 40 43
92 New Delhi
-----
- - - - 38 40 36
-
- - 38 40 36
93 Central
-----
- - - - 33 33 34
-
- - 33 33 34
94 West
-----
- - - - 42 42 43 52 56 49 42 40 44
95 South West
-----
- - - - 41 40 42 42 39 46 40 39 42
96 South
-----
- - - - 43 43 44 42 40 43 44 43 45
UTTAR PRADESH
97 Saharanpur
101 101 105 112 110 118 61 69 52 86 79 93 92 84 101 56 55 58
98 Muzaffarnagar
132 117 146 137 126 153 104 89 123 83 77 90 87 80 93 71 66 76
99 Bijnor
126 113 134 133 133 131 91 83 100 81 78 85 87 83 91 62 60 64
100 Moradabad
126 116 141 149 132 167 66 74 71 84 76 94 97 87 107 49 45 52
101 Rampur
146 127 167 146 128 167 114 86 149 102 96 110 110 103 117 79 71 86
102 Jyotiba Phule Nagar - - - - -
- - - - 86 80 93 95 88 102 59 58 61
103 Meerut
91 86 89 103 92 114 70 74 65 71 64 78 84 77 93 58 60 57
104 Baghpat
-----
- - - - 68 63 74 72 66 78 55 53 56
105 Ghaziabad
72 67 73 84 79 90 59 66 52 64 58 70 77 69 87 53 50 56
106 Gautam Buddha
Nagar
-----
- - - - 76 68 86 81 70 94 69 65 74
107 Bulandshahr
102 95 122 110 100 133 77 77 75 99 92 108 106 95 119 72 75 68
108 Aligarh
124 106 144 139 122 164 94 88 102 101 91 112 105 94 117 90 81 98
109 Hathras
-----
- - - - 104 92 118 110 95 126 84 80 89
..........................................................................................................................................
50
Infant and Child Mortality in India : District Level Estimates

7 Pages 61-70

▲back to top


7.1 Page 61

▲back to top


Sr. State/ District
No.
110 Mathura
111 Agra
112 Firozabad
113 Etah
114 Mainpuri
115 Budaun
116 Bareilly
117 Pilibhit
118 Shahjahanpur
119 Kheri
120 Sitapur
121 Hardoi
122 Unnao
123 Lucknow
124 Rae Bareli
125 Farrukhabad
126 Kannauj
127 Etawah
128 Auraiya
129 Kanpur Dehat
130 Kanpur Nagar
131 Jalaun
132 Jhansi
133 Lalitpur
134 Hamirpur
135 Mahoba
136 Banda
137 Chitrakoot
138 Fatehpur
CMR 1991
CMR 2001
Total
TM F
Rural
TM F
Urban
TM F
110 92 132 124 102 149 75 75 78
Total
TM F
86 75 99
Rural
T MF
94 81 108
Urban
TM F
65 57 73
92 76 109 129 107 156 50 42 59 85 70 101 96 83 110 45 40 49
142 117 172 162 132 197 106 93 120 97 88 107 102 91 112 84 78 91
176 149 177 183 157 187 116 104 131 112 101 124 117 104 132 86 80 92
127 100 152 136 105 163 83 68 100 91 83 101 95 85 107 69 65 73
211 206 219 224 218 234 128 132 125 112 100 125 119 105 135 79 74 83
130 130 154 150 141 180 80 71 87 92 86 99 104 96 113 62 58 66
145 132 157 137 144 151 71 65 82 115 111 110 120 116 124 50 44 55
175 155 175 185 172 190 119 72 174 107 97 118 115 104 128 69 64 74
110 105 115 122 113 134 52 42 67 92 88 98 106 98 113 50 40 59
142 136 146 148 135 163 76 63 90 108 102 114 113 106 121 62 59 65
188 183 197 205 194 217 86 71 97 113 105 122 119 109 130 64 60 69
140 125 157 151 135 160 68 60 80 103 99 107 108 104 113 60 56 65
89 80 97 145 131 156 43 42 45 74 72 77 101 98 105 39 35 42
158 158 170 166 163 180 116 107 123 103 101 106 107 104 110 65 65 66
131 121 138 138 131 150 82 75 94 93 84 102 97 88 107 73 66 81
-----
- - - - 92 85 100 95 88 104 74 67 81
137 122 152 146 130 163 72 65 72 79 72 86 85 77 95 56 55 57
-----
- - - - 92 86 100 96 89 104 66 61 72
130 113 148 134 118 140 79 50 103 112 108 116 113 109 118 58 48 67
48 50 44 95 89 102 40 42 36 45 47 43 79 74 83 37 40 34
132 123 152 141 138 165 92 80 128 96 87 106 103 93 114 71 65 78
118 110 136 138 127 168 76 72 85 106 100 114 122 114 131 70 65 74
160 147 180 176 165 196 50 46 52 128 117 139 134 122 148 46 42 50
150 129 171 162 138 189 79 73 86 92 84 100 95 86 104 75 68 81
-----
- - - - 103 96 112 110 102 119 76 69 83
134 123 158 144 122 168 46 38 53 102 93 111 107 96 118 43 36 49
-----
- - - - 105 99 111 107 100 116 76 76 76
151 158 145 158 162 150 82 94 72 101 97 107 105 99 111 67 72 61
..........................................................................................................................................
Infant and Child Mortality in India : District Level Estimates
51

7.2 Page 62

▲back to top


CMR 1991
CMR 2001
Sr. State/ District
No.
139 Pratapgarh
Total
Rural
Urban
TM F TM F TM F
145 134 156 149 137 161 104 46 184
Total
TM F
90 88 93
Rural
T MF
91 89 94
Urban
TM F
62 61 63
140 Kaushambi
-----
- - - - 103 97 109 105 99 111 75 74 77
141 Allahabad
143 131 157 152 140 165 141 106 182 106 99 114 114 106 123 84 77 91
142 Barabanki
124 112 137 129 116 144 72 75 67 108 103 114 111 105 117 62 65 60
143 Faizabad
109 104 116 113 107 119 55 60 52 84 80 88 89 85 93 47 47 48
144 Ambedkar Nagar
-----
- - - - 85 83 87 87 85 89 60 57 62
145 Sultanpur
144 124 164 146 127 167 80 77 87 100 96 105 102 98 107 59 56 63
146 Bahraich
183 177 187 185 177 191 156 169 142 106 99 114 111 102 121 58 60 56
147 Shrawasti
-----
- - - - 111 99 125 112 102 128 83 78 89
148 Balrampur
-----
- - - - 117 106 128 119 106 134 84 75 94
149 Gonda
156 135 181 162 140 188 155 61 250 93 86 101 96 87 105 49 51 47
150 Siddharthnagar
156 136 178 157 137 180 98 83 119 108 99 116 109 100 119 88 84 92
151 Basti
128 126 135 132 127 137 83 109 55 91 87 96 93 88 99 58 62 53
152 Sant Kabir Nagar
-----
- - - - 96 93 101 98 95 103 75 69 80
153 Maharajganj
149 135 166 152 142 169 112 107 117 113 110 117 115 111 119 89 89 89
154 Gorakhpur
98 86 105 106 100 113 58 63 52 69 67 71 73 71 76 49 50 48
155 Kushinagar
-----
- - - - 79 76 82 80 77 83 58 56 60
156 Deoria
115 104 127 119 107 149 55 45 65 81 81 83 83 81 85 50 48 53
157 Azamgarh
109 101 136 126 103 141 74 77 71 87 85 89 88 87 89 66 64 68
158 Mau
91 93 90 92 93 92 78 78 72 65 64 65 66 66 66 58 57 59
159 Ballia
55 48 64 57 49 68 42 48 34 51 45 56 53 47 59 40 43 37
160 Jaunpur
125 115 135 128 118 140 72 73 72 98 94 102 100 96 104 68 66 70
161 Ghazipur
79 75 84 82 78 87 84 93 74 75 72 78 76 73 80 58 55 61
162 Chandauli
-----
- - - - 82 77 88 85 79 91 60 58 62
163 Varanasi
99 89 118 105 95 125 65 65 72 84 79 89 94 88 99 62 58 66
164 Sant Ravidas Nagar - - - - -
Bhadohi
- - - - 104 95 114 107 97 119 73 70 76
165 Mirzapur
131 110 152 138 118 160 95 68 125 97 91 104 102 94 110 62 57 68
166 Sonbhadra
112 115 109 121 121 133 49 44 52 98 94 102 106 101 111 44 40 48
..........................................................................................................................................
52
Infant and Child Mortality in India : District Level Estimates

7.3 Page 63

▲back to top


CMR 1991
CMR 2001
Sr. State/ District
No.
BIHAR
Total
TM F
Rural
TM F
Urban
TM F
Total
TM F
Rural
T MF
Urban
TM F
167 Pashchim
Champaran
101 91 114 100 92 119 89 40 91 60 56 64 60 56 64 47 47 48
168 Purba Champaran 79 64 110 82 65 113 79 64 109 69 62 76 70 63 76 56 52 60
169 Sheohar
-----
- - - - 78 69 89 77 68 87 65 59 71
170 Sitamarhi
125 101 157 129 104 161 61 57 67 74 65 64 74 65 85 54 52 56
171 Madhubani
94 73 108 92 73 118 94 82 106 60 54 66 62 55 67 45 41 49
172 Supaul
-----
- - - - 62 58 65 62 58 65 61 60 63
173 Araria
85 93 111 104 121 99 75 75 89 82 81 82 82 81 83 65 67 63
174 Kishanganj
136 133 150 143 138 158 77 76 77 74 72 77 74 72 77 68 69 66
175 Purnia
109 92 124 114 92 128 70 85 68 68 64 72 69 65 73 46 44 48
176 Katihar
124 122 125 131 127 137 61 75 50 68 65 72 69 66 72 38 38 38
177 Madhepura
110 86 139 110 87 138 106 66 156 56 53 60 57 54 60 58 55 61
178 Saharsa
102 78 125 106 87 128 71 44 91 54 47 59 54 49 60 41 40 41
179 Darbhanga
96 75 120 100 78 125 58 48 74 66 59 73 66 59 73 50 47 52
180 Muzaffarpur
100 84 123 103 86 126 78 59 86 72 67 78 75 69 82 40 37 44
181 Gopalganj
69 63 75 69 63 75 39 31 49 53 51 54 54 52 55 36 29 42
182 Siwan
82 66 99 83 67 103 56 55 58 48 48 48 48 48 48 34 35 33
183 Saran
100 83 120 77 69 84 74 51 221 51 48 54 51 48 54 42 40 43
184 Vaishali
71 62 83 72 62 84 56 46 58 59 53 65 59 54 65 40 37 43
185 Samastipur
103 82 125 104 84 128 83 59 127 64 58 71 64 58 71 44 44 44
186 Begusarai
96 77 119 100 79 125 72 65 60 61 55 68 61 55 68 37 36 38
187 Khagaria
91 77 107 94 82 110 23 30 23 58 52 64 58 52 64 22 21 22
188 Bhagalpur
87 79 101 91 76 107 66 66 65 55 48 58 58 55 61 46 44 48
189 Banka
-----
- - - - 61 57 66 63 59 68 44 40 48
190 Munger
94 76 119 97 76 123 68 48 102 48 45 53 52 47 57 39 38 41
191 Lakhisarai
-----
- - - - 67 62 72 67 63 72 57 52 63
192 Sheikhpura
-----
- - - - 66 59 74 68 60 76 54 52 57
193 Nalanda
93 78 109 92 79 117 75 65 86 65 60 71 67 62 72 50 49 51
..........................................................................................................................................
Infant and Child Mortality in India : District Level Estimates
53

7.4 Page 64

▲back to top


CMR 1991
CMR 2001
Sr. State/ District
No.
194 Patna
195 Bhojpur
196 Buxar
197 Kaimur (Bhabua)
198 Rohtas
199 Jehanabad
200 Aurangabad
201 Gaya
202 Nawada
203 Jamui
SIKKIM
204 North
205 West
206 South
207 East
NAGALAND
208 Mon
209 Tuensang
210 Mokokchung
211 Zunheboto
212 Wokha
213 Dimapur
214 Kohima
215 Phek
MANIPUR
216 Senapati
217 Tamenglong
218 Churachandpur
219 Bishnupur
Total
TM F
Rural
TM F
Urban
TM F
70 59 81 92 73 114 60 54 71
Total
TM F
54 49 59
Rural
T MF
62 55 69
Urban
TM F
37 36 39
76 66 92 72 67 91 59 46 70 59 53 65 61 55 67 39 38 40
-----
- - - - 59 54 65 60 54 65 49 48 52
-----
- - - - 76 71 82 76 71 81 31 30 32
90 74 108 92 75 111 94 79 110 58 54 63 60 56 64 40 38 42
90 80 102 92 81 102 65 82 58 67 62 73 67 62 73 54 58 53
91 79 105 93 80 106 77 69 86 72 69 77 73 69 77 56 54 58
100 81 120 101 81 122 73 60 86 63 59 67 65 61 69 39 38 41
96 81 117 98 80 122 50 35 65 56 51 61 56 52 61 41 34 48
-----
- - - - 62 57 68 63 57 69 46 48 44
110 116 103 111 117 105 84 101 69 54 58 51 50
122 100 144 123 101 145 112 95 135 79 80 79 62
89 91 86 89 81 86 78 81 77 44 44 43 55
68 68 66 73 70 70 51 55 45 49 49 49 63
52 47 58 62 55
64 60 81 76 85
54 55 24 26 23
64 63 47 49 44
66 57 74 71 66 75 32 24 43 38 33 45 40
86 72 102 84 75 97 83 52 116 49 43 55 50
39 41 37 44 47 41 26 26 25 35 39 30 40
64 64 77 65 60 68 77 70 71 48 42 56 56
66 67 64 67 66 69 63 68 55 32 26 38 35
-----
- - - - 40 39 40 39
65 65 68 68 69 64 63 55 70 33 32 35 35
49 43 52 50 49 55 38 28 48 37 32 42 37
35 46 30 22 38
45 56 39 35 43
42 38 23 22 23
49 63 42 36 49
29 43 24 22 27
38 40 41 43 39
35 35 27 22 33
33 41 35 24 46
54 53 56 54 53 56 - - - 46 42 50 46
50 52 56 50 52 56 32 30 32 42 44 40 42
32 30 32 32 30 32 26 28 25 40 40 41 36
31 30 35 31 32 29 41 34 47 31 29 34 30
42 50
--
-
44 40
--
-
34 37
--
-
31 28 35 29 39
..........................................................................................................................................
54
Infant and Child Mortality in India : District Level Estimates

7.5 Page 65

▲back to top


Sr. State/ District
No.
220 Thoubal
221 Imphal West
222 Imphal East
223 Ukhrul
224 Chandel
MIZORAM
225 Mamit
226 Kolasib
227 Aizawl
228 Champhai
229 Serchhip
230 Lunglei
TRIPURA
231 Lawngtlai
232 Saiha
233 West Tripura
234 South Tripura
235 Dhalai
236 North Tripura
MEGHALAYA
237 West Garo Hills
238 East Garo Hills
239 South Garo Hills
240 West Khasi Hills
241 Ri Bhoi
242 East Khasi Hills
243 Jaintia Hills
WEST BENGAL
244 Darjiling
CMR 1991
CMR 2001
Total
TM F
Rural
TM F
Urban
TM F
52 55 49 40 43 40 76 83 69
Total
TM F
30 30 31
Rural
T MF
31 31 30
Urban
TM F
29 28 31
-----
- - - - 24 25 23 24 25 24 23 24 22
-----
- - - - 31 31 31 31 31 30 32 29 35
50 45 52 50 45 52 - - - 37 33 42 37 33 42
--
-
-----
- - - - 38 40 36 32 31 33 52 55 49
-----
- - - - 55 56 53 59
-----
- - - - 46 47 44 55
61 63 60 103 110 100 36 39 32 29 29 30 35
-----
- - - - 37 38 36 41
-----
- - - - 40 45 36 46
79 80 74 108 115 102 37 40 34 51 50 53 62
63 56 30 28 31
56 54 37 35 39
34 36 27 27 28
42 41 29 29 30
52 40 34 34 34
61 64 32 32 33
-----
- - - - 67 64 70 67
-----
- - - - 36 37 35 43
85 94 84 94 103 91 65 67 64 63 63 62 64
106 108 105 107 108 107 85 92 80 77 77 77 78
-----
- - - - 74 76 72 75
122 145 121 121 144 121 132 130 136 84 85 83 85
64 70
--
-
44 42 22 23 22
64 64 56 56 56
78 79 59 63 55
77 74 53 60 46
85 85 69 71 68
125 128 122 130 135 126 74 68 79 73 74 73 78
108 109 106 110 112 108 79 74 85 65 66 65 70
-----
- - - - 85 82 88 86
84 82 85 91 90 92 91 90 92 59 58 60 62
-----
- - - - 59 60 57 59
80 81 78 92 93 91 52 56 48 45 47 44 51
88 91 86 91 94 87 72 72 72 66 69 63 69
78 78 35 33 38
71 69 37 37 38
82 90 73 81 66
60 64 38 36 40
60 58 49 57 41
54 48 37 38 36
72 66 30 27 33
78 74 81 90 50 94 50 47 52 65 65 65 69 70 69 44 43 46
..........................................................................................................................................
Infant and Child Mortality in India : District Level Estimates
55

7.6 Page 66

▲back to top


CMR 1991
CMR 2001
Sr. State/ District
No.
245 Jalpaiguri
Total
TM F
Rural
TM F
Urban
TM F
108 109 108 115 113 116 64 62 66
Total
TM F
77 78 75
Rural
T MF
79 80 78
Urban
TM F
61 60 62
246 Koch Bihar
128 129 127 133 133 132 56 68 53 87 89 85 88 90 87 51 56 45
247 Uttar Dinajpur
-----
- - - - 73 74 71 76 77 74 43 42 43
248 Dakshin Dinajpur
-----
- - - - 85 86 83 87 88 86 62 62 62
249 Maldah
142 132 152 146 135 157 74 66 78 79 81 78 79 81 78 64 59 70
250 Murshidabad
120 115 124 122 118 126 95 83 107 77 78 76 79 80 78 59 54 65
251 Birbhum
97 93 101 97 100 113 104 95 114 70 72 69 71 72 69 59 60 59
252 Barddhaman
65 65 68 74 70 76 52 52 53 60 61 60 66 68 65 47 46 47
253 Nadia
104 94 114 110 98 122 82 74 91 70 71 70 70 72 70 66 68 64
254 North Twenty Four 83 78 88 101 98 105 66 59 74 63 64 63 66
Parganas
68 64 59 57 61
255 Hugli
45 45 45 49 51 49 35 35 36 42 41 43 44 42 46 33 32 34
256 Bankura
67 63 75 72 66 78 32 29 42 54 55 54 55 55 54 30 28 33
257 Puruliya
76 76 77 79 82 80 52 58 45 54 54 54 55 55 55 40 41 40
258 Medinipur
90 86 94 83 89 99 48 50 46 59 59 59 60 60 60 42 46 39
259 Haora
52 46 57 67 60 78 30 30 37 50 50 49 54 53 54 28 27 29
260 Kolkata
30 28 31 - -
- 30 28 31 56 56 57
-
- - 56 56 57
261 South Twenty Four - - - - -
Parganas
- - - - 63 63 63 64 64 63 58 58 59
JHARKHAND
262 Garhwa
-----
- - - - 74 72 77 75 73 78 41 45 37
263 Palamu
118 107 132 121 108 135 118 116 119 72 69 75 74 71 76 39 37 40
264 Chatra
-----
- - - - 68 65 71 69 65 73 35 35 35
265 Hazaribag
73 70 75 87 78 97 58 44 69 53 54 51 58 59 57 32 33 30
266 Kodarma
-----
- - - - 52 53 50 53 54 52 41 43 38
267 Giridih
96 95 97 87 75 100 65 72 64 52 52 53 53 52 54 39 39 40
268 Deoghar
128 107 150 131 113 150 101 69 145 52 50 55 55 52 58 31 29 33
269 Godda
84 79 112 95 81 114 41 51 34 60 56 64 61 56 65 35 38 32
270 Sahibganj
118 117 124 124 118 127 85 99 70 62 60 64 63 61 66 46 45 47
271 Pakaur
82 79 86 90 87 85 34 33 35 63 61 64 63 62 65 47 48 45
..........................................................................................................................................
56
Infant and Child Mortality in India : District Level Estimates

7.7 Page 67

▲back to top


CMR 1991
CMR 2001
Sr. State/ District
No.
272 Dumka
Total
TM F
---
Rural
TM F
--
-
Urban
TM F
---
Total
TM F
52 51 53
Rural
T MF
52 51 54
Urban
TM F
30 29 30
273 Dhanbad
40 37 44 40 37 44 36 36 35 37 34 40 38 35 42 34 33 34
274 Bokaro
-----
- - - - 39 38 41 46 45 48 30 29 32
275 Ranchi
70 74 64 86 92 107 37 37 40 48 48 47 56 57 55 32 32 32
276 Lohardaga
103 93 120 107 89 124 70 63 80 58 59 57 63 64 61 28 25 30
277 Gumla
128 121 136 124 126 124 43 38 45 65 67 64 67 69 65 40 36 43
278 Pashchimi Singhbhum 79 63 102 98 87 111 58 48 70 59 59 59 64 64 64 37 37 37
279 Purbi Singhbhum 160 155 166 168 162 173 101 104 98 50 55 48 55 57 53 42 45 38
ORISSA
280 Bargarh
-----
- - - - 79 85 74 80 86 75 68 74 63
281 Jharsuguda
-----
- - - - 66 68 64 71 74 67 58 59 58
282 Sambalpur
163 137 188 181 153 210 73 66 97 85 91 79 92 99 84 67 64 70
283 Debagarh
-----
- - - - 105 106 105 105 105 105 109 105 112
284 Sundargarh
120 116 125 146 145 148 77 63 90 78 80 76 89 92 86 56 56 56
285 Kendujhar
142 149 154 145 153 162 108 125 90 91 94 88 94 98 91 71 69 72
286 Mayurbhanj
107 99 116 104 101 124 113 149 75 72 75 70 73 76 71 53 57 49
287 Baleshwar
246 172 327 255 174 341 156 149 165 86 86 86 88 88 88 65 66 64
288 Bhadrak
-----
- - - - 86 86 86 86 86 87 79 81 77
289 Kendrapara
-----
- - - - 82 83 82 83 83 82 76 74 79
290 Jagatsinghapur
-----
- - - - 74 75 74 76 77 75 60 55 65
291 Cuttack
172 173 150 180 181 158 104 117 85 86 86 85 92 92 93 68 69 68
292 Jajapur
-----
- - - - 77 78 77 78 78 78 59 62 57
293 Dhenkanal
164 151 159 136 193 163 136 144 128 93 92 94 95 93 96 75 78 71
294 Anugul
-----
- - - - 87 87 87 91 91 91 63 62 65
295 Nayagarh
-----
- - - - 99 99 100 100 99 101 80 92 67
296 Khordha
-----
- - - - 78 77 79 86 84 87 67 65 68
297 Puri
155 146 163 168 158 167 92 98 84 90 91 89 93 95 91 70 69 71
298 Ganjam
153 168 150 163 165 159 87 83 93 95 108 96 100 99 102 66 65 68
299 Gajapati
-----
- - - - 127 131 124 133 136 130 61 67 55
..........................................................................................................................................
Infant and Child Mortality in India : District Level Estimates
57

7.8 Page 68

▲back to top


CMR 1991
CMR 2001
Sr. State/ District
No.
300 Kandhamal
Total
TM F
---
Rural
TM F
--
-
Urban
TM F
Total
TM F
Rural
T MF
- - - 136 137 128 136 140 132
Urban
TM F
79 81 76
301 Baudh
-----
- - - - 110 114 105 112 116 108 52 51 53
302 Sonapur
-----
- - - - 78 81 76 79 81 77 68 65 71
303 Balangir
153 149 157 158 151 163 104 117 112 84 90 78 86 92 80 67 69 64
304 Nuapada
-----
- - - - 100 106 94 102 106 96 74 89 59
305 Kalahandi
168 179 157 175 183 163 97 109 86 117 124 109 121 130 112 72 76 68
306 Rayagada
-----
- - - - 124 126 122 131 133 130 74 77 70
307 Nabarangapur
-----
- - - - 127 134 119 129 135 122 90 99 82
308 Koraput
159 159 161 165 165 165 116 107 124 124 126 121 131 133 129 84 89 79
309 Malkangiri
-----
- - - - 127 127 126 129 129 130 90 87 92
CHHATTISGARH
310 Koriya
-----
- - - - 79 81 78 92 94 89 47 48 46
311 Surguja
114 115 104 121 123 120 64 69 56 73 75 71 76 78 74 30 31 30
312 Jashpur
-----
- - - - 77 78 76 79 80 78 47 44 51
313 Raigarh
137 140 133 141 145 138 72 71 74 73 75 72 79 81 76 39 38 41
314 Korba
-----
- - - - 74 75 72 86 88 85 51 52 49
315 Janjgir - Champa
-----
- - - - 66 69 63 74 75 72 43 45 41
316 Bilaspur
128 135 118 145 151 138 72 76 68 79 80 77 87 90 85 49 50 49
317 Kawardha
-----
- - - - 96 99 94 100 102 97 53 56 50
318 Rajnandgaon
151 162 146 159 165 153 169 113 102 86 90 82 91 95 86 63 67 60
319 Durg
117 118 115 139 150 135 74 71 78 67 70 65 79 84 74 46 48 44
320 Raipur
142 137 150 149 150 148 98 91 106 77 80 74 84 88 81 61 62 59
321 Mahasamund
-----
- - - - 72 74 70 75 78 73 49 50 47
322 Dhamtari
-----
- - - - 73 75 71 76 79 73 55 54 56
323 Kanker
-----
- - - - 71 73 68 72 75 70 38 36 41
324 Bastar
128 140 123 134 141 125 74 82 67 74 77 71 78 81 74 40 39 40
325 Dantewada
-----
- - - - 85 86 84 87 88 86 59 59 59
MADHYA PRADESH
326 Sheopur
-----
- - - - 89 86 93 95 91 99 58 54 62
..........................................................................................................................................
58
Infant and Child Mortality in India : District Level Estimates

7.9 Page 69

▲back to top


Sr. State/ District
No.
327 Morena
328 Bhind
329 Gwalior
330 Datia
331 Shivpuri
332 Guna
333 Tikamgarh
334 Chhatarpur
335 Panna
336 Sagar
337 Damoh
338 Satna
339 Rewa
340 Umaria
341 Shahdol
342 Sidhi
343 Neemuch
344 Mandsaur
345 Ratlam
346 Ujjain
347 Shajapur
348 Dewas
349 Jhabua
350 Dhar
351 Indore
352 West Nimar
353 Barwani
354 East Nimar
355 Rajgarh
CMR 1991
CMR 2001
Total
TM F
Rural
TM F
Urban
TM F
139 117 161 149 126 173 99 94 126
Total
TM F
92 90 95
Rural
T MF
96 93 99
Urban
TM F
73 67 79
149 109 188 148 119 181 104 80 136 97 92 103 99 94 105 65 56 77
108 90 127 164 142 188 67 69 87 66 60 72 85 79 90 48 44 53
181 149 217 206 171 247 104 82 133 105 103 107 109 99 119 69 62 78
239 208 274 251 219 290 146 142 158 120 115 125 126 120 131 77 76 79
204 179 232 207 183 236 173 146 203 106 102 109 114 109 120 88 86 91
189 173 214 198 179 251 165 147 180 115 110 120 119 115 124 87 84 91
230 199 262 242 208 278 176 153 194 112 108 115 120 116 125 95 92 97
210 190 231 221 200 242 117 111 122 119 117 122 125 121 129 69 67 71
180 171 188 206 196 217 106 106 105 108 105 112 114 111 117 67 66 69
192 183 202 206 179 217 102 97 108 126 128 125 131 134 129 65 64 67
223 211 238 243 236 259 137 126 152 128 126 131 134 131 137 83 80 87
202 183 202 207 190 224 146 130 162 107 105 110 111 108 114 84 79 90
-----
- - - - 103 104 102 109 109 110 64 68 60
173 173 155 177 185 170 106 107 103 109 114 105 117 121 114 61 61 62
155 132 162 168 170 166 64 66 87 100 98 101 103 101 104 62 60 65
-----
- - - - 73 73 72 82 82 82 57 63 52
151 142 161 163 152 167 113 106 122 96 96 97 100 100 101 66 67 65
153 160 144 186 189 183 72 77 67 97 98 96 104 106 103 62 63 60
150 132 167 164 137 192 101 95 105 97 98 96 108 107 108 65 64 66
168 163 185 168 166 200 95 91 111 92 90 94 95 94 97 62 60 65
132 120 144 152 140 162 70 66 78 89 86 91 94 91 98 63 61 66
206 185 226 210 190 236 150 138 163 112 114 110 117 119 116 87 88 86
126 118 132 128 126 142 73 76 85 93 93 94 97 96 99 53 53 54
97 85 113 122 107 137 86 74 100 60 59 60 69 67 70 52 48 57
163 152 174 152 137 167 94 97 92 94 95 93 99 98 99 68 60 77
-----
- - - - 114 117 112 118 120 116 68 66 69
156 158 153 167 160 176 87 88 86 107 105 108 115 112 118 61 61 62
183 170 196 195 182 209 140 128 152 106 104 108 110 107 114 78 80 75
..........................................................................................................................................
Infant and Child Mortality in India : District Level Estimates
59

7.10 Page 70

▲back to top


Sr. State/ District
No.
356 Vidisha
357 Bhopal
358 Sehore
359 Raisen
360 Betul
361 Harda
362 Hoshangabad
363 Katni
364 Jabalpur
365 Narsimhapur
366 Dindori
367 Mandla
368 Chhindwara
369 Seoni
370 Balaghat
GUJARAT
371 Kachchh
372 Banas Kantha
373 Patan
374 Mahesana
375 Sabar Kantha
376 Gandhinagar
377 Ahmadabad
378 Surendranagar
379 Rajkot
380 Jamnagar
381 Porbandar
382 Junagadh
383 Amreli
CMR 1991
CMR 2001
Total
TM F
Rural
TM F
Urban
TM F
Total
TM F
Rural
T MF
190 185 197 209 202 216 103 102 113 120 117 122 126 122 129
Urban
TM F
70 70 70
122 107 103 202 217 184 83 81 85 75 74 76 110 106 114 51 51 50
189 200 178 194 208 188 132 139 124 103 100 105 112 107 116 69 69 70
186 177 197 197 187 205 123 113 133 102 99 104 108 104 113 69 70 68
214 210 217 235 231 239 129 125 132 98 98 99 107 106 108 63 62 64
-----
- - - - 99 95 103 108 104 113 60 60 61
171 151 192 188 165 214 98 93 106 101 98 104 110 108 112 66 64 68
-----
- - - - 111 111 111 122 122 122 58 57 59
163 163 165 202 217 188 74 75 71 97 96 97 120 121 119 47 46 48
167 147 190 190 151 192 138 112 176 104 101 106 109 106 113 78 76 80
-----
- - - - 101 101 101 102 103 101 71 77 65
133 135 130 136 137 134 109 106 110 99 100 98 104 105 102 50 51 50
165 151 178 176 162 192 110 100 119 98 98 99 107 106 108 66 64 68
153 149 157 156 154 162 90 87 94 94 96 93 98 99 97 56 57 56
168 168 169 175 174 175 98 107 88 104 106 102 109 112 107 58 64 51
97 92 104 104 98 111 68 63 72 62 61 64 67
112 97 128 114 99 133 91 76 105 67 64 70 68
-----
- - - - 86 79 91 88
124 69 102 137 112 166 85 69 99 61 58 65 64
109 99 124 113 100 128 82 75 90 69 70 68 70
90 83 95 98 85 111 68 63 74 74 69 79 81
63 61 64 114 111 111 46 45 48 59 58 61 80
110 101 121 124 111 136 74 69 79 66 64 69 70
62 57 63 81 72 90 39 39 40 52 51 52 55
64 57 75 81 68 96 45 44 48 51 50 51 53
-----
- - - - 43 44 43 47
64 62 66 75 69 80 51 48 55 54 54 54 57
64 62 66 68 67 69 48 44 48 49 48 50 51
66 68 50 46 53
65 72 53 49 56
83 94 68 65 71
61 67 49 47 53
71 69 55 54 56
76 88 57 54 60
77 85 43 42 45
68 73 52 51 54
54 55 36 35 37
52 55 42 40 44
44 49 39 44 36
57 57 45 45 45
51 52 43 42 44
..........................................................................................................................................
60
Infant and Child Mortality in India : District Level Estimates

8 Pages 71-80

▲back to top


8.1 Page 71

▲back to top


CMR 1991
CMR 2001
Sr. State/ District
No.
384 Bhavnagar
Total
TM F
Rural
TM F
Urban
TM F
65 52 77 73 65 84 49 42 63
Total
TM F
50 49 51
Rural
T MF
53 53 53
Urban
TM F
44 40 47
385 Anand
-----
- - - - 76 74 78 81 79 83 61 60 62
386 Kheda
116 104 129 131 123 137 61 59 66 80 77 83 85 82 88 57 55 60
387 Panch Mahals
122 113 132 128 117 138 77 76 77 73 74 72 75 76 73 62 61 64
388 Dohad
-----
- - - - 84 86 83 86 88 85 59 59 59
389 Vadodara
83 77 91 102 97 109 55 51 63 65 66 65 77 78 77 48 48 48
390 Narmada
-----
- - - - 77 82 72 79 84 74 52 55 48
391 Bharuch
-----
- - - - 64 64 64 68 68 68 50 49 52
392 Surat
66 61 72 57 58 56 73 62 86 51 51 51 55 56 54 45 43 47
393 The Dangs
113 126 99 110 122 98 129 154 103 68 71 66 68 71 66
--
-
394 Navsari
-----
- - - - 53 58 48 54 61 48 49 50 47
395 Valsad
46 49 45 52 54 48 30 31 30 42 45 40 45 48 43 27 28 26
MAHARASHTRA
396 Nandurbar
-----
- - - - 74 76 71 78 81 75 46 48 44
397 Dhule
96 96 98 103 105 102 62 60 64 66 64 68 71 69 73 52 51 52
398 Jalgaon
82 86 77 96 95 99 53 53 52 59 56 62 65 62 69 41 39 44
399 Buldana
98 101 95 107 111 103 60 59 60 57 57 57 62 62 62 39 38 39
400 Akola
96 96 94 109 110 107 56 55 58 49 50 47 54 56 52 40 41 39
401 Washim
-----
- - - - 61 63 59 65 67 63 38 42 35
402 Amravati
105 109 101 123 128 119 60 65 55 71 72 69 80 81 79 52 53 50
403 Wardha
102 102 102 106 118 87 60 64 57 58 59 56 63 63 62 42 44 39
404 Nagpur
84 85 60 125 126 128 62 66 54 59 61 57 72 75 70 51 52 50
405 Bhandara
117 119 114 123 126 120 68 67 69 74 78 70 79 83 75 44 46 41
406 Gondiya
-----
- - - - 83 87 79 88 93 83 41 41 41
407 Gadchiroli
152 166 142 154 168 144 111 118 104 89 96 82 92 99 84 59 63 55
408 Chandrapur
118 117 119 136 135 138 74 80 67 79 83 75 92 98 86 52 54 50
409 Yavatmal
142 149 137 151 157 147 79 82 73 71 73 69 76 78 74 45 46 44
410 Nanded
88 87 88 99 100 99 40 42 36 69 70 68 76 77 75 36 38 34
411 Hingoli
-----
- - - - 64 64 64 69 69 69 37 36 37
..........................................................................................................................................
Infant and Child Mortality in India : District Level Estimates
61

8.2 Page 72

▲back to top


CMR 1991
CMR 2001
Sr. State/ District
No.
412 Parbhani
Total
TM F
Rural
TM F
Urban
TM F
93 95 61 100 102 100 63 65 59
Total
TM F
58 58 58
Rural
T MF
67 67 67
Urban
TM F
38 39 37
413 Jalna
80 82 78 86 86 87 52 60 44 67 66 69 72 71 74 44 45 42
414 Aurangabad
79 79 83 85 82 87 47 55 35 60 59 62 69 67 71 39 44 34
415 Nashik
84 86 71 98 97 99 69 68 69 60 60 60 66 67 65 50 49 51
416 Thane
54 56 49 80 84 79 34 38 30 49 52 46 65 69 61 32 35 28
417 Mumbai (Suburban) - - - - -
- - - - 44 44 43
-
- - 44 44 43
418 Mumbai
39 41 38 - -
- 39 41 38 47 46 48
-
- - 47 46 48
419 Raigarh
66 74 57 73 81 60 42 44 40 48 49 46 50 52 47 36 37 35
420 Pune
44 44 46 60 60 54 36 37 35 38 39 37 42 43 42 33 34 33
421 Ahmadnagar
61 61 60 64 64 52 37 42 32 56 56 56 58 58 59 36 40 31
422 Bid
75 74 85 79 78 85 49 51 46 51 49 53 54 53 56 36 40 33
423 Latur
67 60 78 80 75 85 41 44 39 61 58 62 63 63 64 39 41 36
424 Osmanabad
86 86 84 82 80 87 65 74 55 57 57 58 60 60 60 43 41 45
425 Solapur
65 64 67 68 68 74 48 52 47 52 51 53 53 53 53 45 44 45
426 Satara
48 48 48 49 48 50 38 41 35 37 37 38 38 38 38 30 29 32
427 Ratnagiri
51 54 49 53 55 49 31 30 32 38 40 36 39 41 36 28 27 29
428 Sindhudurg
50 45 52 50 43 53 45 50 38 35 35 34 35 36 35 28 27 29
429 Kolhapur
49 52 45 54 56 52 35 35 35 45 45 45 48 48 48 32 33 31
430 Sangli
47 49 44 51 55 49 32 35 29 38 37 38 38 39 38 30 33 28
ANDHRA PRADESH
431 Adilabad
61 65 59 71 76 71 42 41 46 49 51 45 55 59 51 31 32 29
432 Nizamabad
59 60 58 65 64 66 41 44 37 43 45 41 46 48 44 31 32 30
433 Karimnagar
42 44 42 47 48 43 29 27 31 35 37 34 37 40 35 28 30 27
434 Medak
65 65 65 72 71 72 29 30 29 45 47 44 48 51 46 27 28 26
435 Hyderabad
25 26 23 - -
- 25 26 23 24 24 22
-
- - 24 24 22
436 Rangareddy
54 53 54 76 76 76 28 29 28 41 42 40 52 54 49 27 28 26
437 Mahbubnagar
96 97 96 102 102 103 49 51 47 64 66 62 67 70 65 37 37 36
438 Nalgonda
73 78 69 77 81 73 44 48 39 55 56 53 58 60 56 32 34 30
439 Warangal
78 83 72 86 91 80 46 47 40 47 49 45 51 53 49 33 35 32
..........................................................................................................................................
62
Infant and Child Mortality in India : District Level Estimates

8.3 Page 73

▲back to top


Sr. State/ District
No.
440 Khammam
441 Srikakulam
442 Vizianagaram
443 Visakhapatnam
444 East Godavari
445 West Godavari
446 Krishna
447 Guntur
448 Prakasam
449 Nellore
450 Cuddapah
451 Kurnool
452 Anantapur
453 Chittoor
KARNATAKA
454 Belgaum
455 Bagalkot
456 Bijapur
457 Gulbarga
458 Bidar
459 Raichur
460 Koppal
461 Gadag
462 Dharwad
463 Uttara Kannada
464 Haveri
465 Bellary
466 Chitradurga
467 Davanagere
CMR 1991
CMR 2001
Total
TM F
Rural
TM F
Urban
TM F
66 73 60 73 78 67 43 51 39
Total
TM F
54 56 52
Rural
T MF
58 60 56
Urban
TM F
37 38 36
99 102 98 104 111 101 83 91 74 60 64 57 63 66 59 41 43 38
122 126 119 131 135 126 84 84 84 77 82 72 82 88 76 54 56 52
80 83 78 98 99 97 54 59 50 57 59 55 68 71 64 40 40 40
73 76 71 77 78 76 60 65 54 44 46 41 46 49 42 36 37 35
70 74 65 73 78 69 55 58 52 45 48 41 47 51 44 33 35 30
47 51 43 54 57 51 36 40 32 43 45 40 47 50 43 33 35 30
48 50 48 54 55 52 36 36 36 43 45 42 47 48 45 34 33 35
64 62 66 68 64 72 42 47 41 45 47 44 46 48 45 39 40 38
62 59 64 68 65 73 38 42 37 45 47 42 48 50 45 33 33 32
53 51 52 55 53 56 47 45 48 45 47 43 47 49 44 37 37 36
91 84 98 101 93 109 63 59 67 54 55 53 58 59 58 40 41 39
89 87 91 98 96 99 57 56 58 64 65 63 65 66 64 39 39 39
55 56 54 56 59 52 48 45 62 47 50 44 51 54 48 34 35 32
70 69 72 77 74 81 49 54 47 61 63 59 65
-----
- - - - 73 76 71 80
85 81 90 93 89 98 59 57 61 69 70 68 74
86 82 90 94 89 99 60 60 59 69 68 69 76
66 66 55 75 75 76 31 32 28 51 52 50 55
81 77 85 85 82 89 61 63 61 66 67 66 73
-----
- - - - 86 85 86 90
-----
- - - - 73 76 69 80
96 94 98 109 106 112 71 72 71 59 60 57 73
67 68 66 76 78 74 42 40 44 44 46 42 47
119 118 120 132 132 133 82 79 84 69 70 68 74
-----
- - - - 89 89 89 98
105 102 108 116 113 119 74 72 76 75 76 74 79
-----
- - - - 67 70 75 72
68 62 47 48 45
83 78 55 57 53
76 72 52 49 56
75 77 49 49 50
57 54 29 30 27
73 73 46 47 44
89 91 64 66 63
83 77 58 62 54
76 71 46 46 46
49 45 35 37 32
75 73 50 50 49
97 99 71 72 69
80 79 55 57 53
75 69 57 59 54
..........................................................................................................................................
Infant and Child Mortality in India : District Level Estimates
63

8.4 Page 74

▲back to top


CMR 1991
CMR 2001
Sr. State/ District
No.
468 Shimoga
Total
TM F
Rural
TM F
Urban
TM F
90 96 85 99 104 93 66 71 43
Total
TM F
50 53 47
Rural
T MF
54 58 51
Urban
TM F
40 42 38
469 Udupi
-----
- - - - 26 27 25 27 28 26 22 21 23
470 Chikmagalur
79 71 90 79 78 80 70 67 74 58 58 58 60 60 60 49 47 51
471 Tumkur
102 99 105 110 105 117 67 70 62 71 74 68 75 79 72 54 57 52
472 Kolar
85 95 83 95 103 94 58 67 53 62 65 60 69 72 66 43 44 42
473 Bangalore
58 60 67 97 92 101 54 55 61 40 41 40 50 49 50 39 39 39
474 Bangalore Rural
67 66 69 69 66 72 58 58 48 58 60 56 61 63 59 47 50 44
475 Mandya
74 74 74 76 76 76 66 67 63 67 69 65 70 72 67 52 51 53
476 Hassan
79 82 77 84 87 79 58 63 48 50 53 47 53 56 49 39 40 37
477 Dakshina Kannada 49 46 51 52 54 57 40 43 37 35 35 35 36 39 34 34 34 34
478 Kodagu
68 74 61 70 76 63 55 61 50 40 43 36 40 43 37 39 47 33
479 Mysore
91 91 88 95 101 97 64 67 62 67 71 63 78 84 73 45 46 44
480 Chamarajanagar
-----
- - - - 72 74 69 76 79 73 46 47 45
GOA
481 North Goa
58 54 61 63 60 66 42 42 39 30 31 29 31 30 32 30 32 27
482 South Goa
40 42 36 46 49 43 35 37 34 29 30 29 30 33 27 28 27 29
KERALA
483 Kasaragod
49 50 48 53 53 57 27 31 24 17 16 17 17 16 18 15 15 16
484 Kannur
42 46 39 46 46 46 35 37 32 16 15 18 16 14 17 16 15 18
485 Wayanad
58 58 58 59 58 59 39 48 28 25 24 27 25 24 27 25 24 26
486 Kozhikode
50 49 53 58 63 62 39 42 36 19 18 21 19 18 20 20 18 21
487 Malappuram
57 57 58 58 57 59 52 48 56 21 20 22 20 19 21 24 24 25
488 Palakkad
56 52 59 54 52 57 63 59 67 24 23 24 25 24 25 16 17 16
489 Thrissur
46 45 46 47 47 48 35 29 41 17 16 19 17 16 18 16 15 17
490 Ernakulam
42 37 49 42 35 49 43 38 50 18 16 21 18 16 21 16 14 18
491 Idukki
56 56 57 57 57 59 26 26 22 19 19 20 20 19 20 14 13 15
492 Kottayam
39 30 48 41 32 47 31 25 51 14 13 16 14 12 16 14 13 15
493 Alappuzha
42 43 45 40 46 40 45 37 58 19 17 21 18 16 20 19 17 21
494 Pathanamthitta
33 31 43 31 29 43 40 26 53 19 16 21 18 15 20 18 16 21
..........................................................................................................................................
64
Infant and Child Mortality in India : District Level Estimates

8.5 Page 75

▲back to top


CMR 1991
CMR 2001
Sr. State/ District
No.
495 Kollam
Total
TM F
Rural
TM F
Urban
TM F
47 45 55 43 44 53 60 49 70
Total
TM F
21 19 24
Rural
T MF
20 18 23
Urban
TM F
24 22 26
496 Thiruvananthapuram 31 31 29 32 38 29 27 27 25 22 20 25 23 21 25 20 17 22
TAMIL NADU
497 Thiruvallur
-----
- - - - 46 46 45 52 53 51 40 41 40
498 Chennai
-----
- - - - 48 47 49
-
- - 48 47 49
499 Kancheepuram
-----
- - - - 43 44 42 46 47 44 40 41 39
500 Vellore
-----
- - - - 56 56 55 59 59 59 51 52 50
501 Dharmapuri
77 72 89 81 74 98 73 80 56 56 51 62 59 53 65 41 40 43
502 Tiruvannamalai
73 67 80 77 68 84 46 42 46 55 56 55 59 59 58 41 40 42
503 Viluppuram
-----
- - - - 55 56 55 57 57 57 46 46 45
504 Salem
69 58 87 76 63 100 51 50 53 56 51 55 59 51 68 48 46 50
505 Namakkal
-----
- - - - 61 58 65 63 59 68 57 55 60
506 Erode
-----
- - - - 46 47 46 49 49 48 44 44 44
507 The Nilgiris
62 66 56 71 81 61 52 52 50 52 53 50 58 58 57 47 49 45
508 Coimbatore
54 59 52 69 69 69 45 50 42 56 57 56 63 63 62 42 45 38
509 Dindigul
88 81 95 93 88 99 67 59 77 58 58 59 60 59 61 55 55 55
510 Karur
-----
- - - - 49 48 49 51 51 51 44 44 44
511 Tiruchirappalli
89 122 71 76 75 78 133 200 52 48 49 47 52 52 52 42 44 41
512 Perambalur
-----
- - - - 57 58 57 61 62 60 34 35 33
513 Ariyalur
-----
- - - - 52 52 52 53 53 53 43 42 45
514 Cuddalore
-----
- - - - 47 48 46 51 52 50 38 39 37
515 Nagapattinam
-----
- - - - 45 46 45 46 46 45 44 45 43
516 Thiruvarur
55 57 53 58 60 55 48 49 48 38 39 38 39 39 39 36 36 36
517 Thanjavur
-----
- - - - 39 39 39 40 40 40 36 37 36
518 Pudukkottai
77 80 68 69 70 68 67 70 67 37 37 36 37 37 36 36 37 35
519 Sivaganga
-----
- - - - 48 47 48 49 49 49 43 42 45
520 Madurai
67 60 67 74 70 76 51 46 58 58 57 60 68 66 70 50 44 54
521 Theni
-----
- - - - 70 65 75 76 70 82 64 60 69
522 Virudhunagar
-----
- - - - 59 60 58 62 63 62 54 56 53
..........................................................................................................................................
Infant and Child Mortality in India : District Level Estimates
65

8.6 Page 76

▲back to top


CMR 1991
CMR 2001
Sr. State/ District
No.
523 Ramanathapuram
Total
TM F
Rural
TM F
Urban
TM F
68 65 73 77 74 80 52 67 35
Total
TM F
41 41 41
Rural
T MF
42 42 42
Urban
TM F
38 37 38
524 Thoothukkudi
-----
- - - - 47 48 46 49 51 48 44 44 43
525 Tirunelveli
100 98 102 107 104 110 83 77 85 42 43 40 44 45 43 39 40 37
526 Kanniyakumari
48 49 47 49 50 49 41 45 42 26 26 26 26 26 26 26 25 27
HIMACHAL PRADESH
527 Chamba
107 111 103 110 115 106 51 58 44 64 67 59 68 69 66 32 33 31
528 Kangra
64 67 59 64 68 59 50 55 44 37 39 36 37 38 37 31 34 27
529 Lahul & Spiti
121 138 118 121 138 118 - - - 49 54 46 49 54 46
--
-
530 Kullu
110 114 106 115 119 110 54 54 53 78 82 72 80 84 76 37 43 32
531 Mandi
90 92 87 92 95 89 59 64 53 67 72 63 69 75 65 43 44 41
532 Hamirpur
61 65 59 64 66 60 36 39 32 51 53 50 52 53 51 34 36 30
533 Una
80 85 76 83 87 77 54 58 50 54 55 53 54 55 53 35 30 42
534 Bilaspur
86 87 86 86 86 86 74 83 64 61 65 57 63 66 59 43 48 38
535 Solan
107 113 100 110 118 103 67 68 66 68 71 65 69 72 67 48 50 46
536 Sirmaur
129 135 123 132 138 127 64 71 55 79 81 78 80 82 79 44 43 46
537 Shimla
127 135 117 134 145 124 73 74 71 81 83 79 83 84 82 39 44 35
538 Kinnaur
154 161 144 154 161 144 - - - 78 81 76 78 81 76
--
-
PUNJAB
539 Gurdaspur
65 68 60 65 68 70 64 67 54 38 39 36 39 39 40 32 32 33
540 Amritsar
61 58 59 72 71 70 40 35 45 42 41 44 46 43 50 34 32 35
541 Kapurthala
61 62 61 71 74 72 33 35 31 38 38 38 39 39 40 30 32 28
542 Jalandhar
66 68 64 89 92 84 34 36 33 37 37 37 41 40 42 31 31 32
543 Hoshiarpur
80 72 90 86 82 92 47 46 75 47 46 47 50 49 51 34 31 38
544 Nawanshahr
-----
- - - - 39 39 40 40 39 41 34 33 35
545 Rupnagar
68 71 66 77 77 76 41 43 39 34 33 34 36 35 37 28 29 27
546 Fatehgarh Sahib
-----
- - - - 45 44 48 46 44 49 42 42 43
547 Ludhiana
51 44 57 76 71 82 31 27 34 43 42 44 46 44 48 41 39 42
548 Moga
-----
- - - - 43 43 44 44 42 45 37 38 36
549 Firozpur
72 79 65 79 83 72 53 62 43 48 48 50 51 50 52 40 38 41
..........................................................................................................................................
66
Infant and Child Mortality in India : District Level Estimates

8.7 Page 77

▲back to top


CMR 1991
CMR 2001
Sr. State/ District
No.
550 Muktsar
Total
TM F
---
Rural
TM F
--
-
Urban
TM F
---
Total
TM F
50 48 52
Rural
T MF
53 52 55
Urban
TM F
38 36 40
551 Faridkot
65 65 67 70 69 71 60 61 57 46 46 47 51 49 53 37 38 36
552 Bathinda
78 92 65 82 95 70 46 44 48 61 59 63 65 62 68 42 40 43
553 Mansa
-----
- - - - 61 60 63 66 64 68 43 42 44
554 Sangrur
85 82 90 94 91 96 60 61 58 61 60 62 66 65 68 48 46 49
555 Patiala
67 62 73 82 74 91 47 41 53 45 44 47 49 47 52 36 36 37
ARUNACHAL PRADESH
556 Tawang
108 116 86 108 116 86 - - - 88 85 91 91 90 92 68 54 82
557 West Kameng
156 158 142 159 161 146 79 52 108 77 80 74 81 84 78 32 39 26
558 East Kameng
260 288 300 260 288 300 - - - 141 140 142 162 163 161 91 95 87
559 Papum Pare
-----
- - - - 62 63 60 77 76 79 44 50 38
560 Lower Subansiri 156 159 153 201 208 193 57 67 62 123 122 124 138 135 140 32 32 32
561 Upper Subansiri 224 226 191 224 226 191 - - - 104 102 105 118 111 125 73 77 70
562 West Siang
122 127 118 131 136 126 53 66 64 56 59 54 57 59 54 45 48 42
563 East Siang
77 66 88 83 67 99 43 55 33 47 48 45 50 49 50 40 45 36
564 Upper Siang
-----
- - - - 67 69 65 67 69 65
--
-
565 Dibang Valley
137 135 95 145 143 147 87 104 103 71 72 69 77 77 77 30 30 30
566 Lohit
106 107 105 118 119 117 66 164 64 58 60 55 62 64 59 41 49 32
567 Changlang
111 119 109 111 119 109 - - - 64 65 63 64 66 62 58 61 56
568 Tirap
157 164 150 166 172 160 50 59 40 80 81 78 85 87 83 49 58 39
JAMMU AND KASHMIR
569 Kupwara
-----
- - - - 55 55 54 55 55 55 53 54 52
570 Baramula
-----
- - - - 51 50 52 59 59 58 50 50 51
571 Srinagar
-----
- - - - 44 41 49 49 47 50 40 41 42
572 Badgam
-----
- - - - 44 45 43 46 47 45 41 44 38
573 Pulwama
-----
- - - - 36 39 34 38 39 37 31 29 34
574 Anantnag
-----
- - - - 48 44 51 49 45 52 33 27 38
575 Leh (Ladakh)
-----
- - - - 55 55 55 57 58 55 46 44 49
576 Kargil
-----
- - - - 90 92 89 92 92 92 71 72 70
..........................................................................................................................................
Infant and Child Mortality in India : District Level Estimates
67

8.8 Page 78

▲back to top


Sr. State/ District
No.
577 Doda
578 Udhampur
579 Punch
580 Rajauri
581 Jammu
582 Kathua
A & N ISLAND
583 Andaman
584 Nicobar
585 Daman
586 Diu
PUDUCHERRY
587 Pondicherry
588 Mahe
589 Yanam
590 Karaikal
CHANDIGARH
591 Chandigarh
D&N HAVELI
592 D&N Haveli
LAKSHADWEEP
593 Lakshadweep
CMR 1991
CMR 2001
Total
TM F
Rural
TM F
Urban
TM F
Total
TM F
Rural
T MF
Urban
TM F
-----
- - - - 52 52 53 54 53 54 30 30 30
-----
- - - - 55 57 54 57 59 56 36 36 36
-----
- - - - 61 63 58 63 65 61 47 52 42
-----
- - - - 52 54 51 54 55 53 35 45 26
-----
- - - - 42 43 44 44 43 45 42 43 41
-----
- - - - 44 45 44 46 47 46 31 32 31
-----
-----
-----
-----
- - - - 46 45 46 47 47 46 40 39 41
----
- - - 31 34 28
--
-
- - - - 31 34 28 31 32 29 31 37 25
- - - - 44 47 42 50 51 49 36 41 31
67 68 66 76 78 73 62 63 61 36 48 35 41 43 39 34 35 33
NA NA NA NA NA NA NA NA NA 25 24 25 NA NA NA 25 24 25
NA NA NA NA NA NA NA NA NA 52 54 50 NA NA NA 52 54 50
NA NA NA NA NA NA NA NA NA 33 33 34 33 33 34 33 33 33
56 60 50 66 72 59 46 48 44 52 55 48 60 67 54 43 45 41
91 96 85 94 101 76 51 61 45 53 54 51 58 60 66 35 38 33
108 133 87 104 137 68 109 105 115 67 70 64 69 72 65 59 59 60
..........................................................................................................................................
68
Infant and Child Mortality in India : District Level Estimates

8.9 Page 79

▲back to top


8.10 Page 80

▲back to top


9 Pages 81-90

▲back to top


9.1 Page 81

▲back to top


Appendix-1 : Differential by Place of Residence & Sex in IMR
HARYANA
Panchkula
Ambala
Yamunanagar
Kurukshetra
Kaithal
Karnal
Panipat
Sonipat
Jind
Fatehabad
Sirsa
Hisar
Bhiwani
Rohtak
Jhajjar
Mahendragarh
Rewari
Gurgaon
Faridabad
UTTARAKHAND
Uttarkashi
Chamoli
Rudraprayag
Tehri
Dehradun
Garhwal
Pithoragarh
Bageshwar
Almora
Champawat
Nainital
Udham Singh Nagar
Hardwar
ASSAM
Kokrajhar
1991
Ratio of R/U
Ratio of M/F
T
M
F
T
R
U
2001
Ratio of R/U
Ratio of M/F
T
M
F
T
R
U
-
-
-
1.4 1.8 1.1
2.1 1.9 1.7
2.2 2.1 2.5
1.5 1.0 2.8
1.8 1.7 1.6
1.5 1.2 1.8
1.0 1.0 1.1
1.0 1.4 1.3
-
-
-
1.0 1.0 1.0
1.7 1.9 1.7
1.9 2.3 1.4
1.6 1.5 1.7
-
-
-
1.6 1.4 1.1
1.6 1.6 1.6
1.2 1.0 1.7
1.7 1.8 1.6
-
-
- 1.2 1.2 1.3 0.9 0.8
0.9
1.1
1.2 0.8 1.6 2.3 1.3 1.1 1.4
0.7
0.8
0.8 0.7 1.6 1.4 1.7 0.8 0.7
0.9
1.0
0.9 1.1 2.0 1.8 2.3 1.1 0.9
1.2
0.8
0.7 2.0 1.3 1.1 1.6 0.8 0.8
1.2
1.1
1.1 1.0 1.5 1.5 1.5 0.9 0.9
0.9
0.8
0.7 1.1 1.3 1.2 1.5 0.8 0.8
1.1
1.3
1.1 1.2 1.3 1.5 1.2 1.3 1.2
0.9
1.0
1.0 0.9 1.5 1.5 1.5 0.9 0.9
0.9
-
-
- 1.7 1.5 1.8 1.0 0.9
1.1
0.8
0.8 0.9 1.1 1.2 1.1 0.9 0.9
0.9
1.0
1.0 0.8 1.7 1.8 1.5 0.9 0.9
0.8
0.9
1.0 0.6 1.9 2.0 1.7 1.0 1.0
0.8
0.9
0.9 1.0 1.5 1.5 1.5 0.9 0.9
0.9
-
-
- 1.3 1.3 1.4 0.9 0.9
0.9
0.9
1.0 0.7 1.6 1.7 1.5 0.9 0.9
0.8
1.0
1.0 1.0 1.4 1.3 1.4 1.0 1.0
1.1
1.0
0.9 1.5 1.4 1.1 1.9 0.9 0.9
1.4
0.9
1.0 0.8 1.4 1.3 1.5 0.9 0.8
0.9
1.8 2.6 1.4
1.4 1.1 1.9
-
-
-
1.3 1.3 1.4
2.0 2.2 1.8
2.3 1.5 2.9
1.0 1.1 0.9
-
-
-
1.2 1.0 1.4
-
-
-
1.4 1.3 1.4
-
-
-
1.6 1.9 1.4
1.2
1.1 0.6 2.0 2.3 1.7 1.1 1.1
0.8
1.3
1.3 2.3 1.6 1.1 1.9 1.2 1.2
2.0
-
-
- 0.9 0.7 2.2 1.1 1.1
3.5
1.2
1.2 1.3 1.2 1.2 1.3 1.1 1.1
1.1
1.2
1.2 1.1 1.7 1.8 1.8 1.0 1.1
1.1
0.7
0.7 1.3 2.3 1.5 2.8 0.7 0.8
1.4
1.2
1.2 1.0 1.1 1.2 0.9 1.3 1.3
0.9
-
-
- 1.2 1.8 0.8 1.4 1.5
0.7
1.0
1.0 1.4 1.1 1.0 1.2 1.0 1.0
1.2
-
-
- 1.6 1.4 1.9 1.1 1.1
1.5
0.9
0.8 0.9 1.5 1.4 1.6 0.8 0.8
0.8
-
-
- 1.2 1.2 1.1 1.1 1.1
1.0
1.0
1.0 0.7 1.9 2.0 1.9 0.9 1.0
0.9
0.6 1.1 0.4
0.8
0.9 0.3 1.3 1.3 1.3 0.9 0.9
0.9
..........................................................................................................................................
Infant and Child Mortality in India : District Level Estimates
71

9.2 Page 82

▲back to top


Dhubri
Goalpara
Bongaigaon
Barpeta
Kamrup
Nalbari
Darrang
Marigaon
Nagaon
Sonitpur
Lakhimpur
Dhemaji
Tinsuki
Dibrugarh
Sibsagar
Jorhat
Golaghat
Karbi Anglong
North Cacher Hills
Cacher
Karimganj
Hailakandi
RAJASTHAN
Ganganagar
Hanumangarh
Bikaner
Churu
Jhunjhunun
Alwar
Bharatpur
Dhaulpur
Karauli
Sawai Madhopur
Dausa
Jaipur
Sikar
1991
Ratio of R/U
Ratio of M/F
T
M
F
T
R
U
1.2 1.3 1.1
1.1
1.1 0.9
1.7 1.3 2.3
1.0
1.0 1.7
0.7 0.8 0.7
1.0
1.1 0.9
1.5 1.6 1.4
1.1
1.1 0.9
1.9 2.4 1.5
1.0
1.1 0.7
1.5 1.7 1.3
1.1
1.1 0.9
1.9 1.7 2.3
1.0
1.0 1.4
1.2 1.1 1.4
1.0
1.0 1.3
1.6 1.5 1.8
1.0
1.0 1.3
1.4 1.5 1.4
0.9
1.0 0.9
1.1 1.3 1.0
1.0
1.0 0.8
0.9 1.6 0.6
1.4
1.4 0.5
1.3 1.3 1.4
1.0
1.0 1.1
1.4 1.1 1.8
1.1
1.0 1.6
2.2 2.5 1.8
1.2
1.2 0.8
1.1 0.8 1.4
0.8
0.7 1.3
1.6 1.8 1.4
1.1
1.1 0.9
1.2 1.6 1.0
0.8
0.8 0.5
2.3 1.7 3.3
1.2
1.1 2.1
1.4 1.7 1.3
1.0
1.1 0.8
1.8 1.9 1.9
1.1
1.1 1.1
1.8 1.7 1.9
1.1
1.1 1.2
2001
Ratio of R/U
Ratio of M/F
T
M
F
T
R
U
1.3 1.5 1.2 1.2 1.1
0.9
1.6 1.3 1.9 1.2 1.1
1.5
2.0 2.2 1.8 1.1 1.1
0.9
1.5 1.5 1.4 1.2 1.1
1.1
1.6 2.0 1.3 1.2 1.2
0.7
1.6 1.8 1.4 1.2 1.2
0.9
1.8 1.7 2.0 1.1 1.1
1.3
1.2 1.1 1.2 1.1 1.1
1.2
1.5 1.5 1.6 1.2 1.1
1.2
1.4 1.5 1.3 1.0 1.0
0.9
1.0 1.2 0.9 1.0 1.0
0.8
1.4 1.3 1.4 1.2 1.2
1.3
1.6 1.5 1.5 1.2 1.2
1.2
1.2 1.2 1.4 1.2 1.2
1.3
2.2 2.6 1.8 1.2 1.2
0.8
1.2 1.0 1.4 0.8 0.7
1.1
1.4 1.5 1.3 1.2 1.2
1.0
1.3 1.5 1.2 0.9 0.9
0.7
1.9 1.6 2.8 1.1 1.1
1.9
1.3 1.5 1.2 1.1 1.1
0.9
1.8 1.8 1.8 1.1 1.1
1.1
1.6 1.6 1.7 1.1 1.1
1.1
1.3 1.1 1.5
-
-
-
1.8 1.9 1.7
1.1 1.1 1.1
0.9 0.7 1.6
1.4 1.6 1.4
1.4 1.5 1.3
-
-
-
-
-
-
1.6 1.9 1.5
-
-
-
1.8 1.6 2.0
1.3 1.4 1.3
0.9
0.9 1.2 1.3 1.2 1.5 0.9 0.9
1.2
-
-
- 1.2 1.2 1.3 0.9 0.9
1.0
1.0
1.0 0.9 1.5 1.6 1.5 1.0 1.0
0.9
0.8
0.8 0.9 1.2 1.1 1.2 0.9 0.8
0.9
1.0
0.9 2.0 1.1 0.9 1.9 1.0 0.9
1.9
1.1
1.1 0.9 1.3 1.4 1.4 0.9 0.9
0.9
0.8
0.8 0.8 1.3 1.4 1.3 0.9 0.9
0.8
0.8
- 0.8 1.5 1.4 1.5 0.8 0.7
0.8
-
-
- 1.4 1.4 1.4 0.8 0.8
0.8
0.8
0.8 0.7 1.7 2.0 1.5 0.9 0.9
0.7
-
-
- 1.2 1.3 1.2 0.9 0.9
0.9
1.0
0.9 1.1 1.8 1.6 2.0 1.0 0.9
1.1
0.8
0.9 0.8 1.3 1.4 1.2 0.9 1.0
0.8
..........................................................................................................................................
72
Infant and Child Mortality in India : District Level Estimates

9.3 Page 83

▲back to top


Nagaur
Jodhpur
Jaisalmer
Barmer
Jalor
Sirohi
Pali
Ajmer
Tonk
Bundi
Bhilwara
Rajsamand
Udaipur
Dungarpur
Banswara
Chittaurgarh
Kota
Baran
Jhalawar
DELHI
North West
North
North East
East
New Delhi
Central
West
South West
South
UTTAR PRADESH
Saharanpur
Muzaffarnagar
Bijnor
Moradabad
Rampur
Jyotiba Phule Nagar
1991
Ratio of R/U
Ratio of M/F
T
M
F
T
R
U
1.4 1.3 1.6
1.5 1.8 1.4
0.9
0.8 1.0
0.9
0.9 0.7
2.2 2.4 2.1
1.4 1.2 1.6
2.0 2.1 1.9
2.6 2.0 2.9
0.7
0.7 0.6
1.1
1.1 1.4
0.9
0.9 0.8
1.0
0.9 1.4
1.6 1.6 1.6
1.7 1.5 1.9
1.5 1.6 1.4
1.4 1.6 1.2
0.9
0.9 1.0
1.0
0.9 1.1
1.1
1.1 0.9
1.0
1.0 0.7
1.7 1.9 1.5
-
-
-
2.2 2.5 1.9
1.7 2.0 1.5
1.1
1.1 0.9
-
-
-
1.1
1.2 0.9
1.0
1.0 0.8
2.6 2.2 3.5
1.6 1.4 1.8
2.0 2.2 1.8
-
-
-
1.1
1.1 1.8
1.1
1.1 1.3
0.9
0.9 0.8
-
-
-
2.0 2.0 2.0
1.0
1.0 1.1
2001
Ratio of R/U
Ratio of M/F
T
M
F
T
R
U
1.4 1.3 1.5 0.9 0.9
1.1
1.4 1.5 1.3 0.9 0.9
0.7
2.0 2.3 1.9 0.8 0.7
0.6
1.3 1.3 1.4 1.1 1.1
1.2
1.9 2.1 1.8 0.9 0.9
0.8
2.3 2.0 2.5 1.0 0.9
1.2
1.7 1.8 1.6 0.9 0.9
0.9
1.6 1.6 1.7 1.0 1.0
1.1
1.6 1.6 1.6 1.1 1.0
1.0
1.5 1.6 1.5 1.0 1.0
0.9
1.7 1.9 1.5 1.1 1.1
0.9
1.2 1.2 1.3 1.0 1.0
1.1
2.3 2.5 2.1 1.1 1.1
0.9
1.7 2.0 1.5 1.1 1.0
0.8
2.7 2.3 3.5 1.1 1.1
1.7
1.6 1.5 1.7 1.1 1.0
1.2
1.8 2.0 1.7 1.0 1.0
0.8
1.5 1.4 1.5 1.0 1.0
1.1
1.8 1.8 1.8 1.0 1.0
1.0
-
-
-
-
-
-
-
-
-
-
-
-
-
-
-
-
-
-
-
-
-
-
-
-
-
-
-
-
-
- 1.1 1.1 1.0 1.0 1.0
1.0
-
-
- 1.2 1.3 1.1 1.0 1.2
1.0
-
-
- 1.0 1.1 0.9 1.1 1.3
1.0
-
-
- 1.7 1.7 1.8 1.0 0.9
1.0
-
-
- 0.0 0.0 0.0 1.1
-
1.1
-
-
- 0.0 0.0 0.0 1.0
-
1.0
-
-
- 1.2 1.4 1.0 1.0 1.3
0.9
-
-
- 1.0 0.9 1.0 1.0 0.9
1.0
-
-
- 0.9 0.9 0.9 1.0 1.0
1.0
1.6 1.4 1.9
1.2 1.3 1.2
1.6 1.9 1.5
1.7 1.6 1.9
1.2 1.4 1.1
-
-
-
1.0
1.0 1.3 1.7 1.5 2.0 0.9 1.0
1.2
0.9
0.9 0.8 1.2 1.2 1.2 0.9 0.9
0.9
0.9
1.0 0.8 1.4 1.5 1.3 1.0 1.0
0.9
0.9
0.9 1.1 1.9 1.8 1.9 0.9 0.9
1.0
0.8
0.8 0.7 1.4 1.4 1.3 0.9 0.9
0.8
-
-
- 1.5 1.5 1.6 1.0 1.0
1.0
..........................................................................................................................................
Infant and Child Mortality in India : District Level Estimates
73

9.4 Page 84

▲back to top


Meerut
Baghpat
Ghaziabad
Gautam Buddha Nagar
Bulandshahr
Aligarh
Hathras
Mathura
Agra
Firozabad
Etah
Mainpuri
Budaun
Bareilly
Pilibhit
Shahjahanpur
Kheri
Sitapur
Hardoi
Unnao
Lucknow
Rae Bareli
Farrukhabad
Kannauj
Etawah
Auraiya
Kanpur Dehat
Kanpur Nagar
Jalaun
Jhansi
Lalitpur
Hamirpur
Mahoba
Banda
Chitrakoot
Fatehpur
1991
Ratio of R/U
Ratio of M/F
T
M
F
T
R
U
1.4 1.2 1.6
0.9
0.9 1.1
-
-
-
-
-
-
1.3 1.0 1.7
0.9
0.7 1.2
-
-
-
-
-
-
1.3 1.2 1.4
0.9
0.9 1.0
1.4 1.3 1.4
0.9
0.8 0.9
-
-
-
-
-
-
1.3 1.2 1.3
0.9
0.9 1.0
1.9 2.1 1.8
0.8
0.8 0.7
1.3 1.3 1.4
0.8
0.8 0.8
1.4 1.4 1.5
0.8
0.8 0.8
1.4 1.4 1.4
0.8
0.8 0.7
1.5 1.5 1.6
1.0
1.0 1.1
1.8 1.7 1.9
0.9
0.9 1.0
1.9 2.2 1.7
0.9
0.9 0.7
1.4 2.0 1.2
0.8
0.9 0.6
1.9 2.3 1.6
1.1
0.9 0.7
1.7 1.9 1.5
1.0
1.0 0.8
2.7 2.2 3.4
1.0
1.0 1.5
1.9 2.3 1.6
0.9
0.9 0.6
2.7 2.5 2.8
0.9
0.9 1.0
1.3 1.4 1.3
0.9
0.9 0.9
1.5 1.6 1.4
0.9
0.9 0.8
-
-
-
-
-
-
1.8 1.8 1.9
0.9
0.9 0.9
-
-
-
-
-
-
1.8 1.9 1.7
0.9
0.9 0.8
1.8 1.8 2.1
1.1
1.0 1.2
1.4 1.9 1.1
0.9
1.0 0.6
1.6 1.6 1.6
0.9
0.9 0.9
2.6 2.7 2.6
0.9
0.9 0.9
1.6 1.6 1.6
0.9
0.9 0.9
-
-
-
-
-
-
2.4 2.8 2.0
1.0
1.0 0.7
-
-
-
-
-
-
1.8 1.5 2.4
1.1
1.0 1.6
2001
Ratio of R/U
Ratio of M/F
T
M
F
T
R
U
1.4 1.3 1.5 0.9 0.9
1.1
1.3 1.2 1.4 0.9 0.9
1.1
1.3 1.1 1.6 0.9 0.8
1.1
1.1 1.0 1.1 0.9 0.8
0.9
1.4 1.3 1.5 0.9 0.9
1.1
1.4 1.3 1.4 0.9 0.9
0.9
1.2 1.2 1.3 0.9 0.8
1.0
1.3 1.3 1.3 0.9 0.9
0.9
2.0 2.1 1.8 0.9 0.8
0.8
1.2 1.2 1.2 0.9 0.8
0.9
1.3 1.3 1.3 0.9 0.9
0.9
1.4 1.4 1.3 0.9 0.9
0.8
1.5 1.4 1.7 0.9 1.0
1.1
1.6 1.6 1.7 1.0 0.9
1.0
2.0 2.2 1.9 0.9 0.9
0.8
1.5 1.8 1.3 0.9 0.9
0.7
1.9 2.3 1.7 1.0 1.0
0.7
1.9 2.0 1.8 1.0 1.0
0.9
2.4 2.1 3.0 1.0 0.9
1.3
1.9 2.2 1.7 1.0 1.0
0.7
2.5 2.5 2.5 0.9 0.9
0.9
1.4 1.5 1.3 0.9 0.9
0.9
1.4 1.5 1.4 0.9 0.9
0.9
1.2 1.3 1.2 0.9 0.9
0.9
1.7 1.6 1.7 0.9 0.9
0.9
1.4 1.4 1.3 1.0 1.0
0.9
1.7 1.9 1.7 0.9 0.9
0.8
1.9 1.8 2.1 1.1 1.0
1.2
1.5 1.9 1.3 0.9 0.9
0.7
1.6 1.6 1.6 0.9 0.9
0.9
2.7 2.9 2.6 0.9 0.9
0.8
1.4 1.4 1.4 0.9 0.9
0.9
1.4 1.5 1.3 1.0 1.0
0.9
2.4 2.7 2.1 1.0 1.0
0.8
1.4 1.4 1.5 1.0 0.9
1.0
1.7 1.4 2.2 1.0 1.0
1.6
..........................................................................................................................................
74
Infant and Child Mortality in India : District Level Estimates

9.5 Page 85

▲back to top


Pratapgarh
Kaushambi
Allahabad
Barabanki
Faizabad
Ambedkar Nagar
Sultanpur
Bahraich
Shrawasti
Balrampur
Gonda
Siddharthnagar
Basti
Sant Kabir Nagar
Maharajganj
Gorakhpur
Kushinagar
Deoria
Azamgarh
Mau
Ballia
Jaunpur
Ghazipur
Chandauli
Varanasi
Sant Ravidas Nagar Bhadohi
Mirzapur
Sonbhadra
BIHAR
Pashchim Champaran
Purba Champaran
Sheohar
Sitamarhi
Madhubani
Supaul
Araria
1991
Ratio of R/U
Ratio of M/F
T
M
F
T
R
U
1.3 2.4 0.9
0.9
0.9 0.3
-
-
-
-
-
-
1.1 1.3 0.9
0.9
0.9 0.7
1.6 1.4 1.8
0.9
0.9 1.1
1.6 1.5 1.8
1.0
0.9 1.1
-
-
-
-
-
-
1.6 1.5 1.8
0.8
0.8 0.9
1.1 1.0 1.3
1.0
1.0 1.2
-
-
-
-
-
-
-
-
-
-
-
-
1.0 1.9 0.8
0.8
0.8 0.3
1.4 1.5 1.3
0.9
0.9 0.8
1.4 1.1 2.1
1.0
1.0 1.8
-
-
-
-
-
-
1.3 1.3 1.3
0.9
0.9 1.0
1.5 1.3 1.7
1.0
0.9 1.2
-
-
-
-
-
-
2.0 2.0 1.9
0.8
0.8 0.8
1.5 1.4 1.7
0.9
0.9 1.1
1.2 1.1 1.2
1.0
1.0 1.1
1.0 0.8 1.3
0.9
0.8 1.4
1.4 1.4 1.5
1.0
1.0 1.0
0.9 0.8 1.1
0.9
0.9 1.2
-
-
-
-
-
-
1.5 1.4 1.5
0.8
0.8 0.8
-
-
-
-
-
-
1.3 1.5 1.2
0.7
0.7 0.6
2.2 3.7 1.9
1.0
1.0 0.5
2001
Ratio of R/U
Ratio of M/F
T
M
F
T
R
U
1.7 2.1 1.5 0.9 0.9
0.6
1.3 1.3 1.4 1.0 1.0
1.0
1.2 1.4 1.1 0.9 0.9
0.7
1.7 1.4 1.9 0.9 0.9
1.1
1.6 1.6 1.7 1.0 1.0
1.1
1.3 1.4 1.3 1.0 1.0
0.9
1.7 1.6 1.8 0.8 0.8
1.0
1.2 1.1 1.4 1.0 1.0
1.2
1.3 1.2 1.5 0.8 0.8
1.1
1.4 1.4 1.3 0.9 0.9
0.8
2.0 1.7 2.4 0.8 0.8
1.1
1.3 1.4 1.3 0.9 0.9
0.8
1.4 1.1 1.9 0.9 1.0
1.6
1.3 1.3 1.2 1.0 1.0
0.9
1.2 1.3 1.2 1.0 1.0
1.0
1.3 1.3 1.4 1.0 1.0
1.1
1.3 1.3 1.3 1.0 1.0
1.0
1.8 1.9 1.7 0.9 0.9
0.8
1.5 1.4 1.5 1.0 1.0
1.1
1.1 1.1 1.1 1.1 1.1
1.0
1.0 0.8 1.3 0.9 0.9
1.4
1.5 1.4 1.5 0.9 0.9
1.0
1.1 1.0 1.1 0.9 0.9
0.9
1.4 1.3 1.4 0.9 0.9
1.0
1.5 1.4 1.5 0.8 0.8
0.8
1.4 1.3 1.5 0.9 0.9
1.0
1.4 1.4 1.4 0.8 0.8
0.8
2.7 3.7 2.0 1.0 1.0
0.6
1.5 1.8 1.3
1.0 1.0 1.0
-
-
-
1.9 1.7 2.1
1.0 0.9 1.1
-
-
-
1.3 1.3 1.2
0.7
0.8 0.6 1.5 1.6 1.4 0.8 0.8
0.6
0.7
0.6 0.7 1.1 1.0 1.1 0.8 0.8
0.8
-
-
- 1.3 1.2 1.3 0.8 0.9
0.9
0.7
0.7 0.9 1.7 1.3 2.0 0.6 0.6
1.0
0.7
0.7 0.8 1.1 1.2 1.1 0.7 0.7
0.7
-
-
- 0.9 0.9 1.0 0.9 0.9
1.0
0.9
1.1 1.0 1.3 1.4 1.2 0.9 1.1
1.0
..........................................................................................................................................
Infant and Child Mortality in India : District Level Estimates
75

9.6 Page 86

▲back to top


Kishanganj
Purnia
Katihar
Madhepura
Saharsa
Darbhanga
Muzaffarpur
Gopalganj
Siwan
Saran
Vaishali
Samastipur
Begusarai
Khagaria
Bhagalpur
Banka
Munger
Lakhisarai
Sheikhpura
Nalanda
Patna
Bhojpur
Buxar
Kaimur (Bhabua)
Rohtas
Jehanabad
Aurangabad
Gaya
Nawada
Jamui
SIKKIM
North
West
South
East
1991
Ratio of R/U
Ratio of M/F
T
M
F
T
R
U
1.6 1.6 1.7
1.0
1.0 1.0
1.4 1.1 2.0
0.8
0.8 1.5
1.8 1.5 2.3
1.0
1.0 1.4
1.1 1.3 0.9
0.7
0.8 0.5
1.4 1.8 1.4
0.7
0.7 0.6
1.6 1.4 1.7
0.7
0.6 0.7
1.6 1.4 1.9
0.8
0.8 1.1
1.4 1.8 1.2
0.9
0.9 0.6
1.4 1.1 1.6
0.7
0.7 1.0
0.9 1.3 0.5
0.7
0.9 0.3
1.2 1.1 1.4
0.7
0.7 0.9
1.1 1.1 1.1
0.7
0.7 0.7
1.7 1.5 1.8
0.7
0.7 0.8
3.6 2.7 3.9
1.0
1.0 1.4
1.3 1.2 1.5
0.8
0.8 1.0
-
-
-
-
-
-
1.3 1.5 1.2
0.7
0.7 0.6
-
-
-
-
-
-
-
-
-
-
-
-
1.2 1.2 1.3
0.8
0.8 0.8
1.1 1.2 1.3
0.8
0.8 0.8
1.2 1.1 1.3
0.7
0.7 0.7
-
-
-
-
-
-
-
-
-
-
-
-
0.9 1.0 0.9
0.8
0.8 0.8
1.3 1.0 1.7
0.9
0.8 1.4
1.1 1.0 1.2
0.8
0.7 0.8
1.3 1.3 1.3
0.7
0.7 0.8
1.7 2.1 1.6
0.7
0.7 0.6
-
-
-
-
-
-
2001
Ratio of R/U
Ratio of M/F
T
M
F
T
R
U
1.4 1.3 1.5 0.9 1.0
1.1
1.5 1.3 1.5 0.9 1.0
1.2
1.9 2.1 2.4 1.0 1.0
1.1
1.3 1.1 1.5 0.7 0.7
1.0
1.4 1.5 1.4 0.7 0.7
0.7
1.4 1.4 1.5 0.8 0.8
0.8
1.8 1.9 1.7 0.9 0.9
0.9
1.5 1.8 1.2 0.9 0.9
0.6
1.6 1.3 2.1 0.8 0.7
1.2
1.2 1.1 1.3 0.8 1.0
1.1
1.4 1.2 1.6 0.7 0.7
0.9
1.2 1.3 1.2 0.7 0.8
0.7
1.7 1.5 2.0 0.8 0.8
1.0
3.1 2.7 3.2 0.9 0.9
1.1
1.4 1.2 1.6 0.8 0.7
1.0
1.5 1.6 1.4 0.9 0.9
0.8
1.3 1.2 1.3 0.7 0.7
0.7
1.1 1.2 1.1 1.0 1.0
0.9
1.2 1.1 1.3 0.8 0.8
1.0
1.3 1.3 1.4 0.9 0.9
1.0
1.5 1.5 1.5 0.9 0.9
0.9
1.5 1.2 1.8 0.7 0.7
1.0
1.2 1.1 1.2 0.9 0.9
1.0
3.0 3.0 2.9 1.0 1.0
1.0
1.1 1.2 1.2 0.9 0.9
0.9
1.2 1.1 1.4 1.0 1.0
1.2
1.2 1.0 1.4 0.7 0.7
1.0
1.3 1.6 1.3 0.9 0.9
0.7
1.7 1.8 1.6 0.7 0.7
0.6
1.3 1.2 1.5 0.9 0.9
1.2
0.9 0.8 1.1
0.8 0.9 0.7
1.0 0.9 1.0
1.2 1.2 1.3
1.1
1.1 1.4 0.9 0.9 0.9 1.2 1.2
1.2
1.0
1.0 0.8 0.7 0.8 0.6 1.0 1.1
0.9
0.9
0.9 1.1 1.2 1.2 1.3 0.9 1.0
1.1
1.2
1.1 1.2 1.2 1.1 1.2 1.0 1.0
1.1
..........................................................................................................................................
76
Infant and Child Mortality in India : District Level Estimates

9.7 Page 87

▲back to top


NAGALAND
Mon
Tuensang
Mokokchung
Zunheboto
Wokha
Dimapur
Kohima
Phek
MANIPUR
Senapati
Tamenglong
Churachandpur
Bishnupur
Thoubal
Imphal West
Imphal East
Ukhrul
Chandel
MIZORAM
Mamit
Kolasib
Aizawl
Champhai
Serchhip
Lunglei
Lawngtlai
Saiha
TRIPURA
West Tripura
South Tripura
Dhalai
North Tripura
MEGHALAYA
West Garo Hills
East Garo Hills
1991
Ratio of R/U
Ratio of M/F
T
M
F
T
R
U
2001
Ratio of R/U
Ratio of M/F
T
M
F
T
R
U
2.1 2.9 1.6
1.0 1.1 1.0
1.8 2.0 1.8
0.9 0.8 0.8
1.1 1.0 1.3
1.1 1.2 0.9
1.3 1.4 1.1
-
-
-
0.8
0.9 0.5 1.4 1.9 1.2 0.8 0.8
0.5
0.8
0.8 0.7 1.1 1.3 1.0 0.8 0.8
0.6
1.4
1.1 1.1 1.8 2.0 1.8 1.5 1.1
1.1
1.1
0.9 0.9 0.9 0.9 0.9 0.8 0.8
0.8
1.0
1.0 1.3 1.4 1.2 1.8 0.9 0.9
1.4
1.0
1.1 0.8 1.0 0.9 1.0 1.0 1.0
1.1
0.8
0.7 0.6 1.3 1.3 1.2 0.9 0.9
0.8
-
-
- 1.2 1.6 1.1 0.7 0.8
0.5
-
-
-
-
-
-
1.3 1.1 1.3
0.9 1.0 0.7
0.6 0.6 0.6
-
-
-
-
-
-
-
-
-
-
-
-
1.0
1.0
-
-
-
- 0.9 0.9
-
0.8
0.8
-
-
-
- 0.8 0.8
-
0.9
0.9 1.1
-
-
- 1.0 1.0
-
0.9
1.1 0.7 0.9 1.1 0.8 1.0 1.1
-
1.1
1.1 1.2 1.0 1.0 0.9 1.0 1.1
0.9
-
-
- 1.0 1.0 1.0 1.1 1.1
1.1
-
-
- 0.9 1.1 0.8 1.0 1.1
0.8
0.9
0.9
-
-
-
- 0.8 0.8
-
-
-
- 1.2 1.2 1.1 1.0 1.1
0.9
-
-
-
-
-
-
2.5 2.3 2.7
-
-
-
-
-
-
2.5 2.4 2.5
-
-
-
-
-
-
-
-
- 2.2 2.6 1.8 1.1 1.2
0.8
-
-
- 1.4 1.6 1.3 1.1 1.1
0.9
1.1
1.1 1.3 2.3 2.6 2.0 1.1 1.1
0.8
-
-
- 1.5 1.4 1.5 1.0 1.0
1.0
-
-
- 1.5 1.7 1.2 1.3 1.4
1.0
1.1
1.2 1.2 2.2 2.3 2.1 0.9 1.0
0.9
-
-
-
-
-
- 0.9 0.9
-
-
-
- 1.8 1.9 1.7 1.2 1.2
1.1
1.3 1.4 1.3
1.2 1.2 1.2
1.0 1.1 0.9
-
-
-
1.2
1.2 1.1 1.1 1.1 1.1 1.1 1.1
1.1
1.1
1.2 1.2 1.3 1.2 1.4 1.0 1.0
1.2
1.2
1.2 1.0 1.6 1.4 2.2 1.1 1.1
1.7
-
-
- 1.1 1.2 1.0 1.1 1.1
1.0
1.7 1.7 1.7
1.6 1.6 1.6
1.0
1.1 1.1 2.0 2.2 2.0 1.0 1.0
0.9
1.0
1.0 1.0 1.9 2.0 1.8 1.0 1.0
0.9
..........................................................................................................................................
Infant and Child Mortality in India : District Level Estimates
77

9.8 Page 88

▲back to top


South Garo Hills
West Khasi Hills
Ri Bhoi
East Khasi Hills
Jaintia Hills
WEST BENGAL
Darjiling
Jalpaiguri
Koch Bihar
Uttar Dinajpur
Dakshin Dinajpur
Maldah
Murshidabad
Birbhum
Barddhaman
Nadia
North Twenty Four Parganas
Hugli
Bankura
Puruliya
Medinipur
Haora
Kolkata
South Twenty Four Parganas
JHARKHAND
Garhwa
Palamu
Chatra
Hazaribag
Kodarma
Giridih
Deoghar
Godda
Sahibganj
Pakaur
Dumka
1991
Ratio of R/U
Ratio of M/F
T
M
F
T
R
U
-
-
-
-
-
-
0.9 0.8 0.9
1.2
1.2 1.3
-
-
-
-
-
-
1.6 1.6 1.5
1.1
1.1 1.0
1.5 1.6 1.5
1.0
1.1 1.0
2001
Ratio of R/U
Ratio of M/F
T
M
F
T
R
U
1.1 1.0 1.2 0.9 0.9
1.0
1.1 1.0 1.5 0.9 0.9
1.4
1.3 1.0 1.8 1.1 1.1
1.8
1.4 1.5 1.4 1.1 1.1
1.0
1.9 2.2 1.7 1.1 1.1
0.9
1.4 1.4 1.4
1.5 1.4 1.6
2.0 1.7 2.7
-
-
-
-
-
-
1.7 1.7 1.7
1.4 1.5 1.2
1.0 1.2 1.0
1.3 1.3 1.4
1.1 1.2 1.0
1.4 1.5 1.4
1.4 1.4 1.3
2.1 2.0 2.3
1.8 2.0 1.5
1.7 1.7 1.8
2.1 2.0 2.0
-
-
-
1.3 1.3 1.1
0.9
0.9 0.9 1.4 1.4 1.4 0.9 0.9
0.9
1.1
0.9 1.0 1.4 1.4 1.3 1.1 1.1
1.0
1.0
1.0 1.6 1.9 1.6 2.2 1.1 1.1
1.5
-
-
- 1.7 1.8 1.6 1.1 1.1
1.0
-
-
- 1.3 1.3 1.3 1.1 1.1
1.0
0.9
0.9 0.9 1.5 1.6 1.5 0.9 0.9
0.9
1.0
1.0 0.9 1.3 1.4 1.1 1.1 1.1
0.9
0.9
0.9 0.8 1.0 1.1 0.9 1.1 1.1
0.9
1.0
0.9 1.0 1.3 1.3 1.4 0.9 0.9
1.0
1.0
1.0 0.9 1.1 1.1 1.0 1.1 1.1
1.0
0.9
0.9 0.8 1.2 1.3 1.1 1.1 1.1
0.9
1.0
1.1 0.9 1.4 1.5 1.3 1.0 1.1
0.9
0.9
0.9 1.0 2.0 2.0 2.0 1.1 1.1
1.1
1.0
1.1 0.8 1.7 1.7 1.6 1.1 1.1
1.0
1.0
0.9 1.0 1.4 1.4 1.4 1.1 1.1
1.1
0.9
0.8 0.8 2.0 2.0 2.0 1.0 1.1
1.1
0.9
- 0.9 0.0 0.0 0.0 1.0
-
0.9
0.8
0.8 0.7 1.2 1.1 1.2 0.9 0.9
1.0
-
-
-
1.1 0.9 1.2
-
-
-
0.7 1.6 1.1
-
-
-
1.2 1.0 1.5
1.2 1.5 1.0
1.9 1.5 2.4
1.6 1.2 2.8
3.8 3.2 4.3
-
-
-
-
-
- 1.8 1.5 2.3 1.0 1.0
1.5
0.8
0.8 1.0 1.4 1.4 1.4 1.0 1.0
0.9
-
-
- 1.9 1.9 2.0 1.0 1.0
1.0
1.0
1.0 0.7 1.5 1.7 1.3 1.2 1.2
0.9
-
-
- 1.3 1.3 1.5 1.2 1.2
1.4
1.0
0.8 1.2 1.5 1.4 1.6 1.0 0.9
1.1
0.8
0.8 0.6 1.2 1.3 2.0 1.0 1.0
1.6
0.9
0.9 1.5 1.7 1.6 2.0 1.0 1.0
1.2
1.0
0.9 2.3 1.4 1.4 1.8 1.0 1.1
1.4
1.0
1.0 1.3 3.3 3.2 3.4 1.1 1.1
1.1
-
-
- 1.3 1.3 1.4 1.1 1.1
1.1
..........................................................................................................................................
78
Infant and Child Mortality in India : District Level Estimates

9.9 Page 89

▲back to top


Dhanbad
Bokaro
Ranchi
Lohardaga
Gumla
Pashchimi Singhbhum
Purbi Singhbhum
ORISSA
Bargarh
Jharsuguda
Sambalpur
Debagarh
Sundargarh
Kendujhar
Mayurbhanj
Baleshwar
Bhadrak
Kendrapara
Jagatsinghapur
Cuttack
Jajapur
Dhenkanal
Anugul
Nayagarh
Khordha
Puri
Ganjam
Gajapati
Kandhamal
Baudh
Sonapur
Balangir
Nuapada
Kalahandi
Rayagada
Nabarangapur
1991
Ratio of R/U
Ratio of M/F
T
M
F
T
R
U
0.9 0.7 1.1
0.8
0.7 1.0
-
-
-
-
-
-
1.6 2.5 1.0
1.4
1.3 0.5
1.4 1.3 1.4
0.8
0.8 0.8
2.4 2.8 2.3
0.9
1.0 0.8
1.4 1.5 1.3
0.9
0.8 0.7
2.0 1.6 2.4
0.9
0.8 1.2
2001
Ratio of R/U
Ratio of M/F
T
M
F
T
R
U
0.9 0.7 1.1 0.8 0.7
1.0
1.5 1.6 1.4 1.0 1.1
1.0
1.5 1.9 1.2 1.2 1.2
0.8
1.8 1.7 1.8 0.7 0.8
0.8
1.8 2.1 1.5 1.1 1.1
0.8
1.7 1.7 1.7 1.1 1.1
1.1
2.1 1.7 2.5 0.9 0.8
1.2
2.0 1.9 2.1
-
-
-
-
-
-
-
-
-
1.7 1.9 1.5
1.3 1.2 1.6
1.0 0.7 1.5
1.5 1.1 1.8
-
-
-
-
-
-
-
-
-
1.5 1.4 1.7
-
-
-
1.1 1.1 1.2
-
-
-
-
-
-
-
-
-
1.6 1.5 1.8
1.6 1.7 1.5
-
-
-
-
-
-
-
-
-
-
-
-
1.4 1.2 1.6
-
-
-
1.8 1.5 2.4
-
-
-
-
-
-
0.8
0.8 0.9 1.1 1.2 1.1 1.3 1.3
1.2
-
-
- 1.2 1.3 1.2 1.1 1.2
1.1
-
-
- 1.8 1.7 1.9 0.8 0.8
0.9
-
-
- 0.9 1.0 0.9 1.1 1.1
1.0
1.0
1.0 0.8 1.5 1.8 1.3 1.1 1.1
0.9
1.0
1.0 1.3 1.3 1.3 1.4 1.1 1.0
1.1
0.9
0.8 1.8 1.1 1.1 1.3 1.0 0.9
1.1
0.6
0.6 0.9 1.3 1.3 1.4 1.1 1.1
1.1
-
-
- 1.0 0.9 1.0 1.1 1.1
1.1
-
-
- 1.1 1.1 1.0 1.1 1.1
1.0
-
-
- 1.2 1.3 1.0 1.1 1.1
0.8
1.0
1.0 1.2 1.2 1.2 1.2 1.1 1.0
1.0
-
-
- 1.2 1.2 1.3 1.1 1.1
1.2
1.0
1.0 1.1 1.2 1.1 1.2 1.0 1.0
1.1
-
-
- 1.4 1.5 1.3 1.1 1.1
1.0
-
-
- 1.2 1.0 1.6 1.0 1.0
1.6
-
-
- 1.2 1.2 1.2 1.0 1.0
1.0
0.9
0.9 1.1 1.4 1.3 1.5 0.9 0.9
1.0
1.1
1.0 0.9 1.4 1.4 1.4 1.0 1.0
1.0
-
-
- 2.2 2.0 2.7 1.1 1.1
1.4
-
-
- 1.7 1.7 1.7 1.1 1.1
1.1
-
-
- 2.6 2.8 2.4 1.1 1.1
1.0
-
-
- 1.2 1.3 1.1 1.2 1.2
0.9
1.0
1.0 1.2 1.4 1.3 1.6 0.9 0.9
1.2
-
-
- 1.3 1.1 1.8 1.2 1.2
2.0
1.1
1.1 1.8 2.1 1.9 2.3 1.1 1.2
1.4
-
-
- 1.8 1.7 1.9 1.1 1.1
1.2
-
-
- 1.4 1.3 1.4 1.2 1.2
1.3
..........................................................................................................................................
Infant and Child Mortality in India : District Level Estimates
79

9.10 Page 90

▲back to top


Koraput
Malkangiri
CHHATTISGARH
Koriya
Surguja
Jashpur
Raigarh
Korba
Janjgir - Champa
Bilaspur
Kawardha
Rajnandgaon
Durg
Raipur
Mahasamund
Dhamtari
Kanker
Bastar
Dantewada
MADHYA PRADESH
Sheopur
Morena
Bhind
Gwalior
Datia
Shivpuri
Guna
Tikamgarh
Chhatarpur
Panna
Sagar
Damoh
Satna
Rewa
Umaria
Shahdol
1991
Ratio of R/U
Ratio of M/F
T
M
F
T
R
U
1.3 1.4 1.2
1.0
1.0 0.9
-
-
-
-
-
-
2001
Ratio of R/U
Ratio of M/F
T
M
F
T
R
U
1.2 1.3 1.2 1.0 1.1
0.9
1.4 1.5 1.4 1.1 1.0
1.0
-
-
-
1.6 1.4 1.8
-
-
-
1.7 1.8 1.6
-
-
-
-
-
-
1.9 1.9 1.8
-
-
-
1.3 1.3 1.3
2.1 2.4 1.7
1.4 1.5 1.3
-
-
-
-
-
-
-
-
-
1.6 1.5 1.6
-
-
-
-
-
- 1.9 2.0 2.0 1.1 1.1
1.1
1.0
1.0 1.2 1.9 1.9 1.9 1.1 1.1
1.1
-
-
- 1.7 1.8 1.6 1.1 1.1
0.9
1.1
1.1 1.0 2.1 2.4 1.9 1.1 1.1
0.9
-
-
- 1.7 1.7 1.8 1.1 1.1
1.2
-
-
- 1.5 1.4 1.5 1.2 1.2
1.2
1.1
1.1 1.1 1.7 1.7 1.6 1.1 1.1
1.0
-
-
- 1.8 1.8 1.9 1.1 1.1
1.2
1.2
1.2 1.1 1.6 1.5 1.6 1.1 1.1
1.2
1.2
1.2 0.9 1.7 1.9 1.5 1.1 1.1
0.9
1.0
1.0 0.9 1.5 1.5 1.4 1.1 1.1
1.1
-
-
- 1.6 1.6 1.6 1.1 1.1
1.1
-
-
- 1.3 1.3 1.2 1.1 1.1
1.0
-
-
- 1.8 2.1 1.6 1.1 1.1
0.8
1.1
1.1 1.2 1.7 1.8 1.7 1.1 1.2
1.1
-
-
- 1.4 1.5 1.3 1.1 1.1
0.9
-
-
-
1.4 1.3 1.5
1.4 1.4 1.3
1.8 1.6 1.6
1.5 1.7 1.5
1.5 1.4 1.6
1.1 1.2 1.1
1.2 1.1 1.3
1.3 1.3 1.3
1.6 1.6 1.7
1.6 1.6 1.7
1.7 1.7 1.7
1.5 1.6 1.4
1.4 1.5 1.3
-
-
-
1.5 1.5 1.5
-
-
- 1.7 1.8 1.7 1.0 1.0
0.9
0.9
0.8 0.9 1.5 1.5 1.5 1.0 0.8
0.9
0.7
0.7 0.7 1.5 1.7 1.4 0.8 0.8
0.7
0.9
0.8 0.8 1.7 1.7 1.8 0.9 0.9
0.9
0.8
0.8 0.7 1.6 1.8 1.5 0.9 0.9
0.7
0.9
0.9 1.0 1.6 1.5 1.8 0.9 0.9
1.0
0.9
0.9 0.8 1.3 1.3 1.3 0.9 0.9
1.0
0.7
0.8 0.9 1.4 1.4 1.3 0.9 0.9
0.9
0.9
0.8 0.9 1.2 1.2 1.2 1.0 1.0
1.0
0.9
0.9 1.0 1.8 1.9 1.8 1.0 1.0
0.9
1.0
1.0 1.0 1.7 1.7 1.8 1.0 1.0
1.1
1.0
1.0 0.9 2.0 2.0 2.0 1.0 1.0
1.0
1.0
1.0 0.9 1.6 1.6 1.5 1.0 1.0
0.9
0.9
0.9 0.8 1.3 1.4 1.2 1.0 1.0
0.8
-
-
- 1.7 1.6 1.9 1.1 1.0
1.3
1.1
1.1 1.0 1.9 1.9 1.9 1.1 1.1
1.1
..........................................................................................................................................
80
Infant and Child Mortality in India : District Level Estimates

10 Pages 91-100

▲back to top


10.1 Page 91

▲back to top


1991
Ratio of R/U
Ratio of M/F
T
M
F
T
R
U
2001
Ratio of R/U
Ratio of M/F
T
M
F
T
R
U
Sidhi
Neemuch
Mandsaur
Ratlam
Ujjain
Shajapur
Dewas
Jhabua
Dhar
Indore
West Nimar
Barwani
East Nimar
Rajgarh
Vidisha
Bhopal
Sehore
Raisen
Betul
Harda
Hoshangabad
Katni
Jabalpur
Narsimhapur
Dindori
Mandla
Chhindwara
Seoni
Balaghat
GUJARAT
Kachchh
Banas Kantha
Patan
Mahesana
Sabar Kantha
Gandhinagar
2.1 2.0 2.2
-
-
-
1.3 1.3 1.3
2.1 2.0 2.2
1.5 1.4 1.6
1.5 1.9 1.3
1.8 1.9 1.7
1.3 1.3 1.3
1.6 1.5 2.0
1.3 1.4 1.3
1.3 1.6 1.1
-
-
-
1.9 1.7 1.9
1.3 1.3 1.4
1.8 1.8 1.7
2.1 2.3 1.9
1.4 1.3 1.4
1.4 1.4 1.4
1.6 1.6 1.5
-
-
-
1.6 1.5 2.0
-
-
-
2.2 2.3 2.1
1.2 1.3 1.1
-
-
-
1.1 1.2 1.1
1.4 1.4 1.4
1.5 1.5 1.5
1.5 1.4 1.7
0.9
1.0 1.1 1.9 1.8 2.0 1.0 1.0
1.1
-
-
- 1.8 1.7 2.0 1.0 1.0
1.2
0.9
1.0 0.9 1.5 1.5 1.4 1.0 1.0
1.0
1.1
1.0 1.2 1.8 1.7 1.9 1.1 1.1
1.2
0.9
0.9 1.0 1.7 1.7 1.6 1.0 1.0
1.0
1.1
1.1 0.8 1.6 1.7 1.4 1.0 1.0
0.8
0.9
1.0 0.9 1.5 1.6 1.4 1.0 1.0
0.9
0.9
0.9 0.9 1.3 1.4 1.2 1.1 1.1
0.9
0.9
0.9 1.3 1.8 1.7 1.8 1.0 1.0
1.0
0.8
0.9 0.8 1.4 1.5 1.3 1.0 0.9
0.8
1.0
0.9 0.7 1.5 1.8 1.2 1.1 1.1
0.7
-
-
- 1.8 1.9 1.7 1.0 1.1
1.0
1.0
1.0 1.1 1.8 1.7 1.9 1.0 1.0
1.1
0.8
0.9 0.9 1.4 1.4 1.4 1.0 1.0
0.9
0.9
0.9 0.9 1.8 1.7 1.9 1.0 1.0
1.1
1.1
1.2 1.0 2.2 2.2 2.2 1.1 1.1
1.1
1.2
1.1 1.1 1.7 1.6 1.7 1.0 1.0
1.1
1.0
1.0 0.9 1.5 1.5 1.5 1.0 1.0
1.0
1.0
1.0 1.0 1.7 1.7 1.7 1.0 1.0
1.0
-
-
- 1.8 1.7 1.9 1.0 0.9
1.0
0.9
0.9 1.1 1.6 1.6 1.6 1.0 1.0
1.0
-
-
- 2.0 2.1 1.9 1.1 1.1
1.0
1.0
1.1 1.1 2.4 2.5 2.2 1.0 1.1
1.0
0.8
0.8 0.7 1.4 1.5 1.1 0.9 0.9
0.7
-
-
- 1.4 1.3 1.7 1.0 1.0
1.3
1.0
1.1 1.0 1.5 1.5 1.6 1.0 1.0
1.1
0.9
0.9 0.9 1.6 1.6 1.6 1.0 0.9
0.9
1.0
1.0 1.0 1.7 1.8 1.7 1.1 1.1
1.0
1.1
1.1 1.2 1.9 1.7 2.2 1.1 1.1
1.4
1.4 1.3 1.4
1.2 1.2 1.2
-
-
-
1.4 1.5 1.4
1.3 1.3 1.3
1.3 1.3 1.4
0.9
0.9 0.9 1.3 1.4 1.5 1.0 1.0
1.1
0.8
0.8 0.8 1.3 1.3 1.2 0.9 1.0
0.9
-
-
- 1.3 1.3 1.3 0.9 0.9
1.0
0.8
0.8 0.8 1.7 1.7 1.6 0.9 1.0
0.9
0.9
0.9 0.9 1.3 1.3 1.2 1.0 1.1
1.0
0.9
0.8 0.9 1.3 1.3 1.4 0.9 0.9
0.9
..........................................................................................................................................
Infant and Child Mortality in India : District Level Estimates
81

10.2 Page 92

▲back to top


Ahmadabad
Surendranagar
Rajkot
Jamnagar
Porbandar
Junagadh
Amreli
Bhavnagar
Anand
Kheda
Panch Mahals
Dohad
Vadodara
Narmada
Bharuch
Surat
The Dangs
Navsari
Valsad
MAHARASHTRA
Nandurbar
Dhule
Jalgaon
Buldana
Akola
Washim
Amravati
Wardha
Nagpur
Bhandara
Gondiya
Gadchiroli
Chandrapur
Yavatmal
Nanded
Hingoli
1991
Ratio of R/U
Ratio of M/F
T
M
F
T
R
U
2.1 2.2 2.1
1.0
1.0 1.0
1.4 1.4 1.4
0.9
0.9 0.9
1.8 1.7 1.9
1.0
0.9 1.0
1.6 1.4 1.9
0.7
0.8 1.0
-
-
-
-
-
-
1.3 1.3 1.3
1.0
0.9 0.9
1.1 1.2 1.0
1.1
1.1 1.0
1.3 1.1 1.3
0.8
0.8 0.9
-
-
-
-
-
-
1.8 1.8 1.8
0.9
1.0 0.9
1.5 1.4 1.6
0.9
0.9 1.0
-
-
-
-
-
-
1.6 1.7 1.5
0.9
0.9 0.9
-
-
-
-
-
-
-
-
-
-
-
-
0.8 0.9 0.7
0.9
1.1 0.8
0.9 0.8 1.0
1.2
1.2 1.4
-
-
-
-
-
-
1.8 1.8 1.6
1.1
1.1 1.0
2001
Ratio of R/U
Ratio of M/F
T
M
F
T
R
U
1.9 1.9 1.9 1.0 1.0
0.9
1.4 1.3 1.4 0.9 0.9
1.0
1.5 1.5 1.5 1.0 1.0
1.0
1.3 1.3 1.4 0.9 0.9
0.9
1.2 1.0 1.5 1.1 1.0
1.4
1.3 1.3 1.3 1.0 0.9
0.9
1.2 1.3 1.1 1.1 1.1
0.9
1.3 1.3 1.1 0.8 1.1
0.9
1.3 1.3 1.3 1.0 1.0
1.1
1.7 1.8 1.6 1.0 1.0
0.9
1.3 1.3 1.2 1.1 1.1
1.1
1.5 1.5 1.5 1.1 1.1
1.1
1.6 1.8 1.6 0.9 1.0
0.9
1.6 1.7 1.6 1.2 1.2
1.1
1.3 1.3 1.2 1.0 1.1
1.0
1.0 1.1 1.0 1.1 1.1
1.0
-
-
- 1.2 1.2
-
1.1 1.2 1.0 1.2 1.3
1.1
1.8 1.8 1.6 1.1 1.2
1.0
-
-
-
1.5 1.6 1.4
1.6 1.6 1.7
1.6 1.7 1.6
0.1 1.7 1.4
-
-
-
1.8 1.9 1.6
1.8 1.7 1.9
1.6 1.4 1.7
1.9 1.9 2.0
-
-
-
1.3 1.3 1.3
1.7 1.6 2.0
1.7 1.7 1.8
1.9 1.9 2.0
-
-
-
-
-
- 1.7 1.6 1.7 1.1 1.1
1.2
1.0
1.1 0.9 1.4 1.5 1.3 1.0 1.0
0.9
1.1
1.0 1.0 1.6 1.6 1.6 1.0 1.0
0.9
1.1
1.1 1.0 1.7 1.8 1.7 1.1 1.1
1.0
1.2
1.2 1.0 1.5 1.4 1.5 1.1 1.1
1.2
-
-
- 1.6 1.5 1.7 1.2 1.2
1.4
1.1
1.1 0.9 1.5 1.7 1.4 1.1 1.1
0.9
1.4
1.3 1.5 1.6 1.5 1.7 1.2 1.2
1.3
1.0
0.9 1.2 1.3 1.3 1.3 1.0 1.1
1.1
1.2
1.1 1.2 1.8 1.7 1.8 1.2 1.2
1.3
-
-
- 2.1 2.2 2.0 1.2 1.2
1.1
1.1
1.1 1.2 1.5 1.5 1.5 1.3 1.3
1.2
1.2
1.1 1.4 1.7 1.8 1.6 1.2 1.2
1.1
1.1
1.1 1.2 1.6 1.6 1.6 1.1 1.1
1.1
1.1
1.1 1.2 1.9 1.9 2.0 1.1 1.1
1.1
-
-
- 1.8 1.9 1.9 1.1 1.0
1.0
..........................................................................................................................................
82
Infant and Child Mortality in India : District Level Estimates

10.3 Page 93

▲back to top


Parbhani
Jalna
Aurangabad
Nashik
Thane
Mumbai (Suburban)
Mumbai
Raigarh
Pune
Ahmadnagar
Bid
Latur
Osmanabad
Solapur
Satara
Ratnagiri
Sindhudurg
Kolhapur
Sangli
ANDHRA PRADESH
Adilabad
Nizamabad
Karimnagar
Medak
Hyderabad
Rangareddy
Mahbubnagar
Nalgonda
Warangal
Khammam
Srikakulam
Vizianagaram
Visakhapatnam
East Godavari
West Godavari
Krishna
1991
Ratio of R/U
Ratio of M/F
T
M
F
T
R
U
1.5 1.5 1.5
1.1
1.1 1.1
1.7 1.6 1.7
1.1
1.1 1.1
1.7 1.4 2.3
1.1
1.0 1.5
1.5 1.5 1.5
1.2
1.1 1.1
2.2 2.1 2.5
1.2
1.1 1.3
-
-
-
-
-
-
-
-
-
1.0
- 1.0
1.5 1.6 1.4
1.3
1.3 1.1
1.5 1.6 1.4
1.3
1.3 1.1
1.5 1.4 1.6
1.2
1.2 1.3
1.7 1.4 2.1
1.3
1.0 1.4
1.8 1.9 1.7
0.9
1.2 1.1
2.1 2.0 2.0
0.9
1.0 1.0
1.4 1.3 1.5
1.2
1.1 1.4
1.2 1.1 1.3
1.0
1.0 1.2
1.8 1.9 1.5
1.1
1.1 0.9
1.1 0.6 1.4
0.9
0.8 1.9
1.5 1.5 1.5
1.2
1.1 1.0
1.6 1.6 1.7
1.2
1.2 1.3
2001
Ratio of R/U
Ratio of M/F
T
M
F
T
R
U
1.6 1.6 1.8 1.1 1.1
1.2
1.6 1.6 1.7 1.0 1.0
1.1
1.7 1.5 2.0 1.0 1.0
1.4
1.4 1.4 1.4 1.0 1.1
1.1
2.3 2.2 2.3 1.2 1.2
1.3
0.0 0.0 0.0
-
-
1.0
0.0 0.0 0.0
-
-
1.0
1.3 1.4 1.3 1.1 1.1
1.1
1.2 1.2 1.2 1.0 1.1
1.1
1.5 1.4 1.6 1.1 1.1
1.3
1.4 1.2 1.7 1.0 1.0
1.3
2.0 2.0 2.0 1.2 1.2
1.2
1.8 1.9 1.6 0.9 1.1
0.9
1.3 1.2 1.5 1.0 1.1
1.3
1.2 1.3 1.1 1.0 1.0
0.9
1.5 1.7 1.3 1.1 1.2
0.9
1.3 1.3 1.2 1.0 1.0
0.9
1.5 1.5 1.5 1.1 1.1
1.1
1.4 1.3 1.5 1.0 1.1
1.2
1.6 2.0 1.2
1.2 1.1 1.2
1.5 1.5 1.4
2.2 2.0 2.3
-
-
-
2.2 2.1 2.4
1.9 2.1 1.7
1.4 1.3 1.5
1.4 1.5 1.5
1.6 1.7 1.3
1.4 1.4 1.3
1.8 1.7 1.8
1.6 1.7 1.6
1.2 1.1 1.4
1.2 1.2 1.2
1.0 1.2 1.1
1.2
1.3 0.8 1.8 1.9 1.7 1.2 1.2
1.2
1.3
1.1 1.3 1.4 1.4 1.4 1.3 1.2
1.1
1.0
1.0 0.9 1.4 1.6 1.2 1.0 1.2
0.9
1.2
1.1 1.3 1.9 1.8 2.0 1.2 1.2
1.3
-
- 1.1 0.0 0.0 0.0 1.0 0.0
1.2
1.0
0.9 1.1 1.8 1.9 1.8 1.1 1.2
1.1
0.9
1.1 0.9 1.7 1.8 1.7 1.1 1.2
1.1
1.1
1.1 1.2 1.7 1.7 1.8 1.1 1.1
1.1
1.2
1.2 1.2 1.7 1.7 1.6 1.2 1.2
1.1
1.1
1.1 0.9 1.6 1.7 1.3 1.1 1.1
0.9
1.2
1.2 1.1 1.5 1.5 1.6 1.2 1.2
1.3
1.1
1.1 1.2 1.6 1.6 1.5 1.2 1.2
1.1
1.1
1.1 1.0 1.7 1.8 1.6 1.1 1.2
1.1
1.1
1.1 1.4 1.3 1.3 1.2 1.2 1.2
1.1
1.1
1.2 1.1 1.4 1.4 1.4 1.2 1.2
1.2
1.2
1.4 1.2 1.1 1.2 1.1 1.2 1.4
1.3
..........................................................................................................................................
Infant and Child Mortality in India : District Level Estimates
83

10.4 Page 94

▲back to top


Guntur
Prakasam
Nellore
Cuddapah
Kurnool
Anantapur
Chittoor
KARNATAKA
Belgaum
Bagalkot
Bijapur
Gulbarga
Bidar
Raichur
Koppal
Gadag
Dharwad
Uttara Kannada
Haveri
Bellary
Chitradurga
Davanagere
Shimoga
Udupi
Chikmagalur
Tumkur
Kolar
Bangalore
Bangalore Rural
Mandya
Hassan
Dakshina Kannada
Kodagu
Mysore
Chamarajanagar
1991
Ratio of R/U
Ratio of M/F
T
M
F
T
R
U
1.4 1.5 1.3
1.1
1.1 1.0
1.4 1.5 1.3
1.1
1.2 1.0
1.3 1.3 1.5
1.1
1.1 1.2
1.6 1.3 1.8
1.0
0.9 1.2
1.5 1.4 1.7
1.0
0.9 1.2
1.9 1.9 1.9
1.0
1.0 1.0
-
-
-
-
-
-
2001
Ratio of R/U
Ratio of M/F
T
M
F
T
R
U
1.5 1.5 1.3 1.1 1.2
1.0
1.3 1.3 1.3 1.2 1.2
1.1
1.4 1.4 1.4 1.2 1.2
1.1
1.7 1.5 1.8 1.0 0.9
1.2
1.3 1.3 1.3 1.2 1.2
1.1
1.6 1.7 1.6 1.1 1.1
1.1
1.5 1.4 1.5 1.1 1.2
1.2
1.4 1.3 1.6
1.3 1.3 1.2
-
-
-
1.3 1.2 1.4
2.2 2.1 2.1
1.2 1.2 1.1
-
-
-
-
-
-
1.4 1.2 1.5
1.6 1.8 1.4
-
-
-
1.6 1.8 1.3
1.9 2.1 1.8
-
-
-
1.7 1.7 1.6
-
-
-
1.1 1.1 1.1
1.5 1.4 1.7
1.6 1.4 1.6
1.2 1.3 1.1
1.1 0.9 1.3
1.9 2.1 1.6
1.2 1.2 1.2
1.3 1.5 1.1
1.2 0.9 1.7
1.3 1.4 1.2
-
-
-
1.1
1.1 1.3 1.5 1.5 1.6 1.1 1.1
1.2
1.0
1.0 1.0 1.4 1.4 1.4 1.1 1.1
1.1
-
-
- 1.3 1.4 1.2 1.0 1.1
0.9
1.1
1.0 1.1 1.3 1.3 1.4 1.1 1.0
1.1
1.1
1.1 1.1 2.0 2.0 2.1 1.1 1.1
1.2
1.1
1.1 1.1 1.3 1.3 1.3 1.1 1.1
1.1
-
-
- 1.3 1.3 1.4 1.1 1.0
1.1
-
-
- 1.3 1.3 1.4 1.2 1.2
1.3
1.1
1.0 1.3 1.5 1.5 1.4 1.1 1.2
1.1
1.1
1.1 0.9 1.3 1.3 1.4 1.1 1.1
1.2
-
-
- 1.5 1.5 1.5 1.1 1.1
1.1
1.0
1.1 0.8 1.6 1.8 1.5 1.1 1.0
0.9
1.0
1.0 0.9 1.9 2.0 1.7 1.0 1.1
0.9
-
-
- 1.2 1.2 1.2 1.1 1.1
1.1
1.3
1.3 1.2 1.3 1.4 1.3 1.2 1.2
1.2
-
-
- 1.2 1.4 1.1 1.0 1.0
0.8
0.8
1.0 0.9 1.1 1.3 1.1 1.0 1.0
0.9
1.0
0.9 1.1 1.4 1.3 1.4 1.1 1.1
1.2
1.1
1.1 1.3 1.6 1.6 1.7 1.2 1.1
1.2
0.9
1.1 0.9 1.2 1.2 1.3 1.1 1.0
1.1
0.8
0.8 1.2 1.1 1.0 1.4 0.9 0.8
1.2
1.1
1.2 0.9 1.9 2.0 1.6 1.1 1.1
0.9
1.4
1.2 1.3 1.3 1.3 1.2 1.1 1.2
1.1
0.9
1.3 1.0 1.1 1.3 1.0 1.2 1.2
1.0
1.2
1.1 2.1 0.9 0.8 1.3 1.3 1.2
1.9
1.3
1.3 1.1 1.4 1.5 1.3 1.2 1.2
1.1
-
-
- 1.8 1.8 1.7 1.1 1.2
1.1
..........................................................................................................................................
84
Infant and Child Mortality in India : District Level Estimates

10.5 Page 95

▲back to top


GOA
North Goa
South Goa
KERALA
Kasaragod
Kannur
Wayanad
Kozhikode
Malappuram
Palakkad
Thrissur
Ernakulam
Idukki
Kottayam
Alappuzha
Pathanamthitta
Kollam
Thiruvananthapuram
TAMIL NADU
Thiruvallur
Chennai
Kancheepuram
Vellore
Dharmapuri
Tiruvannamalai
Viluppuram
Salem
Namakkal
Erode
The Nilgiris
Coimbatore
Dindigul
Karur
Tiruchirappalli
Perambalur
Ariyalur
1991
Ratio of R/U
Ratio of M/F
T
M
F
T
R
U
2001
Ratio of R/U
Ratio of M/F
T
M
F
T
R
U
1.4 1.4 1.5
1.1 1.2 1.0
0.9
0.9 1.1 1.0 0.9 1.2 1.1 1.0
1.3
1.2
1.3 1.1 1.0 1.2 0.8 1.1 1.4
0.9
1.4 1.1 1.7
1.4 1.3 1.5
1.1 1.0 1.2
1.8 1.9 1.7
1.2 1.4 0.9
1.1 1.1 1.1
1.4 1.4 1.5
0.9 1.1 0.8
2.3 2.6 1.9
1.4 1.2 0.9
0.8 0.9 0.7
0.8 1.3 0.6
0.9 1.1 0.7
1.0 1.1 1.1
1.1
0.9 1.4 1.2 1.1 1.1 0.8 0.8
0.9
1.5
1.0 1.2 0.9 0.9 0.9 0.7 0.8
0.8
1.5
1.4 1.7 1.0 1.1 0.9 0.8 0.8
0.7
1.1
1.2 1.0 1.0 1.0 0.9 0.8 0.8
0.8
1.5
1.5 1.0 0.8 0.8 0.8 0.8 0.9
0.9
0.8
0.8 0.8 1.6 1.5 1.6 0.9 0.9
1.0
0.7
0.9 0.9 1.0 1.0 1.1 0.8 0.8
0.9
0.8
0.9 0.6 1.1 1.1 1.0 0.8 0.8
0.8
1.2
1.2 0.9 1.4 1.5 1.3 0.9 0.9
0.8
0.7
0.7 0.5 0.9 0.8 1.0 0.8 0.7
0.9
0.7
0.8 0.7 0.9 0.9 1.0 0.8 0.8
0.8
0.8
0.9 0.4 0.9 1.0 0.9 0.8 0.8
0.7
0.7
0.7 0.5 0.8 0.8 0.9 0.8 0.7
0.8
1.1
1.1 1.1 1.2 1.3 1.1 0.8 0.8
0.7
-
-
-
-
-
-
-
-
-
-
-
-
1.2 0.9 1.3
1.3 1.5 1.2
-
-
-
1.4 1.2 1.4
-
-
-
-
-
-
0.8 0.9 0.8
1.4 1.4 1.5
1.3 1.4 1.2
-
-
-
1.4 1.5 1.3
-
-
-
-
-
-
-
-
- 1.2 1.2 1.2 1.1 1.1
1.1
-
-
- 0.0 0.0 0.0 1.0
-
1.0
-
-
- 0.8 1.1 1.0 1.2 1.2
1.1
-
-
- 1.1 1.1 1.1 1.1 1.1
1.1
1.0
0.9 1.2 1.4 1.3 1.6 0.8 0.8
0.9
1.3
1.3 0.9 1.4 1.4 1.3 1.1 1.1
1.1
-
-
- 1.2 1.2 1.2 1.1 1.1
1.1
0.9
0.8 0.9 1.3 1.2 1.4 0.8 0.8
0.9
-
-
- 1.1 1.1 1.1 0.9 0.9
0.9
-
-
- 1.1 1.1 1.1 1.0 1.1
1.1
1.1
1.3 1.0 0.8 0.9 0.8 1.1 1.3
1.1
1.1
1.1 1.3 1.4 1.4 1.5 1.1 1.1
1.3
0.9
0.9 0.8 1.1 1.1 1.1 1.0 1.0
1.0
-
-
- 1.1 1.1 1.1 1.0 1.1
1.1
1.0
1.1 1.0 1.2 1.2 1.3 1.1 1.0
1.1
-
-
- 1.9 2.0 1.9 1.1 1.1
1.1
-
-
- 1.2 1.3 1.1 1.1 1.1
0.9
..........................................................................................................................................
Infant and Child Mortality in India : District Level Estimates
85

10.6 Page 96

▲back to top


Cuddalore
Nagapattinam
Thiruvarur
Thanjavur
Pudukkottai
Sivaganga
Madurai
Theni
Virudhunagar
Ramanathapuram
Thoothukkudi
Tirunelveli
Kanniyakumari
HIMACHAL PRADESH
Chamba
Kangra
Lahul & Spiti
Kullu
Mandi
Hamirpur
Una
Bilaspur
Solan
Sirmaur
Shimla
Kinnaur
PUNJAB
Gurdaspur
Amritsar
Kapurthala
Jalandhar
Hoshiarpur
Nawanshahr
Rupnagar
Fatehgarh Sahib
Ludhiana
1991
Ratio of R/U
Ratio of M/F
T
M
F
T
R
U
-
-
-
-
-
-
-
-
-
-
-
-
-
-
-
-
-
-
1.2 1.2 1.0
1.1
1.1 1.0
1.0 1.0 1.0
1.2
1.0 1.1
-
-
-
-
-
-
1.3 1.5 1.3
0.9
1.0 0.8
-
-
-
-
-
-
-
-
-
-
-
-
1.6 1.6 1.7
0.9
1.1 1.2
-
-
-
-
-
-
1.1 1.2 1.9
1.1
1.2 1.8
0.9 0.9 0.8
1.2
1.3 1.1
2001
Ratio of R/U
Ratio of M/F
T
M
F
T
R
U
1.3 1.3 1.3 1.1 1.2
1.1
1.0 1.0 1.0 1.1 1.1
1.1
1.1 1.1 1.1 1.0 1.0
1.0
1.1 1.0 1.1 1.0 1.0
1.1
1.0 1.0 1.0 1.1 1.1
1.1
1.1 1.2 1.1 1.0 1.0
0.9
1.4 1.5 1.4 0.9 0.9
0.8
1.2 1.2 1.2 0.9 0.9
0.9
1.1 1.1 1.2 1.1 1.1
1.1
1.4 1.4 1.4 1.0 1.1
1.1
1.1 1.1 1.1 1.1 1.1
1.1
1.1 1.1 1.2 1.2 1.1
1.2
1.0 1.1 1.0 0.9 1.0
0.9
1.9 1.8 2.1
1.2 1.2 1.3
-
-
-
1.8 1.8 1.7
1.4 1.4 1.5
1.7 1.6 1.8
1.4 1.4 1.4
1.1 1.0 1.3
1.6 1.6 1.6
1.8 1.7 2.0
1.6 1.7 1.6
-
-
-
1.1
1.1 1.3 1.5 1.5 1.4 1.1 1.1
1.1
1.1
1.1 1.2 1.1 1.0 1.3 1.1 1.0
1.3
1.7
1.7
-
-
-
- 1.2 1.2
-
1.1
1.1 1.0 1.5 1.4 1.6 1.1 1.2
1.4
1.1
1.1 1.2 1.4 1.7 1.2 1.1 1.1
0.8
1.1
1.1 1.3 1.4 1.3 1.6 1.0 1.0
1.2
1.1
1.2 1.2 1.0 1.3 0.9 1.0 1.1
0.8
1.0
1.0 1.3 1.3 1.5 1.1 1.1 1.2
0.9
1.1
1.2 1.1 1.0 1.1 1.0 1.2 1.2
1.2
1.1
1.1 1.3 1.2 1.4 1.1 1.1 1.1
0.9
1.0
1.2 1.1 1.5 1.4 1.7 1.2 1.1
1.3
1.1
1.1
-
-
-
- 1.2 1.2
-
1.1 1.0 1.1
1.7 1.8 1.5
2.1 2.2 2.1
2.3 2.4 2.2
1.7 2.6 1.2
-
-
-
1.7 1.7 1.8
-
-
-
2.3 2.4 2.3
1.1
1.1 1.2 1.2 1.2 1.2 1.1 1.1
1.0
0.9
1.0 0.8 1.4 1.4 1.4 1.0 0.9
0.9
1.2
1.2 1.1 1.6 1.5 1.7 1.0 1.0
1.2
1.1
1.1 1.0 1.8 1.9 1.7 1.0 1.1
1.0
0.8
0.9 0.4 1.6 2.1 1.4 1.0 1.0
0.6
-
-
- 1.1 1.1 1.2 1.0 0.9
1.0
1.1
1.0 1.1 1.3 1.1 1.3 1.0 0.9
1.1
-
-
- 1.0 1.0 1.1 0.9 0.9
1.0
0.8
0.9 0.9 2.2 2.3 2.1 0.9 1.0
0.9
..........................................................................................................................................
86
Infant and Child Mortality in India : District Level Estimates

10.7 Page 97

▲back to top


1991
2001
Ratio of R/U
Ratio of M/F
Ratio of R/U
Ratio of M/F
T
M
F
T
R
U
T
M
F
T
R
U
Moga
-
-
-
-
-
- 1.1 1.1 1.2 1.0 1.0
1.1
Firozpur
1.4 1.3 1.4
1.2
1.3 1.4 1.3 1.2 1.4 1.0 1.0
1.2
Muktsar
-
-
-
-
-
- 1.3 1.4 1.3 0.9 1.0
0.9
Faridkot
1.1 1.0 1.2
0.9
0.9 1.1 1.4 1.3 1.5 1.0 1.0
1.1
Bathinda
1.4 1.4 1.4
1.0
1.0 0.9 1.4 1.4 1.4 0.9 0.9
0.9
Mansa
-
-
-
-
-
- 1.5 1.5 1.5 0.9 0.9
1.0
Sangrur
1.4 1.4 1.6
1.0
0.9 1.1 1.3 1.3 1.3 1.0 1.0
1.0
Patiala
1.5 1.6 1.5
0.8
0.8 0.8 1.3 1.3 1.2 1.0 1.0
0.9
ARUNACHAL PRADESH
Tawang
-
-
-
1.2
1.2
- 1.6 2.2 1.3 0.9 1.1
0.6
West Kameng
1.6 2.2 1.3
0.9
1.0 0.6 1.5 2.1 1.1 1.2 1.1
0.6
East Kameng
-
-
-
-
1.2
- 1.8 1.6 2.0 1.0 1.0
1.2
Papum Pare
-
-
-
-
-
- 1.8 1.4 2.2 1.1 1.0
1.5
Lower Subansiri
2.3 2.1 2.6
1.2
1.1 1.4 3.6 4.2 3.1 1.2 1.2
0.9
Upper Subansiri
-
-
-
-
1.2
- 2.0 2.0 2.0 1.0 1.1
1.1
West Siang
1.6 1.8 1.3
1.0
1.0 0.8 1.1 1.3 10.3 1.2 1.2
9.5
East Siang
1.7 1.2 2.6
0.8
0.7 1.6 1.3 1.0 1.7 1.1 1.0
1.6
Upper Siang
-
-
-
-
-
-
-
-
- 1.1 1.1
-
Dibang Valley
1.1 0.9 1.3
1.0
0.9 1.4 1.6 1.4 1.9 1.1 1.0
1.5
Lohit
1.6 1.6 1.4
0.9
1.1 1.0 1.5 1.3 2.1 1.3 1.3
2.1
Changlang
-
-
-
-
1.4
- 0.9 1.3 0.6 1.1 1.2
0.6
Tirap
2.5 2.3 2.7
0.9
0.9 1.1 2.2 2.0 2.5 1.1 0.9
1.1
JAMMU AND KASHMIR
Kupwara
-
-
-
-
-
- 1.0 1.0 1.0 1.0 1.0
1.0
Baramula
-
-
-
-
-
- 1.1 1.1 1.1 1.0 1.0
0.9
Srinagar
-
-
-
-
-
- 1.2 1.3 1.1 0.9 1.0
0.9
Badgam
-
-
-
-
-
- 0.9 0.9 1.0 1.1 1.0
1.2
Pulwama
-
-
-
-
-
- 1.2 1.3 1.0 1.1 1.1
0.8
Anantnag
-
-
-
-
-
- 1.5 1.8 1.3 0.9 0.9
0.7
Leh (Ladakh)
-
-
-
-
-
- 1.1 1.1 1.0 0.9 1.0
0.9
Kargil
-
-
-
-
-
- 1.4 1.4 1.3 1.0 1.0
0.9
Doda
-
-
-
-
-
- 1.8 1.8 1.7 1.0 1.0
1.0
Udhampur
-
-
-
-
-
- 1.6 1.7 1.6 1.1 1.1
1.1
Punch
-
-
-
-
-
- 1.3 1.2 1.5 1.1 1.0
1.3
Rajauri
-
-
-
-
-
- 1.5 1.2 2.5 1.0 1.0
2.0
Jammu
-
-
-
-
-
- 1.0 1.0 1.1 1.0 1.0
1.1
Kathua
-
-
-
-
-
- 1.4 1.4 1.6 1.1 1.1
1.2
..........................................................................................................................................
Infant and Child Mortality in India : District Level Estimates
87

10.8 Page 98

▲back to top


1991
Ratio of R/U
Ratio of M/F
T
M
F
T
R
U
PUDUCHERRY
Pondicherry
1.2 1.1 1.3
1.2
1.1 1.3
Karaikal
-
-
-
-
-
-
Mahe
-
-
-
-
-
-
Yanam
-
-
-
-
-
-
DADRA & NAGAR HAVELI
Dadra & Nagar Haveli
1.5 1.5 1.6
1.2
1.2 1.4
LAKHSADWEEP
Lakhsadweep
1.0 1.2 0.7
1.4
1.6 1.0
CHANDIGARH
Chandigarh
1.4 1.4 1.3
1.2
1.2 1.1
ANDAMAN & NICOBAR ISLANDS
Andaman
-
-
-
-
-
-
Nicobar
-
-
-
-
-
-
DAMAN & DIU
Daman
-
-
-
-
-
-
Diu
-
-
-
-
-
-
2001
Ratio of R/U
Ratio of M/F
T
M
F
T
R
U
1.1 0.9 1.1 1.1 1.2 1.5
1 1.0 1.1
1 1.0
1.1
-
-
-
1
-
1
-
-
- 1.0
-
1.0
1.5 1.5 1.6 1.2 1.1
1.3
1.2 1.3 1.1 1.1 1.1
0.9
1.3 1.4 1.3 1.2 1.2
1.1
1.1 1.2 1.1
1 1.1
0.9
-
-
- 1.4 1.4
NA
0.9 0.8 1.1 1.3 1.1
1.7
1.2 1.1 1.5 1.2 1.0
1.5

10.9 Page 99

▲back to top


10.10 Page 100

▲back to top


11 Pages 101-110

▲back to top


11.1 Page 101

▲back to top


Appendix-2 : Differential by Place of Residence & Sex in CMR
HARYANA
Panchkula
Ambala
Yamunanagar
Kurukshetra
Kaithal
Karnal
Panipat
Sonipat
Jind
Fatehabad
Sirsa
Hisar
Bhiwani
Rohtak
Jhajjar
Mahendragarh
Rewari
Gurgaon
Faridabad
UTTARANCHAL
Uttarkashi
Chamoli
Rudraprayag
Tehri
Dehradun
Garhwal
Pithoragarh
Bageshwar
Almora
Champawat
Nainital
Udham Singh Nagar
Hardwar
ASSAM
Kokrajhar
1991
Ratio of R/U
Ratio of M/F
T
M
F
T
R
U
2001
Ratio of R/U
Ratio of M/F
T
M
F
T
R
U
-
-
-
1.5 1.7 1.2
2.0 1.9 1.8
1.8 1.6 2.0
1.6 1.2 1.8
1.7 1.7 2.2
1.6 1.2 2.0
1.4 0.9 1.9
1.1 1.6 1.9
-
-
-
1.0 1.0 1.1
1.6 1.6 1.6
1.1 1.0 1.3
1.4 1.3 1.6
-
-
-
1.8 1.4 1.4
2.1 2.0 2.1
1.6 1.3 2.3
2.2 2.2 2.3
-
-
- 1.2 1.1 1.3 0.9 0.8
0.9
0.9
1.2 0.8 1.3 1.3 1.3 0.8 0.8
0.8
0.9
0.9 0.9 1.4 1.4 1.5 0.9 0.8
0.9
0.9
0.9 1.1 1.7 1.5 1.8 1.0 1.0
1.2
0.7
0.8 1.2 1.0 1.0 1.0 0.9 0.8
0.8
0.9
0.9 1.1 1.5 1.4 1.4 0.9 0.9
0.9
0.8
0.7 1.1 1.3 1.2 1.4 1.0 0.9
1.1
0.7
0.6 1.3 1.7 1.6 1.6 0.9 0.8
0.8
0.8
0.8 0.9 1.6 1.6 1.6 0.8 0.8
0.8
-
-
- 1.7 1.6 1.9 0.9 0.9
1.1
0.8
0.8 0.8 1.5 1.6 1.4 0.9 0.9
0.9
0.9
0.9 1.0 1.8 1.8 1.7 0.9 0.9
0.9
0.9
0.8 1.1 1.4 1.5 1.4 1.0 0.9
0.9
0.9
0.9 1.0 1.6 1.6 1.6 0.9 0.9
0.9
-
-
- 1.4 1.4 1.4 0.9 0.9
0.9
0.7
0.7 0.7 1.5 1.6 1.5 0.9 0.9
0.9
0.9
0.9 1.0 1.5 1.5 1.5 1.0 1.0
1.0
1.0
0.9 1.6 2.0 2.0 2.0 0.9 0.9
0.9
0.8
0.8 0.8 1.6 1.5 1.6 0.9 0.9
0.9
1.4 3.3 1.1
1.4 1.1 2.1
-
-
-
1.4 1.4 1.6
2.4 2.6 2.1
1.6 1.4 1.7
1.0 1.1 1.0
-
-
-
1.2 1.0 1.6
-
-
-
1.3 1.4 1.3
-
-
-
1.8 2.2 1.5
1.0
1.0 0.4 2.2 2.6 1.9 1.0 1.0
0.8
1.4
1.4 2.6 1.2 1.1 1.2 1.0 1.0
1.1
-
-
- 0.9 0.6 1.8 1.0 1.0
2.9
1.2
1.2 1.3 1.3 1.2 1.3 1.0 1.0
1.1
1.5
1.3 1.0 1.4 1.3 1.4 1.0 1.0
1.1
0.8
0.8 0.9 1.5 1.4 1.7 0.9 0.9
1.1
1.2
1.1 0.9 1.4 1.5 1.3 1.1 1.1
0.9
-
-
- 1.4 1.7 1.0 1.2 1.2
0.8
1.0
0.9 1.5 1.2 1.0 1.5 1.0 1.0
1.3
-
-
- 1.4 1.3 1.4 1.0 1.0
1.1
0.8
0.8 0.7 1.5 1.5 1.5 1.0 1.0
1.0
-
-
- 1.2 1.3 1.2 1.0 1.0
0.9
0.9
1.0 0.7 1.7 1.8 1.6 0.9 0.9
0.8
0.5 1.1 0.3
0.8
0.9 0.3 1.7 1.5 1.8 1.0 1.0
1.1
..........................................................................................................................................
Infant and Child Mortality in India : District Level Estimates
91

11.2 Page 102

▲back to top


Dhubri
Goalpara
Bongaigaon
Barpeta
Kamrup
Nalbari
Darrang
Marigaon
Nagaon
Sonitpur
Lakhimpur
Dhemaji
Tinsuki
Dibrugarh
Sibsagar
Jorhat
Golaghat
Karbi Anglong
North Cacher Hills
Cacher
Karimganj
Hailakandi
RAJASTHAN
Ganganagar
Hanumangarh
Bikaner
Churu
Jhunjhunun
Alwar
Bharatpur
Dhaulpur
Karauli
Sawai Madhopur
Dausa
Jaipur
Sikar
Nagaur
1991
Ratio of R/U
Ratio of M/F
T
M
F
T
R
U
1.3 1.4 1.2
1.4 1.5 1.7
0.7 0.8 0.6
1.6 1.8 1.5
2.2 2.9 1.8
1.7 2.0 1.5
1.4 1.5 1.4
1.3 1.2 1.6
1.8 1.6 2.1
1.7 2.0 1.5
1.1 1.4 0.9
1.0 2.0 0.6
1.5 1.6 1.5
1.8 1.5 2.2
2.5 3.0 1.9
1.4 1.2 1.4
1.8 2.1 1.7
1.2 2.0 0.9
2.6 1.9 3.9
1.7 1.9 1.4
2.1 2.2 2.3
2.1 2.0 2.3
1.1
1.1 0.9
1.0
1.0 1.1
1.0
1.1 0.8
1.0
1.1 0.9
0.9
1.1 0.6
1.1
1.1 0.9
1.0
1.0 0.9
1.0
1.0 1.3
1.0
1.0 1.3
1.1
1.1 0.8
1.0
1.0 0.6
1.0
1.5 0.4
1.1
1.1 1.1
1.0
1.1 1.7
1.2
1.2 0.7
1.1
1.1 1.3
1.1
1.1 0.9
1.0
1.0 0.5
1.2
1.1 2.2
1.0
1.0 0.8
1.1
1.1 1.2
1.1
1.1 1.3
2001
Ratio of R/U
Ratio of M/F
T
M
F
T
R
U
1.5 1.5 1.5 1.0 1.0
1.0
1.2 1.1 1.3 1.1 1.1
1.2
1.8 1.7 2.0 1.0 1.0
1.3
1.4 1.5 1.4 1.0 1.0
1.0
1.4 1.8 1.2 1.0 1.0
0.7
1.7 1.6 1.8 1.0 1.0
1.1
1.5 1.4 1.5 1.0 1.0
1.1
1.1 1.0 1.1 1.1 1.1
1.2
1.5 1.5 1.5 1.0 1.0
1.1
1.5 1.5 1.4 1.1 1.0
1.0
1.1 1.1 1.0 1.1 1.1
1.0
1.1 1.0 1.2 1.0 1.0
1.2
1.7 1.6 1.7 1.0 1.0
1.1
1.1 1.2 1.1 0.9 1.0
0.9
2.1 2.4 1.9 0.7 1.0
0.8
1.5 1.4 1.6 1.0 1.0
1.2
1.4 1.4 1.3 1.0 1.0
0.9
1.6 1.6 1.5 1.0 1.0
0.9
2.0 1.5 3.0 1.0 0.9
1.8
1.3 1.5 1.1 1.1 1.1
0.9
1.8 1.8 1.8 1.0 1.0
1.0
1.7 1.5 1.7 1.0 1.0
1.1
1.4 1.2 1.6
-
-
-
2.1 2.2 1.9
1.2 1.2 1.3
0.9 0.6 1.2
1.9 1.8 1.8
1.7 1.8 1.7
-
-
-
-
-
-
2.1 2.3 2.0
-
-
-
2.0 1.9 2.0
1.2 1.0 1.3
1.3 1.3 1.5
0.9
0.9 1.1 1.4 1.3 1.6 0.9 0.9
1.1
-
-
- 1.2 1.2 1.2 0.9 0.9
1.0
1.0
1.0 0.9 1.5 1.5 1.5 0.9 0.9
0.9
0.8
0.8 0.8 1.2 1.3 1.2 1.0 1.0
1.0
0.9
0.9 1.5 1.3 1.3 1.4 1.0 1.0
1.1
0.8
0.8 0.8 1.4 1.4 1.4 0.9 0.9
0.9
0.8
0.8 0.7 1.4 1.3 1.4 0.8 0.8
0.8
0.7
- 0.7 1.3 1.3 1.4 0.7 0.7
0.8
-
-
- 1.4 1.4 1.4 0.8 0.7
0.7
0.7
0.7 0.6 1.9 2.1 1.8 1.0 0.9
0.8
-
-
- 1.3 1.3 1.2 0.9 0.9
0.8
0.9
0.9 0.9 1.8 1.7 2.0 0.9 0.9
1.1
0.9
0.9 1.1 1.2 1.3 1.2 0.9 0.9
0.8
0.9
0.8 0.9 1.2 1.2 1.2 0.9 0.9
0.9
..........................................................................................................................................
92
Infant and Child Mortality in India : District Level Estimates

11.3 Page 103

▲back to top


Jodhpur
Jaisalmer
Barmer
Jalor
Sirohi
Pali
Ajmer
Tonk
Bundi
Bhilwara
Rajsamand
Udaipur
Dungarpur
Banswara
Chittaurgarh
Kota
Baran
Jhalawar
DELHI
North West
North
North East
East
New Delhi
Central
West
South West
South
UTTAR PRADESH
Saharanpur
Muzaffarnagar
Bijnor
Moradabad
Rampur
Jyotiba Phule Nagar
Meerut
Baghpat
Ratio of R/U
1991
Ratio of M/F
T
M
F
T
R
U
1.7 2.0 1.4
2.1 1.7 2.5
1.5 1.2 1.3
2.5 2.5 2.4
1.8 1.2 3.1
1.7 1.6 1.7
2.0 1.8 2.6
1.4 1.3 1.8
1.6 1.9 1.4
2.1 2.1 1.9
-
-
-
-
-
-
2.0 2.4 1.7
2.8 2.7 2.4
1.7 1.4 2.1
2.1 2.2 2.1
-
-
-
2.3 2.0 2.6
0.8
0.9 0.7
0.7
0.6 0.9
1.0
1.1 1.1
1.0
0.8 0.8
0.9
0.9 2.2
0.8
0.8 0.9
0.9
0.9 1.2
0.8
0.9 1.3
0.9
0.9 0.7
1.1
1.0 0.9
-
-
-
-
-
-
1.0
1.0 0.7
1.1
1.1 1.0
1.0
1.0 1.4
0.9
0.8 0.8
-
-
-
1.0
0.8 1.1
2001
Ratio of R/U
Ratio of M/F
T
M
F
T
R
U
1.5 1.5 1.4 0.9 0.9
0.8
1.8 1.8 1.7 0.9 0.9
0.8
1.2 1.3 1.2 0.9 0.9
0.9
2.0 2.1 1.9 0.9 0.9
0.8
1.7 1.5 1.9 1.0 1.0
1.2
1.3 1.3 1.2 1.0 1.0
0.9
1.7 1.7 1.7 1.0 1.0
1.0
1.6 1.6 1.6 1.0 1.0
0.9
1.6 1.5 1.7 0.9 0.9
1.0
1.9 2.1 1.7 1.0 1.0
0.8
1.3 1.3 1.4 1.0 1.0
1.0
2.0 2.0 2.0 1.0 1.0
1.0
2.0 2.3 1.8 1.0 1.0
0.8
2.6 2.4 3.0 1.0 1.0
1.3
1.7 1.6 1.8 1.0 1.0
1.1
1.8 2.0 1.7 0.9 0.9
0.8
1.2 1.2 1.4 0.9 0.9
1.1
1.8 1.6 2.0 1.0 0.9
1.1
-
-
-
-
-
-
-
-
-
-
-
-
-
-
-
-
-
-
-
-
-
-
-
-
-
-
-
-
-
- 1.1 1.1 1.1 1.0 0.9
0.9
-
-
- 1.3 1.3 1.3 1.0 1.0
1.0
-
-
- 1.1 1.1 1.0 1.0 1.1
1.0
-
-
- 1.7 1.7 1.7 0.9 0.9
0.9
-
-
-
-
-
- 1.1
-
1.1
-
-
-
-
-
- 1.0
-
1.0
-
-
- 1.2 1.4 1.1 1.0 1.1
0.9
-
-
- 1.1 1.0 1.1 1.0 0.8
0.9
-
-
- 1.0 0.9 1.0 1.0 0.9
1.0
1.8 1.6 2.3
1.3 1.4 1.2
1.5 1.6 1.3
2.3 1.8 2.4
1.3 1.5 1.1
-
-
-
1.5 1.2 1.8
-
-
-
1.0
0.9 1.3 1.6 1.5 1.7 0.8 0.8
0.9
0.8
0.8 0.7 1.2 1.2 1.2 0.9 0.9
0.9
0.8
1.0 0.8 1.4 1.4 1.4 0.9 0.9
0.9
0.8
0.8 1.0 2.0 1.9 2.1 0.8 0.8
0.9
0.8
0.8 0.6 1.4 1.5 1.4 0.9 0.9
0.8
-
-
- 1.6 1.5 1.7 0.9 0.9
1.0
1.0
0.8 1.1 1.4 1.3 1.6 0.8 0.8
1.1
-
-
- 1.3 1.2 1.4 0.9 0.8
0.9
..........................................................................................................................................
Infant and Child Mortality in India : District Level Estimates
93

11.4 Page 104

▲back to top


Ghaziabad
Gautam Buddha Nagar
Bulandshahr
Aligarh
Hathras
Mathura
Agra
Firozabad
Etah
Mainpuri
Budaun
Bareilly
Pilibhit
Shahjahanpur
Kheri
Sitapur
Hardoi
Unnao
Lucknow
Rae Bareli
Farrukhabad
Kannauj
Etawah
Auraiya
Kanpur Dehat
Kanpur Nagar
Jalaun
Jhansi
Lalitpur
Hamirpur
Mahoba
Banda
Chitrakoot
Fatehpur
Pratapgarh
Kaushambi
Allahabad
Ratio of R/U
1991
Ratio of M/F
T
M
F
T
R
U
1.4 1.2 1.7
-
-
-
1.4 1.3 1.8
1.5 1.4 1.6
-
-
-
1.7 1.4 1.9
2.6 2.5 2.6
1.5 1.4 1.6
1.6 1.5 1.4
1.6 1.5 1.6
1.8 1.7 1.9
1.9 2.0 2.1
1.9 2.2 1.8
1.6 2.4 1.1
2.3 2.7 2.0
1.9 2.1 1.8
2.4 2.7 2.2
2.2 2.3 2.0
3.4 3.1 3.5
1.4 1.5 1.5
1.7 1.7 1.6
-
-
-
2.0 2.0 2.3
-
-
-
1.7 2.4 1.4
2.4 2.1 2.8
1.5 1.7 1.3
1.8 1.8 2.0
3.5 3.6 3.8
2.1 1.9 2.2
-
-
-
3.1 3.2 3.2
-
-
-
1.9 1.7 2.1
1.4 3.0 0.9
-
-
-
1.1 1.3 0.9
0.9
0.9 1.3
-
-
-
0.8
0.8 1.0
0.7
0.7 0.9
-
-
-
0.7
0.7 1.0
0.7
0.7 0.7
0.7
0.7 0.8
0.8
0.8 0.8
0.7
0.6 0.7
0.9
0.9 1.1
0.8
0.8 0.8
0.8
1.0 0.8
0.9
0.9 0.4
0.9
0.8 0.6
0.9
0.8 0.7
0.9
0.9 0.7
0.8
0.8 0.8
0.8
0.8 0.9
0.9
0.9 0.9
0.9
0.9 0.8
-
-
-
0.8
0.8 0.9
-
-
-
0.8
0.8 0.5
1.1
0.9 1.2
0.8
0.8 0.6
0.8
0.8 0.8
0.8
0.8 0.9
0.8
0.7 0.8
-
-
-
0.8
0.7 0.7
-
-
-
1.1
1.1 1.3
0.9
0.9 0.3
-
-
-
0.8
0.8 0.6
2001
Ratio of R/U
Ratio of M/F
T
M
F
T
R
U
1.5 1.4 1.6 0.8 0.8
0.9
1.2 1.1 1.3 0.8 0.7
0.9
1.5 1.3 1.8 0.9 0.8
1.1
1.2 1.2 1.2 0.8 0.8
0.8
1.3 1.2 1.4 0.8 0.8
0.9
1.4 1.4 1.5 0.8 0.8
0.8
2.1 2.1 2.2 0.7 0.8
0.8
1.2 1.2 1.2 0.8 0.8
0.9
1.4 1.3 1.4 0.8 0.8
0.9
1.4 1.3 1.5 0.8 0.8
0.9
1.5 1.4 1.6 0.8 0.8
0.9
1.7 1.7 1.7 0.9 0.8
0.9
2.4 2.6 2.3 1.0 0.9
0.8
1.7 1.6 1.7 0.8 0.8
0.9
2.1 2.5 1.9 0.9 0.9
0.7
1.8 1.8 1.9 0.9 0.9
0.9
1.9 1.8 1.9 0.9 0.8
0.9
1.8 1.9 1.7 0.9 0.9
0.9
2.6 2.8 2.5 0.9 0.9
0.8
1.6 1.6 1.7 1.0 0.9
1.0
1.3 1.3 1.3 0.8 0.8
0.8
1.3 1.3 1.3 0.9 0.8
0.8
1.5 1.4 1.7 0.8 0.8
1.0
1.5 1.5 1.4 0.9 0.9
0.8
1.9 2.3 1.8 0.9 0.9
0.7
2.1 1.9 2.4 1.1 0.9
1.2
1.5 1.4 1.5 0.8 0.8
0.8
1.7 1.8 1.8 0.9 0.9
0.9
2.9 2.9 3.0 0.8 0.8
0.8
1.3 1.3 1.3 0.8 0.8
0.8
1.4 1.5 1.4 0.9 0.9
0.8
2.5 2.7 2.4 0.8 0.8
0.7
1.4 1.3 1.5 0.9 0.9
1.0
1.6 1.4 1.8 0.9 0.9
1.2
1.5 1.5 1.5 0.9 0.9
1.0
1.4 1.3 1.4 0.9 0.9
1.0
1.4 1.4 1.4 0.9 0.9
0.8
..........................................................................................................................................
94
Infant and Child Mortality in India : District Level Estimates

11.5 Page 105

▲back to top


Barabanki
Faizabad
Ambedkar Nagar
Sultanpur
Bahraich
Shrawasti
Balrampur
Gonda
Siddharthnagar
Basti
Sant Kabir Nagar
Maharajganj
Gorakhpur
KushiNagar
Deoria
Azamgarh
Mau
Ballia
Jaunpur
Ghazipur
Chandauli
Varanasi
Sant Ravidas Nagar Bhadohi
Mirzapur
Sonbhadra
BIHAR
Pashchim Champaran
Purba Champaran
Sheohar
Sitamarhi
Madhubani
Supaul
Araria
Kishanganj
Purnia
Katihar
Madhepura
1991
Ratio of R/U
Ratio of M/F
T
M
F
T
R
U
1.8 1.5 2.1
2.1 1.8 2.3
-
-
-
1.8 1.6 1.9
1.2 1.0 1.3
-
-
-
-
-
-
1.0 2.3 0.8
1.6 1.7 1.5
1.6 1.2 2.5
-
-
-
1.4 1.3 1.4
1.8 1.6 2.2
-
-
-
2.2 2.4 2.3
1.7 1.3 2.0
1.2 1.2 1.3
1.4 1.0 2.0
1.8 1.6 1.9
1.0 0.8 1.2
-
-
-
1.6 1.5 1.7
-
-
-
1.5 1.7 1.3
2.5 2.8 2.6
0.8
0.8 1.1
0.9
0.9 1.2
-
-
-
0.8
0.8 0.9
0.9
0.9 1.2
-
-
-
-
-
-
0.7
0.7 0.2
0.8
0.8 0.7
0.9
0.9 2.0
-
-
-
0.8
0.8 0.9
0.8
0.9 1.2
-
-
-
0.8
0.7 0.7
0.7
0.7 1.1
1.0
1.0 1.1
0.8
0.7 1.4
0.9
0.8 1.0
0.9
0.9 1.3
-
-
-
0.8
0.8 0.9
-
-
-
0.7
0.7 0.5
1.1
0.9 0.8
2001
Ratio of R/U
Ratio of M/F
T
M
F
T
R
U
1.8 1.6 2.0 0.9 0.9
1.1
1.9 1.8 1.9 0.9 0.9
1.0
1.5 1.5 1.4 1.0 1.0
0.9
1.7 1.8 1.7 0.9 0.9
0.9
1.9 1.7 2.2 0.9 0.8
1.1
1.3 1.3 1.4 0.8 0.8
0.9
1.4 1.4 1.4 0.8 0.8
0.8
2.0 1.7 2.2 0.9 0.8
1.1
1.2 1.2 1.3 0.9 0.8
0.9
1.6 1.4 1.9 0.9 0.9
1.2
1.3 1.4 1.3 0.9 0.9
0.9
1.3 1.2 1.3 0.9 0.9
1.0
1.5 1.4 1.6 0.9 0.9
1.0
1.4 1.4 1.4 0.9 0.9
0.9
1.7 1.7 1.6 1.0 1.0
0.9
1.3 1.4 1.3 1.0 1.0
0.9
1.1 1.2 1.1 1.0 1.0
1.0
1.3 1.1 1.6 0.8 0.8
1.2
1.5 1.5 1.5 0.9 0.9
0.9
1.3 1.3 1.3 0.9 0.9
0.9
1.4 1.4 1.5 0.9 0.9
0.9
1.5 1.5 1.5 0.9 0.9
0.9
1.5 1.4 1.6 0.8 0.8
0.9
1.6 1.6 1.6 0.9 0.9
0.8
2.4 2.5 2.3 0.9 0.9
0.8
1.1 2.3 1.3
1.0 1.0 1.0
-
-
-
2.1 1.8 2.4
1.0 0.9 1.1
-
-
-
1.4 1.6 1.1
1.9 1.8 2.1
1.6 1.1 1.9
2.1 1.7 2.7
1.0 1.3 0.9
0.8
0.8 0.4 1.3 1.2 1.3 0.9 0.9
1.0
0.6
0.6 0.6 1.3 1.2 1.3 0.8 0.8
0.9
-
-
- 1.2 1.2 1.2 0.8 0.8
0.8
0.6
0.6 0.9 1.4 1.3 1.5 1.0 0.8
0.9
0.7
0.6 0.8 1.4 1.3 1.4 0.8 0.8
0.8
-
-
- 1.0 1.0 1.0 0.9 0.9
1.0
0.8
1.2 0.8 1.3 1.2 1.3 1.0 1.0
1.1
0.9
0.9 1.0 1.1 1.0 1.2 0.9 0.9
1.0
0.7
0.7 1.3 1.5 1.5 1.5 0.9 0.9
0.9
1.0
0.9 1.5 1.8 1.7 1.9 0.9 0.9
1.0
0.6
0.6 0.4 1.0 1.0 1.0 0.9 0.9
0.9
..........................................................................................................................................
Infant and Child Mortality in India : District Level Estimates
95

11.6 Page 106

▲back to top


Saharsa
Darbhanga
Muzaffarpur
Gopalganj
Siwan
Saran
Vaishali
Samastipur
Begusarai
Khagaria
Bhagalpur
Banka
Munger
Lakhisarai
Sheikhpura
Nalanda
Patna
Bhojpur
Buxar
Kaimur (Bhabua)
Rohtas
Jehanabad
Aurangabad
Gaya
Nawada
Jamui
SIKKIM
North
West
South
East
NAGALAND
Mon
Tuensang
Mokokchung
Zunheboto
Wokha
1991
Ratio of R/U
Ratio of M/F
T
M
F
T
R
U
1.5 2.0 1.4
1.7 1.6 1.7
1.3 1.5 1.5
1.8 2.0 1.5
1.5 1.2 1.8
1.0 1.4 0.4
1.3 1.3 1.4
1.3 1.4 1.0
1.4 1.2 2.1
4.1 2.7 4.8
1.4 1.2 1.6
-
-
-
1.4 1.6 1.2
-
-
-
-
-
-
1.2 1.2 1.4
1.5 1.4 1.6
1.2 1.5 1.3
-
-
-
-
-
-
1.0 0.9 1.0
1.4 1.0 1.8
1.2 1.2 1.2
1.4 1.4 1.4
2.0 2.3 1.9
-
-
-
0.6
0.7 0.5
0.6
0.6 0.6
0.7
0.7 0.7
0.8
0.8 0.6
0.7
0.7 0.9
0.7
0.8 0.2
0.7
0.7 0.8
0.7
0.7 0.5
0.6
0.6 1.1
0.7
0.7 1.3
0.8
0.7 1.0
-
-
-
0.6
0.6 0.5
-
-
-
-
-
-
0.7
0.7 0.8
0.7
0.6 0.8
0.7
0.7 0.7
-
-
-
-
-
-
0.7
0.7 0.7
0.8
0.8 1.4
0.8
0.8 0.8
0.7
0.7 0.7
0.7
0.7 0.5
-
-
-
2001
Ratio of R/U
Ratio of M/F
T
M
F
T
R
U
1.3 1.2 1.5 0.8 0.8
1.0
1.3 1.3 1.4 0.8 0.8
0.9
1.9 1.9 1.9 0.9 0.8
0.8
1.5 1.8 1.3 0.9 0.9
0.7
1.4 1.4 1.5 1.0 1.0
1.1
1.2 1.2 1.3 0.9 0.9
0.9
1.5 1.5 1.5 0.8 0.8
0.9
1.5 1.3 1.6 0.8 0.8
1.0
1.6 1.5 1.8 0.8 0.8
0.9
2.6 2.5 2.9 0.8 0.8
1.0
1.3 1.3 1.3 0.8 0.9
0.9
1.4 1.5 1.4 0.9 0.9
0.8
1.3 1.2 1.4 0.8 0.8
0.9
1.2 1.2 1.1 0.9 0.9
0.8
1.3 1.2 1.3 0.8 0.8
0.9
1.3 1.3 1.4 0.8 0.9
1.0
1.7 1.5 1.8 0.8 0.8
0.9
1.6 1.4 1.7 0.8 0.8
1.0
1.2 1.1 1.3 0.8 0.8
0.9
2.5 2.4 2.5 0.9 0.9
0.9
1.5 1.5 1.5 0.9 0.9
0.9
1.2 1.1 1.4 0.8 0.8
1.1
1.3 1.3 1.3 0.9 0.9
0.9
1.7 1.6 1.7 0.9 0.9
0.9
1.4 1.5 1.3 0.8 0.9
0.7
1.4 1.2 1.6 0.8 0.8
1.1
1.3 1.2 1.5
1.1 1.1 1.1
1.1 1.0 1.1
1.4 1.3 1.6
1.1
1.1 1.5 0.9 0.8 0.9 1.1 1.1
1.1
0.7
0.7 0.7 0.8 0.8 0.7 1.0 1.1
0.9
1.1
0.9 1.1 2.3 2.1 2.4 1.0 1.0
1.1
1.0
1.0 1.2 1.3 1.3 1.4 1.0 1.0
1.1
2.2 2.8 1.7
1.0 1.4 0.8
1.7 1.8 1.6
0.8 0.9 1.0
1.1 1.0 1.3
0.8
0.9 0.6 1.3 1.6 1.2 0.7 0.8
0.6
0.7
0.8 0.4 1.3 1.3 1.3 0.8 0.8
0.8
1.1
1.1 1.0 1.7 1.9 1.7 1.3 1.1
1.0
0.8
0.9 1.0 1.3 1.4 1.3 0.8 0.8
0.7
1.0
1.0 1.2 1.5 1.3 1.6 0.7 0.7
0.8
..........................................................................................................................................
96
Infant and Child Mortality in India : District Level Estimates

11.7 Page 107

▲back to top


Dimapur
Kohima
Phek
MANIPUR
Senapati
Tamenglong
Churachandpur
Bishnupur
Thoubal
Imphal West
Imphal East
Ukhrul
Chandel
MIZORAM
Mamit
Kolasib
Aizawl
Champhai
Serchhip
Lunglei
TRIPURA
Lawngtlai
Saiha
West Tripura
South Tripura
Dhalai
North Tripura
MEGHALAYA
West Garo Hills
East Garo Hills
South Garo Hills
West Khasi Hills
Ri Bhoi
East Khasi Hills
Jaintia Hills
WEST BENGAL
Darjiling
Ratio of R/U
1991
Ratio of M/F
T
M
F
T
R
U
-
-
-
1.1 1.3 0.9
1.3 1.8 1.1
-
-
-
1.0
1.1 0.8
0.8
0.9 0.6
2001
Ratio of R/U
Ratio of M/F
T
M
F
T
R
U
1.0 0.9 1.0 1.0 1.0
1.1
1.3 1.6 1.1 0.9 1.0
0.7
1.1 1.4 0.9 0.8 0.8
0.5
-
-
-
1.6 1.7 1.8
1.2 1.1 1.3
0.8 0.9 0.6
0.5 0.5 0.6
-
-
-
-
-
-
-
-
-
-
-
-
0.9
0.9
-
-
-
- 0.8 0.8
-
0.9
0.9 0.9
-
-
- 1.1 1.1
-
0.9
0.9 1.1
-
-
- 1.0 0.9
-
0.9
1.1 0.7 0.9 1.1 0.7 0.9 1.1
0.7
1.1
1.1 1.2 1.1 1.1 1.0 1.0 1.0
0.9
-
-
- 1.0 1.0 1.1 1.1 1.0
1.1
-
-
- 1.0 1.1 0.9 1.0 1.0
0.8
0.9
0.9
-
-
-
- 0.8 0.8
-
-
-
- 0.6 0.6 0.7 1.1 0.9
1.1
-
-
-
-
-
-
2.9 2.8 3.1
-
-
-
-
-
-
2.9 2.9 3.0
-
-
- 2.0 2.3 1.8 1.1 1.1
0.9
-
-
- 1.5 1.6 1.4 1.1 1.0
0.9
1.1
1.1 1.2 1.3 1.3 1.3 1.0 0.9
1.0
-
-
- 1.4 1.4 1.4 1.1 1.0
1.0
-
-
- 1.4 1.5 1.2 1.3 1.3
1.0
1.1
1.1 1.2 1.9 1.9 1.9 0.9 1.0
1.0
-
-
-
-
-
-
1.4 1.5 1.4
1.3 1.2 1.3
-
-
-
0.9 1.1 0.9
-
-
-
1.8 2.0 1.6
1.4 1.5 1.3
-
-
-
1.0 1.0 1.0
-
-
-
1.8 1.7 1.9
1.3 1.3 1.2
-
-
-
1.8 1.1 1.8
-
-
-
-
-
- 0.9 0.9
-
-
-
- 2.0 1.9 1.9 1.1 1.0
1.0
1.1
1.1 1.0 1.1 1.1 1.1 1.0 1.0
1.0
1.0
1.0 1.2 1.3 1.2 1.4 1.0 1.0
1.1
-
-
- 1.4 1.3 1.6 1.1 1.0
1.3
1.2
1.2 1.0 1.2 1.2 1.3 1.0 1.0
1.0
-
-
-
-
-
-
-
-
-
1.0
1.1 0.9 2.2 2.4 2.1 1.0 1.0
0.9
1.0
1.0 0.9 1.9 1.9 1.8 1.0 1.0
1.0
-
-
- 1.2 1.0 1.4 0.9 0.9
1.2
1.0
1.0 1.0 1.6 1.7 1.6 1.0 0.9
0.9
-
-
- 1.2 1.1 1.4 1.1 1.0
1.4
1.0
1.0 1.2 1.4 1.4 1.3 1.1 1.1
1.1
1.1
1.1 1.0 2.3 2.7 2.0 1.1 1.1
0.8
-
-
-
-
-
-
-
-
-
0.9
0.5 0.9 1.6 1.6 1.5 1.0 1.0
0.9
..........................................................................................................................................
Infant and Child Mortality in India : District Level Estimates
97

11.8 Page 108

▲back to top


Jalpaiguri
Koch Bihar
Uttar Dinajpur
Dakshin Dinajpur
Maldah
Murshidabad
Birbhum
Barddhaman
Nadia
North Twenty Four Parganas
Hugli
Bankura
Puruliya
Medinipur
Haora
Kolkata
South Twenty Four Parganas
JHARKHAND
Garhwa
Palamu
Chatra
Hazaribag
Kodarma
Giridih
Deoghar
Godda
Sahibganj
Pakaur
Dumka
Dhanbad
Bokaro
Ranchi
Lohardaga
Gumla
Pashchimi Singhbhum
Purbi Singhbhum
Ratio of R/U
1991
Ratio of M/F
T
M
F
T
R
U
1.8 1.8 1.8
2.4 2.0 2.5
-
-
-
-
-
-
2.0 2.0 2.0
1.3 1.4 1.2
0.9 1.1 1.0
1.4 1.3 1.4
1.3 1.3 1.3
1.5 1.7 1.4
1.4 1.5 1.4
2.3 2.3 1.9
1.5 1.4 1.8
1.7 1.8 2.2
2.2 2.0 2.1
-
-
-
-
-
-
1.0
1.0 0.9
1.0
1.0 1.3
-
-
-
-
-
-
0.9
0.9 0.8
0.9
0.9 0.8
0.9
0.9 0.8
1.0
0.9 1.0
0.8
0.8 0.8
0.9
0.9 0.8
1.0
1.0 1.0
0.8
0.8 0.7
1.0
1.0 1.3
0.9
0.9 1.1
0.8
0.8 0.8
0.9
- 0.9
-
-
-
2001
Ratio of R/U
Ratio of M/F
T
M
F
T
R
U
1.3 1.3 1.3 1.0 1.0
1.0
1.7 1.6 1.9 1.0 1.0
1.2
1.8 1.8 1.7 1.0 1.0
1.0
1.4 1.4 1.4 1.0 1.0
1.0
1.2 1.4 1.1 1.0 1.0
0.8
1.3 1.5 1.2 1.0 1.0
0.8
1.2 1.2 1.2 1.0 1.0
1.0
1.4 1.5 1.4 1.0 1.0
1.0
1.1 1.1 1.1 1.0 1.0
1.1
1.1 1.2 1.0 1.0 1.1
0.9
1.3 1.3 1.4 1.0 0.9
0.9
1.8 2.0 1.6 1.0 1.0
0.8
1.4 1.3 1.4 1.0 1.0
1.0
1.4 1.3 1.5 1.0 1.0
1.2
1.9 2.0 1.9 1.0 1.0
0.9
-
-
- 1.0
-
1.0
1.1 1.1 1.1 1.0 1.0
1.0
-
-
-
1.0 0.9 1.1
-
-
-
1.5 1.8 1.4
-
-
-
1.3 1.0 1.6
1.3 1.6 1.0
2.3 1.6 3.4
1.5 1.2 1.8
2.6 2.6 2.4
-
-
-
1.1 1.0 1.3
-
-
-
2.3 2.5 2.7
1.5 1.4 1.6
2.9 3.3 2.8
1.7 1.8 1.6
1.7 1.6 1.8
-
-
- 1.8 1.6 2.1 0.9 0.9
1.2
0.8
0.8 1.0 1.9 1.9 1.9 0.9 0.9
0.9
-
-
- 2.0 1.9 2.1 0.9 0.9
1.0
0.9
0.8 0.6 1.8 1.8 1.9 1.1 1.0
1.1
-
-
- 1.3 1.3 1.4 1.1 1.0
1.1
1.0
0.8 1.1 1.4 1.3 1.4 1.0 1.0
1.0
0.7
0.8 0.5 1.8 1.8 1.8 0.9 0.9
0.9
0.7
0.7 1.5 1.7 1.5 2.0 0.9 0.9
1.2
0.9
0.9 1.4 1.4 1.4 1.4 0.9 0.9
1.0
0.9
1.0 0.9 1.3 1.3 1.4 1.0 1.0
1.1
-
-
- 1.7 1.8 1.8 1.0 0.9
1.0
0.8
0.8 1.0 1.1 1.1 1.2 0.9 0.8
1.0
-
-
- 1.5 1.6 1.5 0.9 0.9
0.9
1.2
0.9 0.9 1.8 1.8 1.7 1.0 1.0
1.0
0.8
0.7 0.8 2.3 2.6 2.0 1.0 1.0
0.8
0.9
1.0 0.8 1.7 1.9 1.5 1.0 1.1
0.8
0.6
0.8 0.7 1.7 1.7 1.7 1.0 1.0
1.0
0.9
0.9 1.1 1.3 1.3 1.4 1.1 1.1
1.2
..........................................................................................................................................
98
Infant and Child Mortality in India : District Level Estimates

11.9 Page 109

▲back to top


ORISSA
Bargarh
Jharsuguda
Sambalpur
Debagarh
Sundargarh
Kendujhar
Mayurbhanj
Baleshwar
Bhadrak
Kendrapara
Jagatsinghapur
Cuttack
Jajpur
Dhenkanal
Anugul
Nayagarh
Khordha
Puri
Ganjam
Gajapati
Kandhamal
Baudh
Sonapur
Balangir
Nuapada
Kalahandi
Rayagada
Nabarangapur
Koraput
Malkangiri
CHHATTISGARH
Koriya
Surguja
Jashpur
Raigarh
Korba
1991
Ratio of R/U
Ratio of M/F
T
M
F
T
R
U
2001
Ratio of R/U
Ratio of M/F
T
M
F
T
R
U
-
-
-
-
-
-
2.5 2.3 2.2
-
-
-
1.9 2.3 1.6
1.3 1.2 1.8
0.9 0.7 1.7
1.6 1.2 2.1
-
-
-
-
-
-
-
-
-
1.7 1.5 1.9
-
-
-
1.0 1.3 1.3
-
-
-
-
-
-
-
-
-
1.8 1.6 2.0
1.9 2.0 1.7
-
-
-
-
-
-
-
-
-
-
-
-
1.5 1.3 1.5
-
-
-
1.8 1.7 1.9
-
-
-
-
-
-
1.4 1.5 1.3
-
-
-
-
-
- 1.2 1.2 1.2 1.1 1.1
1.2
-
-
- 1.2 1.3 1.2 1.1 1.1
1.0
0.7
0.7 0.7 1.4 1.5 1.2 1.2 1.2
0.9
-
-
- 1.0 1.0 0.9 1.0 1.0
0.9
0.9
1.0 0.7 1.6 1.6 1.5 1.1 1.1
1.0
1.0
0.9 1.4 1.3 1.4 1.3 1.1 1.1
1.0
0.9
0.8 2.0 1.4 1.3 1.4 1.1 1.1
1.2
0.5
0.5 0.9 1.4 1.3 1.4 1.0 1.0
1.0
-
-
- 1.1 1.1 1.1 1.0 1.0
1.1
-
-
- 1.1 1.1 1.0 1.0 1.0
0.9
-
-
- 1.3 1.4 1.2 1.0 1.0
0.8
1.2
1.1 1.4 1.4 1.3 1.4 1.0 1.0
1.0
-
-
- 1.3 1.3 1.4 1.0 1.0
1.1
0.9
1.2 1.1 1.3 1.2 1.4 1.0 1.0
1.1
-
-
- 1.4 1.5 1.4 1.0 1.0
1.0
-
-
- 1.3 1.1 1.5 1.0 1.0
1.4
-
-
- 1.3 1.3 1.3 1.0 1.0
1.0
0.9
0.9 1.2 1.3 1.4 1.3 1.0 1.0
1.0
1.1
1.0 0.9 1.5 1.5 1.5 1.1 1.0
1.0
-
-
- 2.2 2.0 2.4 1.1 1.0
1.2
-
-
- 1.7 1.7 1.7 1.1 1.1
1.1
-
-
- 2.2 2.3 2.0 1.1 1.1
1.0
-
-
- 1.2 1.2 1.1 1.1 1.1
0.9
0.9
0.9 1.0 1.3 1.3 1.3 1.2 1.2
1.1
-
-
- 1.4 1.2 1.6 1.1 1.1
1.5
1.1
1.1 1.3 1.7 1.7 1.6 1.1 1.2
1.1
-
-
- 1.8 1.7 1.9 1.0 1.0
1.1
-
-
- 1.4 1.4 1.5 1.1 1.1
1.2
1.0
1.0 0.9 1.6 1.5 1.6 1.0 1.0
1.1
-
-
- 1.4 1.5 1.4 1.0 1.0
0.9
-
-
-
1.9 1.8 2.1
-
-
-
2.0 2.0 1.9
-
-
-
-
-
- 2.0 2.0 1.9 1.0 1.1
1.0
1.1
1.0 1.2 2.5 2.5 2.5 1.1 1.1
1.0
-
-
- 1.7 1.8 1.5 1.0 1.0
0.9
1.1
1.1 1.0 2.0 2.1 1.9 1.0 1.1
0.9
-
-
- 1.7 1.7 1.7 1.0 1.0
1.1
..........................................................................................................................................
Infant and Child Mortality in India : District Level Estimates
99

11.10 Page 110

▲back to top


Janjgir - Champa
Bilaspur
Kawardha
Rajnandgaon
Durg
Raipur
Mahasamund
Dhamtari
Kanker
Bastar
Dantewada
MADHYA PRADESH
Sheopur
Morena
Bhind
Gwalior
Datia
Shivpuri
Guna
Tikamgarh
Chhatarpur
Panna
Sagar
Damoh
Satna
Rewa
Umaria
Shahdol
Sidhi
Neemuch
Mandsaur
Ratlam
Ujjain
Shajapur
Dewas
Jhabua
Dhar
1991
Ratio of R/U
Ratio of M/F
T
M
F
T
R
U
-
-
-
2.0 2.0 2.0
-
-
-
0.9 1.5 1.5
1.9 2.1 1.7
1.5 1.6 1.4
-
-
-
-
-
-
-
-
-
1.8 1.7 1.9
-
-
-
-
-
-
1.1
1.1 1.1
-
-
-
1.1
1.1 1.1
1.0
1.1 0.9
0.9
1.0 0.9
-
-
-
-
-
-
-
-
-
1.1
1.1 1.2
-
-
-
2001
Ratio of R/U
Ratio of M/F
T
M
F
T
R
U
1.7 1.7 1.8 1.1 1.0
1.1
1.8 1.8 1.7 1.0 1.1
1.0
1.9 1.8 1.9 1.1 1.1
1.1
1.4 1.4 1.4 1.1 1.1
1.1
1.7 1.8 1.7 1.1 1.1
1.1
1.4 1.4 1.4 1.1 1.1
1.1
1.5 1.6 1.6 1.1 1.1
1.1
1.4 1.5 1.3 1.1 1.1
1.0
1.9 2.1 1.7 1.1 1.1
0.9
2.0 2.1 1.9 1.1 1.1
1.0
1.5 1.5 1.5 1.0 1.0
1.0
-
-
-
1.5 1.3 1.4
1.4 1.5 1.3
2.4 2.1 2.2
2.0 2.1 1.9
1.7 1.5 1.8
1.2 1.3 1.2
1.2 1.2 1.4
1.4 1.4 1.4
1.9 1.8 2.0
1.9 1.8 2.1
2.0 1.8 2.0
1.8 1.9 1.7
1.4 1.5 1.4
-
-
-
1.7 1.7 1.7
2.6 2.6 1.9
-
-
-
1.4 1.4 1.4
2.6 2.5 2.7
1.6 1.4 1.8
1.8 1.8 1.8
2.2 2.1 2.1
1.4 1.4 1.4
1.8 1.7 1.7
-
-
- 1.6 1.7 1.6 0.9 0.9
0.9
0.7
0.7 0.7 1.3 1.4 1.3 0.9 0.9
0.8
0.6
0.7 0.6 1.5 1.7 1.4 0.9 0.9
0.7
0.7
0.8 0.8 1.8 1.8 1.7 0.8 0.9
0.8
0.7
0.7 0.6 1.6 1.6 1.5 1.0 0.8
0.8
0.8
0.8 0.9 1.6 1.6 1.7 0.9 0.9
1.0
0.8
0.8 0.7 1.3 1.3 1.3 0.9 0.9
0.9
0.8
0.7 0.8 1.4 1.4 1.4 0.9 0.9
0.9
0.8
0.7 0.8 1.3 1.3 1.3 0.9 0.9
0.9
0.8
0.8 0.9 1.8 1.8 1.8 1.0 0.9
0.9
0.9
0.9 1.0 1.7 1.7 1.7 0.9 0.9
1.0
0.9
0.8 0.9 2.0 2.1 1.9 1.0 1.0
1.0
0.9
0.9 0.8 1.6 1.6 1.6 1.0 1.0
0.9
0.9
0.8 0.8 1.3 1.4 1.3 1.0 0.9
0.9
-
-
- 1.7 1.6 1.8 1.0 1.0
1.1
1.1
1.1 1.0 1.9 2.0 1.8 1.1 1.1
1.0
0.8
1.0 0.8 1.7 1.7 1.6 1.0 1.0
0.9
-
-
- 1.4 1.3 1.6 1.0 1.0
1.2
0.9
0.9 0.9 1.5 1.5 1.6 1.0 1.0
1.0
1.1
1.0 1.1 1.7 1.7 1.7 1.0 1.0
1.1
0.8
0.7 0.9 1.7 1.7 1.6 1.0 1.0
1.0
0.9
0.8 0.8 1.5 1.6 1.5 1.0 1.0
0.9
0.8
0.9 0.8 1.5 1.5 1.5 0.9 0.9
0.9
0.8
0.8 0.8 1.3 1.4 1.3 1.0 1.0
1.0
0.9
0.9 0.9 1.8 1.8 1.8 1.0 1.0
1.0
..........................................................................................................................................
100
Infant and Child Mortality in India : District Level Estimates

12 Pages 111-120

▲back to top


12.1 Page 111

▲back to top


Indore
West Nimar
Barwani
East Nimar
Rajgarh
Vidisha
Bhopal
Sehore
Raisen
Betul
Harda
Hoshangabad
Katni
Jabalpur
Narsimhapur
Dindori
Mandla
Chhindwara
Seoni
Balaghat
GUJARAT
Kachchh
Banas Kantha
Patan
Mahesana
Sabar Kantha
GandhiNagar
Ahmadabad
SurendraNagar
Rajkot
Jam Nagar
Porbandar
Junagadh
Amreli
Bhavnagar
Anand
Kheda
Ratio of R/U
1991
Ratio of M/F
T
M
F
T
R
U
1.4 1.4 1.4
1.6 1.4 1.8
-
-
-
1.9 1.8 2.0
1.4 1.4 1.4
2.0 2.0 1.9
2.4 2.7 2.2
1.5 1.5 1.5
1.6 1.7 1.5
1.8 1.8 1.8
-
-
-
1.9 1.8 2.0
-
-
-
2.7 2.9 2.6
1.4 1.3 1.1
-
-
-
1.2 1.3 1.2
1.6 1.6 1.6
1.7 1.8 1.7
1.8 1.6 2.0
0.8
0.8 0.7
0.9
0.8 1.1
-
-
-
1.0
0.9 1.0
0.9
0.9 0.8
0.9
0.9 0.9
1.0
1.2 1.0
1.1
1.1 1.1
0.9
0.9 0.8
1.0
1.0 0.9
-
-
-
0.8
0.8 0.9
-
-
-
1.0
1.2 1.1
0.8
0.8 0.6
-
-
-
1.0
1.0 1.0
0.8
0.8 0.8
0.9
1.0 0.9
1.0
1.0 1.2
2001
Ratio of R/U
Ratio of M/F
T
M
F
T
R
U
1.3 1.4 1.2 1.0 1.0
0.8
1.5 1.6 1.3 1.0 1.0
0.8
1.7 1.8 1.7 1.0 1.0
1.0
1.9 1.8 1.9 1.0 0.9
1.0
1.4 1.3 1.5 1.0 0.9
1.1
1.8 1.7 1.8 1.0 0.9
1.0
2.2 2.1 2.3 1.0 0.9
1.0
1.6 1.6 1.7 1.0 0.9
1.0
1.6 1.5 1.7 1.0 0.9
1.0
1.7 1.7 1.7 1.0 1.0
1.0
1.8 1.7 1.9 0.9 0.9
1.0
1.7 1.7 1.6 0.9 1.0
0.9
2.1 2.1 2.1 1.0 1.0
1.0
2.6 2.6 2.5 1.0 1.0
1.0
1.4 1.4 1.4 1.0 0.9
1.0
1.4 1.3 1.6 1.0 1.0
1.2
2.1 2.1 2.0 1.0 1.0
1.0
1.6 1.7 1.6 1.0 1.0
0.9
1.8 1.7 1.7 1.0 1.0
1.0
1.9 1.8 2.1 1.0 1.0
1.3
1.5 1.6 1.5
1.3 1.3 1.3
-
-
-
1.6 1.6 1.7
1.4 1.3 1.4
1.4 1.3 1.5
2.5 2.5 2.3
1.7 1.6 1.7
2.1 1.8 2.3
1.8 1.5 2.0
-
-
-
1.5 1.4 1.5
1.4 1.5 1.4
1.5 1.5 1.3
-
-
-
2.1 2.1 2.1
0.9
0.9 0.9 1.3 1.4 1.3 1.0 1.0
0.9
0.8
0.7 0.7 1.3 1.3 1.3 0.9 0.9
0.9
-
-
- 1.3 1.3 1.3 0.9 0.9
0.9
0.7
0.7 0.7 1.3 1.3 1.3 0.9 0.9
0.9
0.8
0.8 0.8 1.3 1.3 1.2 1.0 1.0
1.0
0.9
0.8 0.9 1.4 1.4 1.5 0.9 0.9
0.9
1.0
1.0 0.9 1.9 1.8 1.9 1.0 0.9
0.9
0.8
0.8 0.9 1.3 1.3 1.4 0.9 0.9
0.9
0.9
0.8 1.0 1.5 1.5 1.5 1.0 1.0
0.9
0.8
0.7 0.9 1.3 1.3 1.3 1.0 0.9
0.9
-
-
- 1.2 1.0 1.4 1.0 0.9
1.2
0.9
0.9 0.9 1.3 1.3 1.3 1.0 1.0
1.0
0.9
1.0 0.9 1.2 1.2 1.2 1.0 1.0
1.0
0.7
0.8 0.7 1.2 1.3 1.1 1.0 1.0
0.9
-
-
- 1.3 1.3 1.3 0.9 1.0
1.0
0.8
0.9 0.9 1.5 1.5 1.5 0.9 0.9
0.9
..........................................................................................................................................
Infant and Child Mortality in India : District Level Estimates
101

12.2 Page 112

▲back to top


Panch Mahals
Dohad
Vadodara
Narmada
Bharuch
Surat
The Dangs
Navsari
Valsad
MAHARASHTRA
Nandurbar
Dhule
Jalgaon
Buldana
Akola
Washim
Amravati
Wardha
Nagpur
Bhandara
Gondiya
Gadchiroli
Chandrapur
Yavatmal
Nanded
Hingoli
Parbhani
Jalna
Aurangabad
Nashik
Thane
Mumbai (Suburban)
Mumbai
Raigarh
Pune
Ahmadnagar
Bid
Ratio of R/U
1991
Ratio of M/F
T
M
F
T
R
U
1.7 1.5 1.8
-
-
-
1.9 1.9 1.7
-
-
-
-
-
-
0.8 0.9 0.7
0.9 0.8 1.0
-
-
-
1.7 1.7 1.6
0.9
0.8 1.0
-
-
-
0.8
0.9 0.8
-
-
-
-
-
-
0.8
1.0 0.7
1.3
1.2 1.5
-
-
-
1.1
1.1 1.0
2001
Ratio of R/U
Ratio of M/F
T
M
F
T
R
U
1.2 1.2 1.1 1.0 1.0
1.0
1.5 1.5 1.4 1.0 1.0
1.0
1.6 1.6 1.6 1.0 1.0
1.0
1.5 1.5 1.5 1.1 1.1
1.1
1.4 1.4 1.3 1.0 1.0
0.9
1.2 1.3 1.1 1.0 1.0
0.9
-
-
- 1.1 1.1
-
1.1 1.2 1.0 1.2 1.3
1.1
1.7 1.7 1.7 1.1 1.1
1.1
-
-
-
1.7 1.8 1.6
1.8 1.8 1.9
1.8 1.9 1.7
1.9 2.0 1.8
-
-
-
2.1 2.0 2.2
1.8 1.8 1.5
2.0 1.9 2.4
1.8 1.9 1.7
-
-
-
1.4 1.4 1.4
1.8 1.7 2.1
1.9 1.9 2.0
2.5 2.4 2.8
-
-
-
1.6 1.6 1.7
1.7 1.4 2.0
1.8 1.5 2.5
1.4 1.4 1.4
2.4 2.2 2.6
-
-
-
-
-
-
1.7 1.8 1.5
1.7 1.6 1.5
1.7 1.5 1.6
1.6 1.5 1.8
-
-
- 1.7 1.7 1.7 1.1 1.1
1.1
1.0
1.0 0.9 1.4 1.4 1.4 0.9 0.9
1.0
1.1
1.0 1.0 1.6 1.6 1.6 0.9 0.9
0.9
1.1
1.1 1.0 1.6 1.6 1.6 1.0 1.0
1.0
1.0
1.0 0.9 1.4 1.4 1.3 1.1 1.1
1.1
-
-
- 1.7 1.6 1.8 1.1 1.1
1.2
1.1
1.1 1.2 1.5 1.5 1.6 1.0 1.0
1.1
1.0
1.4 1.1 1.5 1.4 1.6 1.1 1.0
1.1
1.4
1.0 1.2 1.4 1.4 1.4 1.1 1.1
1.0
1.0
1.1 1.0 1.8 1.8 1.8 1.1 1.1
1.1
-
-
- 2.1 2.3 2.0 1.1 1.1
1.0
1.2
1.2 1.1 1.6 1.6 1.5 1.2 1.2
1.1
1.0
1.0 1.2 1.8 1.8 1.7 1.1 1.1
1.1
1.1
1.1 1.1 1.7 1.7 1.7 1.1 1.1
1.0
1.0
1.0 1.2 2.1 2.0 2.2 1.0 1.0
1.1
-
-
- 1.9 1.9 1.9 1.0 1.0
1.0
1.6
1.0 1.1 1.8 1.7 1.8 1.0 1.0
1.1
1.1
1.0 1.4 1.6 1.6 1.8 1.0 1.0
1.1
1.0
0.9 1.6 1.8 1.5 2.1 1.0 0.9
1.3
1.2
1.0 1.0 1.3 1.4 1.3 1.0 1.0
1.0
1.1
1.1 1.3 2.0 2.0 2.2 1.1 1.1
1.3
-
-
-
-
-
- 1.0
-
1.0
1.1
- 1.1
-
-
- 1.0
-
1.0
1.3
1.4 1.1 1.4 1.4 1.3 1.1 1.1
1.1
1.0
1.1 1.1 1.3 1.3 1.3 1.1 1.0
1.0
1.0
1.2 1.3 1.6 1.5 1.9 1.0 1.0
1.3
0.9
0.9 1.1 1.5 1.3 1.7 0.9 0.9
1.2
..........................................................................................................................................
102
Infant and Child Mortality in India : District Level Estimates

12.3 Page 113

▲back to top


Latur
Osmanabad
Solapur
Satara
Ratnagiri
Sindhudurg
Kolhapur
Sangli
ANDHRA PRADESH
Adilabad
Nizamabad
Karimnagar
Medak
Hyderabad
Rangareddy
Mahbubnagar
Nalgonda
Warangal
Khammam
Srikakulam
Vizianagaram
Visakhapatnam
East Godavari
West Godavari
Krishna
Guntur
Prakasam
Nellore
Cuddapah
Kurnool
Anantapur
Chittoor
KARNATAKA
Belgaum
Bagalkot
Bijapur
Gulbarga
Ratio of R/U
1991
Ratio of M/F
T
M
F
T
R
U
2.0 1.7 2.2
1.3 1.1 1.6
1.4 1.3 1.6
1.3 1.2 1.4
1.7 1.8 1.5
1.1 0.9 1.4
1.5 1.6 1.5
1.6 1.6 1.7
0.8
0.9 1.1
1.0
0.9 1.3
1.0
0.9 1.1
1.0
1.0 1.2
1.1
1.1 0.9
0.9
0.8 1.3
1.2
1.1 1.0
1.1
1.1 1.2
2001
Ratio of R/U
Ratio of M/F
T
M
F
T
R
U
1.6 1.5 1.8 0.9 1.0
1.1
1.4 1.5 1.3 1.0 1.0
0.9
1.2 1.2 1.2 1.0 1.0
1.0
1.3 1.3 1.2 1.0 1.0
0.9
1.4 1.5 1.2 1.1 1.1
0.9
1.3 1.3 1.2 1.0 1.0
0.9
1.5 1.5 1.5 1.0 1.0
1.1
1.3 1.2 1.4 1.0 1.0
1.2
1.7 1.9 1.5
1.6 1.5 1.8
1.6 1.8 1.4
2.5 2.4 2.5
-
-
-
2.7 2.6 2.7
2.1 2.0 2.2
1.8 1.7 1.9
1.9 1.9 2.0
1.7 1.5 1.7
1.3 1.2 1.4
1.6 1.6 1.5
1.8 1.7 1.9
1.3 1.2 1.4
1.3 1.3 1.3
1.5 1.4 1.6
1.5 1.5 1.4
1.6 1.4 1.8
1.8 1.5 2.0
1.2 1.2 1.2
1.6 1.6 1.6
1.7 1.7 1.7
1.2 1.3 0.8
1.1
1.1 0.9 1.8 1.8 1.8 1.1 1.2
1.1
1.0
1.0 1.2 1.5 1.5 1.5 1.1 1.1
1.1
1.0
1.1 0.9 1.3 1.3 1.3 1.1 1.1
1.1
1.0
1.0 1.0 1.8 1.8 1.8 1.1 1.1
1.1
1.1
- 1.1
-
-
- 1.1
-
1.1
1.0
1.0 1.0 1.9 1.9 1.9 1.1 1.1
1.1
1.0
1.0 1.1 1.8 1.9 1.8 1.1 1.1
1.0
1.1
1.1 1.2 1.8 1.8 1.9 1.1 1.1
1.1
1.2
1.1 1.2 1.5 1.5 1.5 1.1 1.1
1.1
1.2
1.2 1.3 1.6 1.6 1.6 1.1 1.1
1.1
1.0
1.1 1.2 1.5 1.5 1.6 1.1 1.1
1.1
1.1
1.1 1.0 1.5 1.6 1.5 1.1 1.2
1.1
1.1
1.0 1.2 1.7 1.8 1.6 1.1 1.1
1.0
1.1
1.0 1.2 1.3 1.3 1.2 1.1 1.2
1.1
1.1
1.1 1.1 1.4 1.5 1.5 1.2 1.2
1.2
1.2
1.1 1.3 1.4 1.4 1.4 1.1 1.2
1.2
1.0
1.1 1.0 1.4 1.5 1.3 1.1 1.1
0.9
0.9
0.9 1.1 1.2 1.2 1.2 1.1 1.1
1.1
0.9
0.9 1.1 1.5 1.5 1.4 1.1 1.1
1.0
1.0
0.9 0.9 1.3 1.3 1.2 1.1 1.1
1.0
0.9
0.9 0.9 1.5 1.4 1.5 1.0 1.0
1.1
1.0
1.0 1.0 1.7 1.7 1.6 1.0 1.0
1.0
1.0
1.1 0.7 1.5 1.5 1.5 1.1 1.1
1.1
1.6 1.4 1.7
-
-
-
1.6 1.6 1.6
1.6 1.5 1.7
1.0
0.9 1.1 1.4 1.4 1.4 1.1 1.1
1.1
-
-
- 1.5 1.5 1.5 1.1 1.1
1.1
0.9
0.9 0.9 1.4 1.6 1.3 1.0 1.1
0.9
0.9
0.9 1.0 1.6 1.5 1.5 1.0 1.0
1.0
..........................................................................................................................................
Infant and Child Mortality in India : District Level Estimates
103

12.4 Page 114

▲back to top


Bidar
Raichur
Koppal
Gadag
Dharwad
Uttara Kannada
Haveri
Bellary
Chitradurga
Davanagere
Shimoga
Udupi
Chikmagalur
Tumkur
Kolar
Bangalore
Bangalore Rural
Mandya
Hassan
Dakshina Kannada
Kodagu
Mysore
ChamarajaNagar
GOA
North Goa
South Goa
KERALA
Kasaragod
Kannur
Wayanad
Kozhikode
Malappuram
Palakkad
Thrissur
Ernakulam
Idukki
Kottayam
Ratio of R/U
1991
Ratio of M/F
T
M
F
T
R
U
2.4 2.3 2.7
1.4 1.3 1.5
-
-
-
-
-
-
1.5 1.5 1.6
1.8 2.0 1.7
1.6 1.7 1.6
-
-
-
1.6 1.6 1.6
-
-
-
1.5 1.5 2.2
-
-
-
1.1 1.2 1.1
1.6 1.5 1.9
1.6 1.5 1.8
1.8 1.7 1.7
1.2 1.1 1.5
1.2 1.1 1.2
1.4 1.4 1.6
1.3 1.3 1.5
1.3 1.2 1.3
1.5 1.5 1.6
-
-
-
1.2
1.0 1.1
0.9
0.9 1.0
-
-
-
-
-
-
1.0
0.9 1.0
1.0
1.1 0.9
1.0
1.0 0.9
-
-
-
0.9
0.9 0.9
-
-
-
1.1
1.1 1.7
-
-
-
0.8
1.0 0.9
0.9
0.9 1.1
1.1
1.1 1.3
0.9
0.9 0.9
1.0
0.9 1.2
1.0
1.0 1.1
1.1
1.1 1.3
0.9
0.9 1.2
1.2
1.2 1.2
1.0
1.0 1.1
-
-
-
2001
Ratio of R/U
Ratio of M/F
T
M
F
T
R
U
1.9 1.9 2.0 1.0 1.1
1.1
1.6 1.6 1.7 1.0 1.0
1.1
1.4 1.3 1.4 1.0 1.0
1.0
1.4 1.3 1.4 1.1 1.1
1.1
1.6 1.7 1.5 1.1 1.1
1.0
1.3 1.3 1.4 1.1 1.1
1.2
1.5 1.5 1.5 1.0 1.0
1.0
1.4 1.3 1.4 1.0 1.0
1.0
1.4 1.4 1.5 1.0 1.0
1.1
1.3 1.3 1.3 0.9 1.1
1.1
1.4 1.4 1.3 1.1 1.1
1.1
1.2 1.3 1.1 1.1 1.1
0.9
1.2 1.3 1.2 1.0 1.0
0.9
1.4 1.4 1.4 1.1 1.1
1.1
1.6 1.6 1.6 1.1 1.1
1.0
1.3 1.3 1.3 1.0 1.0
1.0
1.3 1.3 1.3 1.1 1.1
1.1
1.3 1.4 1.3 1.1 1.1
1.0
1.4 1.4 1.3 1.1 1.1
1.1
1.1 1.1 1.0 1.0 1.1
1.0
1.0 0.9 1.1 1.2 1.2
1.4
1.7 1.8 1.7 1.1 1.2
1.0
1.7 1.7 1.6 1.1 1.1
1.0
1.5 1.4 1.7
1.3 1.3 1.3
0.9
0.9 1.1 1.0 0.9 1.2 1.1 0.9
1.2
1.2
1.1 1.1 1.1 1.2 0.9 1.0 1.2
0.9
2.0 1.7 2.4
1.3 1.2 1.4
1.5 1.2 2.1
1.5 1.5 1.7
1.1 1.2 1.1
0.9 0.9 0.9
1.3 1.6 1.2
1.0 0.9 1.0
2.2 2.2 2.7
1.3 1.3 0.9
1.0
0.9 1.3 1.1 1.1 1.1 0.9 0.9
0.9
1.2
1.0 1.2 1.0 0.9 0.9 0.8 0.8
0.8
1.0
1.0 1.7 1.0 1.0 1.0 0.9 0.9
0.9
0.9
1.0 1.2 1.0 1.0 1.0 0.9 0.9
0.9
1.0
1.0 0.9 0.8 0.8 0.8 0.9 0.9
1.0
0.9
0.9 0.9 1.6 1.4 1.6 1.0 1.0
1.1
1.0
1.0 0.7 1.1 1.1 1.1 0.8 0.9
0.9
0.8
0.7 0.8 1.1 1.1 1.2 0.8 0.8
0.8
1.0
1.0 1.2 1.4 1.5 1.3 1.0 1.0
0.9
0.6
0.7 0.5 1.0 0.9 1.1 0.8 0.8
0.9
..........................................................................................................................................
104
Infant and Child Mortality in India : District Level Estimates

12.5 Page 115

▲back to top


Alappuzha
Pathanamthitta
Kollam
Thiruvananthapuram
TAMIL NADU
Thiruvallur
Chennai
Kancheepuram
Vellore
Dharmapuri
Tiruvannamalai
Viluppuram
Salem
Namakkal
Erode
The Nilgiris
Coimbatore
Dindigul
Karur
Tiruchirappalli
Perambalur
Ariyalur
Cuddalore
Nagapattinam
Thiruvarur
Thanjavur
Pudukkottai
Sivaganga
Madurai
Theni
Virudh Nagar
Ramanathapuram
Thoothukkudi
Tirunelveli
Kanniyakumari
HIMACHAL PRADESH
Chamba
Ratio of R/U
1991
Ratio of M/F
T
M
F
T
R
U
0.9 1.2 0.7
0.8 1.1 0.8
0.7 0.9 0.8
1.2 1.4 1.2
1.0
1.2 0.6
0.7
0.7 0.5
0.8
0.8 0.7
1.1
1.3 1.1
2001
Ratio of R/U
Ratio of M/F
T
M
F
T
R
U
0.9 0.9 1.0 0.8 0.8
0.8
1.0 0.9 1.0 0.8 0.8
0.8
0.8 0.8 0.9 0.8 0.8
0.8
1.2 1.2 1.1 0.8 0.8
0.8
-
-
-
-
-
-
-
-
-
-
-
-
1.1 0.9 1.8
1.7 1.6 1.8
-
-
-
1.5 1.3 1.9
-
-
-
-
-
-
1.4 1.6 1.2
1.5 1.4 1.6
1.4 1.5 1.3
-
-
-
0.6 0.4 1.5
-
-
-
-
-
-
-
-
-
-
-
-
1.2 1.2 1.1
-
-
-
1.0 1.0 1.0
-
-
-
1.5 1.5 1.3
-
-
-
-
-
-
1.5 1.1 2.3
-
-
-
1.3 1.4 1.3
1.2 1.1 1.2
-
-
- 1.3 1.3 1.3 1.0 1.0
1.0
-
-
-
-
-
- 1.0
-
1.0
-
-
- 1.2 1.1 1.1 1.0 1.1
1.1
-
-
- 1.2 1.1 1.2 1.0 1.0
1.0
0.8
0.8 1.4 1.4 1.3 1.5 0.8 0.8
0.9
0.8
0.8 0.9 1.4 1.5 1.4 1.0 1.0
1.0
-
-
- 1.2 1.2 1.3 1.0 1.0
1.0
0.7
0.6 0.9 1.2 1.1 1.4 0.9 0.8
0.9
-
-
- 1.1 1.1 1.1 0.9 0.9
0.9
-
-
- 1.1 1.1 1.1 1.0 1.0
1.0
1.2
1.3 1.0 1.2 1.2 1.3 1.1 1.0
1.1
1.1
1.0 1.2 1.5 1.4 1.6 1.0 1.0
1.2
0.9
0.9 0.8 1.1 1.1 1.1 1.0 1.0
1.0
-
-
- 1.2 1.2 1.2 1.0 1.0
1.0
1.7
1.0 3.8 1.2 1.2 1.3 1.0 1.0
1.1
-
-
- 1.8 1.8 1.8 1.0 1.0
1.1
-
-
- 1.2 1.3 1.2 1.0 1.0
0.9
-
-
- 1.3 1.3 1.4 1.0 1.0
1.1
-
-
- 1.0 1.0 1.0 1.0 1.0
1.0
1.1
1.1 1.0 1.1 1.1 1.1 1.0 1.0
1.0
-
-
- 1.1 1.1 1.1 1.0 1.0
1.0
1.2
1.0 1.0 1.0 1.0 1.0 1.0 1.0
1.1
-
-
- 1.1 1.2 1.1 1.0 1.0
0.9
0.9
0.9 0.8 1.4 1.5 1.3 1.0 0.9
0.8
-
-
- 1.2 1.2 1.2 0.9 0.9
0.9
-
-
- 1.1 1.1 1.2 1.0 1.0
1.1
0.9
0.9 1.9 1.1 1.1 1.1 1.0 1.0
1.0
-
-
- 1.1 1.2 1.1 1.0 1.1
1.0
1.0
0.9 0.9 1.1 1.1 1.2 1.1 1.0
1.1
1.0
1.0 1.1 1.0 1.0 1.0 1.0 1.0
0.9
2.2 2.0 2.4
1.1
1.1 1.3 2.1 2.1 2.1 1.1 1.0
1.1
..........................................................................................................................................
Infant and Child Mortality in India : District Level Estimates
105

12.6 Page 116

▲back to top


Kangra
Lahul & Spiti
Kullu
Mandi
Hamirpur
Una
Bilaspur
Solan
Sirmaur
Shimla
Kinnaur
PUNJAB
Gurdaspur
Amritsar
Kapurthala
Jalandhar
Hoshiarpur
Nawanshahr
Rupnagar
Fatehgarh Sahib
Ludhiana
Moga
Firozpur
Muktsar
Faridkot
Bathinda
Mansa
Sangrur
Patiala
ARUNACHAL PRADESH
Tawang
West Kameng
East Kameng
Papum Pare
Lower Subansiri
Upper Subansiri
West Siang
1991
Ratio of R/U
Ratio of M/F
T
M
F
T
R
U
1.3 1.2 1.3
-
-
-
2.1 2.2 2.1
1.6 1.5 1.7
1.8 1.7 1.9
1.5 1.5 1.5
1.2 1.0 1.3
1.6 1.7 1.6
2.1 1.9 2.3
1.8 2.0 1.7
-
-
-
1.1
1.2 1.3
1.2
1.2
-
1.1
1.1 1.0
1.1
1.1 1.2
1.1
1.1 1.2
1.1
1.1 1.2
1.0
1.0 1.3
1.1
1.1 1.0
1.1
1.1 1.3
1.2
1.2 1.0
1.1
1.1
-
2001
Ratio of R/U
Ratio of M/F
T
M
F
T
R
U
1.2 1.1 1.4 1.1 1.0
1.3
-
-
- 1.2 1.2
-
2.2 2.0 2.4 1.1 1.1
1.3
1.6 1.7 1.6 1.1 1.2
1.1
1.5 1.5 1.7 1.1 1.0
1.2
1.5 1.8 1.3 1.0 1.0
0.7
1.5 1.4 1.6 1.1 1.1
1.3
1.4 1.4 1.5 1.1 1.1
1.1
1.8 1.9 1.7 1.0 1.0
0.9
2.1 1.9 2.3 1.1 1.0
1.3
-
-
- 1.1 1.1
-
1.0 1.0 1.3
1.8 2.0 1.6
2.2 2.1 2.3
2.6 2.6 2.5
1.8 1.8 1.2
-
-
-
1.9 1.8 1.9
-
-
-
2.5 2.6 2.4
-
-
-
1.5 1.3 1.7
-
-
-
1.2 1.1 1.2
1.8 2.2 1.5
-
-
-
1.6 1.5 1.7
1.7 1.8 1.7
1.1
1.0 1.2 1.2 1.2 1.2 1.1 1.0
1.0
1.0
1.0 0.8 1.4 1.3 1.4 0.9 0.9
0.9
1.0
1.0 1.1 1.3 1.2 1.4 1.0 1.0
1.1
1.1
1.1 1.1 1.3 1.3 1.3 1.0 1.0
1.0
0.8
0.9 0.6 1.5 1.6 1.3 1.0 1.0
0.8
-
-
- 1.2 1.2 1.2 1.0 1.0
0.9
1.1
1.0 1.1 1.3 1.2 1.4 1.0 0.9
1.1
-
-
- 1.1 1.0 1.1 0.9 0.9
1.0
0.8
0.9 0.8 1.1 1.1 1.1 1.0 0.9
0.9
-
-
- 1.2 1.1 1.3 1.0 0.9
1.1
1.2
1.2 1.4 1.3 1.3 1.3 1.0 1.0
0.9
-
-
- 1.4 1.4 1.4 0.9 0.9
0.9
1.0
1.0 1.1 1.4 1.3 1.5 1.0 0.9
1.1
1.4
1.4 0.9 1.5 1.6 1.6 0.9 0.9
0.9
-
-
- 1.5 1.5 1.5 1.0 0.9
1.0
0.9
0.9 1.1 1.4 1.4 1.4 1.0 1.0
0.9
0.8
0.8 0.8 1.4 1.3 1.4 0.9 0.9
1.0
-
-
-
2.0 3.1 1.4
-
-
-
-
-
-
3.5 3.1 3.1
-
-
-
2.5 2.1 2.0
1.3
1.3
- 1.3 1.7 1.1 0.9 1.0
0.7
1.1
1.1 0.5 2.5 2.2 3.0 1.1 1.1
1.5
1.0
1.0
- 1.8 1.7 1.9 1.0 1.0
1.1
-
-
- 1.8 1.5 2.1 1.1 1.0
1.3
1.0
1.1 1.1 4.3 4.2 4.4 1.0 1.0
1.0
1.2
1.2
- 1.6 1.4 1.8 1.0 0.9
1.1
1.1
1.1 1.0 1.3 1.2 1.3 1.1 1.1
1.1
..........................................................................................................................................
106
Infant and Child Mortality in India : District Level Estimates

12.7 Page 117

▲back to top


East Siang
Upper Siang
Dibang Valley
Lohit
Changlang
Tirap
JAMMU AND KASHMIR
Kupwara
Baramula
Srinagar
Badgam
Pulwama
Anantnag
Leh (Ladakh)
Kargil
Doda
Udhampur
Punch
Rajauri
Jammu
Kathua
A & N ISLAND
Andaman
Nicobar
Daman
Diu
PUDUCHERRY
Pondicherry
Mahe
Yanam
Karaikal
CHANDIGARH
Chandigarh
D&N HAVELI
D&N Haveli
LAKSHADWEEP
Lakshadweep
1991
Ratio of R/U
Ratio of M/F
T
M
F
T
R
U
1.9 1.2 3.0
-
-
-
1.7 1.4 1.4
1.8 0.7 1.8
-
-
-
3.3 2.9 4.0
0.8
0.7 1.7
-
-
-
1.4
1.0 1.0
1.0
1.0 2.6
1.1
1.1
-
1.1
1.1 1.5
2001
Ratio of R/U
Ratio of M/F
T
M
F
T
R
U
1.3 1.1 1.4 1.1 1.0
1.3
-
-
- 1.1 1.1
-
2.6 2.6 2.6 1.0 1.0
1.0
1.5 1.3 1.8 1.1 1.1
1.5
1.1 1.1 1.1 1.0 1.1
1.1
1.7 1.5 2.1 1.0 1.0
1.5
-
-
-
-
-
-
-
-
-
-
-
-
-
-
-
-
-
-
-
-
-
-
-
-
-
-
-
-
-
-
-
-
-
-
-
-
-
-
-
-
-
-
-
-
- 1.0 1.0 1.1 1.0 1.0
1.0
-
-
- 1.2 1.2 1.1 1.0 1.0
1.0
-
-
- 1.2 1.1 1.2 0.8 0.9
1.0
-
-
- 1.1 1.1 1.2 1.0 1.0
1.2
-
-
- 1.2 1.3 1.1 1.1 1.1
0.9
-
-
- 1.5 1.7 1.4 0.9 0.9
0.7
-
-
- 1.2 1.3 1.1 1.0 1.1
0.9
-
-
- 1.3 1.3 1.3 1.0 1.0
1.0
-
-
- 1.8 1.8 1.8 1.0 1.0
1.0
-
-
- 1.6 1.6 1.6 1.1 1.1
1.0
-
-
- 1.3 1.3 1.5 1.1 1.1
1.2
-
-
- 1.5 1.2 2.0 1.1 1.0
1.7
-
-
- 1.0 1.0 1.1 1.0 1.0
1.0
-
-
- 1.5 1.5 1.5 1.0 1.0
1.0
-
-
-
-
-
-
-
-
-
-
-
-
-
-
- 1.2 1.2 1.1 1.0 1.0
1.0
-
-
-
-
-
-
- 1.2
-
-
-
- 1.0 0.9 1.2 1.2 1.1
1.5
-
-
- 1.4 1.2 1.6 1.1 1.0
1.3
1.2 1.2 1.2
-
-
-
-
-
-
-
-
-
1.0
1.1 1.0 1.2 1.2 1.2 1.4 1.1
1.1
-
-
-
-
-
- 1.0
-
1.0
-
-
-
-
-
- 1.1
-
1.1
-
-
- 1.0 1.0 1.0 1.0 1.0
1.0
1.4 1.5 1.3
1.2
1.2 1.1 1.4 1.5 1.3 1.1 1.2
1.1
1.8 1.7 1.7
1.1
1.3 1.4 1.7 1.6
2 1.1 0.9
1.2
1.0 1.3 0.6
1.5
2.0 0.9 1.2 1.2 1.1 1.1 1.1
1.0
..........................................................................................................................................
Infant and Child Mortality in India : District Level Estimates
107

12.8 Page 118

▲back to top


..........................................................................................................................................
108
Infant and Child Mortality in India : District Level Estimates

12.9 Page 119

▲back to top


Definitions
Infant Mortality Rate (1q0): The probability of dying before completing the first birthday.
Child Mortality Rate (5q0): The probability of dying before completing the fifth birthday.
..........................................................................................................................................
Infant and Child Mortality in India : District Level Estimates
109

12.10 Page 120

▲back to top


POPULATION
PFI FOUNDATION
OF INDIA
B-28, Qutab Institutional Area, Tara Crescent, New Delhi 110 016
Tel. No : 42899770, Fax : 42899795
Website : www.popfound.org, E-mail : popfound@sify.com