Monograph Series 1

Monograph Series 1


1 Pages 1-10

▲back to top


1.1 Page 1

▲back to top


Monograph Series
No. 1 (1996)
i
Population Foundation of India
~,\\
New Delhi
1996

1.2 Page 2

▲back to top


Differentials in The Population Growth
of Hindus and Muslims in India,
1981-91
Population Foundation of India
New Delhi
1996

1.3 Page 3

▲back to top


DIFFERENTIALS IN THE POPULATION GROWTH OF HINDUS AND
MUSLIMS IN INDIA, 1981·91
Copyright © 1996 by Population Foundation of India. All rights reserved. No
part of this publication may be reproduced, stored in a retrieval system, or
transmitted, in any form or by any means, electronic, mechanical, photocopying,
recording or otherwise, without the prior written permission of the publisher.
Published by:
Population Foundation of India, New Delhi.
Printed by:
Hindustan Publishing Corporation, 4805/24 Bharat Ram Road, Daryaganj, New
Delhi 110002

1.4 Page 4

▲back to top


Population Foundation of India is commencing with this issue a
"Monograph series". These will be prepared from time to time by
eminent scholars in the field on topics of contemporary concern and
interest. The present article "Differentials in the Population Growth
of Hindus and Muslims in India, 1981-91" has been prepared by
Dr. P. M. Kulkarni, Professor of Population Studies at Bh~rathiar
University, Coimbatore, at the request of the Foundation.
The large differentials between the rates of growth of Muslims
and Hindus observed during the period 1981-91 has caused a
considerable degree of academic and political interest in the country.
During the decade 1981-91 the Muslim population grew by 32.76%
compared to 22.78% for the Hindus. The differential has increased
from the earlier decade 1971-81. What are the factors underlying this
large differential growth rate of Muslim population during the past
decade? It can be due to higher fertility, lower mortality and possibly
a higher level of immigration from across the borders or a combination
of these factors. We requested Prof P. M. Kulkarni, a well-known
demographer, to put together the available facts on fertility, mortality
and migration for these two religious groups in the recent past, analyse
the situation and prepare a scholarly article.
The Monograph is an outcome of such an analysis. Prof Kulkarni
concludes that most of the differences in the growth rate of Muslims
in most of the large States in the country are attributable to their
higher levels of fertility as compared to Hindus and to some extent to
their lower levels of mortality. Only to a very small extent their
population growth is attributable to immigrations from 'across the
borders.
I hope the Monograph will generate a good deai of interest and
debate in the academic community and policy.makers at large.
Population Foundation of India
15.10.1996
Dr. K. Srinivasan
Executive Director

1.5 Page 5

▲back to top


1.6 Page 6

▲back to top


Methodology
Initial Age Distributiton
Fertility
Mortality
Adjustments
Results
Decomposition of the Growth Differential

1.7 Page 7

▲back to top


1.8 Page 8

▲back to top


Differentials in the Population Growth of Hindus and
Muslims in India, 1981-91
The 1991 census data have revealed large differentials in the population
growth by religion in India during the intercensal decade of 1981-91.
Of the six major religion groups with populations exceeding one
million each, the largest increase has been experienced by the
Buddhists (36 per cent) followed by the Muslims (33 percent), and
the smallest by the Jains (4 per cent). Since the Muslim population
is quite large, its growth has attracted greater attention. Of course,
the higher than average growth among Muslims is not a new
development; intercensal decades prior to 1981 have also shown a
high growth for Muslims as compared to the majority Hindu
population. But the growth differential during 1981-91 is larger than.
in the past and has caused a rise of about one percentage point in
the Muslim share in the total population (Table 1). Moreover, in some
major states like Uttar Pradesh, West Bengal, Rajasthan, and Kerala,
the Muslim-Bindu difference is extremely high, well over 10
percentage points (Table 2). As a result, there has been much
speculation about the possible causes and consequences of such a
high growth among Muslims (see Bose, 1995; Shariff, 1995).
The factors responsible for the relatively high population growth
among Muslims in the past have been discussed by researchers earlier
(Visaria, 1974; Balasubramanian, 1984; Bhatia, 1990). It is recognized
that fertility among Muslims has been higher than average. Besides,
there is some evidence that mortality is lower among Muslims. The
role of migration has not been studied systematically since data on
migration by religion have not been available at the national or state
levels. But the rather large Muslim-Hindu growth differential during
1981·91 and the very large differentials in some of the states call
for an examination of the migration factor as well.

1.9 Page 9

▲back to top


2
P. M. Kulkarni
TABLE I: POPULATION GROWTH BY RELIGION, INDIA 19111-91
Religion
Year
Population
Percentage
to Total
Population
Per cenl
Increase
1981-91
Hindu
1981
1991
547,794,269
672,599,428
83.09
82.41
22.78
Muslim
1981
1991
71,728,063
95,222,853
10.88
11.67
32.76
Christian
1981
1991
16,166,017
18,895,817
2.45
16.89
2.32
Sikh
1981
12,944,471
1.96
25.48
1991
16,243,252
1.99
Buddhist
1981
1991
4,650,194
6,323,497
0.71
35.98
0.77
Jain
1981
3,190,996
0.48
4.42
1991
3,332,061
0.41
Others
1981
1991
2,826,450
3,536,611
0.43
25.13
0.43
Total
1981
1991
659,300,460
816,169,666
100.00
100.00
23.79
Note: All figures relate to India excluding Assam and Jammu and Kashmir.
Source: India, Registrar General (l995a).
This paper seeks to estimate the contributions of differences in
natural increase and migration to the Hindu-Muslim growth
differentials. To this end, trends and differentials in population growth
by religion at the national and state level are first examined followed
by an assessment of differentials in fertility and mortality during the
1970s and 1980s. On the basis of the available estimates of fertility
and mortality by. religion, the 198] population is projected to the
1991 census date for Hindus and Muslims, using the commonly used
component projection method. The implied natural increase i~ then
compared to the observed intercensal growth and migration estimated
as residual on the assumptions that there has been no differential
underenumeration and no change of religion (conversion) over the
period of study. Finally, the contributions of differences in fertility,

1.10 Page 10

▲back to top


Differentials in the Population Growth of Hindus and Muslims in India
3
TABLE 2: POPULATION SIZE AND SHARE OF HINDUS AND MUSLIMS,
INDIA AND STATES, 1981 AND 1991
Slale
Census
Year
All Religions
Hlildll
Popula- 1981-91 Pop 1I1a-
lion (in % lion (in %
OOO's) increa.~e OOO's) Share
Muslim
1981-91 Popula-
1981-91
% lioll (in %
%
increase OOO's) Share increase
A. P.
1981
1991
53550
66508
24.20
47526
59282
88.75
89.14
24.74
4534
5923
8.47 30.66
8.91
Bihar
1981
1991
69915
86374
23.54
58011
71193
82.97
82.42
22.72 9875
12788
14.13
14.81
29.50
Gujarat 1981
1991
34086
41310
21.19
30519
36964
89.53
89.48
21.12
2908
3607
8.53 24.05
8.73
Karna- 1981
taka
1991
37136
44977
21.12
31852
38432
85.77
85.45
20.66
4164
5234
11.21
11.64
25.71
Kerala 1981
1991
25454
29099
14.32
14801
16669
58.15
57.28
12.62
5410 21.25
6788 23.33
25.49
M. P.
1981
1991
52179
66181
26.84
48505
61413
92.96
92.80
26.61
2502
3283
4.80 31.21
4.96
Maha- 1981
rashtra 1991
62784
78937
25.73· 51109
64033
81.40
81.12
25.29
5806
7629
9.25 31.40
9.67
Rajas-
than
1981
1991
34262
44006
28.44
30604
39201
89.32
89.08
2lUJ9
2492
3525
7.28 41.46
8.01
Tamil
Nadu
1981
1991
48408
55859
15.39 43017
49532
88.86
88.67
15.15
2520
3053
5.21 21.14
5.47
U. P.
1981 110862
1991 139112
25.48 92366
113713
83.31
81.74
23.11 17658 15.93
24110 17.33
36.54
W.E.
1981
1991
54581
68078
24.73 42007 76.96
50867 74.72
21.09 11743 21.51
16076 23.61
36.89
India (excluding Assam and Jammu and Kashmir)
1981 659300
1991 816170
23.79 547794
672599
83.09
82.41
22.78 71728 10.88
95223 11.67
32.76
Source: India, Registrar General, (1995a).

2 Pages 11-20

▲back to top


2.1 Page 11

▲back to top


mortality and migration to the Hindu-Muslim growth difference are
estimated. The analysis has been carried out for India and for all
the states with million plus Hindu and Muslim populations. However,
out of the thirteen such states, two, Assam and Jammu and Kashmir,
had to be excluded because either the 1981 or the 1991 census was
not carried out in these. Hence only eleven states could be covered,
these are: Andhra Pradesh, Bihar, Gujarat, Karnataka, KeraJa, Madhya
Pradesh, Maharashtra, Rajasthan, Tamil Nadu, Uttar Pradesh, and
West Bengal.
The average annual exponential growth rates for intercensal periods '
since 1961 for the six major religion groupsl-Hindu, Muslim,
Christian, Sikh, Buddhist, and Jain-are presented in Table 3. The
all-India rates are available only for the decade 1961-71, since no
census was conducted in Assam in 1981 and in Jammu and Kashmir
in 1991. For the purpose of comparison, the 1961-71 rates are also
recomputed excluding one or both of these states. It can be seen that
the exclusion of one or both the states has very little effect on the
growth rates for the religion groups. Hence, one can study the trends
from the last panel in Table 3, i.e., excluding Assam and Jammu
and Kashmir. The Hindu growth rate has been quite steady, with
a small decline in the most recent period (1981-91). The Muslim
growth rate has always been higher than the Hindu growth rate, with
the gap widening during 1981-91. The growth rate for Christians
was quite high during 1961-71, but has declined substantially since
1971. The growth rate for the Sikhs has been higher than that for
the Hindus, but the gap has narrowed recently. The growth rate for
the Buddhists shows a steady rise, whereas for the Jains, a steep drop
occurred during 1981-91.
The growth rates for the two largest communities, Hindus and
Muslims, during the intercensal decades since 1961 for all states with
million plus populations of each of these communities are given in
1. The 1961, 1971, and 1991 census tabulations are based on the religion of the individual
but the 1981 census tabulations are based on the religion of the head of the household
(India, Registrar General, 1984). It is a tilir assumption that. cxcept in vcry rare inst<tnccs.
all the members of a household would have the SlIme religion as the head. and hence the
1981 data are also treated as reterring to the religion of the individual throughout this
paper.

2.2 Page 12

▲back to top


Differentials in the Population Growth of Hindus and Muslims in India
5
TABLE 3: GROWTH RATES BY RELIGION DURING INTERCENSAL PERIODS,
INDIA. 1961-91
Period
Religion
All
Hindu
Muslim Christian Sikh
Buddhist
.lain
All India
1961-71
2.20
2.11
2.67
2.80
2.78
1.74
2.48
Excluding Assam
1961-71
2.18
2.09
2.67
2.78
2.77
1.73
2.48
1971-81
2.23
2.18
2.70
1.57
2.34
2.21
2.10
Excluding Jammu & KashmiJ·
1961-71
2.19
2.11
2.69
2.80
2.75
1.73
2.49
1971-91
2.18
2.'11
2.78
1.62
2.31
2.67
1.27
Excluding Assam and Jammu & KashmiJ·
1961-71
2.17
2.08
2.69
2.78
2.75
1.73
2.48
1971-81
2.23
2.18
2.72
1.57
2.34
1.22
2.10
1981-91
2.13
2.05
2.83
1.56
2.27
3.07
0.43
1961-91
2.18
2.11
2.75
1.97
2.46
2.34
1.67
Note: All rates are annual exponential growth rates expressed as percentages.
Source: Computed from the populations of states by religion obtained from India, Registrar
General (1972) and India, Registrar General (1995a).
Table 4. It can be seen that the rate for Muslims is substantially higher
than that for Hindus in a majority of the states during all the three
decades. A notable exception is the Muslim majority state of Jammu
and Kashmir, in which the Hindu growth rate was much above the
Muslim growth rate, by about one percentage point, during 1961-
71 and 1971-81. In the case of Assam, the growth was higher among
Hindus during 1961-71, but lower during 1971-91. In Gujarat, the
growth differential has been very small. On the other hand, in Kerala
the growth rate for Muslims has remained nearly a point above that
for Hindus throughout the three decades in spite of an overall steep
decline in the population growth rate. The growth differential has
declined in a few states-Andhra Pradesh, Bihar, Karnataka,
Maharashtra, and Tamil Nadu, but increased in Rajasthan, Uttar
Pradesh and West Bengal. Clearly, though the Muslim growth rate
has generally been higher than the Hindu growth rate, the gap has
varied across states and over time.

2.3 Page 13

▲back to top


6
P. M. Kulkarni
TABLE 4: POPULATION GROWTH RATES FOR HINDUS AND MUSLIMS,
INDIA AND STATES. 1961c91
State
A.P.
Assam
Bihar
Gujarat
J&K
Karnataka
Kerala
M.P.
Maharashtra
Rajasthan
Tamil Nadu
V.P.
W.B.
1961-71
H
Ai
1.79 2.58
3.14 2.68
1.77 2.70
2.59 2.52
3.24
2.21
2.06 2.88
2.08 3.16
2.47 3.18
2.37 3.30
2.40 3.00
1.89 2.96
1.68 2.35
2.27 2.58
Period
1971-81
1981-91
H
Ai
H
Ai
/961-91
H
Ai
2.22 2.55 2.21 2.64 2.07 2.60
1.75* 2.88* 2.21 2.81
2.12
2.65
2.05
2.59
1.98 2.64
2.49
2.59
1.92 2.15
2.33
2.42
3.21 2.36
3.22$ 2.29$
2.31
2.93
1.88 2.29
2.08
2.70
1.56 2.64
1.19 2.27
1.61 2.69
2.19
3.33
2.36
2.72
2.34
3.04
2.15 3.19 2.25 2.73 2.26 3.07
2.84 3.40 2.48 3.47 2.57 3.29
1.61 1.82 1.41 1.92 1.64 2.24
2.24 2.58 2.08 3.11 2.00 2.68
1.95 2.61
1.91 3.14
2.05
2.78
India (excluding Assam and Jammu and Kashmir)
2.08 2.69 2.18 2.72 2.05 2.83 2.11 2.75
- : not available; H: Hindu; M: Muslim;
* : for the period 1971-91;
$ : for the period 1961-81.
Note: The table presents data only for the states with Hindu and Muslim populations
exceeding one million in 1991.
All rates are exponential growth rates for the periods expressed as per cent.
Source: Computed fr.om the populations of states by religion obtained from India, Registrar
General (1972) and India, Registrar General (1995a).
There is adequate evidence to support the observation that fertility
among Muslims has been higher than among Hindus in India. This
is briefly reviewed here. Many surveys have provided tabulations
on fertility differentials by religion. But estimates from small surveys
are subject to large sampling errors, and surveys that do not have
a state coverage may not be useful to draw inferences at the state
level. Hence, only state level surveys are being examined here. The
Sample Registration System (SRS) has conducted three surveys which
provide fertility estimates by religion. The 1972 survey provided

2.4 Page 14

▲back to top


Differentials in the Population Gro\\\\1h of Hindus and Muslims in India
7
tabulations by religion for only a few states. But the 1979 SRS survey
(India, Registrar General, 1982) and the 1984 SRS survey (India,
Registrar General, 1990) give estimates for all states in which the
populations of specified religion groups are large enough. The
National Family Health Survey (NFHS) also provides differentials
in fertility at the all-India and state level (lIPS, 1995). In addition,
the 1971 and the 1981 censuses also give estimates of fertility by
religion (India, Registrar General, 1987b, 1988).
The 1971 census estimates are based on questions on 'births last
year' and provide marital fertility rates. The summary index, total
marital fertility rate (TMFR), is presented in Table 5. The 1979 SRS
survey obtained information on fertility during a five-year period
before the survey, i.e., 1973-78. The age specific fertility rates, the
age-specific marital fertility rates and various summary indexes-
total fertility rate (TFR), total marital fertility rate (TMFR), general
fertility rate (GFR), general marital fertility rate (GMFR), and the
crude birth rate (CBR)-for the major religions are published. The
estimates are provided separately for rural areas and urban areas .of
states. The 1981 census included questions on 'births last year' and
'children ever born'. As a result, in addition to summary indexes
like TFR, TMFR, and GFR, estimates adjusted by the application
of the P/F ratio method are also available. Besides, tabulations on
mean parities give cumulative fertility by cohort. The 1984 SRS
survey obtained information on fertility during a reference period
of one year before the survey, Le., July 1983 to June 1984, and
provides age-specific fertility rates, age-specific marital fertility rates
and mean parities by religion. The summary measures available are:
TFR, TMFR, GFR, and GMFR for rural areas, urban areas, and
combined areas. The NFHS reports do not give age-specific rates
by religion, but summary measures, TFR and mean children ever
born for women in the age group 40-49, are available.
Before the differentials are discussed, some cautionary remarks
are in order. First, the various sets of estimates have been obtained
in different manners-census questions, special surveys etc., with
variation in reference periods. Hence, the sets are not suited to examine
fertility trends for any religion. Instead, each set is being used to
assess differentials for the corresponding time reference point or
period. This would be acceptable only if it can be assumed that the
nature of errors in any given set of estimates does not vary by religion.
The 1971 and 1981 census estimates are obtained from questions

2.5 Page 15

▲back to top


on births last year; it is known that reference period errors can distort
the estimates but there is no reason to believe that the nature and
extent of such errors would differ by religion. The 1981 census has
provided adjusted estimates of fertility by applying the Brass PIF
ratio method as well. But since India did experience some fertility
decline during the 1970s, the adjusted estimates of current fertility
from the 1981 census questions are likely to be on the higher side.
Further, if the timing and extent of decline among Hindus was different
from that among Muslims, the distortions are also likely to be
different .
. Both the 1979 survey and the 1984 survey were conducted by
the SRS. But the procedure differed. In the NFHS, the sample sizes
(generally over 4000 women of reproductive age) were adequate to
obtain estimates of fertility at the state level. However, Muslim
populations in many states are only around 10 per cent, and
correspondingly the estimates for Muslims are subject to larger
sampling errors.
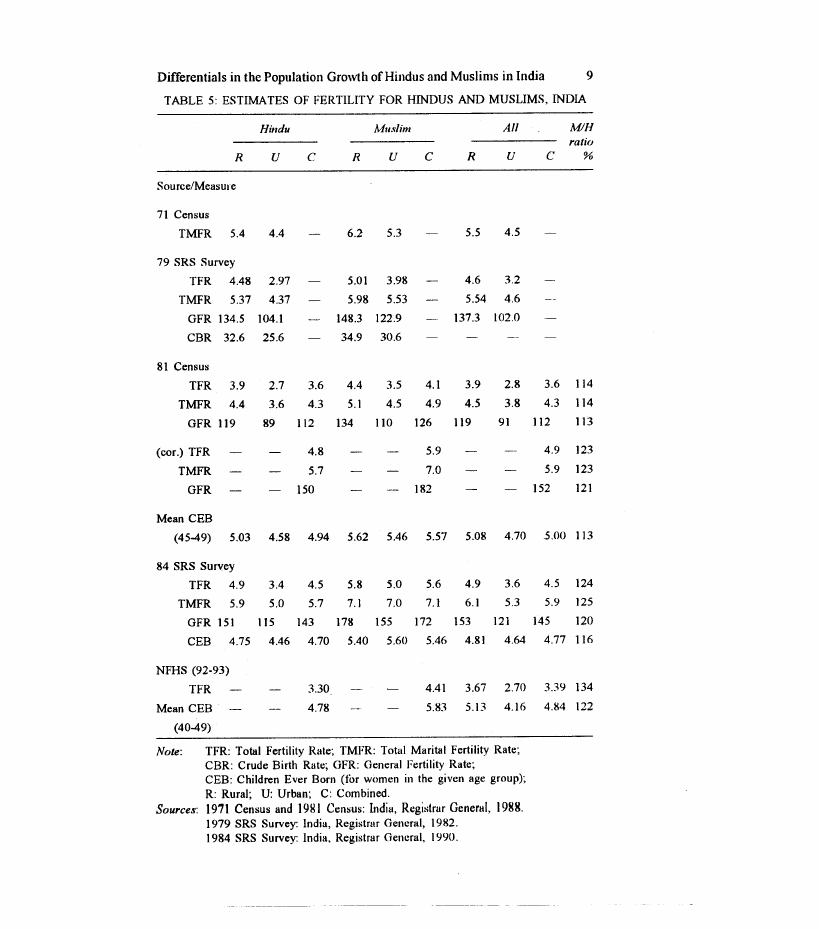
The estimates for Hindus, Muslims, and All Religions are given
in Table 5. It can be seen that Muslim fertility has been consistently
higher than Hindu fertility. The unadjusted estimates from the 1981
census show an excess of 13-14 per cent. The adjusted (using the
PIF ratio) estimates show greater disparity. The 1984 survey indicates
that Muslim fertIlity was higher by over 20 per cent. Note that for
mean children ever born (for women of age 45-49) which gives
cumulative fertility, the excess is not as large. This suggests that the
differentials were smaller in the past. The NFHS estimates also show
a larger disparity in current fertility but smaller in cumulative fertility
for older women. Thus, the data indicate that Muslim fertility has
been higher than Hindu fertili!y and furtherthat the differentials have
widened through the 1980s.
Estimates for major states are given in Appendix A. There are
notable inter-state variations in the differentials. The Muslim fertility
has been at about the same level or only marginally higher than Hindu
fertility in Gujarat, Madhya Pradesh, Rajasthan, and Bihar. In Uttar
Pradesh, the Muslim fertility has been higher than Hindu fertility
by 10-20 per cent. In Maharashtra, Karnataka, and West Bengal, the
differentials have widened and are quite-high according to the NFHS
estimates. For Kerala, past as well as recent estimates show that
Muslim fertility has been substantially higher than Hindu fertility.
On thp nthp'f hand the rlitTerences have narrowed down in Andhra

2.6 Page 16

▲back to top


Differentials in the Population Growth of Hindus and Muslims in India
9
TABLE 5: ESTIMATES OF FERTILITY FOR HINDUS AND MUSLIMS, INDIA
Hindu
R
U
C
Muslim
R UC
All
Mil!
ratio
R
U
C
%
Source/Measure
71 Census
TMFR 5.4 4.4
6.2 5.3
5.5 4.5
79 SRS Survey
TFR 4.48 2.97
TMFR 5.37 4.37
GFR 134.5 104.1
CBR 32.6 25.6
5.01 3.98
5.98 5.53
148.3 122.9
34.9 30.6
4.6 3.2
5.54 4.6
137.3 102.0
81 Census
TFR 3.9
TMFR 4.4
GFR 119
2.7
3.6
4.4
3.5
4.1
3.9
3.6 4.3 5.1 4.5 4.9 4.5
89 112 134 lID
126 119
2.8 3.6 114
3.8 4.3 114
91 112 113
(cor.) TFR
TMFR
GFR
4.8
5.7
150
5.9
7.0
182
4.9 123
5.9 123
152 121
Mean CEB
(45-49) 5.03 4.58 4.94 5.62 5.46 5.57 5.08 4.70 5.00 113
84 SRS Survey
TFR 4.9 3.4 4.5 5.8 5.0 5.6 4.9 3.6 4.5 124
TMFR 5.9 5.0 5.7 7.1 7.0 7.1 6.1 5.3 5.9 125
GFR 151 115 143 178 155 172 153 121 145 120
CEB 4.75 4.46 4.70 5.40 5.60 5.46 4.81 4.64 4.77 116
NFHS (92-93)
TFR
3.30
Mean CEB
4.78
(40-49)
4.41 3.67 2.70
5.83 5.13 4.16
Note:
Sources:
TFR: Total Fertility Rate; TMFR: Total Marital Fertility Rate;
CBR: Crude Birth Rate; GFR: General Fertility Rate;
CEB: Children Ever Born (for women in the given age group);
R: Rural; U: Urban; C: Combined.
1971 Census and 199 I Census: India, Registrar General, 1988.
1979 SRS Survey: India, Registrar General, 1982.
1984 SRS Survey: India, Registrar General, 1990.
3.39 134
4.84 122

2.7 Page 17

▲back to top


10
DifTerential5 in Mortality
Age-specific death rates by religion are not available at the state or
the national level: Moreover, since age distributions are not tabulated
by religion in the censuses, indirect estimates of adult mortality also
can not be obtained using conventional techniques. However, some
surveys have provided estimates of infant and childhood mortality
by religion. The 1979 SRS survey gives such estimates for rural and
urban areas of states separately. The NFHS also gives estimates of
the infant mortality rate (IMR), and of q(5), i.e., probability of death
below age 5, for a ten year period before the survey; which would
be 1983-92 for most of the states. Indirect estimates of child mOliality
by religion are provided by the 1981 census, obtained via the Brass
method from data on children ever born and surviving, for most of
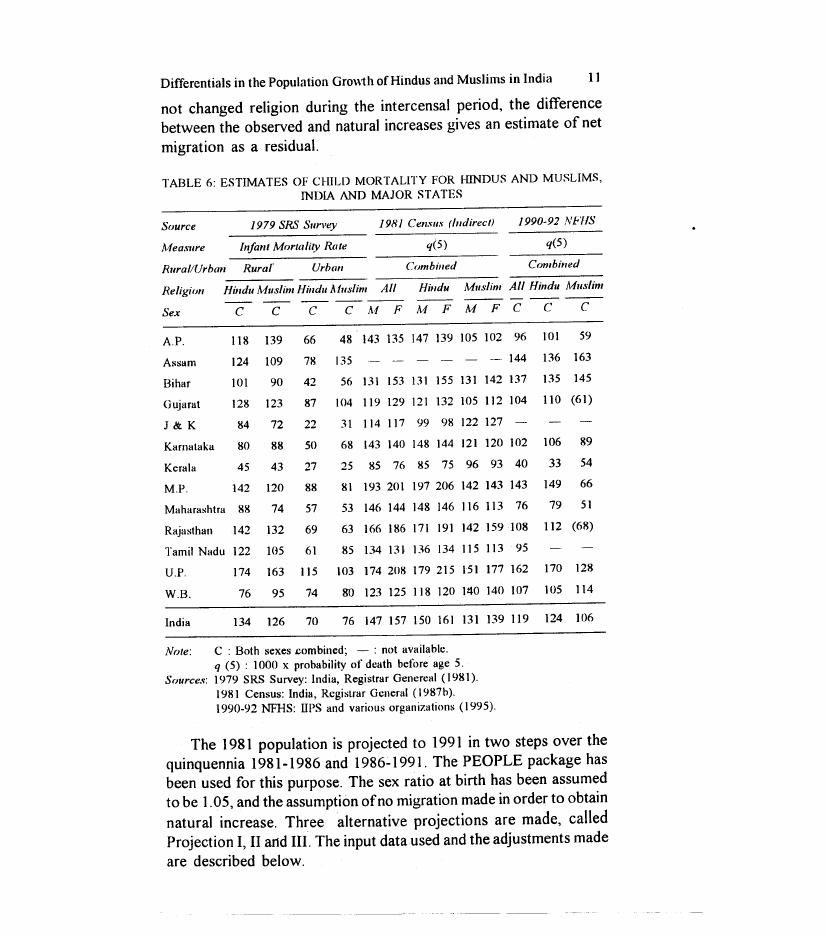
the states. These refer to a point in the mid-1970s.
The estimates-IMR from the 1979 survey, and q(5) from the
1981 census and from the NFHS-are given in Table 6. It can be
seen that childhood mortality among Hindus was higher than among
Muslims at the all India level in the rural areas according to the 1979
survey, and overall according to the 1981 census and the NFHS
estimates. Among the major states, mortality has been much higher
for Hindus as compared to Muslims in Andhra Pradesh, Madhya
Pradesh, Rajasthan, and Uttar' Pradesh and moderately higher in
Gujarat, Kamataka, Maharashtra, and Tamil Nadu. On the other hand,
in Assam, Jammu and Kashmir, Kerala, and West Bengal, childhood
mortality has been higher among Muslims. The differentials are small
in Bihar.
Methodology
The paper focuses on the growth differentials during 1981-9], and
the methodology adopted is fairly simple and straightforward. First,
the population enumerated in ]98] (on the census date, i,e., March
1, 1981) is projected to the ] 991 census date (March ], 1991) on
the basis of the available information on fertility and mortality during
the intercensal decade. This is done for total population (All Religions)
and for Hindus and Muslims separately, using the appropriate fertility
and mortality estimates, for all-India and the eleven states considered.
The natural increase for the intercensal period 1981-91 is then
computed and compared to the observed intercensal growth. If the
errors of enumeration do not vary by religion, and if individuals have

2.8 Page 18

▲back to top


Differentials in the Population Gro\\\\th of Hindus and Muslims in India
II
not changed religion during the intercensal period, the difference
between the observed and natural increases gives an estimate of net
migration as a residual.
TABLE 6: ESTIMATES OF CHILD MORTALITY FOR HINDUS AND MUSLIMS,
INDIA AND MAJOR STATES
1979 SRS Survey
Infant Mortality Rate
1990-92 NFIIS
q(5)
101 90
128 123
84 72
80 88
45 43
142 120
Maharashtra 88 74
Rajasthan 142 132
Tamil Nadu 122
U.P.
174
42 56 131 153 131 155 131 142 137 135 145
87 104 119 129 121 132 105 112 104 110 (61)
22 31 114 117 99 98 122 127
50 68 143 140 148 144 121 120 102 106 89
27 25 85 76 85 75 96 93 40 33 54
88 81 193 201 197 206 142 143 143 149 66
57 53 146 144 148 146 116 113 76 79 51
69 63 166 186 171 191 142 159 108 112 (68)
85 134 131 136 134 115 113 95
103 174 208 179 215 151 177 162
Note:
Sources:
C : Both sexes combined; -: not available.
q (5) : 1000 x probability of death before age 5.
1979 SRS Survey: India, Registrar Genereal (1981).
1981 Census: India, Registrar General (1987b).
1990-92 NFHS: III'S and various organizations (1995).
The 1981 population is projected to 1991 in two steps over the
quinquennia 1981-1986 and 1986-1991. The PEOPLE package has
been used for this purpose. The sex ratio at birth has been assumed
to be 1.05, and the assumption of no migration made in order to obtain
natural increase. Three alternative projections are made, called
Projection I, II and III. The input dataused and the adjustments made
are described below.

2.9 Page 19

▲back to top


12
P. M. Kulkarni
TABLE 7: ESTIMATES OF NATURAL INCREASE AND NET MIORATION.
INDIA AND STATES. 1981-91. PROJECTION I
Total Interce/lsal
Growth ("!o)
Estimated Intercensal growth Net Intercel/sll!
Natl/ra!
- /Iatl/ra! i/lcrease AligratirJII
Increase (%)
(% points)
(in thousands)
Hindu Aluslim HindI/ Ml/slim Hi/ldu All/slim Hi/ldu :\\IlIs!ill/
Andhra Pradesh 24.74
Bihar
Gujarat
22.72
21.12
Karnataka
20.66
Kerala
12.62
Madhya Pradesh 26.61
Maharashtra
25.29
Rajasthan
28.09
Tamil Nadu
15.15
Uttar Pradesh
23.11
West Bengal
21.09
30.66
29.50
24.05
25.71
25A9
31.21
31AO
41A6
21.14
36.54
36.89
20.59
26.32
23.76
21.08
14.53
26.06
22.23
27A3
16.08
24.58
2(J.()2
27A7
28.33
2562
4.15
-3.60
2.64
3.19
1.17
-1.57
30.44
27.03
-HA2
-1.91
-4.73
-1.54
32.01 0.55 -0.110
30.58 3.06 0.112
29AI 0.66 12.05
18.06 -0.93
32.31 -1.47
3.011
4.23
33.84 1.07 3.05
f-197'2
-20811
806
-134
283
1267
<-1564
,202
400
-1356
1449
·145
116
-46
197
-83
20
"411
300
~711
,747
'.'511
India (excluding Assam and Jammu and Kashmir)
22.78 32.76 22.88 31.22 --0.10 1.54
-5411 • 1105
Initial Age Distribution
The 1981 census age distributions are available for all states (India,
Registrar General, 1987a). Unfortunately, age distributions are not
available by religion. Though the fertility tables do provide age data
on women in the reproductive ages by religion, this information is
not adequate to get overall age distribution. Therefore, in Projection
I, the age distribution for the state has been used for both the religion
groups on the assumption that the age distributions do not vary
substantially by religion. Since Hindus constitute the bulk of the
population in all the eleven states considered, their age distribution
would be close to the overall age distribution. However, this may
not be true for Muslims, especially ifthere was a large Hindu-Muslim
difference in fertility prior to 1981. Since it has been noted that this
was indeed the case for many states, the Muslim age distribution
in 1981 was likely to be younger. In such states, another age
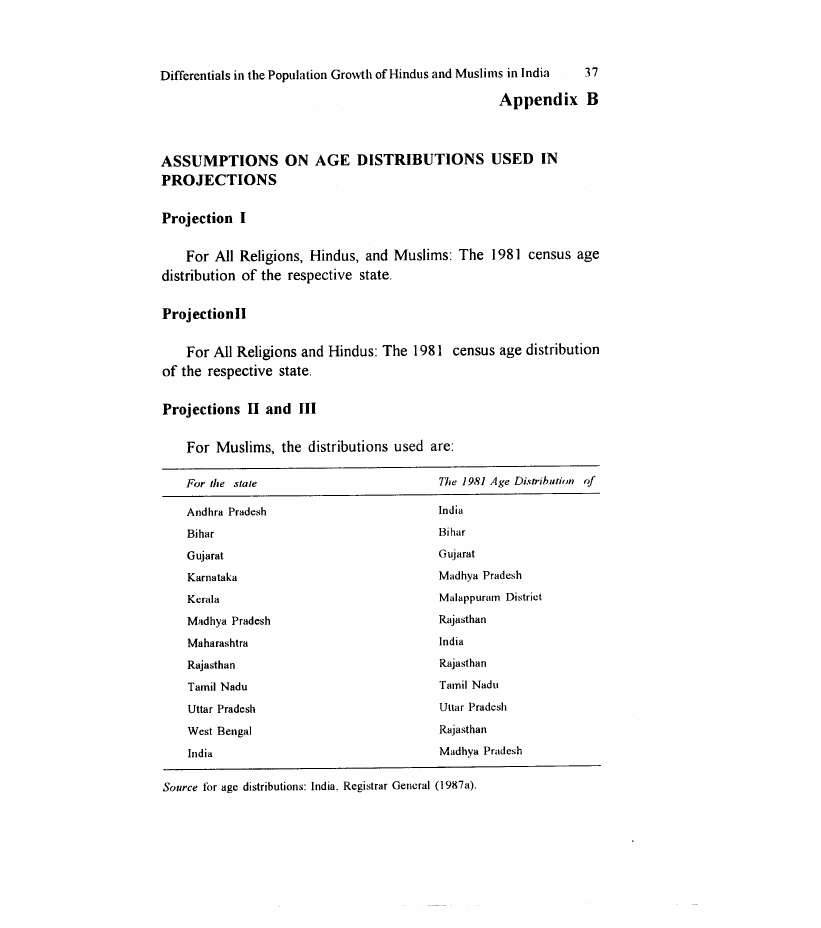
distribution has been used for Muslims in Projections II and III. This

2.10 Page 20

▲back to top


Differentials in the Population Growth of Hindus and Muslims in India
13
has been taken from a state with fertility close to the Muslim fertility
in the given state. Details are given in Appendix B.
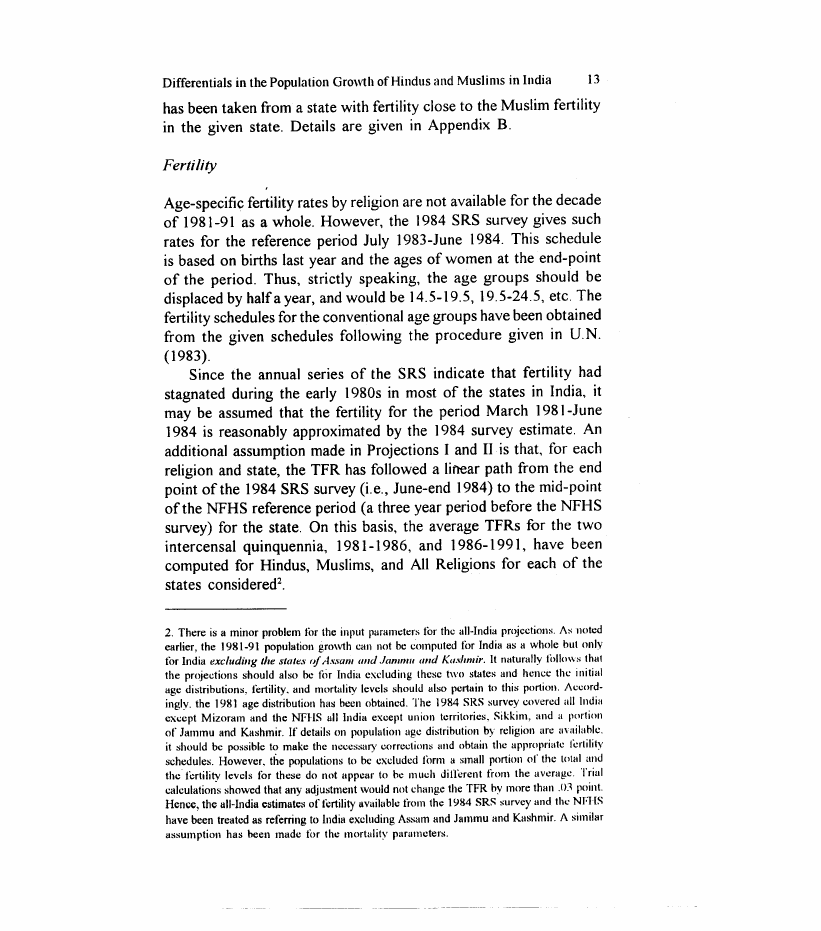
Age-specific fertility rates by religion are not available for the decade
of 1981-91 as a whole. However, the 1984 SRS survey gives such
rates for the reference period July 1983-June 1984. This schedule
is based on births last year and the ages of women at the end-point
of the period. Thus, strictly speaking, the age groups should be
displaced by halfa year, and would be 14.5-19.5, 19.5-24.5, etc. The
fertility schedules for the conventional age groups have been obtained
from the given schedules foHowing the procedure given in U.N.
( 1983).
Since the annual series of the SRS indicate that fertility had
stagnated during the early 1980s in most of the states in India, it
may be assumed that the fertility for the period March 1981-June
1984 is reasonably approximated by the 1984 survey estimate. An
additional assumption made in Projections I and II is that, for each
religion and state, the TFR has followed a linear path from the end
point of the 1984 SRS survey (i.e., June-end 1984) to the mid-point
of the NFHS reference period (a three year period before the NFHS
survey) for the state. On this basis, the average TFRs for the two
intercensal quinquennia, 1981-1986, and 1986-1991, have been
computed for Hindus, Muslims, and All Religions for each of the
states considered2•
2. There is a minor problem fllr the input parameters for thc all-India projcctions. As noted
earlier, the 1981-91 population growth can not be computed Illr India as a whole but only
tor India excluding the stales f1'Assam alld Jammu alld Kashmir. It naturally lilllo\\Vs that
the projections should also be HiI' India exduding these two states and hence thc initial
age distributions, fertility. and mortality levels should also pertain to this portion. Accord-
ingly. the 198] age distribution has been obtained. The 1984 SRS survey covercd all India
except Mizoram and the NFHS all India except union territories. Sikkim, and a portion
of Jammu and Kashmir. If details on population age distribution by religion arc mailable.
it should be possible to make the necessary corrections and obtain the appropriatc Icrtility
schedules. However. the populations to be cxcluded t(mn a small portion of the total and
the 1Crtility levels for these do not uppear to be much different from the averagc. Trial
calculations showed that any adjustment would not change the TFR by more than .0:1 point.
Hence, the all-India estimates of fertility availuble from the] 984 SRS survey and the: NFHS
have been treated as referring to India excluding Assam and Jammu and Kashmir. A similar
assumption has been made IiII' the mortality parameters.

3 Pages 21-30

▲back to top


3.1 Page 21

▲back to top


It is possible, however, that the path of fertility decline differed
by religion. In particular, since there are reasons to believe that the
Muslim fertility decline is lagged, the pace of decline during 1984-
91 (i.e., between the date of the SRS survey and 1991) may not have
been linear as assumed above, but is more likely to have been slow
initially and rapid towards 1991. In that case, the average TFR for
1986-91 would have been higher than that given by the linearity
assumption. In order to allow for such a change, a slightly different
path, using a quadratic curve, has been used in Projection III for
Muslims. The implied TFRs for All Religions, Hindus, and Muslims
for Projections I and II and for Muslims in Projection III are given
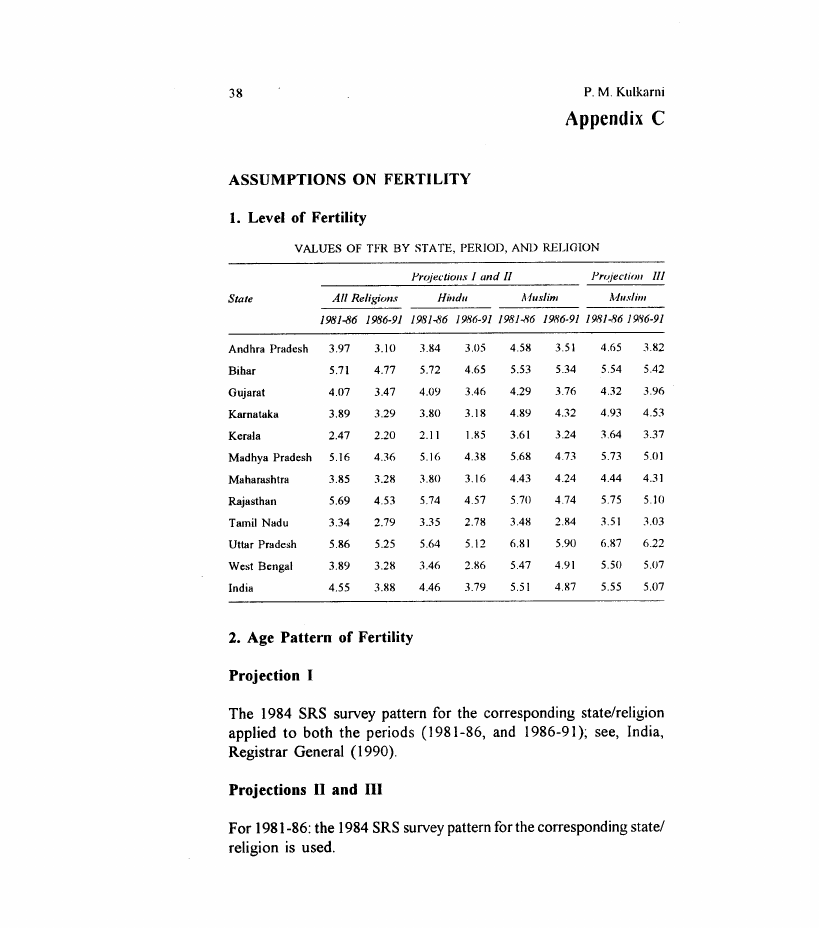
in Appendix C.
TABLE 8: ESTIMATES OF NATURAL INCREASE AND NET MIGRATION,
INDIA AND STATES, 1981-91, PROJECTION II
Total Intercellsal
Growlll (%)
Estimated Intercellsal growth Net Inlercensal
Natural
- natural increase A-figration
Increase (%)
(% points)
(in thousands)
Hindu Muslim Hindu Muslim Hindu Muslim Hindu Muslim
Andhra Pradesh 24.74
Bihar
Gujarat
22.72
21.12
Karnataka
20.66
Kerala
12.62
Madhya Pradesh 26.61
Maharashtra
25.29
Rajasthan
28.09
Tamil Nadu
15.15
Uttar Pradesh
23.11
West Bengal
21.09
30.66
29.50
24.05
25.71
25.49
3\\.21
31.40
41.46
21.14
36.54
36.89
20.59
26.27
23.72
21.04
14.53
26.12
22.18
27.53
16.09
24.53
19.87
27.90
27.65
25.2\\
28.24
27.03
32.87
4.15
-3.55
-2.60
-0.38
-1.91
0.49
2.76
1.85
-1.16
-2.53
-1.54
-1.66
30.87
2967
3.11 0.53
0.56 11.79
17.09 -0.94 4.05
31.91 -1.42 4.63
29.98 1.22 6.91
+1972
-2059
-793
-121
-283
+238
+1590
+171
--404
-1312
+512
+125
+183
-34
-105
-83
-42
1"31
'·294
+102
+818
i8\\\\
India (excluding Assam and Jammu and Kashmir)
22.78 32.76 22.86 30.04 -0.08 2.72
--438 +1951
The age pattern of fertility for both the religions is available from
the 1984 survey, but not from the NFHS. In the absence of model
fertility schedules for India, the 1984 SRS survey age pattern has
been applied to the TFRs of the corresponding religion group and
state for both the quinquennia in Projection I. However, since fertility

3.2 Page 22

▲back to top


has generally declined towards the later part of the decade, the age
pattern would also have changed (presumably, relatively greater
decline in later years 'of child bearing, and in the very early years).
To account for such a change, a slightly different age pattern has
been applied to the estimated TFR for the 1986-91 period in
Projections II and III. For this purpose, the 1984 fertility schedules
pertaining to the same religion for all the states were examined and
the age pattern of the state with the 1984 TFR closest to the TFR
(for 1986-91) for the reference state was chosen. The choice was
restricted only to the schedules of the reference religion since the
pattern is likely to differ by religion. In cases where such schedules
could not be identified (for example, there were no 1984 schedules
with TFR close to Kerala's 1986-91 TFRs) such a procedure could
not be followed and the 1984 pattern itself had to be adopted for
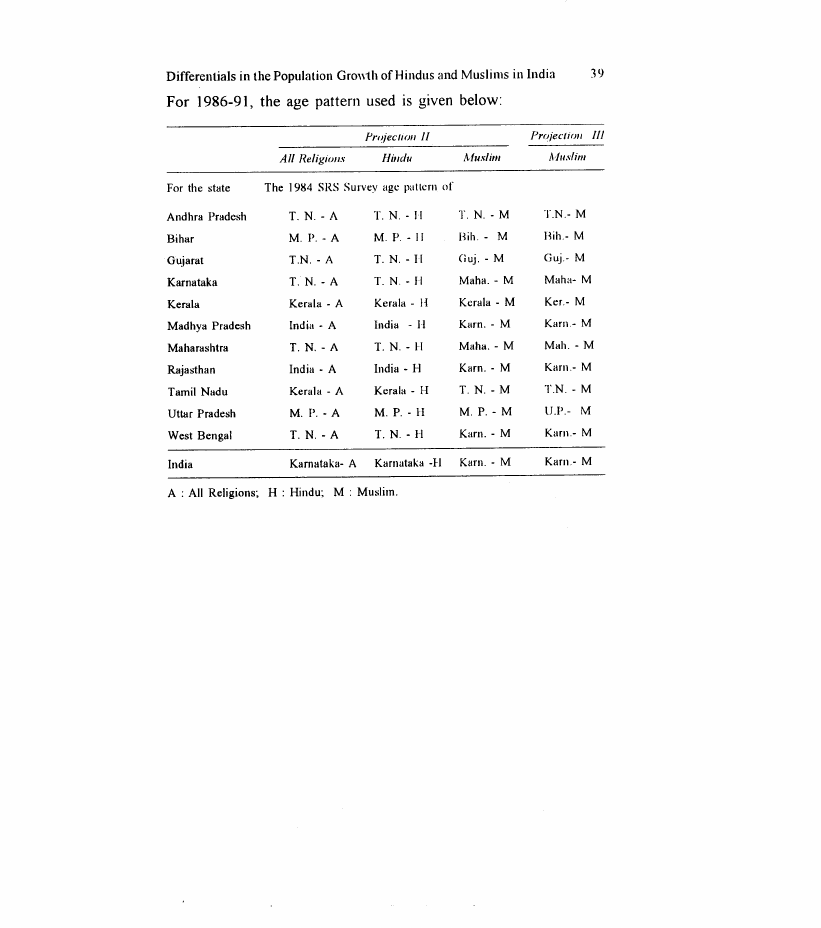
1986-91 as well. Information on the fertility patterns used in the
projections is given in Appendix C.
As noted in an earlier section, differentials by religion are available
only for child mortality and of the three sets (the 1979 survey, the
1981 census, and the NFHS) only the NFHS estimates relate to the
1980s. But the latter are based on a sample survey; Muslim
populations were generally small in most states and hence the
estimates are subject to large sampling errors. On the other hand,
the indirect estimates from the 1981 census refer to a period in the
mid-1970s. Yet, these are on the basis of the census, the populations
covered are large and hence expected to give a more accurate picture
of differentials. Since changes in mortality over the 1970s and 1980s
have been small, a reasonable assumption is that the d(flerenlials
have not changed much. Hence, the differentials in the 1981 census
indirect estimates were accepted and applied to the mortality levels
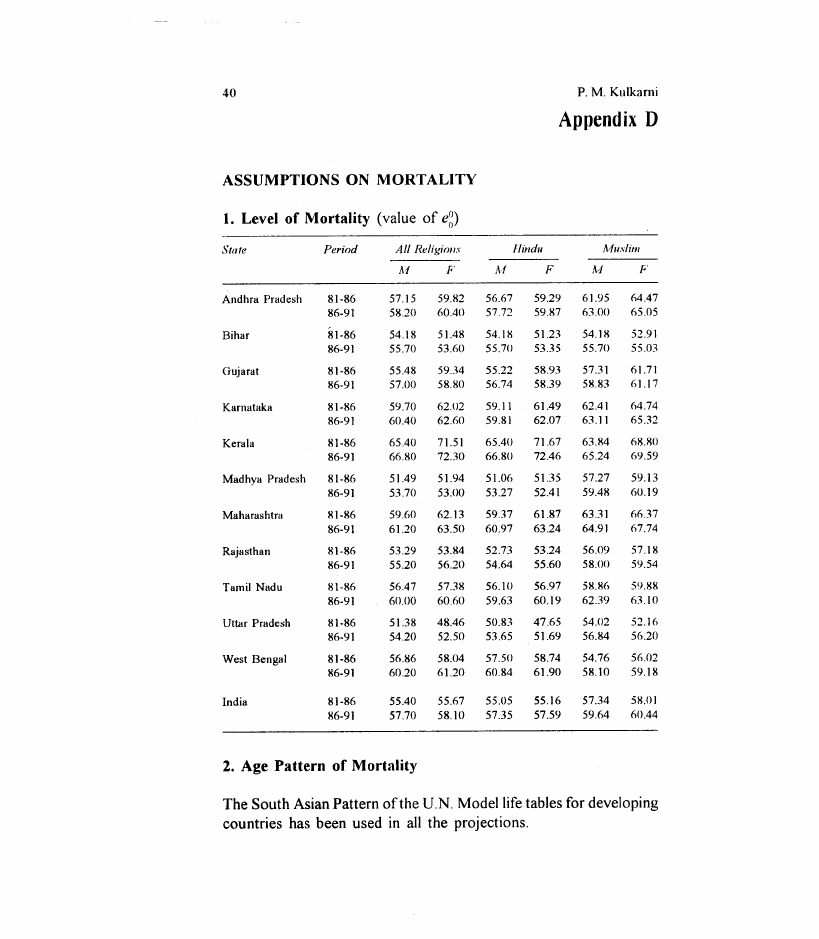
of the 1980s. First, the levels of life expectancy corresponding to
the q(5) estimates from the census were obtained for Hindus, Muslims,
and All Religions, by sex, in each state, via the South Asian Pattern
(SAP) of the U.N. model life tables for developing countries (U.N.,
1982). The male and female life expectancies for the two intercensal
quinquennia, 1981-86 and 1986-91, were taken from the SRS life
tables for these periods (India, 1989; 1994) and the Hindu and Muslim

3.3 Page 23

▲back to top


life expectancies for the two quinquennia estimated by maintaining
the differences implied by the 1981 census estimates for each state
and sex'. Details on the levels assumed are given in Appendix D.
The SAP of the U.N. model life tables has been used in the projections.
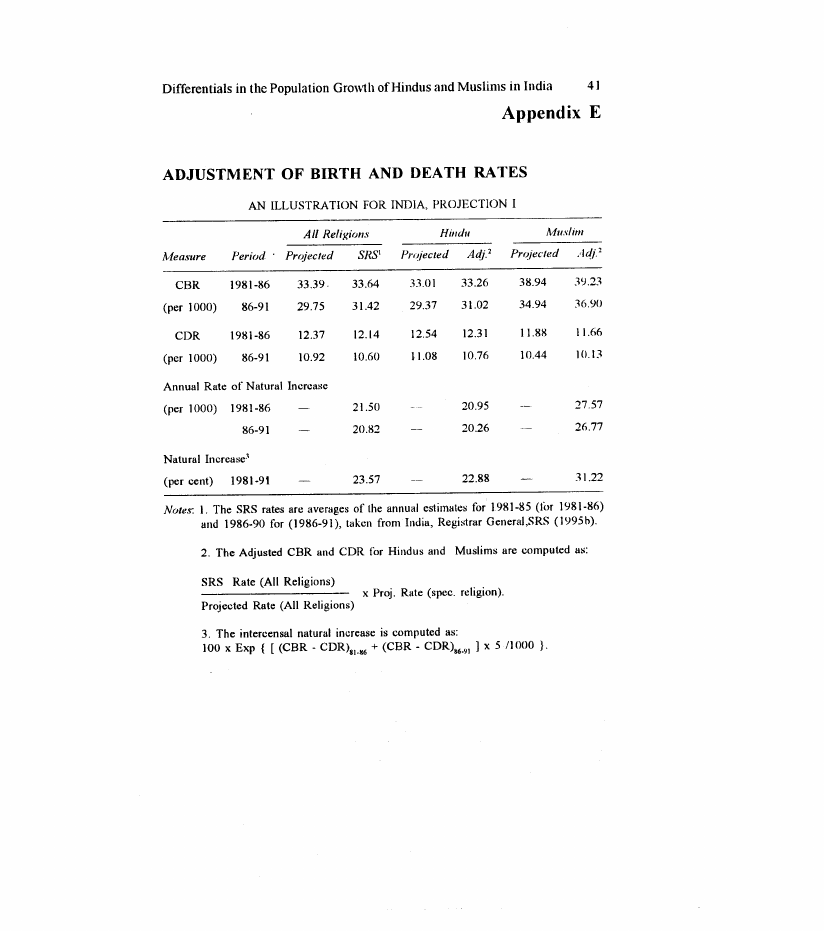
The projection package gives information on the birth and death rates,
the age distributions and so on. The crude birth and death rates
obtained from the projections for All Religions were compared to
the average of the SRS annual estimates for the quinquennia. In the
case of the crude death rate (COR), the correspondence was quite
good; in most cases the difference was less than one point. But the
projected values of the CBR were lower than the SRS averages by
1-2 points in one of the quinquennia for many states. Since the SRS
annual estimates of CBR and COR are known to be fairly reliable
at least during the 1980s, it appears that the fertility level assumed
in some of the projections is on the lower side. This has happened
because either the 1984 SRS surveyor the NFHS has given
underestimates. Hence, the projected CBRs for each state were
adjusted to bring these in line with the SRS estimates for the
corresponding quinquennia, and the same multiplier then applied to
both the religions. Thus, the levels are brought at the SRS averages
for the quinquennia, yet the differentials in the CBR given by the
projections are maintained proportionately. A similar adjustment has
been applied to the projected CDRs. The rate of natural increase has
then been computed for each of the two intercensal quinquennia and
the per cent natural increase for the period 1981-91 obtained. An
illustration is given in Appendix E.
3. The procedure adopted to compute the levels of mortality (life expectancy) li:lr tll<:two
intereensal quinquennia is described below. Let.
ELi
ELo
ELo(k)
Expectation of lile at birth for religion i corresponding to the '1(5) valuc li:lr
the religion given by the 1981 census indirect estimate.
Expectation of lile at birth lilr All Religions corresponding to the '1(5) valuc
tilr All Religions given by the 19XI census indirect estimate.
Expectation of lile at birth during period k tjn All Religions given b~' thc
SRS lite tables.
Then.
EL,(k)
where k
Expectation of lifu at birth during period k Ijlr religion i
ELo(k) + [ELi - ELoJ.
1 tor 1981-86 and 2 tilr 1986-91.

3.4 Page 24

▲back to top


Differentials in the Population Growth of Hindus and Muslims in India
17
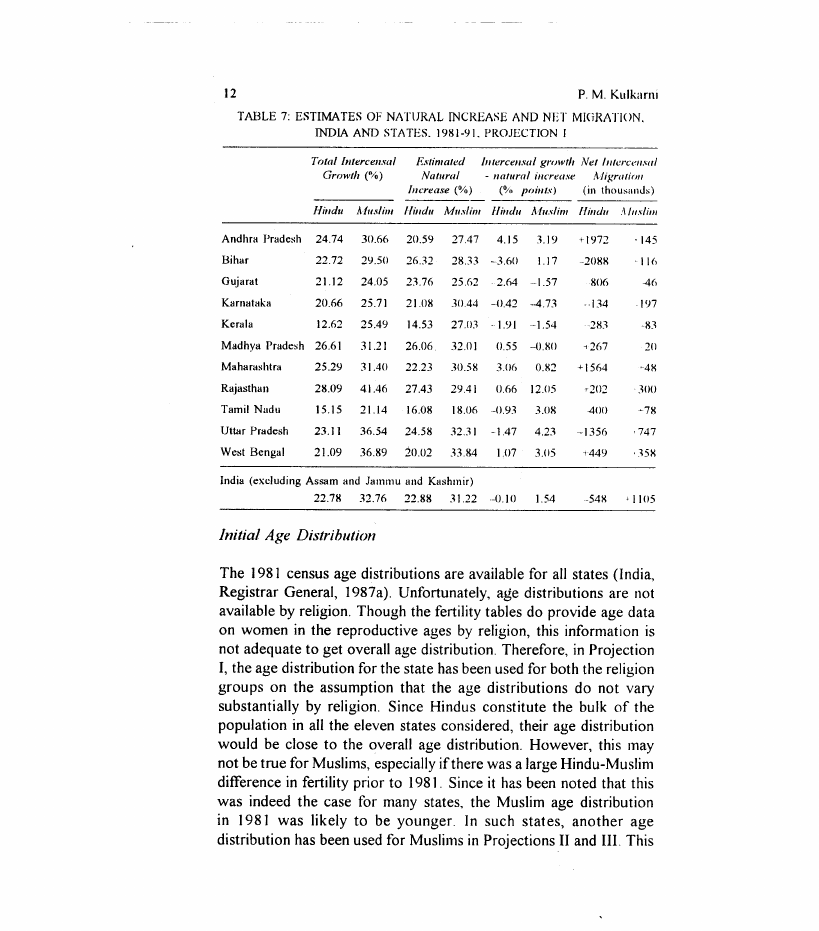
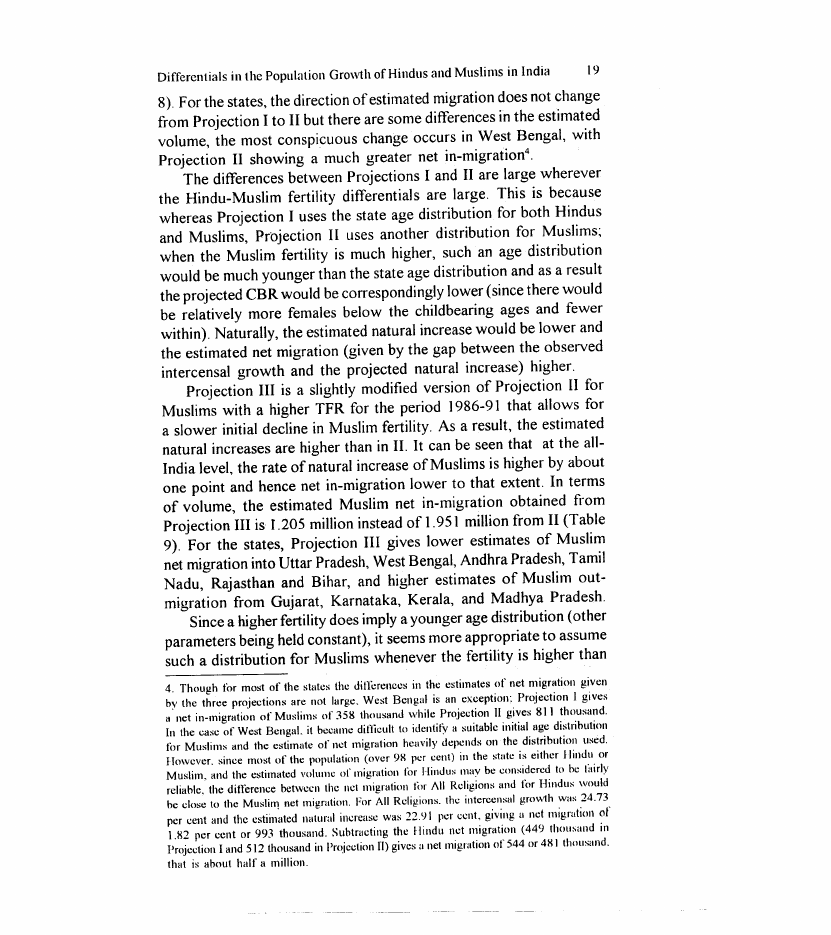
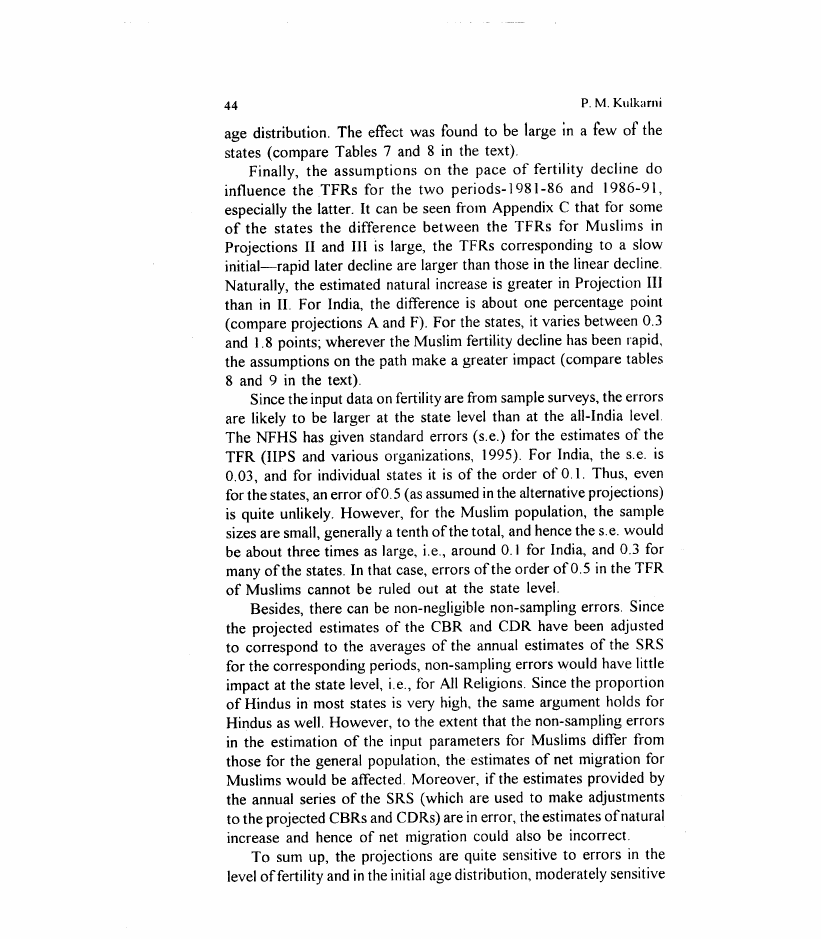
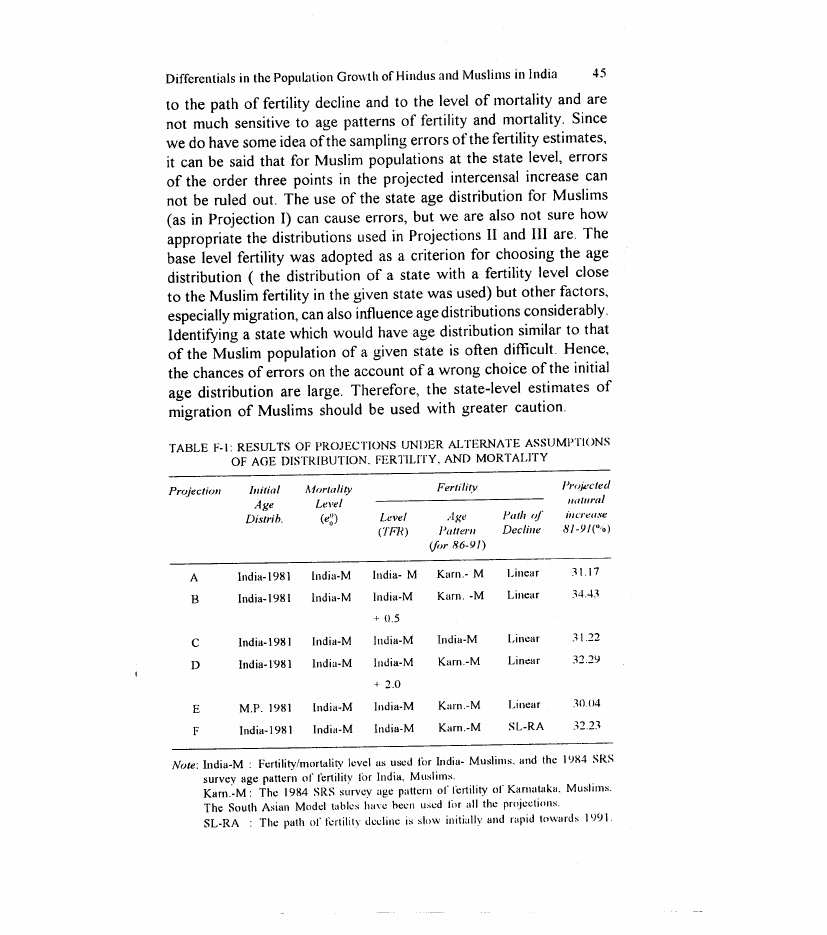
Thus, three sets of projections have been carried out. The principal
differences are: Projection I uses the 1981 state age distributions for
both the religions whereas Projections II and III use another
(presumably more appropriate) initial age distribution for Muslims
in some of the states. Similarly, the age pattern of fertility for the
period 1986-91 differs among the projections - Projection I uses the
1984 SRS survey age pattern of the corresponding religion/state while
Projections II and III use another pattern for some of the states. Finally,
Projections I and II assume a linear path of fertility change after the
1984 survey for All Religions, Hindus, and Muslims but Projection
III uses a slightly different path for Muslims. The mortality
assumptions are ·identical in the three sets of projections.
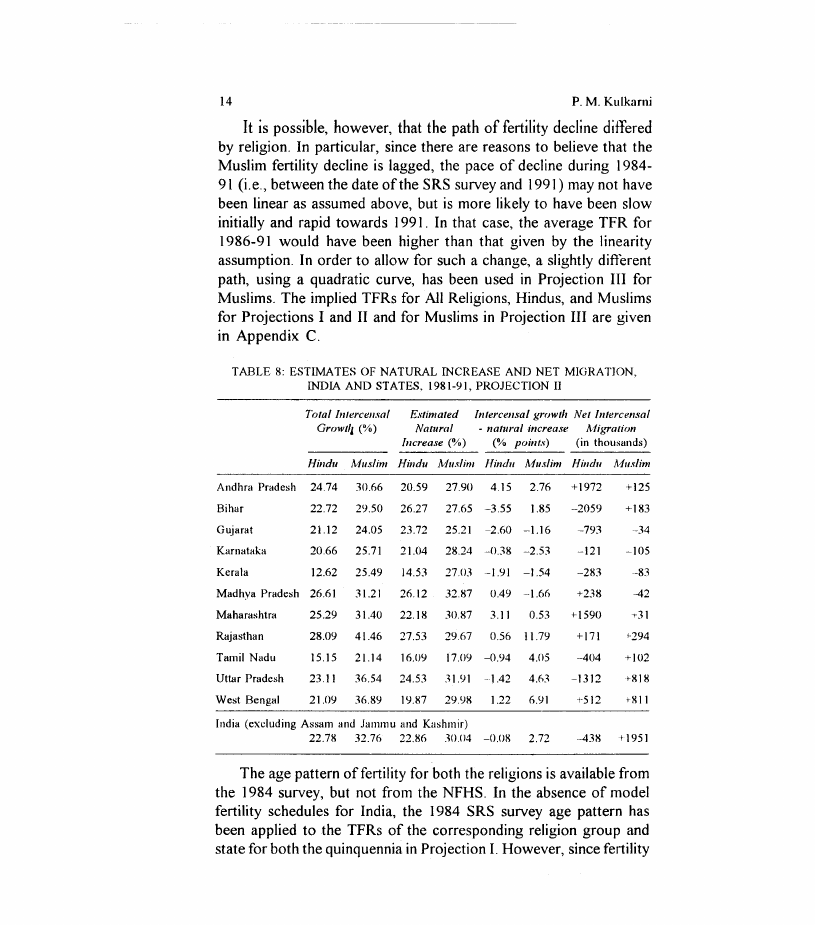
The summary results of Projections I, II, and III are presented in
Tables 7, 8, and 9 respectively. The natural increase during the
intercensal period, 1981-91, implied by the projections for each of
the eleven states considered and for India (excluding Assam and
Jammu and Kashmir) is presented for Hindus and Muslims. This
is expressed as percentage of the corresponding 1981 population.
The actual intercensal growth is also shown in the tables. On the
assumption that there was no d~fferenlial underenumeralion and no
change in religion, the difference between the actual and the natural
increase provides an estimate of net intercensal migration (as per
cent of the 1981 population) for the religion/state. The estimated
volume of net migration is also presented in the tables.
According to Projection I, there is a very close correspondence
between the observed and projected intercensal growth for Hindus
at the all-India level, indicating negligible net migration; the estimated
volume ( about half a million) is low in relation to the Hindu
population. But for most of the states, moderate to large differences
are seen between the actual and projected increases. There appears
to have been heavy migration of Hindus into Andhra Pradesh and
Maharashtra and moderate into West Bengal, Madhya Pradesh and
Rajasthan during 1981-91. On the other hand, heavy out-migration
of Hindus appears to have been taken place from Bihar, Uttar Pradesh
and Gujarat, moderate from Tamil Nadu and Kerala and small from
Karnataka.

3.5 Page 25

▲back to top


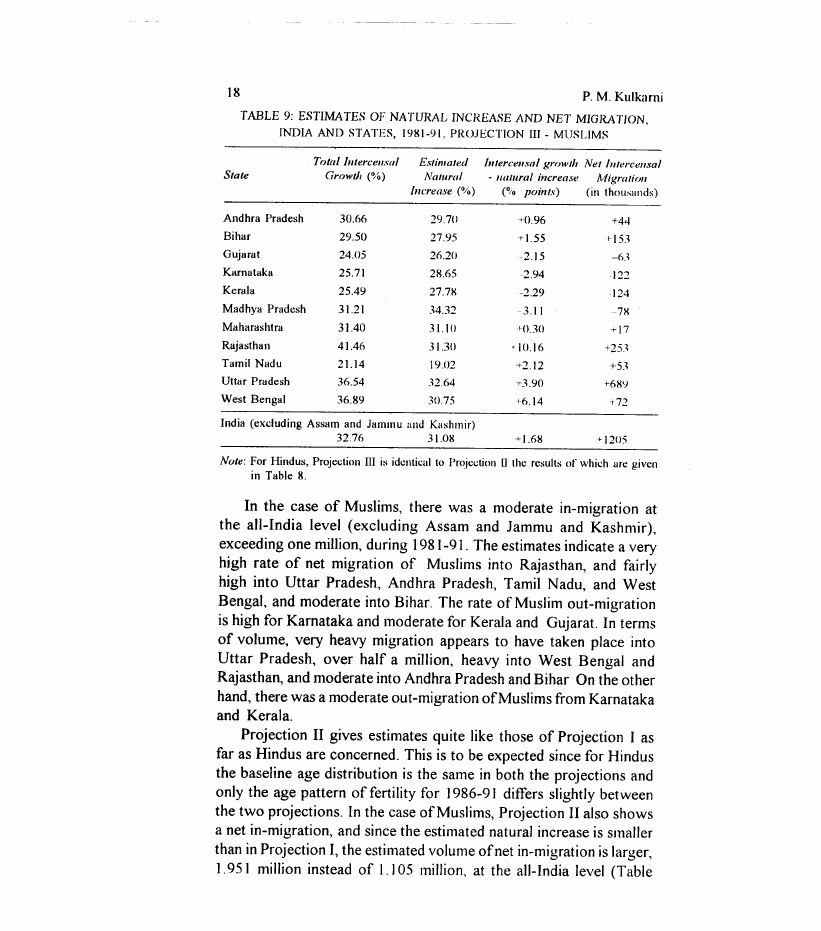
TABLE 9: ESTIMATES OF NATURAL INCJ<EASE AND NET MIGRATION,
INDIA AND STATES, \\98\\-91. PROJECTION III - MUSLIMS
State
Total II/tercel/sal
Growth (%)
Estimated II/tercel/sal growth Net Intercel/sal
Natllral
- I/alllral increase IYfigratirJ/l
II/crease (%)
(°;0 points)
(in thousands)
Andhra Pradesh
Bihar
Gujarat
Karnataka
Kcrala
Madhya Pradcsh
Maharashtra
Rajasthan
Tamil Nadu
Uttar Pradesh
West Bengal
30.66
29.50
24.05
25.7\\
25.49
3\\.2\\
31.40
41.46
21.\\4
36.54
36.89
29.70
27.95
26.20
28.65
27.78
34.32
31.l0
31.30
\\9.02
32.64
30.75
+0.96
+ 1.55
-2.\\5
2.94
-2.29
3.1\\
cO.30
" 10.16
+2.\\2
+3.90
+6.\\4
+44
,153
-63
122
\\24
-78
+17
+-253
+53
+68')
+72
India (excluding Assam and Jammu and Kashmir)
32.76
31.08
+ 1.68
Q20S
Note: For Hindus, Projcction m is idcntical to I'rojcl:tion [I thc rcsults of which arc givcn
in Table 8.
In the case of Muslims, there was a moderate in-migration at
the all-India level (excluding Assam and Jammu and Kashmir),
exceeding one million, during 1981-91. The estimates indicate a very
high rate of net migration of Muslims into Rajasthan, and fairly
high into Uttar Pradesh, Andhra Pradesh, Tamil Nadu, and West
Bengal, and moderate into Bihar. The rate of Muslim out-migration
is high for Karnataka and moderate for Kerala and Gujarat. In terms
of volume, very heavy migration appears to have taken place into
Uttar Pradesh, over half a million, heavy into West Bengal and
Rajasthan, and moderate into Andhra Pradesh and Bihar On the other
hand, there was a moderate out-migration of Muslims from Karnataka
and Kerala.
Projection II gives estimates quite like those of Projection I as
far as Hindus are concerned. This is to be expected since for Hindus
the baseline age distribution is the same in both the projections and
only the age pattern of fertility for 1986-91 differs slightly between
the two projections. In the case of Muslims, Projection II also shows
a net in-migration, and since the estimated natural increase is smaller
than in Projection I, the estimated volume of net in-migration is larger,
1.951 million instead of 1.105 million, at the all-India level (Table

3.6 Page 26

▲back to top


Differentials in the Population Growth of Hindus and Muslims in India
19
8). For the states, the direction of estimated migration does not change
from Projection I to II but there are some differences in the estimated
volume, the most conspicuous change occurs in West Bengal, with
Projection II showing a much greater net in-migration4.
The differences between Projections I and II are large wherever
the Hindu-Muslim fertility differentials are large. This is because
whereas Projection I uses the state age distribution for both Hindus
and Muslims, Projection II uses another distribution for Muslims;
when the Muslim fertility is much higher, such an age distribution
would be much younger than the state age distribution and as a result
the projected CBR would be correspondingly lower (since there would
be relatively more females below the childbearing ages and fewer
within). Naturally, the estimated natural increase would be lower and
the estimated net migration (given by the gap between the observed
intercensal growth and the projected natural increase) higher.
Projection III is a slightly modified version of Projection II for
Muslims with a higher TFR for the period 1986-91 that allows for
a slower initial decline in Muslim fertility. As a result, the estimated
natural increases are higher than in II. It can be seen that at the all-
India level, the rate of natural increase of Muslims is higher by about
one point and hence net in-migration lower to that extent. In terms
of volume, the estimated Muslim net in-migration obtained from
Projection III is 1.205 million instead of 1.951 million from II (Table
9). For the states, Projection III gives lower estimates of Muslim
net migration into Uttar Pradesh, West Bengal, Andhra Pradesh, Tamil
Nadu, Rajasthan and Bihar, and higher estimates of Muslim out-
migration from Gujarat, Karnataka, Kerala, and Madhya Pradesh.
Since a higher fertility does imply a younger age distribution (other
parameters being held constant), it seems more appropriate to assume
such a distribution for Muslims whenever the fertility is higher than
4. Though tor most of the states the dillcrenees in the estimates of net migration given
by the three projections are not large. West Bengal is an exception: Projection 1 gives
a net in-migration of Muslims of 35H thousand while Projection II gives H11 thousand.
In the case of West Bengal. it became ditlieult to identity a suitable initial lIge distribution
tilr Muslims lInd the estimate of net migration heavily depends on the distribution used.
However. since most of the population (over 9X pL'r L'ent) in the state is either Hindu or
Muslim, and the estimated volume of migration fi,r Hindus may be considered to be lilirly
reliable. the ditference betweL'n the net migration till" All Religions and ti,r Hindus would
be close to the MuslilT! net migration. For All Religions. the intercensal growth was 24.73
per cent and the estiilllited natural increase was 22.91 per cent, giving a nclmigmtjol\\ of
1.82 per cent or 993 thousand. Subtracting the Hindu nct migration (449 thousand in
Projection 1 and 512 thousand in Projection II) gives a net migration of 544 or 4X I thousand.
that is about half a million.

3.7 Page 27

▲back to top


average. Hence, Projections II and III appear more plausible than
Projection I. Further, since the fertility decline among Muslims is
likely to have been slower initially, the path of dedine may be closer
to that modelled in Projection III than in II. However, since the results
in the three projections are fairly similar, at least with respect to the
direction of net migration and the order of magnitude of the volume,
one can get a fairly clear picture by looking at these projections
collectively.
First, the estimates show that there has been some net out-
migration of Hindus (about half a million) and in-migration of
Muslims (one to two million) between 1981 and 1991 in India
(excluding Assam and Jammu and Kashmir). It may be noted that
not all of this would be international migration, since the net migration
of Muslims includes migration from Assam and Jammu and Kashmir
into the rest of India in addition to immigration to India (including
return migration). In terms of volume, migration of Hindus appears
to have been heavy into Maharashtra and Andhra Pradesh and out
of Bihar, Uttar Pradesh, and Gujarat. In the case of Muslims, migration
into Uttar Pradesh and West Bengal appears to have been quite heavy.
The estimated net migration rate is extremely high for Rajasthan,
but the volume of migration is not as much as in the case of Uttar
Pradesh and West Bengal, since the base ( 1981) Muslim population
in the state was small. For most of the other states, the Muslim net
migration (into Bihar, Andhra Pradesh and Tamil Nadu and out of
Karnataka and Kerala) could be labelled as moderate to small, of
the order of a hundred thousand, and for Gujarat, Maharashtra and
Madhya Pradesh, even smaller.
In over half the states, both the Hindu and Muslim net migration
flows are in an identical direction, in-migration to Andhra Pradesh,
Rajasthan, West Bengal and out-migration from Gujarat, Karnataka,
and Kerala. On the other hand, there has been large out-migration
of Hindus from Bihar, Uttar Pradesh and Tamil Nadu but in-migration
of Muslims. Finally, Madhya Pradesh and Maharashtra have
experienced large in-migration of Hindus but very small net migration
of Muslims.
That the growth of the Muslim population has been much higher
than that of the Hindu population is irrefutable. We are now in a

3.8 Page 28

▲back to top


Differentials in the Population Growth of Hindus and Muslims in India
21
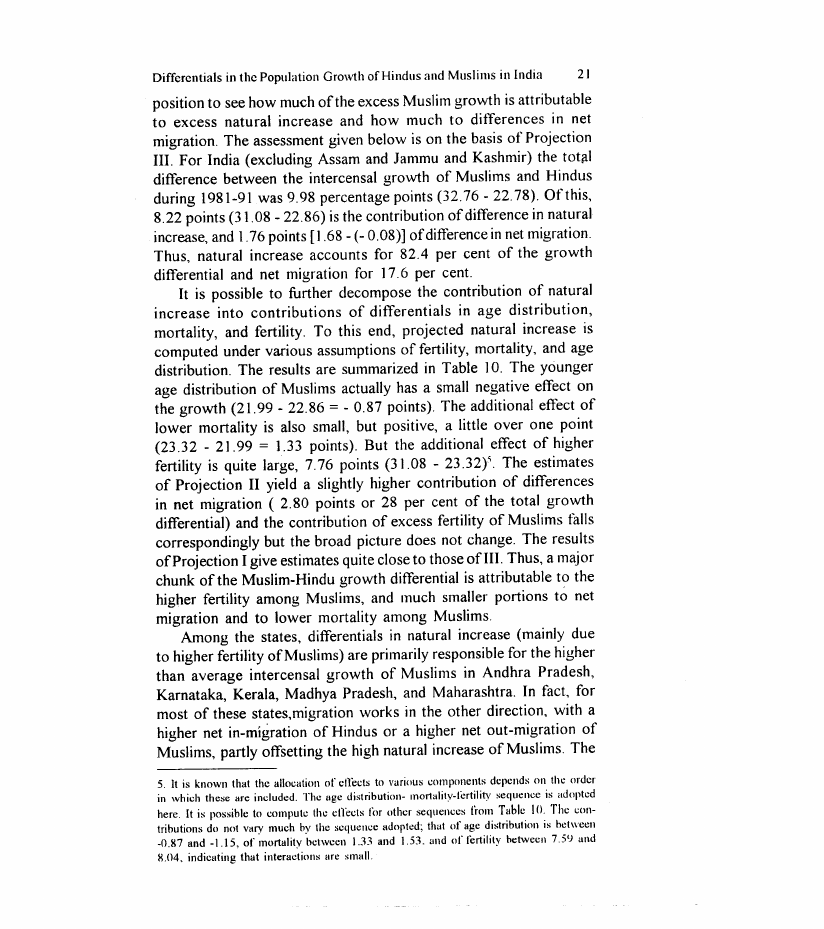
position to see how much of the excess Muslim growth is attributable
to excess natural increase and how much to differences in net
migration. The assessment given below is on the basis of Projection
III. For India (excluding Assam and Jammu and Kashmir) the total
difference between the intercensal growth of Muslims and Hindus
during 1981-91 was 9.98 percentage points (32.76 - 22.78). Of this,
8.22 points (31.08 - 22.86) is the contribution of difference in natural
increase, and 1.76 points [1.68 - (- 0.08)] of difference in net migration.
Thus, natural increase accounts for 82.4 per cent of the growth
differential and net migration for 17.6 per cent.
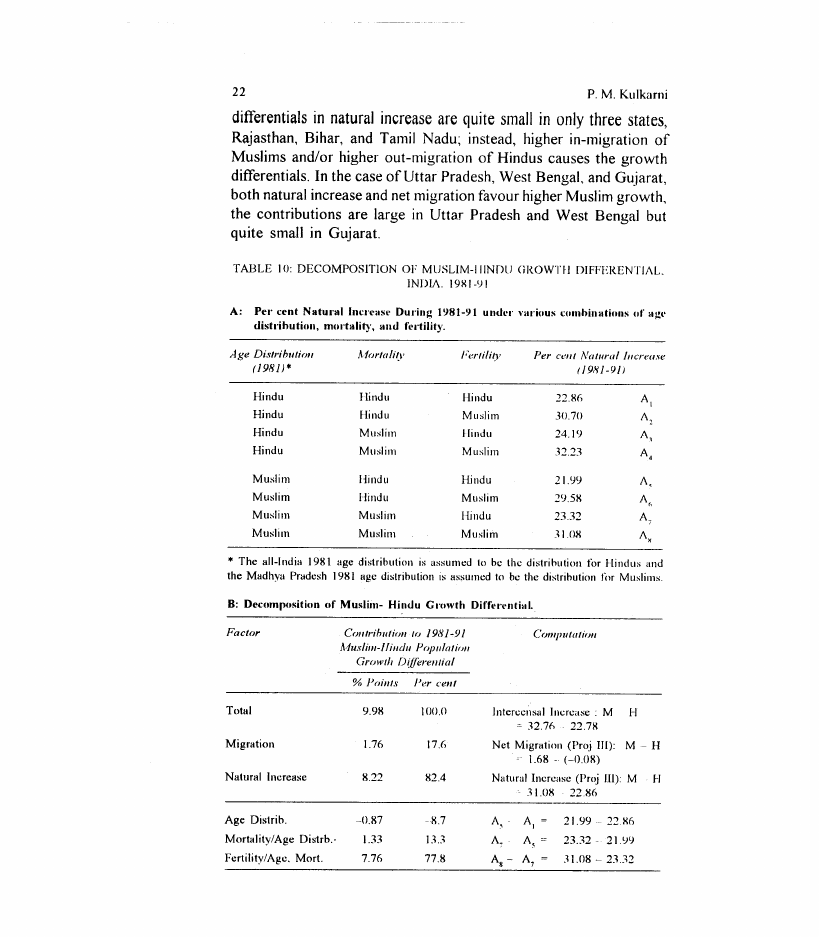
It is possible to further decompose the contribution of natural
increase into contributions of differentials in age distribution,
mortality, and fertility. To this end, projected natural increase is
computed under various assumptions of fertility, mortality, and age
distribution. The results are summarized in Table 10. The younger
age distribution of Muslims actually has a small negative effect on
the growth (21.99 - 22.86 = - 0.87 points). The additional effect of
lower mortality is also small, but positive, a little over one point
(23.32 - 21.99 = 1.33 points). But the additional effect of higher
fertility is quite large, 7.76 points (31.08 - 23.32)5. The estimates
of Projection II yield a slightly higher contribution of differences
in net migration ( 2.80 points or 28 per cent of the total growth
differential) and the contribution of excess fertility of Muslims falls
correspondingly but the broad picture does not change. The results
of Projection I give estimates quite close to those ofIlI. Thus, a major
chunk of the Muslim-Hindu growth differential is attributable to the
higher fertility among Muslims, and much smaller portions to net
migration and to lower mortality among Muslims.
Among the states, differentials in natural increase (mainly due
to higher fertility of Muslims) are primarily responsible for the higher
than average intercensal growth of Muslims in Andhra Pradesh,
Karnataka, Kerala, Madhya Pradesh, and Maharashtra. In fact, for
most of these states, migration works in the other direction, with a
higher net in-migration of Hindus or a higher net out-migration of
Muslims, partly offsetting the high natural increase of Muslims. The
5. It is known that the allocation of elfects to various components depcnds on the order
in which these arc included. The age distribution- mortality-ti:rtility sequence is adopted
here. It is possible to compute the effects till' other sequences {rOIll Table 10. The wn-
tributions do not vary mueh by the sequence adopted; that of age distribution is bcl\\\\"een
-0.87 and -1.15, of mortality between 1.33 and 1.53. and of lertility betwecn 7.5') and
8.04, indicating that interactions arc small.

3.9 Page 29

▲back to top


differentials in natural increase are quite small in only three states,
Rajasthan, Bihar, and Tamil Nadu; instead, higher in-migration of
Muslims and/or higher out-migration of Hindus causes the growth
differentials. In the case of Uttar Pradesh, West Bengal, and Gujarat,
both natural increase and net migration favour higher Muslim growth,
the contributions are large in Uttar Pradesh and West Bengal but
quite small in Gujarat.
TABLE 10: DECOMPOSITION
OF MLJSLIM-IIINDLJ
INDIA. 19Xl-lJ I
OROWTII
DIFFERENTIAL.
A: Pel' cent Natul'al InCl'ellse Dul'ing 1'.181-'.1 1 undel' val'ious comhinations of agl'
distl'ihution, mortality, and fel·tility,
Age Distrihutioll
(19811*
!.,fortali~1'
Fertility
Per cellt Na/1lral Illcrea.,'e
119i'1l-91J
Hindu
Hindu
Hindu
Hindu
Hindu
Hindu
Muslim
Muslim
Hindu
Muslim
Hindu
Muslim
22,X(,
AI
30.70
A
2
24.19
A,
3223
A.
Muslim
Muslim
Muslim
Muslim
Hindu
Hindu
Muslim
Muslim
Hindu
Muslim
Hindu
Muslim
21.lJ9
A,
29.5X
A"
2332
A,
31.0S
A,
* The all-India 1981 age distribution is assumed to be the distribution for Hindus and
the Madhya Pradesh 1981 agc distribution is assumed to be the distribution for Muslims.
COlltrihulioll to 1981-91
A1uslilll-1lilldu Populatioll
Growtli Differelliial
Total
Migration
Natural Increase
9.98
1.76
8.22
Age Distrib.
Mortality/Age
Fertility/Age.
Distrb.·
Mort.
-0.87
1.33
7.76
100.0
17.(,
82.4
-X.7
I.U
77.8
Intereensal Increasc : M I-I
= 32.7(, 22.78
Net Migration (Proj III): M-H
1.68- (-0.08)
Natural Increase (Proj III): M H
31.0X 228(,
A-~
A_ -
Ag-
AI =
A~ =
A7 =
21.99 22.86
23.32 21.lJ9
3 \\.08 - 23.32

3.10 Page 30

▲back to top


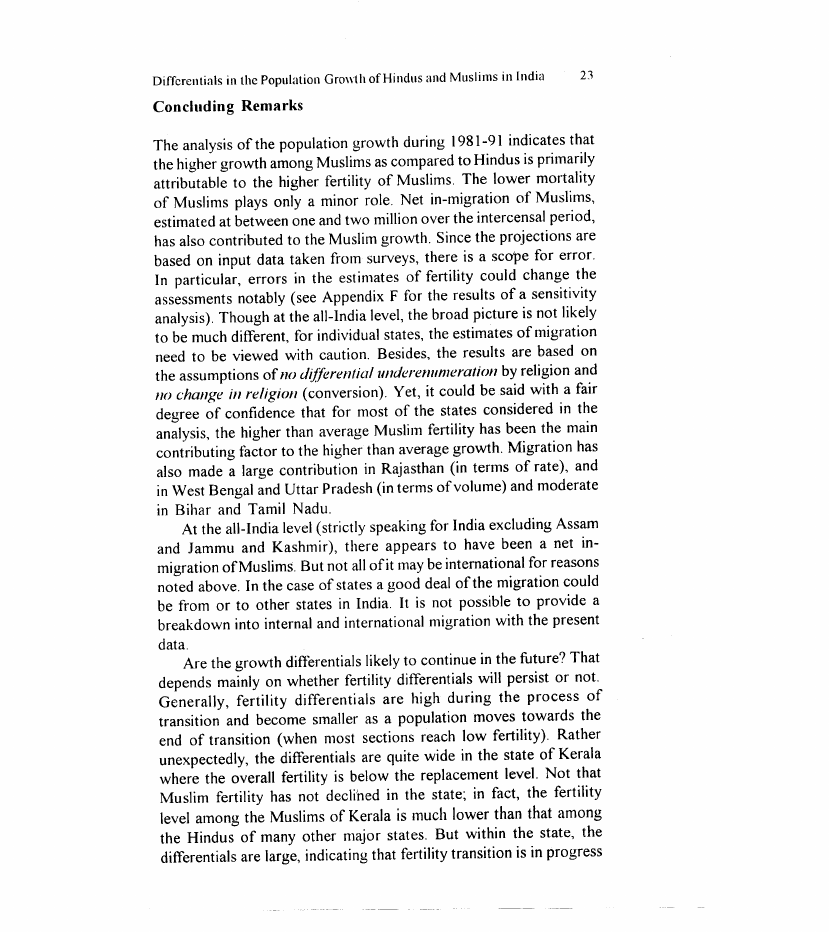
The analysis of the population growth during 1981-91 indicates that
the higher growth among Muslims as compared to Hindus is primarily
attributable to the higher fertility of Muslims. The lower mortality
of Muslims plays only a minor role. Net in-migration of Muslims,
estimated at between one and two million over the intercensal period,
has also contributed to the Muslim growth. Since the projections are
based on input data taken from surveys, there is a scope for error.
In particular, errors in the estimates of fertility could change the
assessments notably (see Appendix F for the results of a sensitivity
analysis). Though at the all-India level, the broad picture is not likely
to be much different, for individual states, the estimates of migration
need to be viewed with caution. Besides, the results are based on
the assumptions of no d~fferential underenumeration by religion and
no change in religion (conversion). Yet, it could be said with a fair
degree of confidence that for most of the states considered in the
analysis, the higher than average Muslim fertility has been the main
contributing factor to the higher than average growth. Migration has
also made a large contribution in Rajasthan (in terms of rate), and
in West Bengal and Uttar Pradesh (in terms of volume) and moderate
in Bihar and Tamil Nadu.
At the all-India level (strictly speaking for India excluding Assam
and Jammu and Kashmir), there appears to have been a net in-
migration of Muslims. But not all of it may be international for reasons
noted above. In the case of states a good deal of the migration could
be from or to other states in India. It is not possible to provide a
breakdown into internal and international migration with the present
data.
Are the growth differentials likely to continue in the future? That
depends mainly on whether fertility differentials will persist or not.
Generally, fertility differentials are high during the process of
transition and become smaller as a population moves towards the
end of transition (when most sections reach low fertility). Rather
unexpectedly, the differentials are quite wide in the state of Kerala
where the overall fertility is below the replacement level. Not that
Muslim fertility has not declined in the state; in fact, the fertility
level among the Muslims of Kerala is much lower than that among
the Hindus of many other major states. But within the state, the
differentials are large, indicating that fertility transition is in progress

4 Pages 31-40

▲back to top


4.1 Page 31

▲back to top


among the Muslims as well but with a lag. An investigation into
the causes of higher fertility among Muslims could help provide a
forecast of fertility differentials in the foreseeable future. Though
the present paper has not addressed this issue, it does appear that,
over time, the gap between the fertility of Hindus and Muslims is
likely to narrow down or close and then the growth differential would
also become small or negligible. But even if the 1981-91 Muslim-
Hindu growth differential, the highest recorded for any intercensal
decade, persists, it would take about 250 years for the Muslim
population to catch up with the Hindu population numerically
This paper was prepared at the suggestion of Dr. K. Srinivasan,
Executive Director, Population Foundation of India, New Delhi.
Discussions with Dr. K. S. Natarajan of the Population Foundation
and with Dr. N. Audinarayana, Dr. S. Gunasekaran, and Dr. A.c.
Muthiah have been quite helpful. Detailed comments on an earlier
draft by Dr. Srinivasan and Dr. S. Krishnamoorthy have been very
valuable. Technical assistance was provided by Mr. Manoj
A1agarajan.
References
Halasubramanian, K. (1984). Hindu-Muslim ditlerentials in lertility and population growth
in India: Role of proximate variables. Ari/ul Viinalla. 26(3): 189-216.
Bhatia. P. S. (1990). Population growth of various l:ommunities in India--··Myth and n:alit\\".
Demography India, 1'.1(1): 121-130.
Bose. Ashish (1995). 1991 Census data Muslim Rate ofGrowth./lldiall Expres.\\'.Sepll:lIlber
9, 1995.
India. Registrar General (1972). Cemus tiflndia 1971. Series I. Paper-2 t~f1972. UeligilJll.
Delhi: Manager of Publil:ations.
India. Registrar General (1981). Survey OIllnfalllalld Child lI!orlaIiIV. 1979. Deihl: Vital
Statistics Division. MiNistry of Ilol1lc Artilirs.
India. Registrar General (1982). Leve/s. Trend~ alld Dijlerelliials in Fer1i/i~v.1979. Delhi:
Vital Statistics Division, Ministry of HOllie Artilirs.
India. Registrar General (19ll4). Censas t~{llIdia 1981. Series-i. I'aper--I. !louse/wid
Populalion by Religioll 0/ Head of Household. Delhi: Controller of Publications.
India, Registrar Genera.! (19ll7a). Census of India. 1981. Series 1. illdia. Pari II' ,·1.StJcial
and Cullural Tables. Delhi: Controller of Publications.
India. Registrar General (I 987b). Census o/Illdia 1981. ()cmsionall'apers. variou-, -,Iales,
Ferlility and Child IIforlalily ESlimales. New Delhi: Demograph~' Division
Ministry of Home Allairs.
India, Registrar General (l9ll8). Cellsus o/Illdia 19,111(.)cCtlsional Paper No. 13 o{1988.
Ferliliry in India, An Ana~vsi-, of i981 Census Dala. New Delhi: Demography
Division, Ministry of Ilomc Affairs.

4.2 Page 32

▲back to top


Differentials in the Population Growth of Hindus and Muslims in India
25
India, Registrar General (1989). SRS Based Ahridged Life Tables. 1981-85. Occasional
Paper No. I of 1989. New Delhi: Vital Statistics Division, Ministry of Home Atlilirs.
India, Registrar General (1990). Fertility DifJerential\\' in India, 1984. New Delhi: Vital
Statistics Division, Ministry of Home Affairs, New Delhi.
India, Registrar General (1994). SRS Based Ahridged Life Tables, 1986-90. Occasional
Paper No. 1 of 1994. Ncw Delhi: Vital SUltistics Division, Ministry of Home Atlilirs.
India, Registrar General (1995a). Cel/slls ofll/dia 1991, Series I, Paper 1 of1995. Religion.
Delhi: Controller of Publications.
India, Registrar General (1995b). Sample Registration BIIlletin, 29(2).
International Institute fix Population Sciences (ill'S) (1995). National Fllmi~v Health SlIrvey,
India, 1992-93. Bombay: lIPS.
International Institute for Population Sciences (lIPS). and Various Organizations (1995).
National Family Health SIIn1ey, variolls states. Bombay: IIPS.
Sharitl: Abusaleh (1995). Socio-Econoll1ic and demographic ditlerentials between Hindus
and Muslims. Economic a/ld Political Week~v, XXX: 2947-53.
United Nations (U.N.) (1982). Model Life Tables for Developing COlintries, Population
Studies No. 77, Ncw York: Department ofInternational Economic and Social Atlilirs,
United Nations.
United Nations (U.N.) (1983). Ma/lllal X: I/ldirect TeclmiquesfrJr Demographic Estimation,
Population Studies, No. 81, New York: Department ofInternational Economic and
Social Affairs, United Nations.
Visaria, Leela (1974). Religious Differentials in Fertility. In: Asish Bose et al. (cds.),
Population in India's Development, 1947-20{)(). Delhi: Vikas Publishing House.

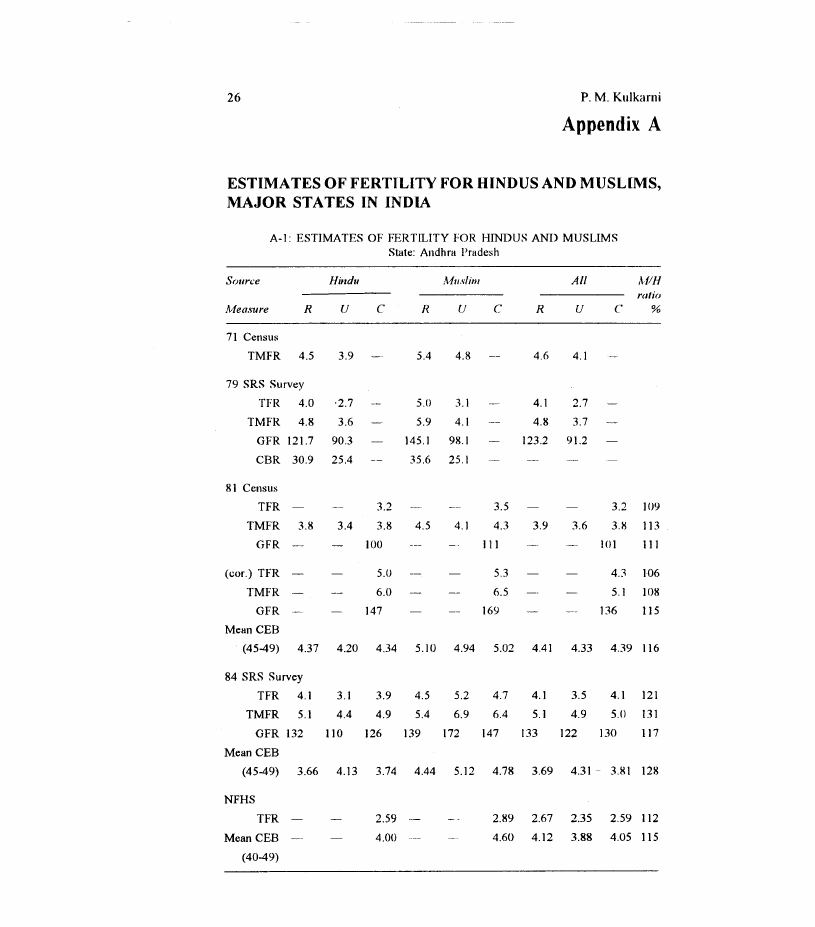
4.3 Page 33

▲back to top


Appendix A
ESTIMA TES OF FERTILITY FOR HINDUS AND MUSLlMS,
MAJOR STATES IN INDIA
A-I: ESTIMATES OF FERTILITY FOR HINDUS AND MUSLIMS
State: Andhra Pradesh
Sourc'e
Jvfeasure
Hindu
R
UC
A1uslim
R
UC
All
M/H
ratio
R
U
C
%
71 Census
TMFR 4.5 3.9
5.4 4.8
4.6 4.1
79 SRS Survey
TFR 4.0 '2.7
TMFR 4.8 3.6
GFR 121.7 90.3
CBR 30.9 25.4
5.D 3.1
5.9 4.1
145.1 98.1
35.6 25.1
4.1 2.7
4.8 3.7
123.2 91.2
81 Census
TFR
3.2
3.5
3.2 lO9
TMFR 3.8 3.4 3.8 4.5 4.1 4.3 3.9 3.6 3.11 113
GFR
100
111
lOl
111
(cor.) TFR
5.0
5.3
4.3 106
TMFR
6.0
6.5
5.1 lOll
GFR
147
169
136 115
Mean CEB
(45-49) 4.37 4.20 4.34 5.10 4.94 5.02 4.41 4.33 4.39 116
84 SRS Survey
TFR 4.1 3.1 3.9 4.5 5.2 4.7 4.1 3.5 4.1 121
TMFR 5.1
4.4
4.9
5.4
6.9
6.4
5.1
4.9
5.D 131
GFR 132 110 126 139 172 147 133 122 130 117
Mean CEB
(45-49) 3.66 4.13 3.74 4.44 5.12 4.78 3.69 4.31 . 3.81 128
NFHS
TFR
2.59
2.89 2.67 2.35 2.59 112
Mean CEB
4.00
4.60 4.12 3.88 4.05 115
(40-49)

4.4 Page 34

▲back to top


Differentials in the Population Growth of Hindus and Muslims in India
27
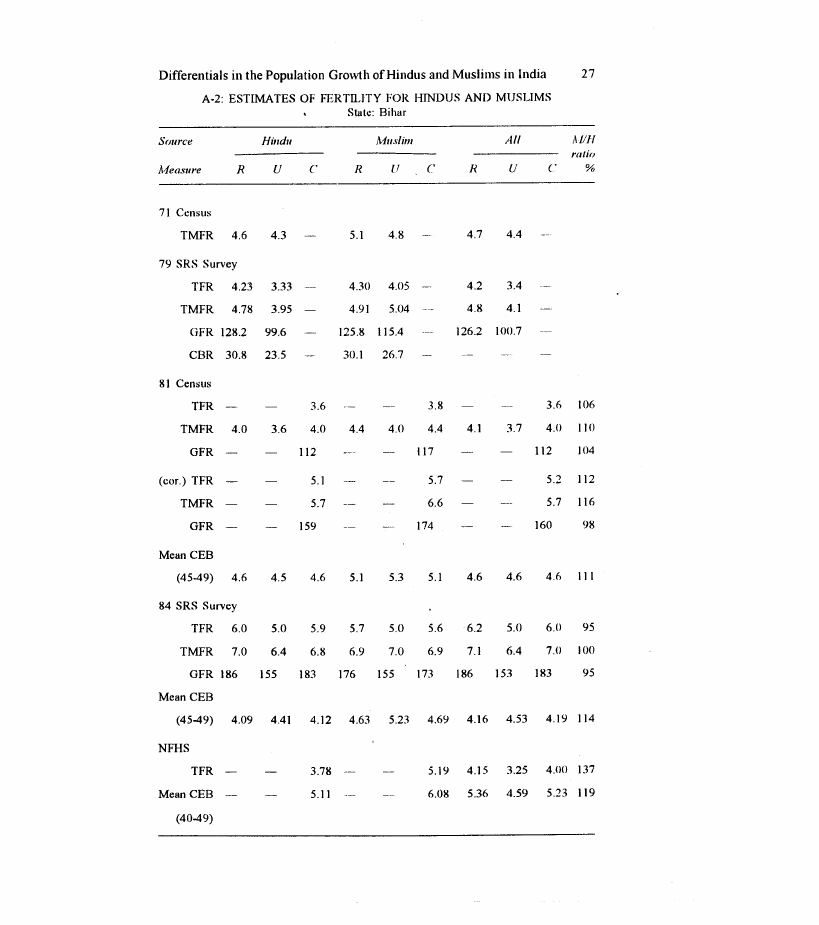
A-2: ESTIMATES OF FER TILlTY FOR HINDUS AND MUSLIMS
State: Bihar
Source
A4easure
Hindu
R
U
C
Muslim
R
UC
All
Miff
ratio
R
U
C
%
71 Census
TMFR 4.6 4.3
5.1 4.8
4.7 4.4
79 SRS Survey
TFR 4.23 3.33
TMFR 4.78 3.95
GFR 128.2 99.6
CBR 30.8 23.5
4.30 4.05 --
4.91 5.04
125.8 115.4
30.1 26.7
4.2 3.4
4.8 4.1
126.2 100.7
81 Census
TFR
3.6
3.8
3.6 106
TMFR 4.0
3.6
4.0
4.4
4.0
4.4
4.1
3.7
4.0 110
GFR
])2
117
Il2
104
(cor.) TFR
TMFR
GFR
5.1
5.7
159
5.7
6.6
174
5.2 ])2
5.7 116
160
98
Mean CEB
(45-49) 4.6 4.5 4.6 5.1 5.3 5.1 4.6 4.6 4.6 III
84 SRS Survey
TFR 6.0 5.0 5.9 5.7 5.0 5.6 6.2 5.0 6.0 95
TMFR 7.0 6.4 6.8 6.9 7.0 6.9 7.1 6.4 7.0 )00
GFR 186 155 183 176 155 173 186 153 183
95
Mean CEB
(45-49) 4.09 4.41 4.12 4.63 5.23 4.69 4.16 4.53 4.19 114
NFHS
TFR
3.78
5.19 4.15 3.25 4.00 137
Mean CEB
5.])
6.08 5.36 4.59 5.23 119
(40-49)

4.5 Page 35

▲back to top


28
P. M. Kulkarni
A·3: ESTIMATES OF fERTILITY FOR HINDUS AND MUSLIMS
State: Gujarat
Source
Measure
Hindu
R
U
C
Muslim
R
U
C
All
MIH
ratio
R
U
C
%
71 Census
TMFR 6.1 5.3
6.7 5.9
6.2 5.3
79 SRS Survey
TFR 4.61 3.64
TMFR 5.71 4.82
GFR 137.3 116.9
CBR 34.1 30.8
4.58
_ 3.84
..
5.50 5.80
139.0 127.4
34.5 33.8
4.6 3.6
5.7 5.0
136.7 116.8
loll Census
TFR
3.2
3.5
3.2 109
TMFR 4.1
3.3
3.8
5.0
4.2
4.5
4.1
3.4
3.9 118
GFR
132
151
133 114
(cor.) TFR
TMFR
GFR
4.6
5.5
191
5.4
7.0
234
4.7 117
5.7 127
194 123
Mean CEB
(45-49) 5.34 4.62 5.15 5.71 5.15 5.40 5.36 4.66 5.15 105
84 SRS Survey
TFR 4.3 3.6 4.1 4.7 3.7 4.3 4.5 3.6 4.1 105
TMFR 5.7
4.8
5.6
6.4
5.3
6.0
5.7
5.0
5.6 107
GFR 143 128 138 142 121 136 143 124 137
99
Mean CEB
(45-49) 4.86 5.08 4.91 5.29 5.78 5.59 4.88 5.12 4.95 114
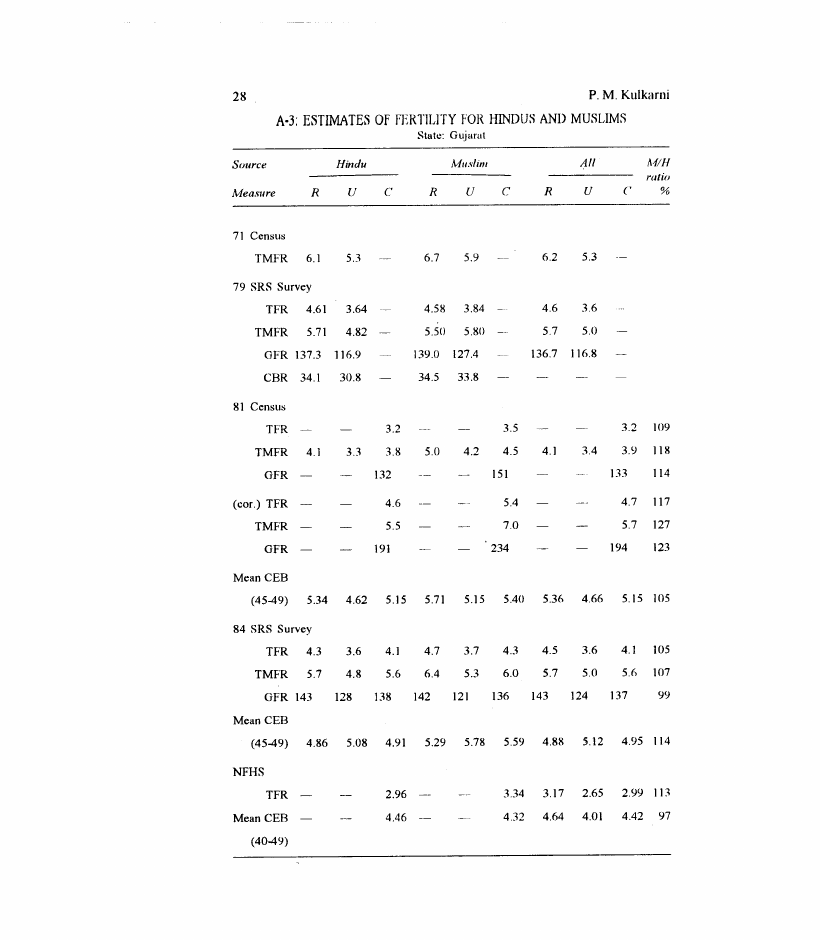
NFHs
TFR
2.96
3.34 3.17 2.65 2.99 113
Mean CEB
4.46
4.32 4.64 4.01 4.42 97
(40-49)

4.6 Page 36

▲back to top


Differentials in the Population Gro\\\\1h of Hindus and Muslims in India
29
A-4: ESTIMATES OF FERTILITY FOR HINDUS AND MUSLIMS
State: Karnataka
Source
Jvfeasure
Hindu
R UC
Muslim
R
U
C
All
R
U
MIH
ratio
C
%
71 Census
TMFR 5.1 4.2
6.1 5.1 5.2 5.2 4.4
79 SRS Survey
TFR 3.70 2.94
TMFR 5.05 4.30
GFR 110.7 91.2
CBR 28.7 24.9
3.83 3.69
5.16 5.90
119.4 111.6
30.0 28.5
3.7 3.0
5.0 4.5
111.0 94.9
81 Census
TFR
2.7
3.3
2.8 122
TMFR 3.7 2.9 3.5 4.6 3.9 4.3 3.8 3.1 3.6 123
GFR
87
106
89 122
(cor.) TFR
TMFR
GFR
4.5
5.9
146
5.8
7.5
185
4.7 129
6.1 127
149 127
Mean CEB
(45-49) 5.08 4.75 5.00 5.78 5.91 5.85 5.13 4.96 5.08 117
84 SRS Survey
TFR 4.1
3.1
3.8
5.1
4.8
5.0
4.1
3.4
4.0 132
TMFR 5.6
4.8
5.4
6.5
6.6
6.6
5.7
5.2
5.5 122
GFR 131 107 125 154 ISO 153 131 115 127 122
Mean CEB
(45-49) 4.6" 4.49 4.57 5.24 5.20 5.22 4.65 4.66 4.65 114
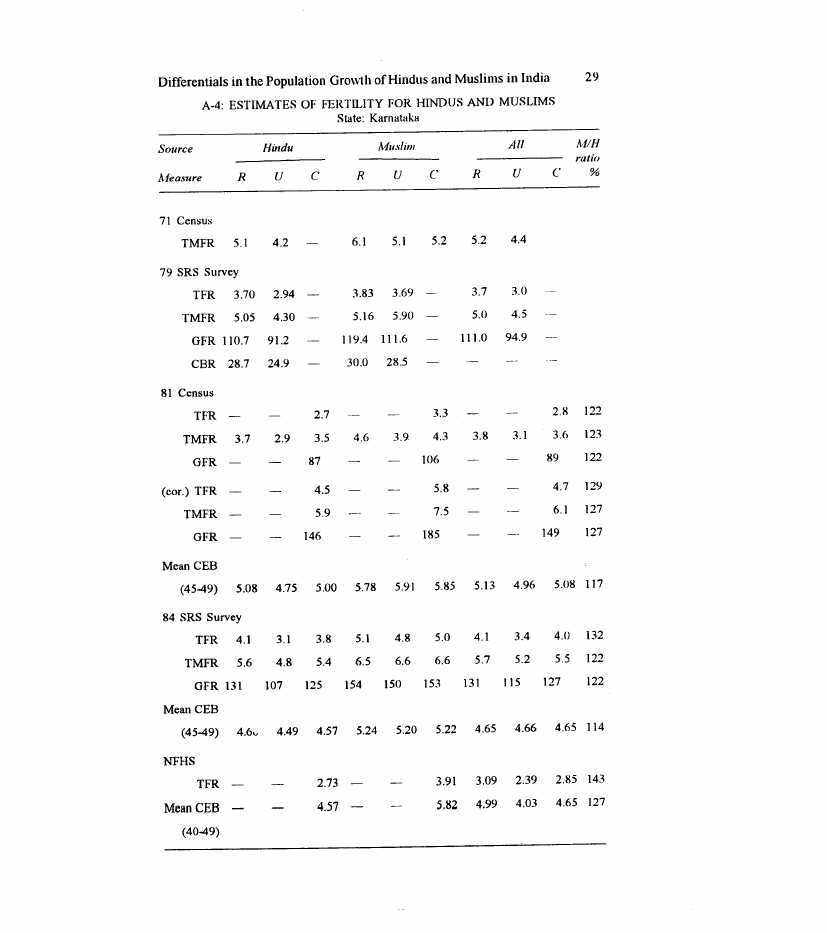
NFHS
TFR
2.73
3.91 3.09 2.39 2.85 143
Mean CEB
4.57
5.82 4.99 4.03 4.65 127
(40-49)

4.7 Page 37

▲back to top


30
P. M. Kulkarni
A-5: I;:STIMATI;:S OF FERTILITY FOR HINDU~ AND MUSLIMS
State: Kerala
Source
Measure
Hindu
R
U
C
Muslim
R
(J
C
All
R
U
M/H
ratio
C
%
71 Census
TMFR 5.9 5.7
6.4 6.4
6.1 6.0
79 SRS Survey
TFR 2.49 1.92
TMFR 4.60 4.50
GFR 79.7 68.5
CBR 23.3 20.7
4.15 3.63
5.63 5.23
131.2 121.3
34.6 34.4
2.8 2.3
4.8 4.7
89.8 81.7
81 Census
TFR
2.2
3.6
2.4 164
TMFR 3.9 3.6 3.9 4.8 4.2 4.7 4.1 3.9 4.0 121
GFR
71
lIS
79 162
(cor.) TFR
3.0
5.1
3.3 170
TMFR
5.3
6.7
5.5 126
GFR
96
164
108 171
Mean CEB
(45-49) 4.79 4.41 4.72 5.90 5.73 5.86 5.07 4.69 5.00 124
84 SRS Survey
TFR 2.2 2.1 2.2 3.7 3.5 3.6 2.5 2.6 2.5 164
TMFR 4.4
5.2
4.4
5.3
5.6
5.3
4.7
5.1
4.8 120
GFR 73
72
73 120 127 121
84
86
84 166
Mean CEB
(45-49) 4.38 4.08 4.33 5.38 5.67 5.45 4.66 4.51 4.64 126
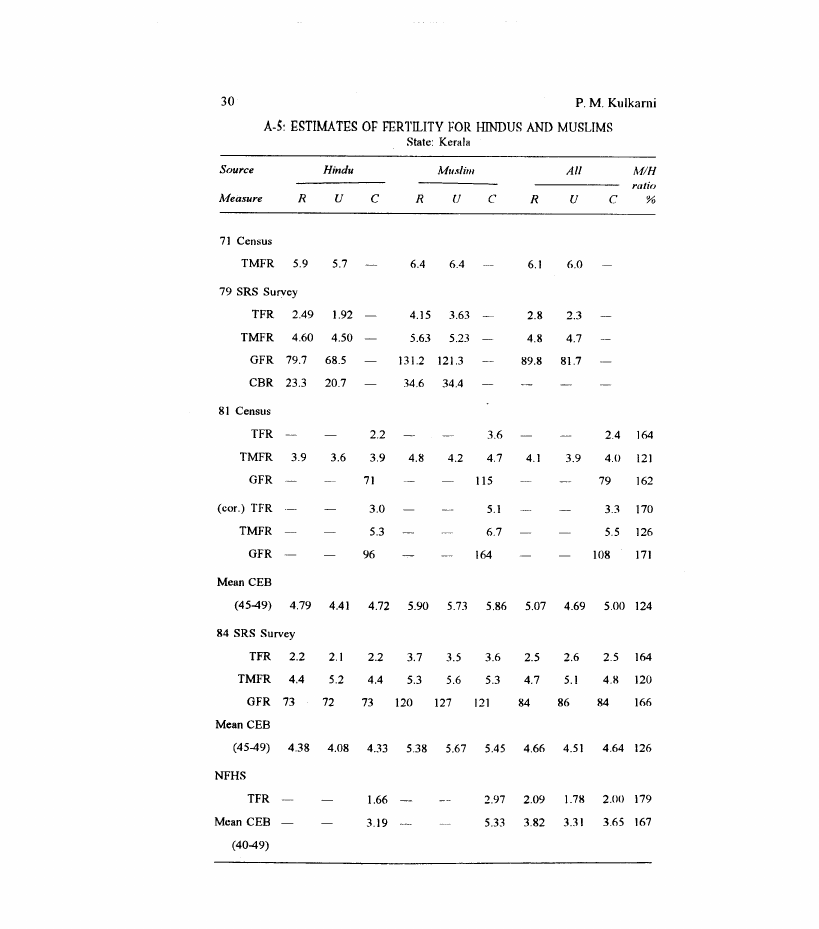
NFHS
TFR
1.66
2.97 2.09 1.78 2.00 179
Mean CEB
3.19
5.33 3.82 3.31 3.65 167
(40-49)

4.8 Page 38

▲back to top


Differentials in the Population Growth of Hindus and Muslims in India
31
A-6: ESTIMATES OF FERTILITY FOR HINDUS AND MUSLIMS
State: Madhya Pradesh
Source
ft.,feasure
Hindu
R
U
C
Muslim
R
U
C
All
R
U
M/H
ratio
C
%
71 Census
TMFR 6.1 4.9
6.4 5.9
6.1 5.1
79 SRS Survey
TFR 5.36 3.77
TMFR 5.92 5.06
GFR 16\\.8 119.8
CBR 37.3 30.5
5.45 4.09
6.24 5.43
159.4 132.9
37.9 3\\.8
5.3 3.8
5.9 5.1
161.3 12\\.6
81 Census
TFR
4.6
4.6
4.5 100
TMFR 5,2
4.3
5.0
6.3
5.1
5.6
5.2
4.4
5.0 112
GFR
142
142
141 100
(cor.) TFR
TMFR
GFR
5.4
5.9
167
6.1
7.4
187
5.3 113
5.9 125
167 112
Mean CEB
(45-49) 5.56 5.10 5.49 6.45 5.85 6.10 5.57 5.20 5.51 111
84 SRS Survey
TFR 5.4 .4.3
5.2
6.1
5.4
5.8
5.4
4.4
5.2 112
TMFR 6.1 5.7 6.0 7.9 5.6 7.2 6.1 5.6 6.0 120
GFR 170 135 163 189 163 176 170 138 163 108
Mean CEB
(45-49) 5.20 5.27 5.21
6.32 5.85 6.02 5.22 5.37 5.25 116
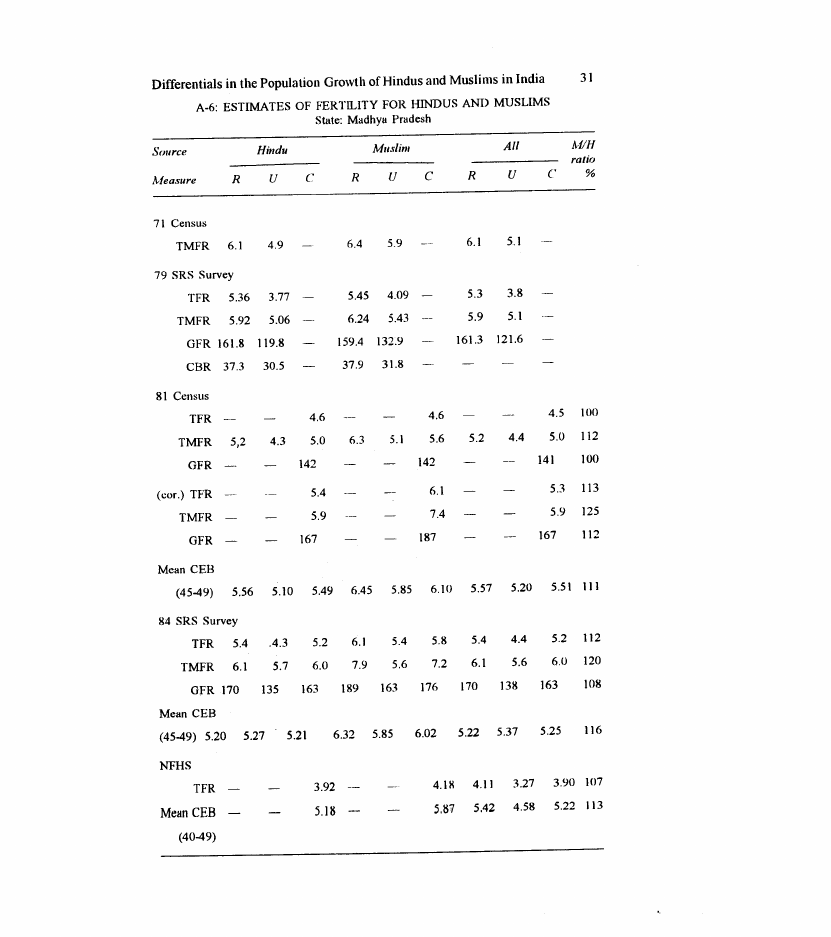
NFHS
TFR
Melin CEB
(40-49)
3.92
4.111 4.11 3.27 3.90 107
5.18
5,87 5.42 4.58 5.22 113

4.9 Page 39

▲back to top


32
P. M. Kulkarni
A-7: J:.:S:TIMATJ:.:OS:F FtRTlLITY FOR HINDUS AND MUSLIMS
State: Maharashtra
Source
Measure
Hindu
R ·u C
Muslim
R
U
C
All
!'diH
ratio
R
U
C
%
71 Census
TMFR 4.9 4.0
5.7 4.9
5.0 4.2
79 SRS Survey
TFR 3.62 2.64
TMFR 4.22 4.11
GFR 110.9 87.7
CBR 25.9 23.0
4.74
~ 3.81
..
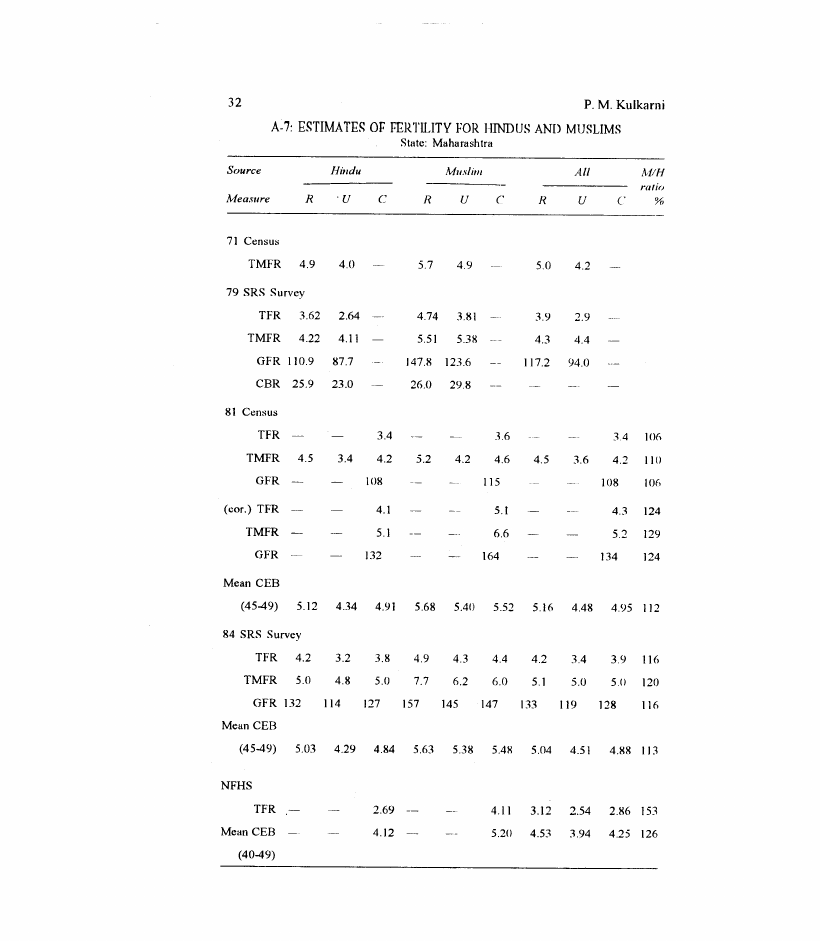
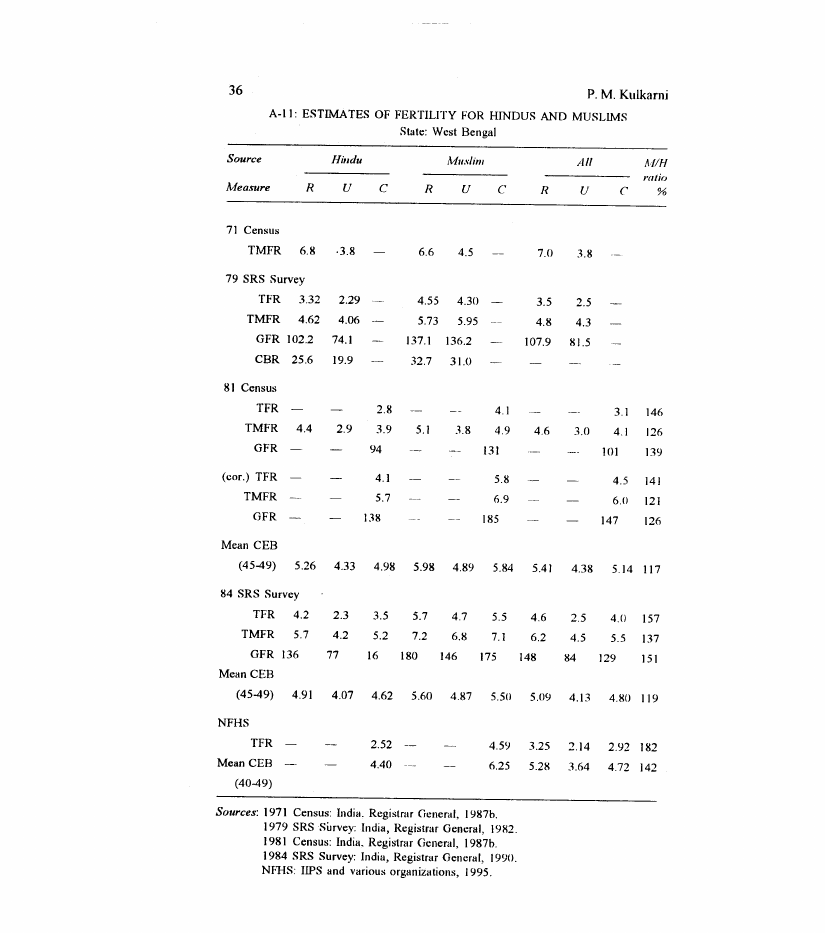
5.51 5.38
147.8 123.6
26.0 29.8
3.9 2.9
4.3 4.4
117.2 94.0
81 Census
TFR
3.4
3.6
3.4 !Oo
TMFR 4.5 3.4 4.2 5.2 4.2 4.6 4.5 3.6 4.2 llO
GFR
!O8
115
108
106
(cor.) TFR
TMFR
GFR
4.1
5.1
132
5.1
6.6
164
4.3 124
5.2 129
134 124
Mean CEB
(45-49) 5.12 4.34 4.91 5.68 5.40 5.52 5.10 4.48 4.95 112
84 SRS Survey
TFR 4.2
3.2
3.8 4.9
4.3
4.4
4.2
3.4
3.9 116
TMFR 5.0 4.8 5.0 7.7 6.2 6.0 5.1 5.0 5.0 120
GFR 132 114 127 157 145 147 133 119 128 116
Mean CEB
(45-49) 5.03 4.29 4.84 5.63 5.38 5.48 5.04 4.51 4.88 113
NFHS
TFR
2.69
4.11 3.12 2.54 2.86 153
Mean CEB
4.12
5.20 4.53 3.94 4.25 126
(40-49)

4.10 Page 40

▲back to top


Differentials in the Population Growth of Hindus and Muslims in India
33
A-8: ESTIMATES OF FERTILITY FOR HINDUS AND MUSLIMS
State: Rajasthan
Source
Measure
Hindu
R
U
C
Muslim
R
UC
All
M/H
ratio
R
U
C
%
71 Census
TMFR 6.2 5.0
6.5 5.9
6.2 5.1
79 SRS Survey
TFR 5.50 3.77
TMFR 5.98 4.55
GFR 167.1 117.8
CBR 37.6 28.2
5.92(
6.80 5.34
175.2 140.7
38.4 31.7
5.5 3.9
6.0 4.6
167 120
81 Census
TFR
5.5
5.4
5.5 98
TMFR 6.3
4.5
5.9
6.5
5.2
5.9
6.3
4.6
5.9 100
GFR
169
165
167
98
(cor.) TFR
TMFR
GFR
6.0
6.5
184
6.8
7.5
207
6.1 113
6.5 115
185 113
Mean CEB
(45-49) 5.96 5.43 5.87 6.56 6.08 6.34 5.99 5.52 5.90 108
84 SRS Survey
TFR 6.1
4.6
5.9
5.6
6.3
5.8
6.1
4.7
5.X 98
TMFR 6.7 5.8 6.5 6.2 7.1 6.5 6.6 5.9 65 100
GFR 190 ISO 183 175 189 179 188 153 181
98
Mean CEB
(45-49) 5.41 4.95 5.34 5.97 5.63 5.84 5.42 5.04 5.36 109
NFHS
TFR
3.66
4.01 3.87 2.77 3.63 110
Mean CEB
4.94
5.94 5.21 4.12 4.99 120
(40-49)
) The reported value appears implausible.

5 Pages 41-50

▲back to top


5.1 Page 41

▲back to top


34
P. M. Kulkarni
A-9: ESTIMATES OF FERTILITY FOR HINDUS AND MUSLIMS
State: Tamil Nadu
Source
J.,feasure
Hindu
R
U
C
Muslim
R
UC
All
MIH
ratio
R
U
C
%
71 Census
TMFR 4.0 3.9
4.4 4.3
4.0 4.0
79 SRS Survey
TFR 3.43 2.67
TMFR 4.75 4.15
GFR 104.2 87.4
CBR 27.8 26.3
3.64 3.24
4.99 4.75
108.8 102.0
30.1 30.2
3.5 2.9
4.8 4.3
105.0 91.0
81 Census
TFR
3.1
3.5
3.0 117
TMFR 4.2 3.9 4.1 4.7 4.6 4.7 4.3 4.0 4.2 115
GFR
93
110
94 118
(cor.) TFR
TMFR
GFR
3.9
5.3
121
4.9
6.6
155
3.9 126
5.5 125
123 128
Mean CEB
(45-49) 4.07 4.28 4.13 4.61 4.94 4.80 4.12 4.35 4.19 116
84 SRS Survey
TFR 3.6 2.1 3.3 3.3 3.6 3.5 3.6 3.1 3.3 106
TMFR 5.4 .4.8 5.1 4.9 5.5 5.0 5.3 4.9 5.1 98
GFR 113 104 109
99 120 113 III 105 109
104
Mean CEB
(45-49) 3.72 4.02 3.81 4.58 4.57 4.57 3.75 4.07 3.85 120
NFHS
TFR
2.46
2.48 2.54 2.36 2.48 101
Mean CEB
4.17
5.37 4.27 4.09 4.21 129
(40-49)

5.2 Page 42

▲back to top


Differentials in the Population Growth of Hindus and Muslims in India
35
A-10: ESTIMATES OF FERTILITY FOR HINDUS AND MUSLIMS
State: Uttar Pradesh
Source
Measure
Hindu
R
U
C
Muslim
R
(J
C
All
R
(J
!l4/H
ratio
('
%
71 Census
TMFR 5.2 4.7
6.0 5.9
5.3 5.1
79 SRS Survey
TFR 5.82 3.21
TMFR
6.55
5.17 '-,
GFR 171.0 118.5
CBR 39.2 29.3
6.39 3.88
7.35 6.77
188.5 144.2
42.2 34.3
5.9 4.1
6.6 5.6
172.9 124.4
81 Census
TFR
4.2
4.8
4.3 114
TMFR 4.7
4.0
4.6
5.5
5.3
5.4
4.8
4.3
4.7 117
GFR
127
144
130 113
(cor.) TFR
TMFR
GFR
5.8
6.3
175
6.6
7.5
199
5.9 114
6.5 119
179 114
Mean CEB
(45-49) 5.26 4.76 5.19 5.67 5.76 5.72 5.31 5.03 5.26 110
84 SRS Survey
TFR 6.1
4.0
5.7
7.1
6.4
7.0
6.2
4.9
5.9 123
TMFR 6.8 5.5 6.4 8.1 8.7 8.4 7.0 6.5 6.8 131
GFR 182 137 173 213 184 205 186 ISO 179 118
Mean CEB
(45-49) 5.34 4.84 5.28 5.95 6.47 6.13 5.41 5.38 5.41 116
NFHS
TFR
4.75
5.26 5.19 3.58 4.82 111
Mean CEB
5.93
6.43 6.19 5.18 5.97 108
(40-49)

5.3 Page 43

▲back to top


36
P. M. Kulkarni
A-II: ESTIMATES OF FERTILITY FOR HINDUS AND MUSLIMS
State: West Bengal
Source
Measure
Hindu
R
U
C
MI/slim
R
U
C
All
AlIH
ratio
R
U
C
%
71 Census
TMFR 6.8 ·3.8
6.6 4.5
7.0 3.8
79 SRS Survey
TFR 3.32
TMFR 4.62
GFR 102.2
CBR 25.6
2.29
4.06
74.1
19.9
4.55 4.30
5.73 5.95
137.1 136.2
32.7 31.0
3.5 2.5
4.8 4.3
107.9 81.5
81 Census
TFR
2.8
4.1
3.1 146
TMFR 4.4 2.9 3.9 5.1 3.8 4.9 4.6 3.0 4.1 126
GFR
94
131
101 139
(cor.) TFR
TMFR
GFR
4.1
5.7
138
5.8
6.9
185
4.5 141
6.0 121
147 126
Mean CEB
(45-49) 5.26 4.33 4.98 5.98 4.89 5.84 5.41 4.38 5.14 117
84 SRS Survey
TFR 4.2
TMFR 5.7
GFR 136
Mean CEB
(45-49) 4.91
2.3
4.2
77
4.07
3.5 5.7 4.7 5.5 4.6
5.2 7.2 6.8 7.1 6.2
16 180 146 175 148
4.62 5.60 4.87 5.50 5.09
2.5 4.0 157
4.5 5.5 137
84 129 151
4.13 4.80 119
NFHS
TFR
2.52
4.5<.1 3.25 2.14 2.92 182
Mean CEB
4.40
6.25 5.28 3.64 4.72 142
(40-49)
Sources: 1971 Census: India. Registrar General, 1987b.
1979 SRSSurvey: India, Registrar General, 1982.
1981 Census: India. Registrar General, 1987b.
1984 SRS Survey: India, Registrar General, 1990.
NFHS: lIPS and various organizations, 1995.

5.4 Page 44

▲back to top


ASSUMPTIONS ON AGE DISTRIBUTIONS USED IN
PROJECTIONS
For All Religions, Hindus, and Muslims: The 1981 census age
distribution of the respective state.
For All Religions and Hindus: The 1981 census age distribution
of the respective state.
For the state
Andhra Pradesh
Bihar
Gujarat
Karnataka
Kerala
Madhya Pradesh
Maharashtra
Rajasthan
Tamil Nadu
Uttar Pradesh
West Bengal
India
11,e 1981 Age Distribution (if
India
Bihar
Gujarat
Madhya Pradesh
Malappuram District
Rajasthan
India
Rajasthan
Tamil Nadu
Uttar Pradesh
Rajasthan
Madhya Pradesh

5.5 Page 45

▲back to top


Appendix C
State
Projections 1 and II
Prujection III
All Religions
Hindu
Muslim
NJuslim
1981-86 1986-91 1981-86 1986-91 /981-86 1986-91 1981-861986-91
Andhra Pradesh 3.97 3.10 3.84 3.05 4.58 3.51 4.65 3.82
Bihar
5.71 4.77 5.72 4.65 5.53 5.34 5.54 5.42
Gujarat
4.07
3.47
4.09
3.46
4.29
3.76
4.32 3.96
Karnataka
3.89 3.29 3.80 3.18 4.89 4.32 4.93 4.53
Kerala
2.47
2.20
2.11
1.85 3.61
3.24
3.64 3.37
Madhya Pradesh 5.]6
4.36
5.16
4.38
5.68
4.73
5.73 5.01
Maharashtra
3.85 :U8
3.80 3.16 4.43 4.24 4.44 4.3]
Rajasthan
Tamil Nadu
5.69 4.53 5.74 4.57 5.70 4.74 5.75 5.10
3.34 2.79 3.35 2.78 3.48 2.84 3.51 3.03
Uttar Pradesh
West Bengal
5.86 5.25 5.64 5.12 6.81 5.90 6.87 6.22
3.89
3.28
3.46
2.86
5.47
4.91
5.50 5.07
India
4.55
3.88
4.46
3.79
5.5\\
4.87
5.55 5.07
2. Age Pattern of Fertility
Projection I
The 1984 SRS survey pattern for the corresponding state/religion
applied to both the periods (1981-86, and 1986-91); see, India,
Registrar General (1990).
For 1981-86: the 1984 SRS survey pattern for the corresponding state/
religion is used.

5.6 Page 46

▲back to top


Differentials in the Population Gro\\\\1h of Hindus and Muslims in India
39
For 1986-91, the age pattern used is given below:
All Religiolls
Pro;ecllOlI J[
Hilldu
Aiuslim
Pro;ecli(JII III
/I,ll/slim
For the state
The 1984 SRS Survey age pattern of
Andhra Pradesh
Bihar
Gujarat
Karnataka
Kerala
Madhya Pradesh
Maharashtra
Rajasthan
Tamil Nadu
Uttar Pradesh
West Bengal
T. N. - A
M. P. - A
T.N. - A
T. N. - A
Kerala - A
India - A
T. N. - A
India - A
Kerala - A
M. P. - A
T. N.-A
T. N. -II
M. P. - II
T. N. - 11
T. N. - 11
Kerala - If
India - II
T. N. - 1-1
India - H
Kerala - H
M. P. - 1-1
T. N. - H
T. N. - M
Bih. - M
Guj. - M
Maha. - M
Kerala - M
Karn. - M
Maha. - M
Karn. - M
T. N. - M
M. P. - M
Karn. - M
T.N.- M
Bih.- M
Guj.- M
Maha- M
Ker.- M
Karn.- M
Mah. - M
Karn.- M
T.N. - M
U.P.- M
Karn.- M
India
Kamataka- A Kamataka -H Karn. - M
Karn.- M
A : All Religions; H: Hindu; M: Muslim.

5.7 Page 47

▲back to top


Appendix D
ASSUMPTIONS ON MORTALITY
1. Level of Mortality (value of e~)
Slafe
Period
Andhra Pradesh
Bihar
Gujarat
Karnataka
Kerala
Madhya Pradesh
Maharashtra
Rajasthan
Tamil Nadu
Uttar Pradesh
West Bengal
81-86
86-91
81-86
86-91
81-86
86-91
81-86
86-91
81-86
86-91
81-86
86-91
81-86
86-91
81-86
86-91
81-86
86-91
81-86
86-91
81-86
86-91
All Religions
AI
F
57.15
58.20
54.18
55.70
55.48
57.00
59.70
60.40
65.40
66.80
51.49
53.70
59.60
61.20
53.29
55.20
56.47
60.00
51.38
54.20
56.86
60.20
59.82
60.40
51.48
53.60
59.34
58.80
62.02
62.60
71.51
72.30
51.94
53.00
62.13
63.50
53.84
56.20
57.38
60.60
48.46
52.50
58.04
61.20
Hindu
AI
F
56.67
57.7'2
54.18
55.70
55.22
56.74
59.11
59.81
65.40
66.80
51.06
53.27
59.37
60.97
52.73
54.64
56.10
59.63
50.83
53.65
57.50
60.84
59.29
59.87
51.23
53.35
58.93
58.39
61.49
62.07
71.67
72.46
51.35
52.41
61.87
63.24
53.24
55.60
56.97
60.19
47.65
51.69
58.74
61.90
fl1uslim
AI
F
61.95
63.00
54.18
55.70
57.31
58.83
62.41
63.11
63.84
65.24
57.27
59.48
63.31
64.91
56.09
58.00
58.86
62.39
54.02
56.84
54.76
58.10
64.47
65.05
52.91
55.03
61.71
61.17
64.74
65.32
68.80
69.59
59.13
60.19
66.37
67.74
57.18
59.54
59.88
63.10
52.16
56.20
56.02
59.18
India
81-86
86-91
55.40
57.70
55.67
58.10
55.05
57.35
55.16
57.59
57.34
59.64
58.01
60.44
2. Age Pattern of Mortality
The South Asian Pattern of the U.N. Model life tables for developing
countries has been used in all the projections.

5.8 Page 48

▲back to top


AN ILLUSTRA nON FOR INDIA, PROJECTION I
A1easure
Period'
All RefiKioflS
Projected
SRS1
CBR
1981-86
(per 1000)
86-91
33.39.
29.75
33.64
31.42
Hlildll
Projected Ad,P
33.01
2937
33.26
31.02
Muslim
Projected AdP
38.94
34.94
3'J.23
36.'JO
CDR
1981-86
(per 1000)
86-91
1237
10.92
12.14
10.60
12.54
11.08
12.31
10.76
11.88
10.44
11.66
10.13
Annual Rate of Natural Increase
(per 1000) 1981-86
86-91
21.50
20.82
20.95
20.26
27.57
26.77
Natural Increase'
(per cent) 1981·91
23.57
22.88
31.22
Notes: I. The SRS rates are averages of the annual estimates for 1981-85 (Ii.Jr 1981-86)
and 1986-90 for (1986-91), taken from India, Registrar General,SRS (I'J95h).
SRS Rate (All Religions)
Projected Rate (All Religions)
3. The intercensal natural increase is computed as:
100 x Exp { [ (CBR - CDR)sl.l!6 + (CBR - CDR)86-91] x 5 /1000 }.

5.9 Page 49

▲back to top


Appendix F
The estimates of net migration depend on the projections made which
in turn are based on the input data and assumptions. The input data
from sample surveys and registration are subject to both sampling
and non-sampling errors and the data from the census are subject
to non-sampling errors. To that extent, the projections and by
implication the estimates of net migration are also subject to errors.
In addition, assumptions about fertility trends and patterns, mortality
trends (in particular, the persistence of pre-1981 mortality differential)
and patterns, and age distributions (for Muslims) may also not hold.
How large are the influences of errors or departures? In order to
have an idea of these, alternate projections were made and natural
increase recomputed by making reasonable variations in various input
parameters (levels as well as patterns). Some of the results are given
in Table F.l.
The level of fertility naturally has a large influence on the
projections. If the TFR is higher by half a point, the projected CBR
would be higher by about three points. A portion of this would be
offset by a rise in the CDR (more births means more infant and
childhood deaths), but this effect is quite small and ultimately, the
natural increase would be higher by about three percentage points
for the intercensal decade (compare projections A and B), and the
estimated net migration rate lower to that extent. Hence, if the true
TFR of Muslims in India is higher by 0.3 than what has been assumed,
the intercensal growth during 1981-91 would be higher by about two
percentage points (3 x 0.3/0.5 = 1.8) than obtained in the projections
and thus be quite close to the observed growth implying very little
net migration of Muslims.
The projections are not much sensitive to the fertility pattern.
The age pattern of fertility for 1986-91 differs between projections
A and C as a result of which the projected CBR is marginally different.
However, since the projected CBRs are adjusted on the basis of the
SRS estimates for the period for All Religions, and the same
adjustment is applied to Hindus and Muslims, the resultant CBRs
differ by less than 0.1 point, and thus the effect on the projected

5.10 Page 50

▲back to top


Differentials in the Population Growth of Hindlls and Muslims in India
43
natural increase is minuscule. In the case of a few states, the effect
is slightly larger, but rarely exceeds half a percentage point.
If the life expectancy is higher by two years for both males and
females, the death rate would be lower and the natural increase higher
by about one point; compare projections A and D in Table F. ]. In
other words, if the true Hindu-Muslim mortality gap is wider than
what has been assumed, by an equivalent of two years in life
expectancy, the gap in natural increase would be higher by about
one point per thousand annually or just over one percenta§e point
for the intercensal period, and the estimate of net migration lower
to that extent.
An identical mortality pattern (the South Asian Pattern-SAP
of the U.N. Model Life Tables) was adopted in all the projections.
The SAP model life tables were also used to estimate the level of
mortality (expectation of life) from q(5) values given by the 1981
census data. This pattern is designed for South Asia and should give
a good fit for India and states. Yet, for some states, the pattern could
be different. A plot of q(5) on life expectancy from the 1981-85 and
1986-90 SRS life tables showed that though the points for many
states were close to the curve implied by the SAP, notable departures
were found for the southern states. Hence, in alternative projections
for some of the states, the U.N. General pattern was used, both to
estimate life expectancy from q(5), and to project population. The
projected growth rates were found to be extremely close to those
given by the SAP (results not shown). Thus, the projections (at least
for the short term of a decade) do not appear to be sensitive to the
mortality pattern assumed.
The extent to which the initial age distribution influences the
estimates of natural increase and net migration can be seen by
comparing projections A and E in Table F.1: projection A is based
on the all-India 1981 age distribution while the Madhya Pradesh
distribution (which is younger corresponding to a higher fertility as
in Projection II in the text) is used in projection E. The difference
is over one percentage point. In fact, since the difference between
the assumptions of Projections I and II in the text for Muslims is
in the fertility pattern and age distribution, and since the fertility
pattern does not influence the results much as noted above, most
of the difference between the projected values of natural increase
in Projections I and II is attributable to the differences in the initial

6 Pages 51-60

▲back to top


6.1 Page 51

▲back to top


age distribution. The effect was found to be large in a few of the
states (compare Tables 7 and 8 in the text).
Finally, the assumptions on the pace of fertility decline do
influence the TFRs for the two periods-1981-86 and 1986-91,
especially the latter. It can be seen from Appendix C that for some
of the states the difference between the TFRs for Muslims in
Projections II and III is large, the TFRs corresponding to a slow
initial-rapid later decline are larger than those in the linear decline.
Naturally, the estimated natural increase is greater in Projection III
than in II. For India, the difference is about one percentage point
(compare projections A and F). For the states, it varies between 0.3
and 1.8 points; wherever the Muslim fertility decline has been rapid,
the assumptions on the path make a greater impact (compare tables
8 and 9 in the text).
Since the input data on fertility are from sample surveys, the errors
are likely to be larger at the state level than at the all-India level.
The NFHS has given standard errors (s.e.) for the estimates of the
TFR (lIPS and various organizations, 1995). For India, the s.e. is
0.03, and for individual states it is of the order of 0.1. Thus, even
for the states, an error of 0.5 (as assumed in the alternative projections)
is quite unlikely. However, for the Muslim population, the sample
sizes are small, generally a tenth of the total, and hence the s.e. would
be about three times as large, i.e., around 0.1 for India, and 0.3 for
many of the states. In that case, errors of the order of 0.5 in the TFR
of Muslims cannot be ruled out at the state level.
Besides, there can be non-negligible non-sampling errors. Since
the projected estimates of the CBR and CDR have been adjusted
to correspond to the averages of the annual estimates of the SRS
for the corresponding periods, non-sampling errors would have little
impact at the state level, i.e., for All Religions. Since the proportion
of Hindus in most states is very high, the same argument holds for
Hindus as well. However, to the extent that the non-sampling errors
in the estimation of the input parameters for Muslims differ from
those for the general population, the estimates of net migration for
Muslims would be affected. Moreover, if the estimates provided by
the annual series of the SRS (which are used to make adjustments
to the projected CBRs and CDRs) are in error, the estimates of natural
increase and hence of net migration could also be incorrect.
To sum up, the projections are quite sensitive to errors in the
level offertility and in the initial age distribution, moderately sensitive

6.2 Page 52

▲back to top


to the path of fertility decline and to the level of mortality and are
not much sensitive to age patterns of fertility and mortality. Since
we do have some idea of the sampling errors of the fertility estimates,
it can be said that for Muslim populations at the state level, errors
of the order three points in the projected intercensal increase can
not be ruled out. The use of the state age distribution for Muslims
(as in Projection I) can cause errors, but we are also not sure how
appropriate the distributions used in Projections II and III are. The
base level fertility was adopted as a criterion for choosing the age
distribution ( the distribution of a state with a fertility level close
to the Muslim fertility in the given state was used) but other factors,
especially migration, can also influence age distributions considerably.
Identifying a state which would have age distribution similar to that
of the Muslim population of a given state is often difficult. Hence,
the chances of errors on the account of a wrong choice of the initial
age distribution are large. Therefore, the state-level estimates of
migration of Muslims should be used with greater caution.
TABLE F-l: RESULTS OF PROJECTIONS UNDER ALTERNATE ASSUMPTIONS
OF AGE DISTRIBUTION. FERTILITY, AND MORTALITY
Projectiol/
II/itial
Age
Dislrih.
Morlality
Level
(eg)
Level
(TFU)
Fertility
Age
I)a/lerll
(jor 86- 9/)
Palh (~f
Declil/e
Proj,ecled
I/ilillral
iI/crease
8/-9/(°'0)
A
India-1981 India-M India- M Karn.- M Linear
3\\17
B
India-1981 India-M India-M
Karn. -M Linear
34,43
+ n.5
C
India-I 981 India-M India-M
India-M
Linear
3122
D
India-1981 India-M
India-M
Karn.-M
Linc:ar
32.29
+ 2.0
E
M.P. 1981 India-M India-M
Karn.-M
Linear
30.04
F
India-1981 India-M India-M
Karn.-M
SL-RA
32.23
Nole: India-M : Fertility/mortality level as used lllf India- Muslims. and the 1,>X4 SRS
survey age pattern of fertility for India. Muslims.
Karn.-M: The 1984 SRS survey age pattern or rertility or Karnataka. Muslims.
The South Asian Model tables han; been used ("r all the projections.
SL-RA : The path of ti:rtility decline is slow initially and rapid towards 1991.