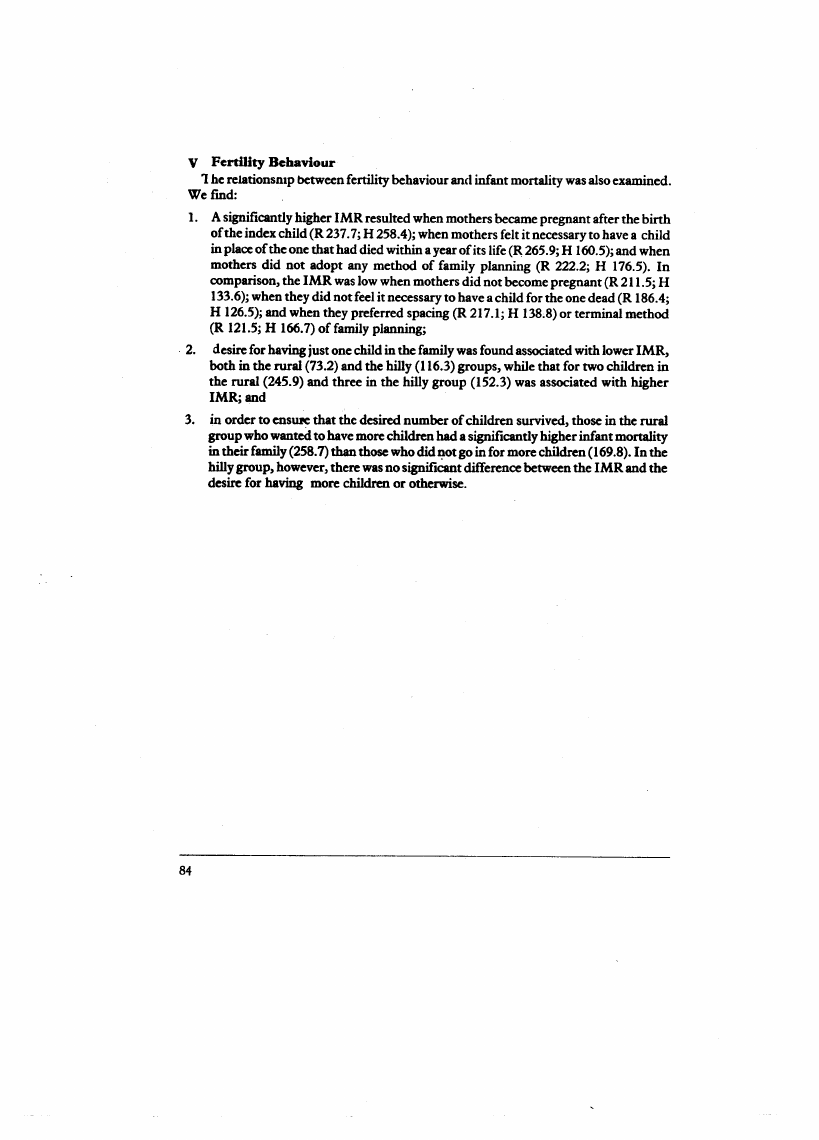
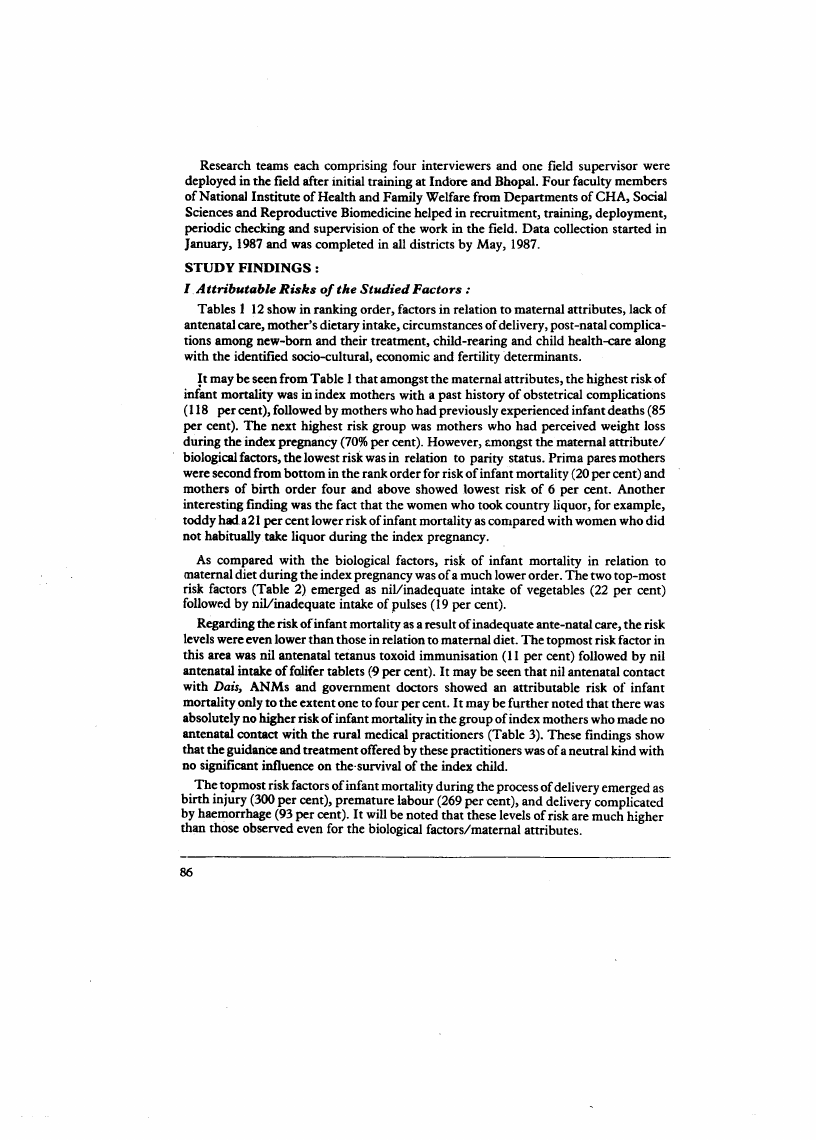
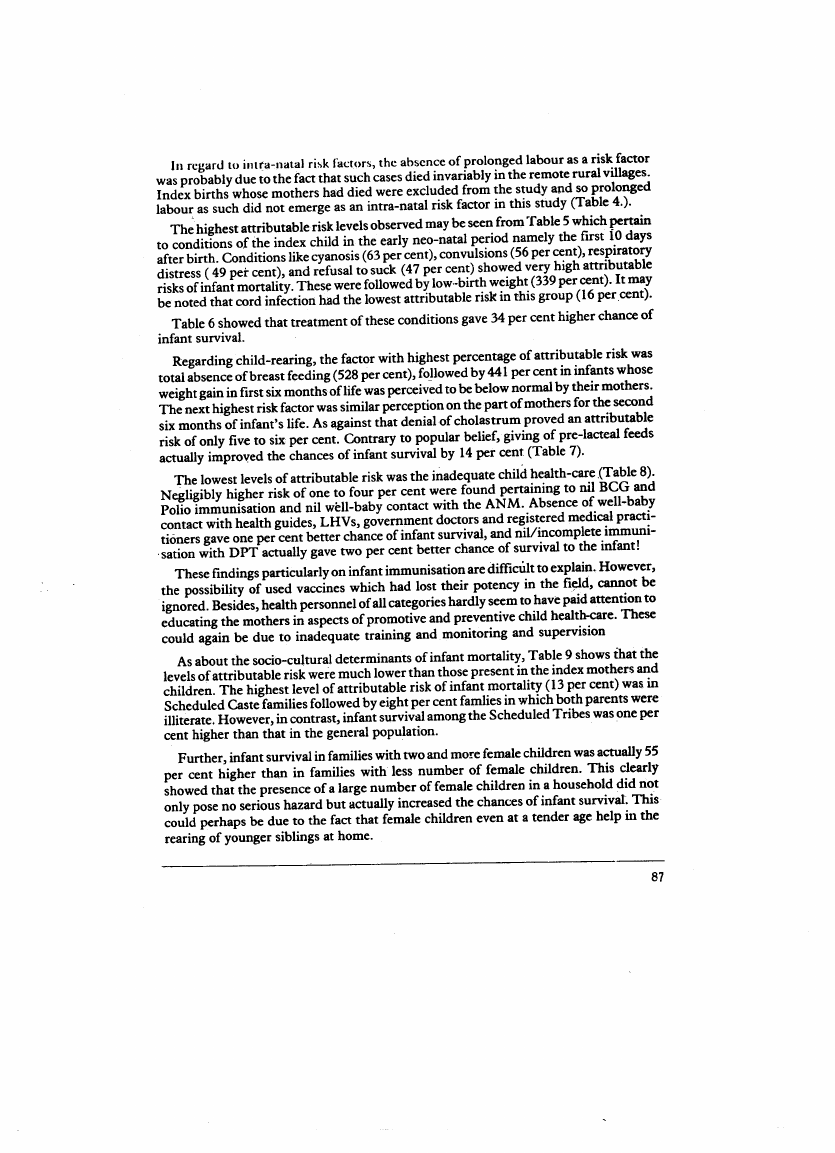
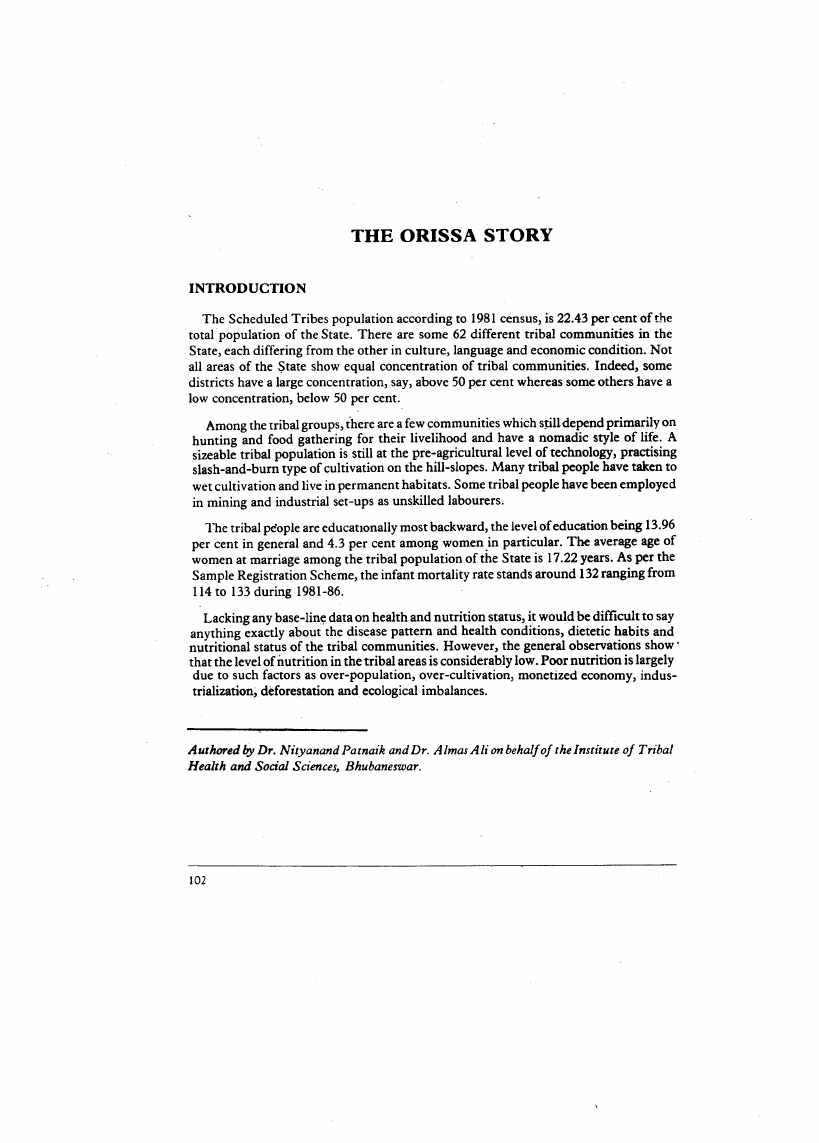
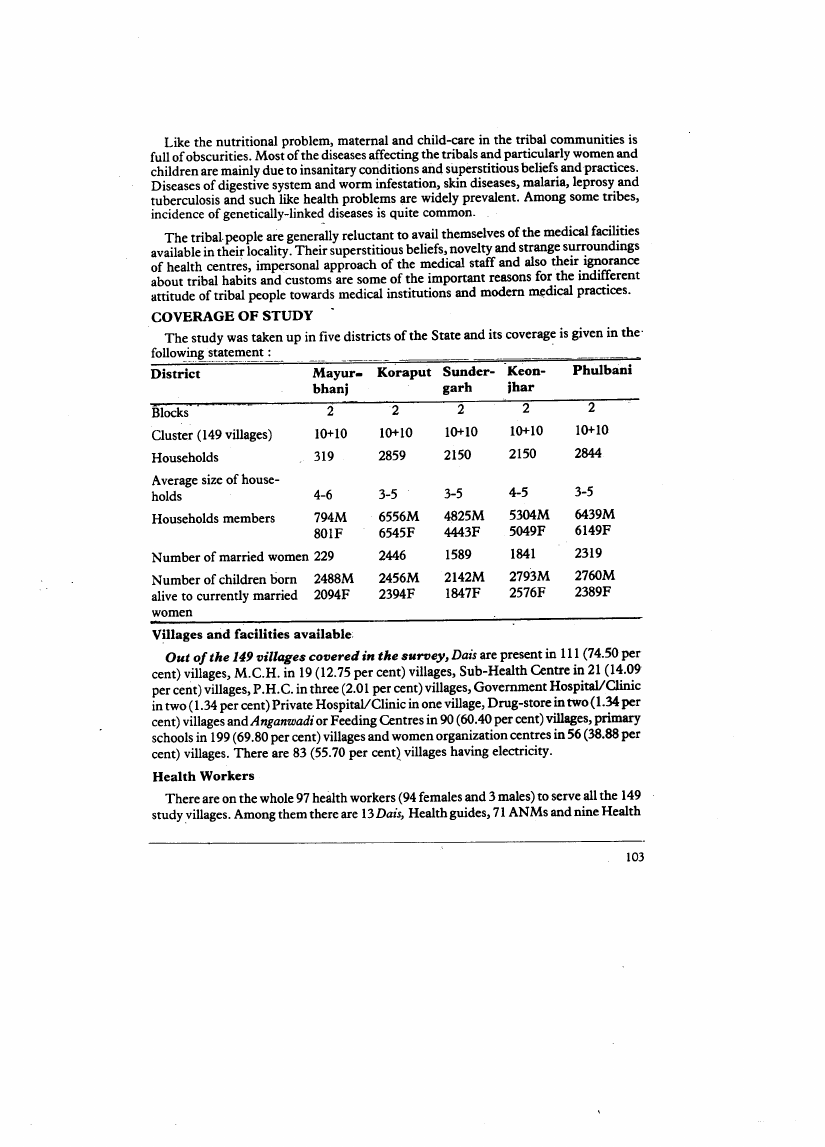
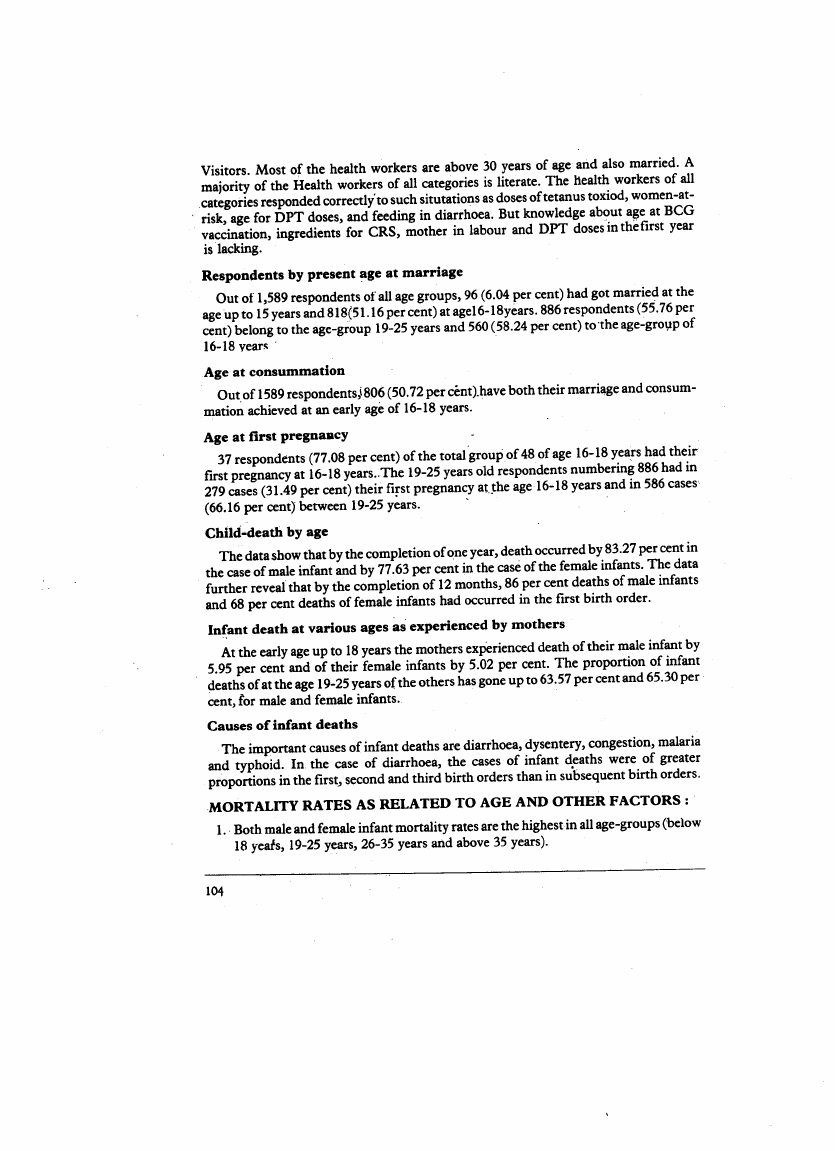
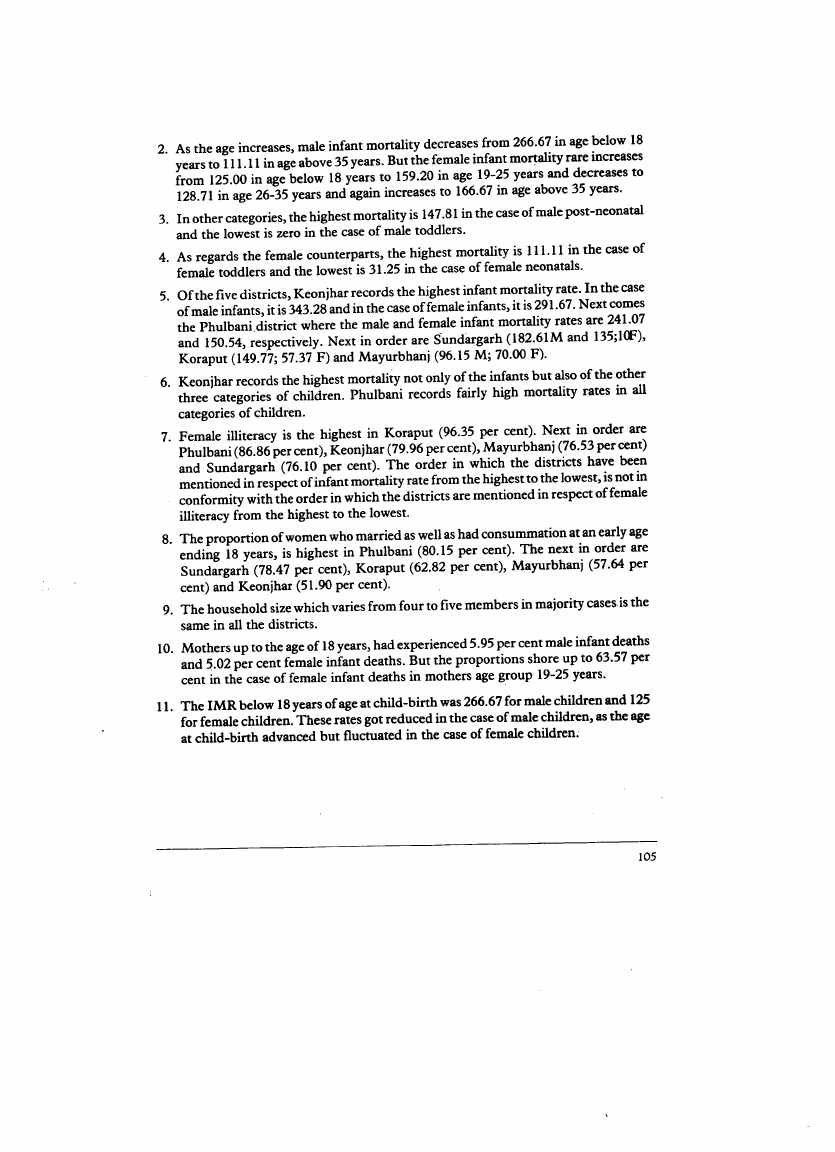
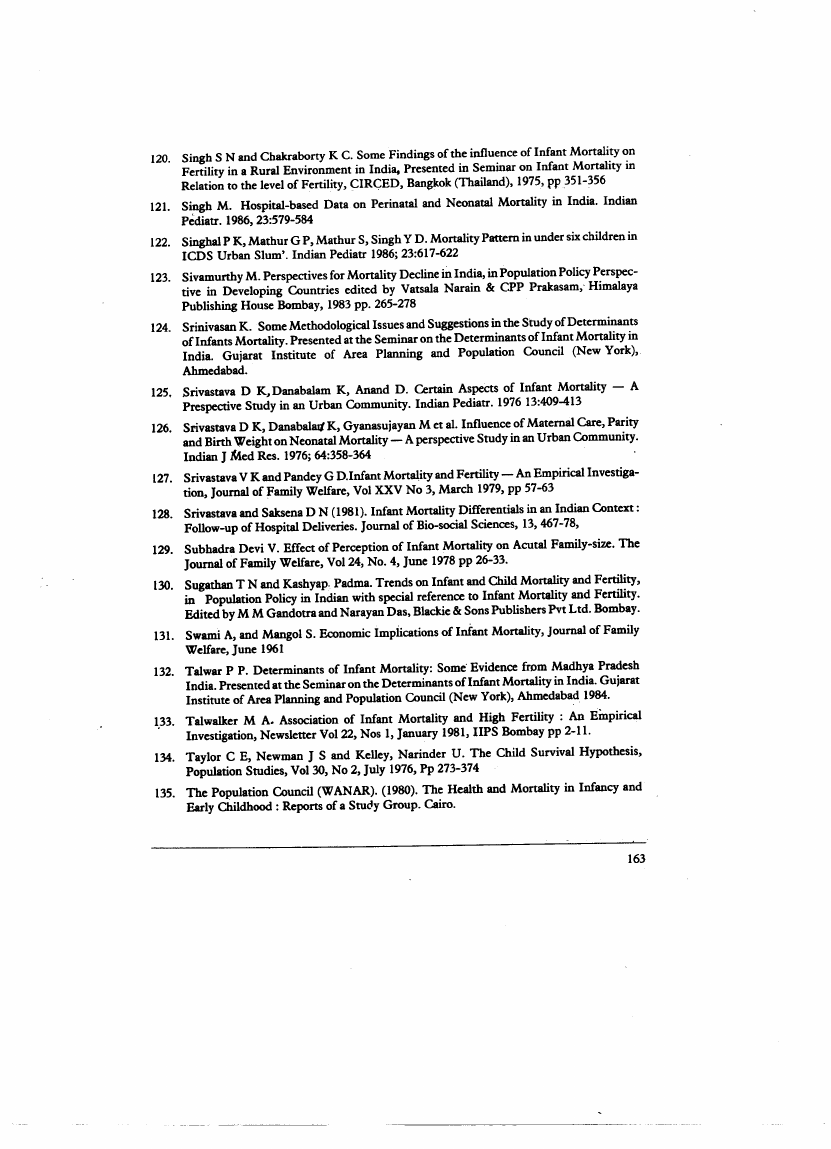
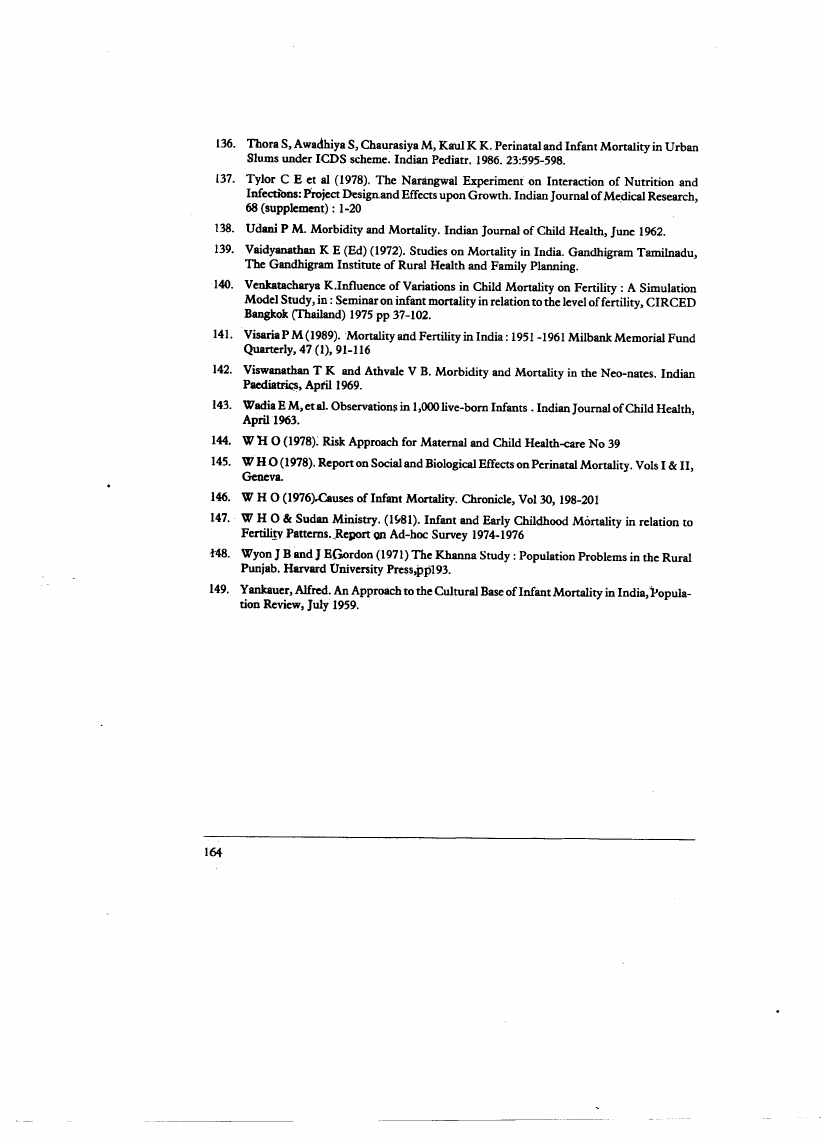
Infant Mortality Relation to Fertility FPF IDRC

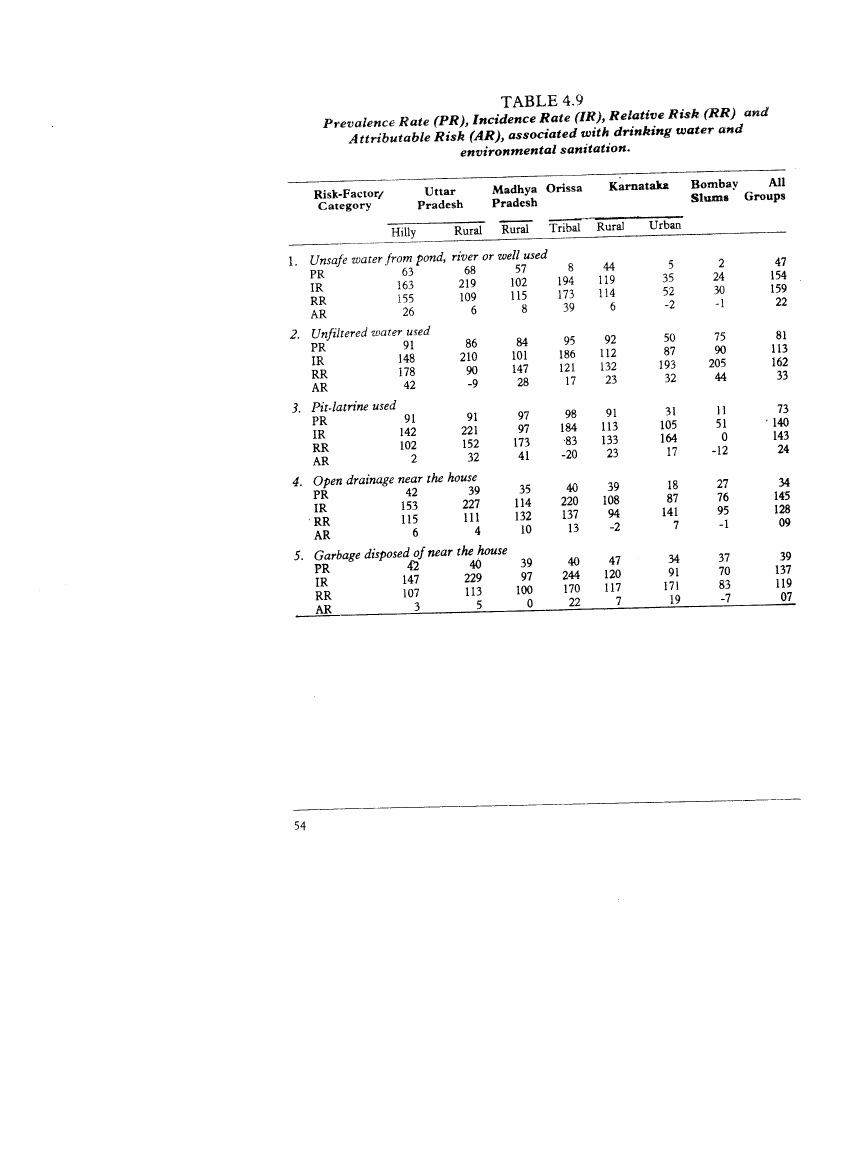
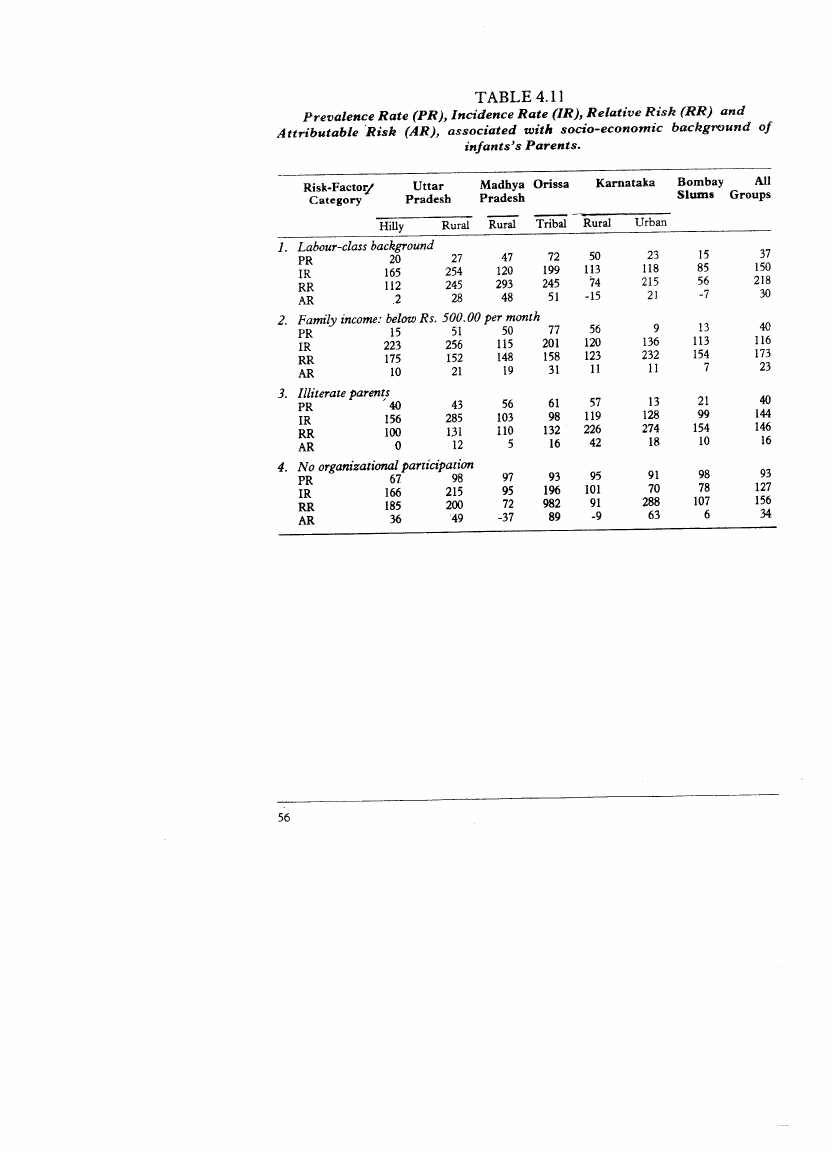
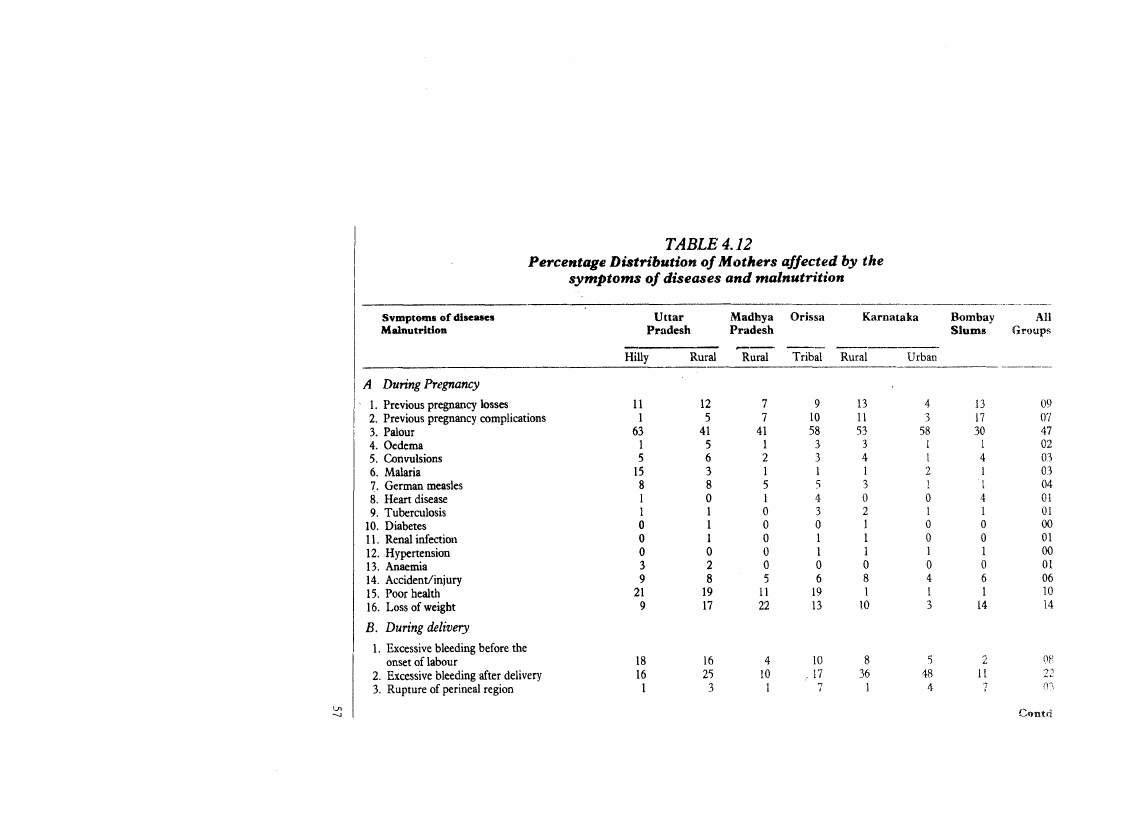
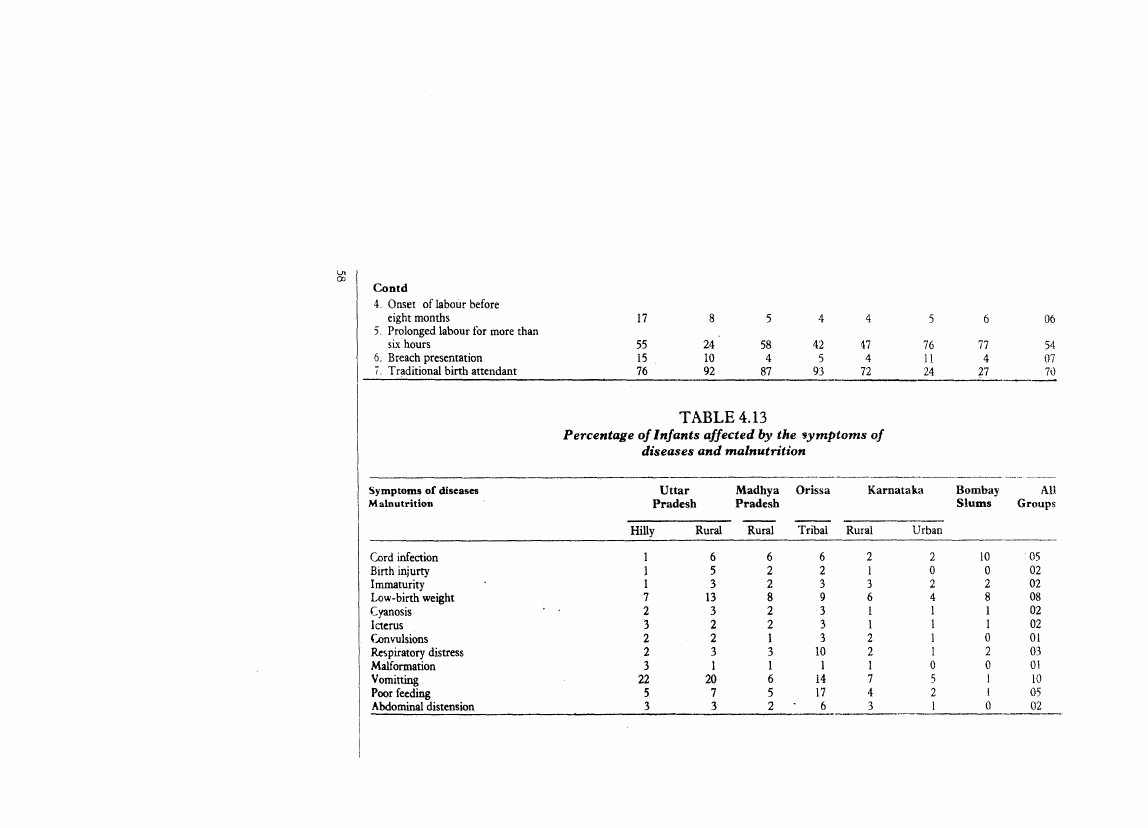
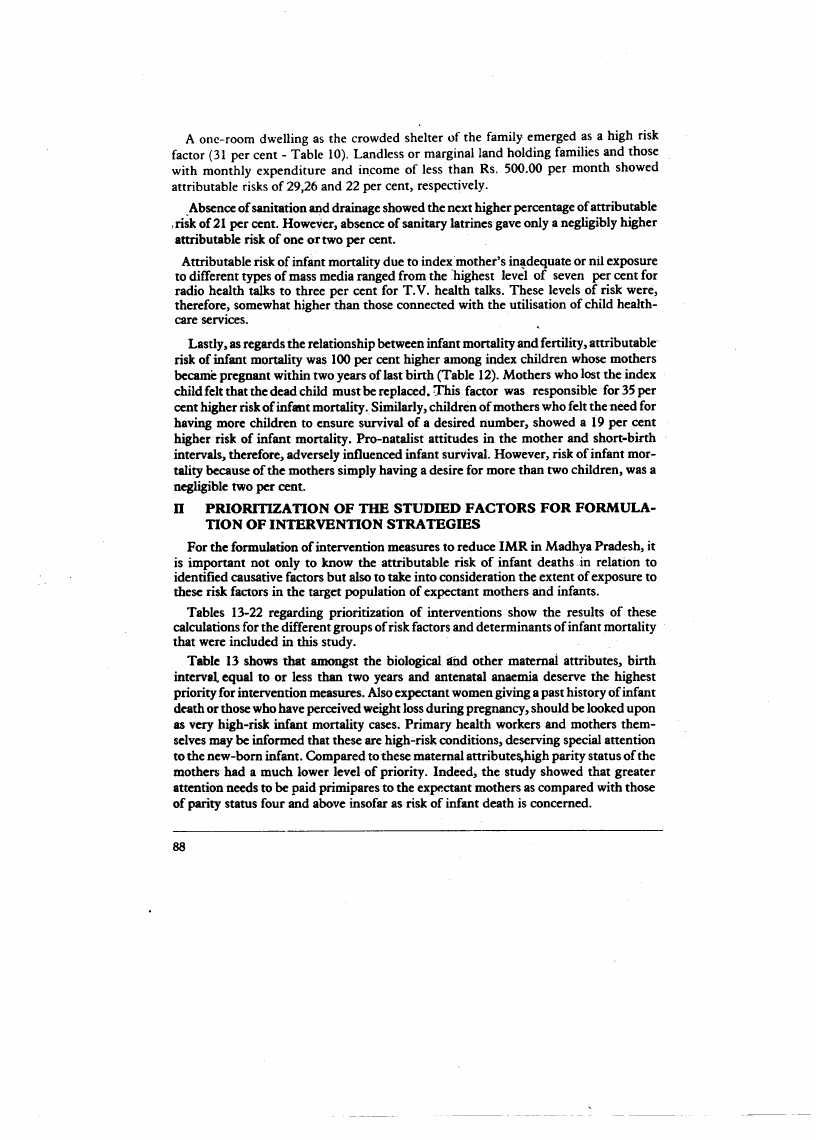
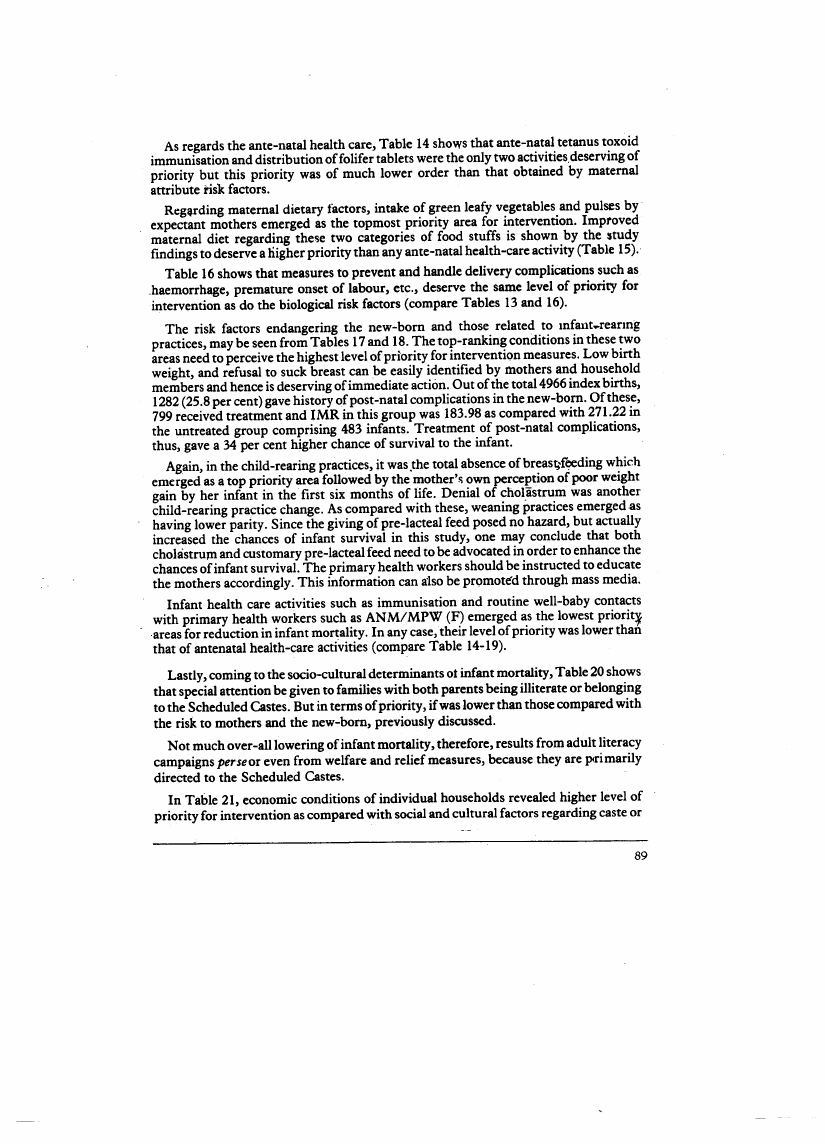
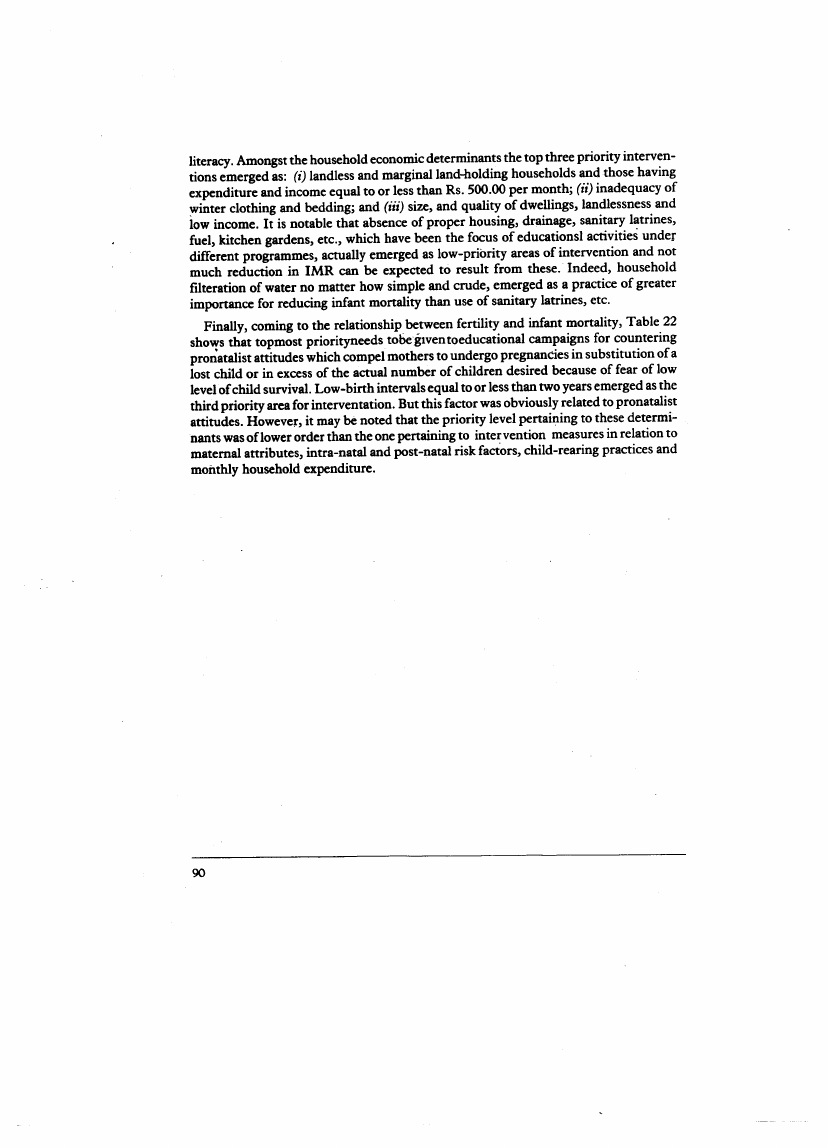
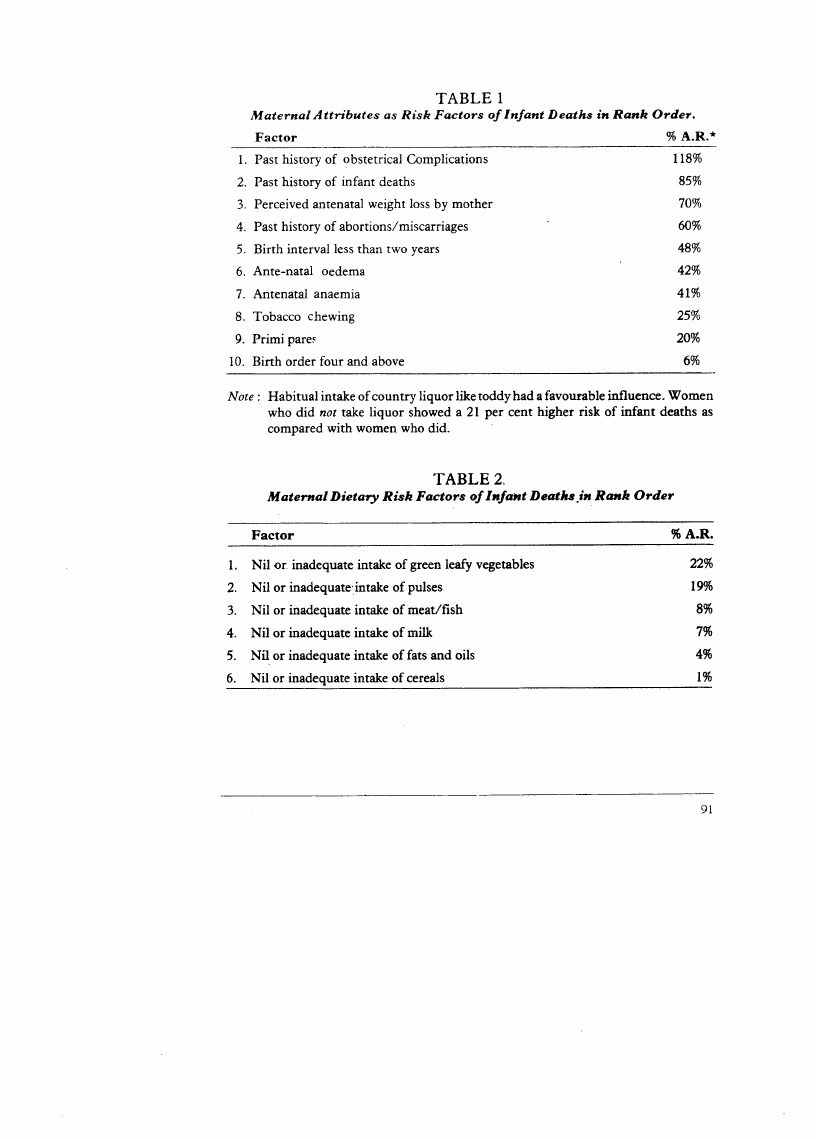
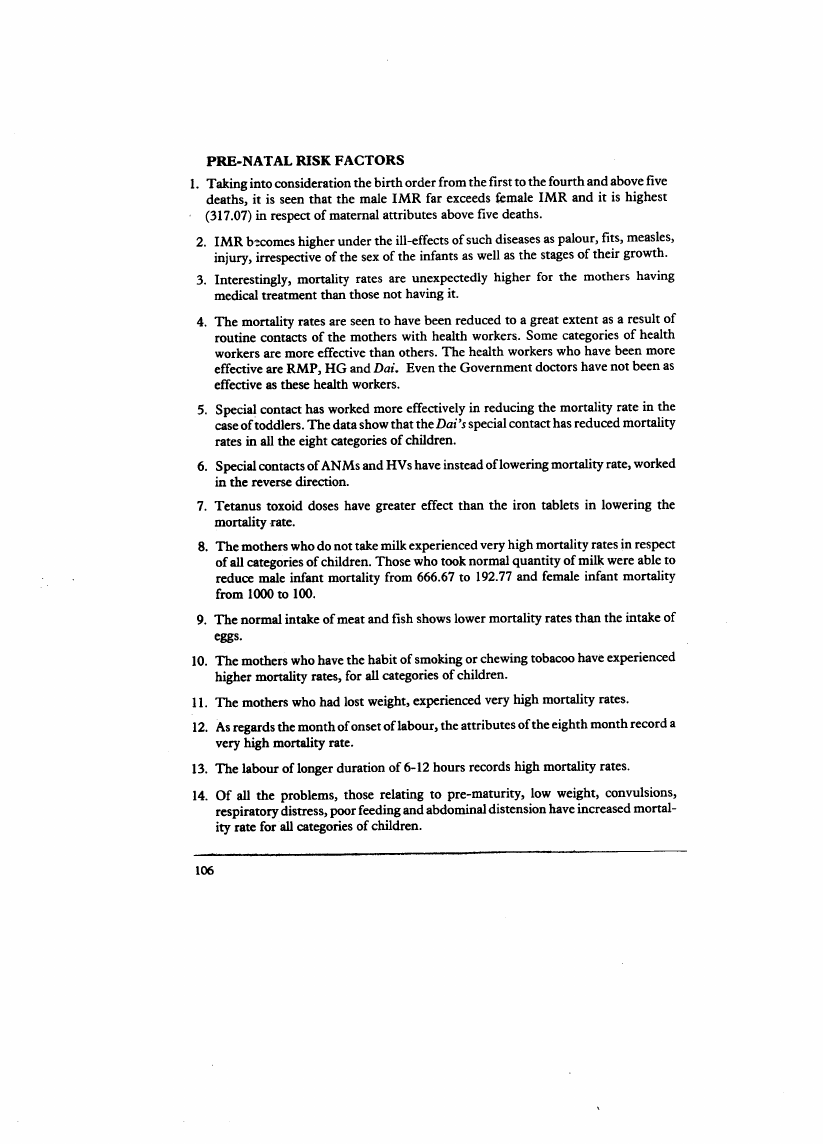
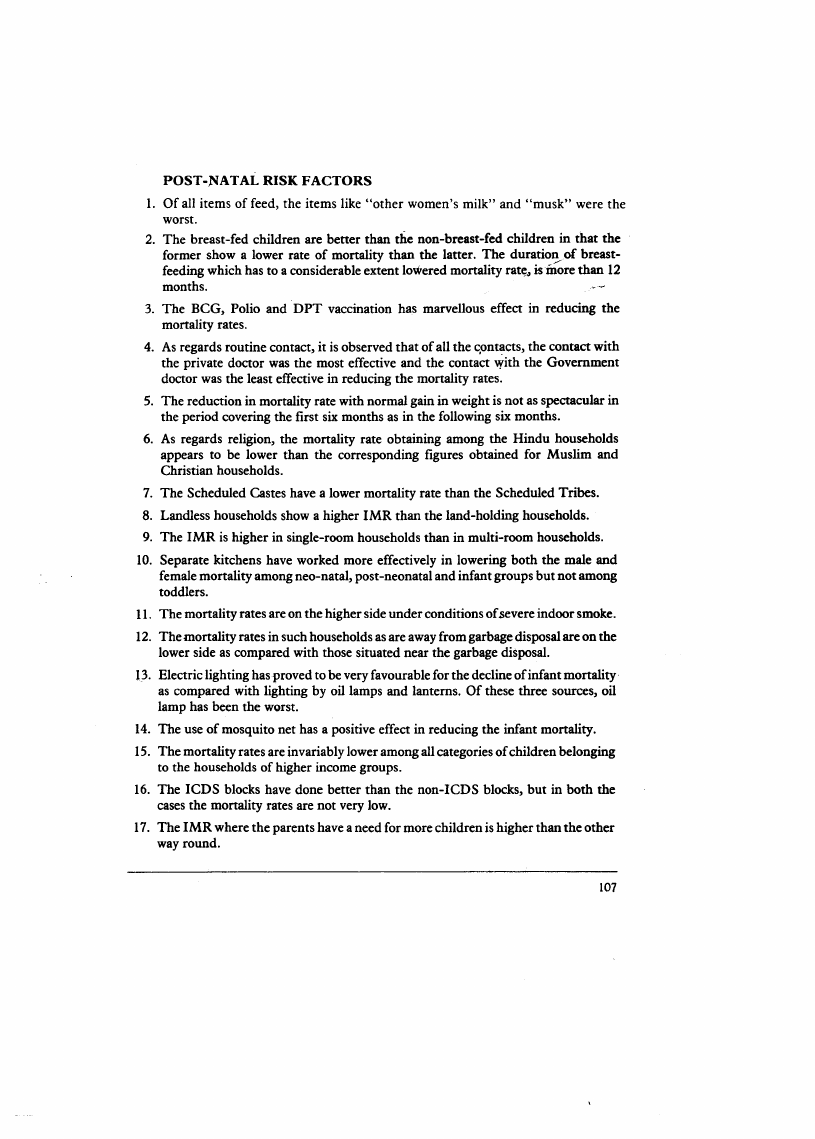
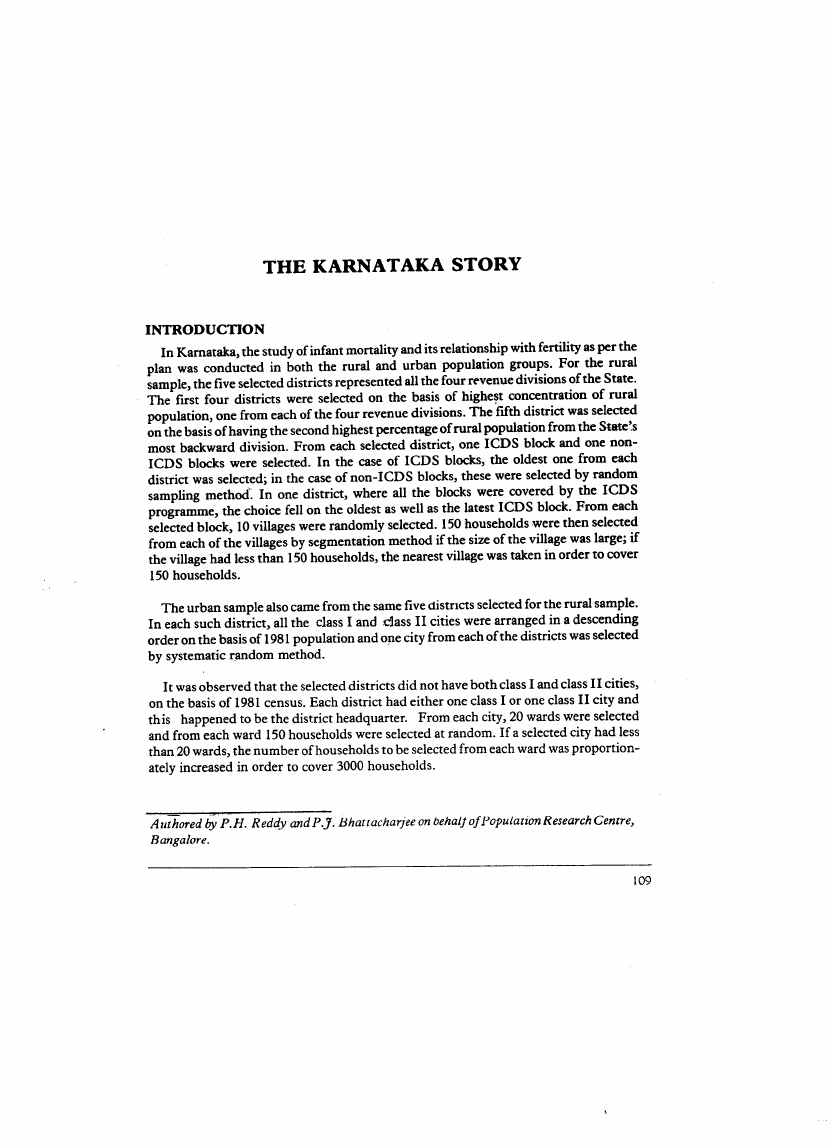
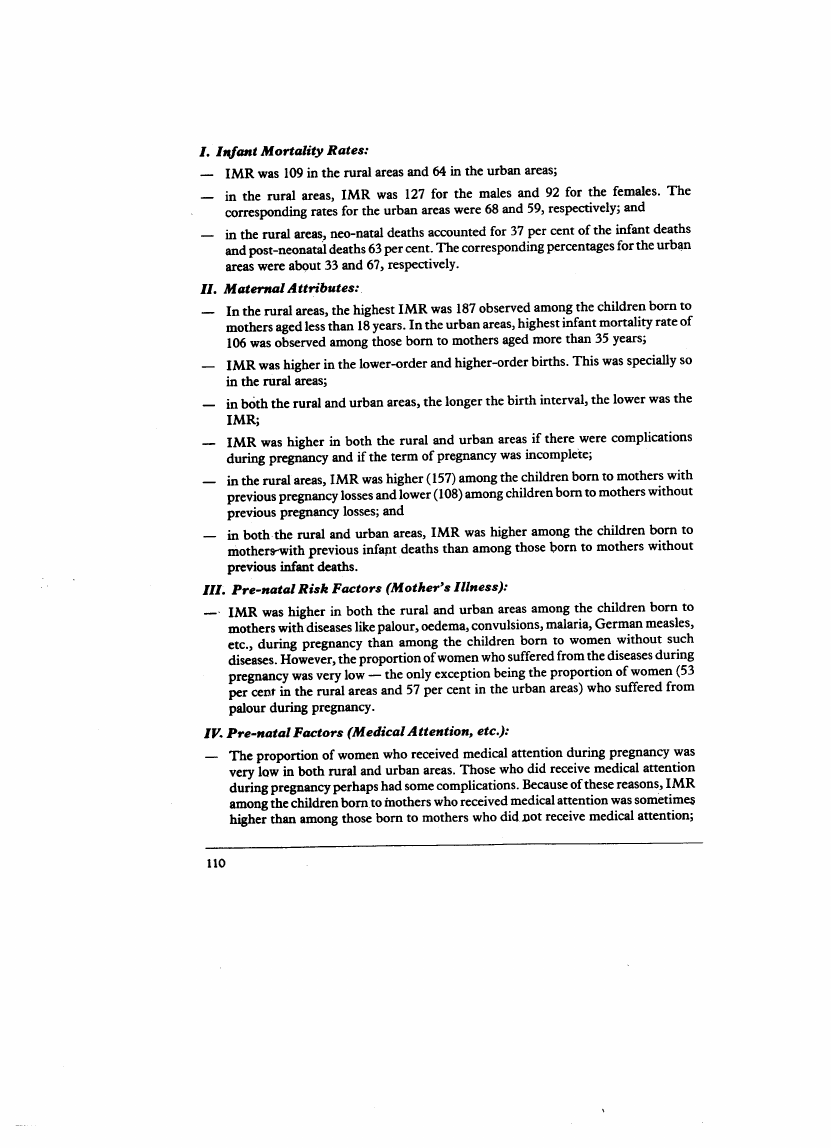
Infant Mortality Relation to Fertility FPF IDRC


1 Pages 1-10

▲back to top


1.1 Page 1

▲back to top


1.2 Page 2

▲back to top


INFANT MORTALITY IN
RELA nON TO FERTILITY
Major Findings and Implications
FAMILY PLANNING FOUNDATION
B-28 INSTITUTIONAL AREA, NEW DELHI-I 10016

1.3 Page 3

▲back to top


All rights reserved. No part of this book may be reproduced or utilised in any form or by any
means, electronic or mechanical, including photocopying, recording or by any information
storage. Howe~er scholars and researchers can draw upon this material after acknowJcdging the
source.
and printed by
MIs. Vircndra Printers, 2216 Hardman Singh Road.
Karol Bagh, NEW DELHI-llOOO5.

1.4 Page 4

▲back to top


Reduttion of infant mortality has. always been regarded an important objective of
health policy everywhere. For quite some time now Population strategists in India have
been alive to t~ -role played by high infant mortality in determining lev~s of fertility.
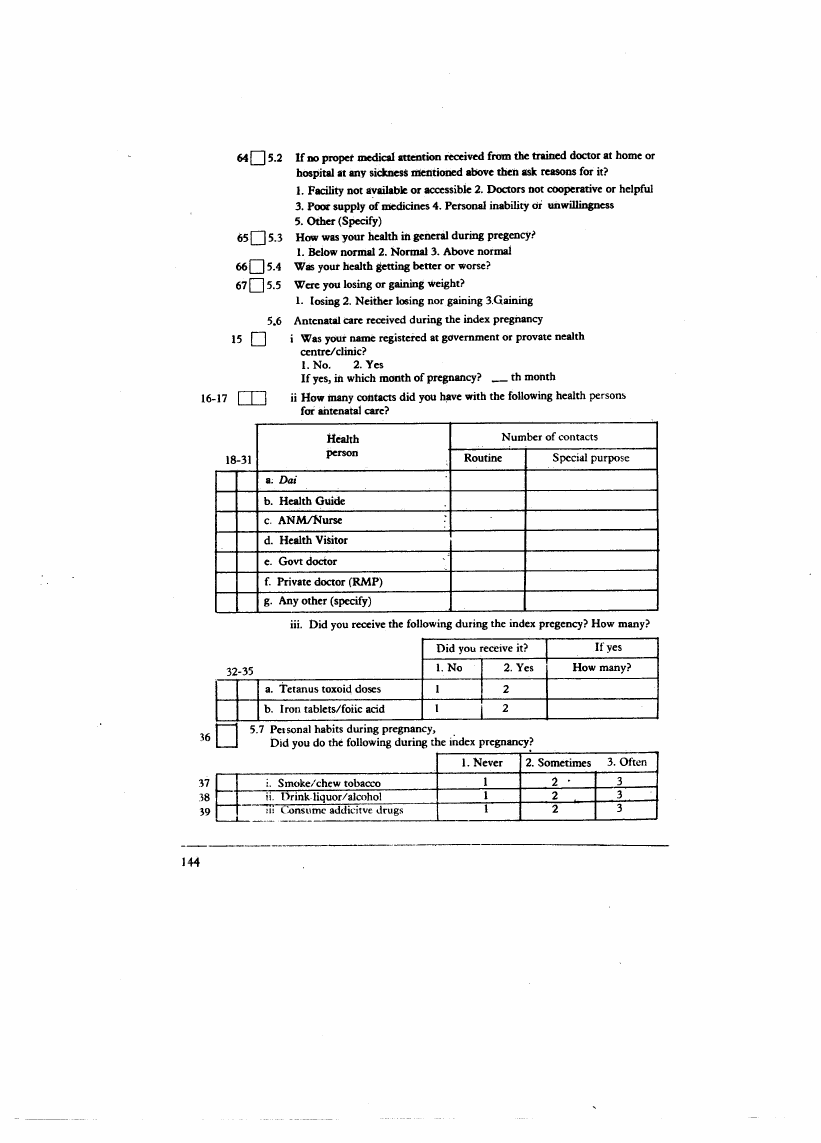
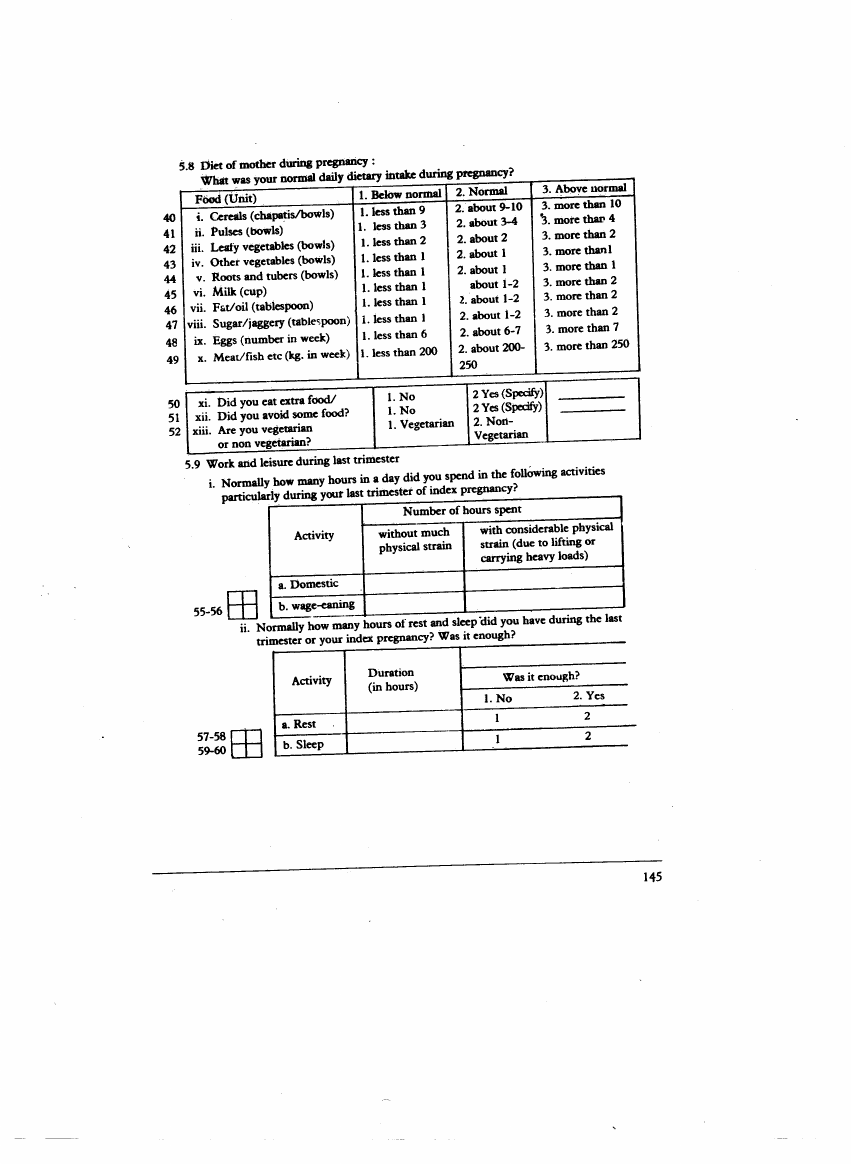
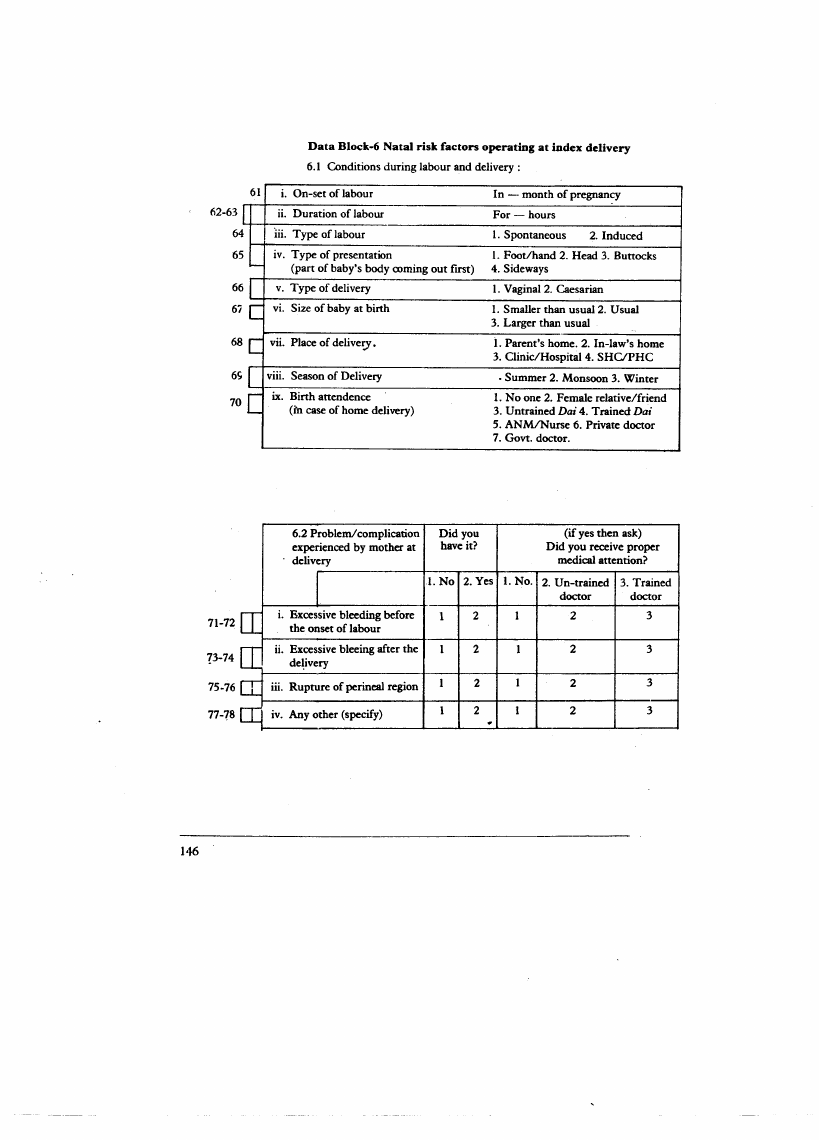
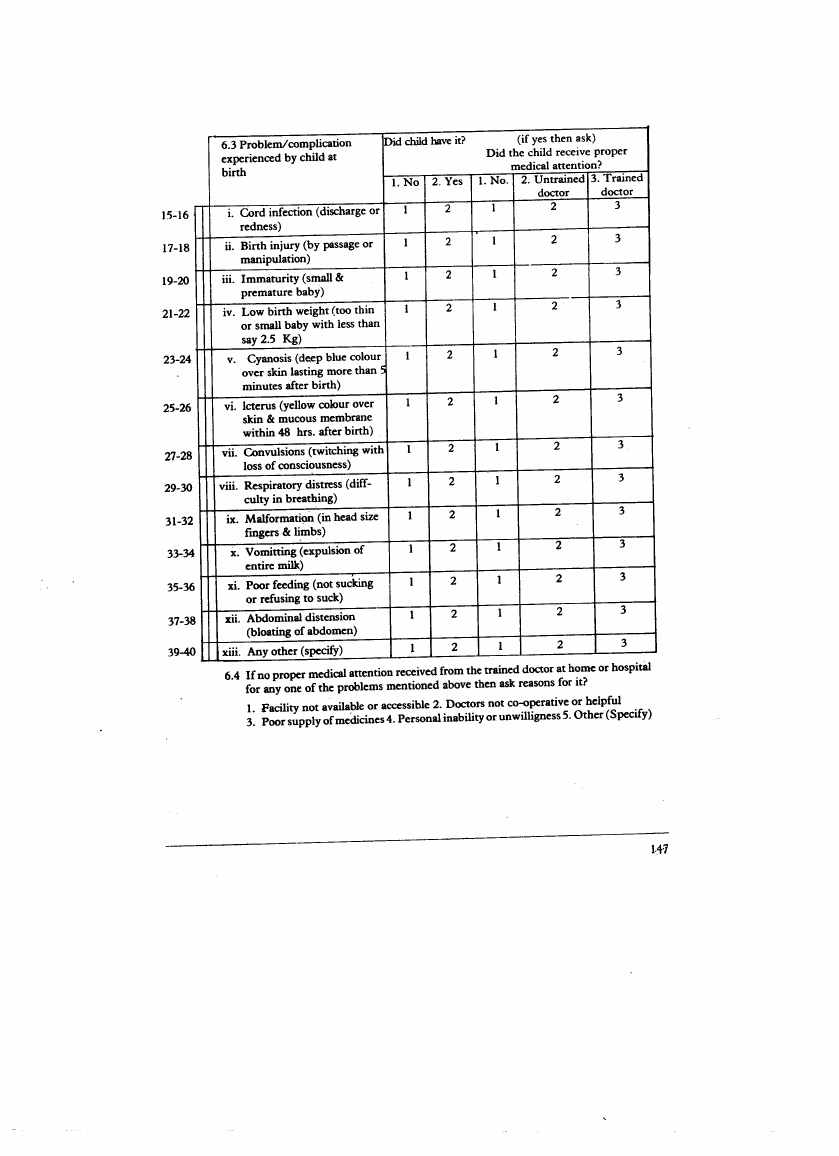
There is a growing appreciation of the fact that child survival alone can ~ercome the
natural desire for more children. Infant mortality rates have been coming down but very
slowly. Besides, conditions are far from ideal in large parts of India. When one out of
every eight infants born still dies before it reaches the age of one, fertility factors do get a
hidden push.
The distressing reality is that out of the 26 million children born in India, some 2.5
million die every year, before they live through the fust year and nearly eight million
disappear before reaching the ag~ of five, 64 per cent of infant deaths taking place within
one month of birth and .51 per cent within one week of birth.
Almost a similar situation prevails in the rest of the developing world. As noted in the
UNICEF State of the World's Children Report 1991, "a great many of the 40,000
children who die each day in the develOping world, are children born to mothers who are
young~r than 18 or older than 35, or those who have had a number of children already, or
who have given birth in less than two years after the previous delivery."
Analysis of these crucial factors should convince our health administrators and
policy-makers that a comprehensive programme of curbing, infant mortality and
promoting child-spacing could alone bring about a significant change in the ,population
icenario.
, Worldwide, maternal deaths are currently estimated at 500,000 per year and the
number of abortions estimated at more than 100,000 every day-a sure indication of
limited contraceptive protection.
Having noted that high IMR acts as a deterrent to a wider adoption of family
planning, the Governing Board ofthe Family Planning Foundation decided in March
1986 that a major study be undertaken to focus on the disturbing reality of high infant
mortality in India and the equally worrying fact of increase in neo-natal IMR. It was felt
that if proximate determinants of high'IMR as well as attributable risk factors operating
at pre-cooception, perinatal an4 pO~tnatal stages as well as those acting perenially could
be identified, it would ~tlyhelp not only in understanding the nature of the complex
problem but also in devising suitable solutions.
Thus, the search for answers t~ ~sic problems prompted us to design a broad-
s~m
,assessment of the entitt;-renge of envijOnmental and societal factors well

1.5 Page 5

▲back to top


beyond the obvious health factors, so that after obtaining hard evidence, a realistic
programme of interventions to reduce infant mortality and consequently to hasten the
decline of fertility, could be formulated.
The International Development Research Centre of Canada, which has been in the
avant-garde of path-fmding research in the developing world, promptly agreed to
collaborate with the Family Planning Foundation in the contemplated action research
project, aimed at a clear identification of complex networks of inter-locked risk factors
that directly or indirectly influence conditions of survival of infants and the real nature
of the close nexus that exists between infant mortality and fertility.
It may be stated with modest pride that this study was at once oomprehensive and
uniqu~, relying upon a very large .sample and integrating medical and sociological
approaches. The study was conducted in 38 population se,pnen~ in five States, most of
which were facing the problem of slow decline offertility. TIle sample included five
rural.andthree hilly distric~ of Uttar Pradesh; 10 rural and tribal district! of Madhya
Pradesh; five rural and tribal districts of Orissa; five districts (with interlocked sample of
rural and urban areas) of Karnataka and 10 large slums of metro Bombay. To evaluate
the impact of modernising developments, both ICDS and non-ICDS blocks were
chosen. Th~ total sample thus structured covered 114,000 house-holds. Besides, the
situation analysis included a study of the workers involved in a variety of health
programmes.
The consolidated report based on the reports relating to the five States (summarised
versions appear in this volume) so ably compiled by Dr. B.a. Patil,Projeet Director,
presents a picture which is as varied as it is revealing.
It brings out the fae: that theprol-lem is not only serious but that it varies from areato
area, calling for global philosophy but disaggregated strategies anacking specific risk
factors. The study has also done well to throw light on the region-wise variations as well
as on the tradi tional and institutional factors which continue to hold back any significant
progress towards controlling maternal and child morbidity.
The findings of this study were discussed in a National Seminar on June Iand 2, 1988,
which-was presided over by Mr. J.R.D. Tata, Chairman, Family Planning Foundation,
and a visionary committed to the philosophy of promoting health welfare through family
planning. It was attended by some very knowledgeable national and international
scholars and health··policy strategists, who added important dimensions to the debate by
emphasising that the Agenda for Action should receive serious attention not only at the
hands of the governments of the five States, where the research project had been located,
but also by the nation as a whole because unless we succeed in reducing infant and
maternal mortality and controlling fertility in a foreseeable time-frame, the health policy
goals set out in the Alma AtaDeclaration, fully endorsed by India, will not be achieved.
I wish to thank the eminent scientists and scholars who advised the Project Director,
through various stages of developing a research design and the four questionnaires used

1.6 Page 6

▲back to top


for collection of data, the heads of the five institutions of national importance, who had
undertaken to carry out comprehensive investigations and professional consultants like
Mr. Bhatia and Mr. Gandhi for their valuable assistance in Data processing. Our special
thanks are due toMr. Vijay G. Pande, Regional Director, IDRC, New Delhi and Dr.
Susanne Mowat, Social Scientist, IDRC, Canada, who devoted such great care to the
development of the project and supported it all along.
The report is a virtual treasure-house of valuable information which not only deserves
extensive use for designing effective and replicable interventions but also for developing
further research initiatives. The Foundation hopes that the finding will continue to
stimulate academic and professional interest and go a long way towards a fuller
understanding of complex phenomena of infant mortality and fertility.

1.7 Page 7

▲back to top


CHAPTER ONE:
I:
II:
INTRODUCTION
Present Status
Project Objectives
Tables and Figures 1.1 to 1.5
CHAPTER TWO:
2.1:
2.2:
2.3:
2.4:
2.5:
METHODOLOGY
Risk Approach
Population Groups
Sampling design
Schedules
Range of Variables
Analysis Plan
CHAPTER THREE : ANALYSIS OF PROFILES
3.1 :. Profile of Communities
3.2: Profile of Health Workers
Table 3.1 to 3.4
CHAPTER FOUR:
4.1:
4.2:
4.3:
4.4:
4.5:
4.6:
4.7:
4.8:
4.9:
4.10:
ANALYSIS OF RISK FACTORS
Risk Analysis
Maternal History
Maternal Health & Diet
Pre-natal Care
Perinatal Factors
Post-natal Factors
Environmental Factors
Socio-Economic Factors
Fertility Factors
Path Analysis
Tables 4.1 to Table 4.16
3
3
5
7-15
25
25
26
27-30
31
33
34
35
35
36
37
39
40
40
45-62

1.8 Page 8

▲back to top


CHAPTER FIVE: SUMMARY AND FINDINGS
63
5.1 : Purpose and Concern
63
5.2 : Unique Feature
63
5.3 : Coverage and Sampling
64
5.4 : Analysis of Profiles
64
5.5 : Analysis of Risk Factors
65
CHAPTER SIX: AGENDA FOR ACTION
70
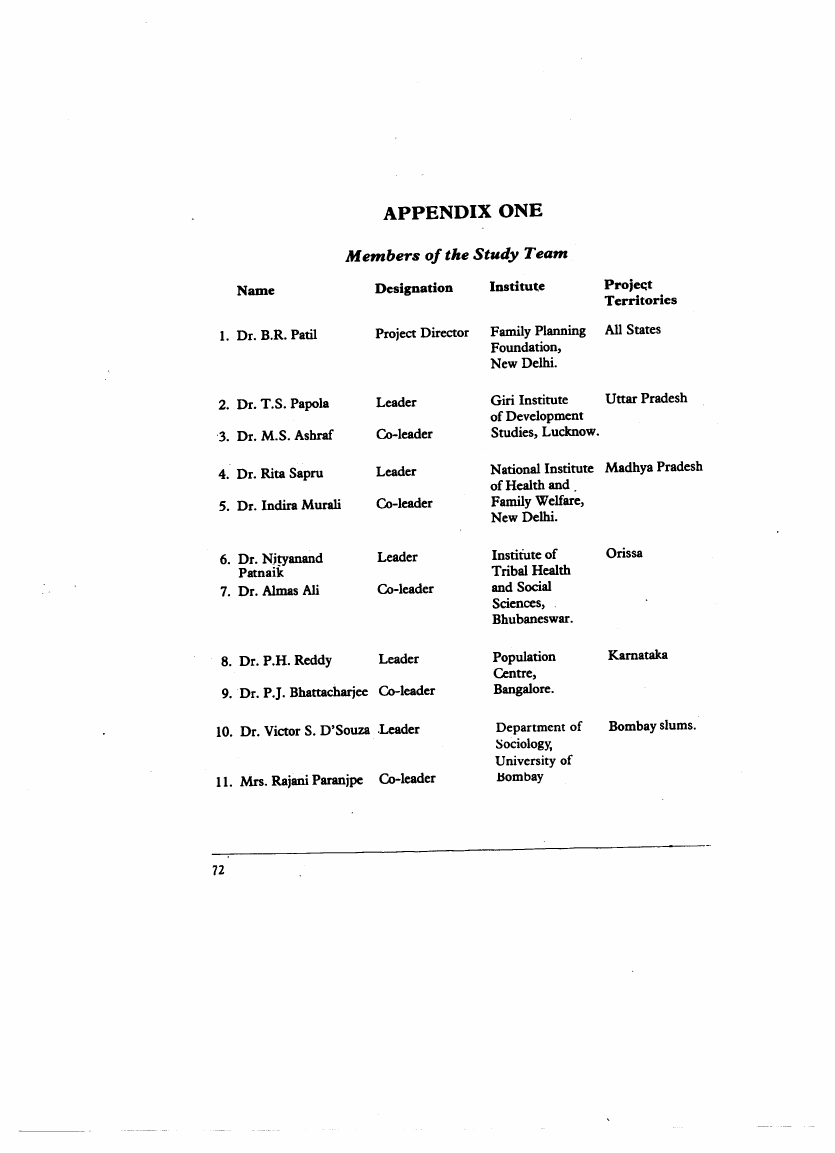
APPENDIX I: Members of the Study Team
72
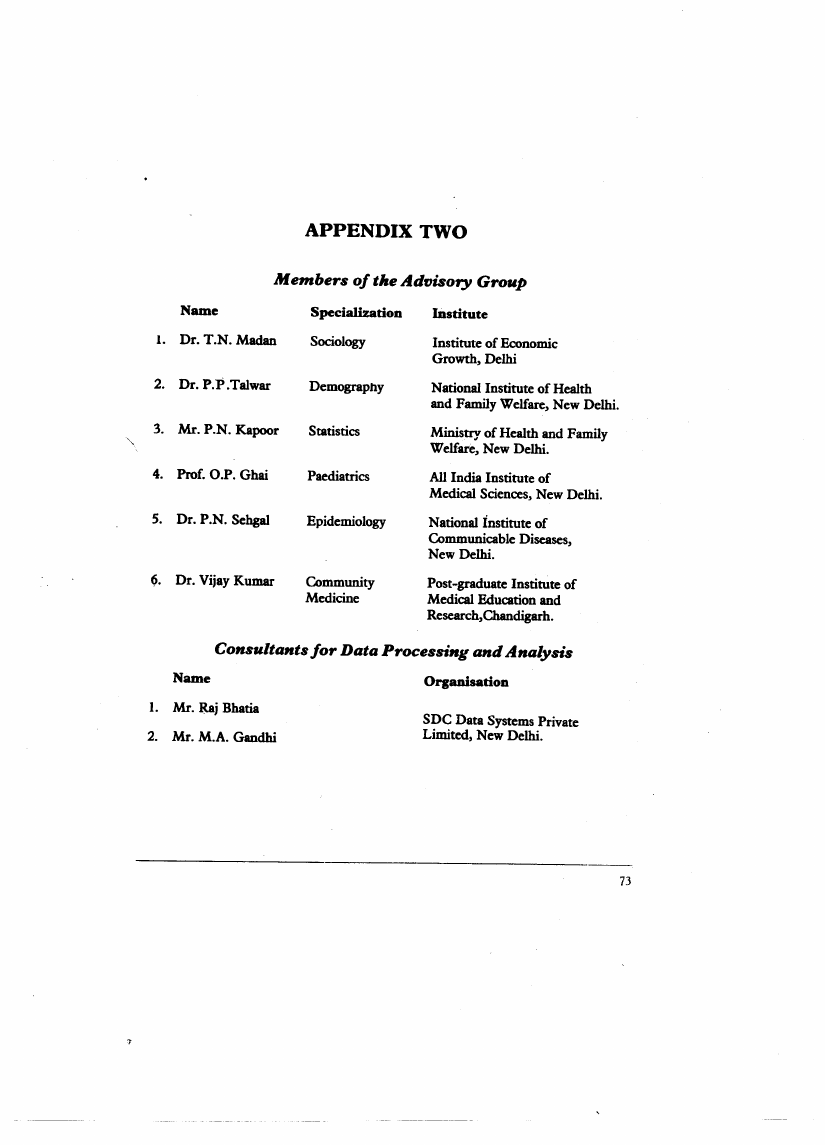
APPENDIX II : Members of the Advisory Group
73
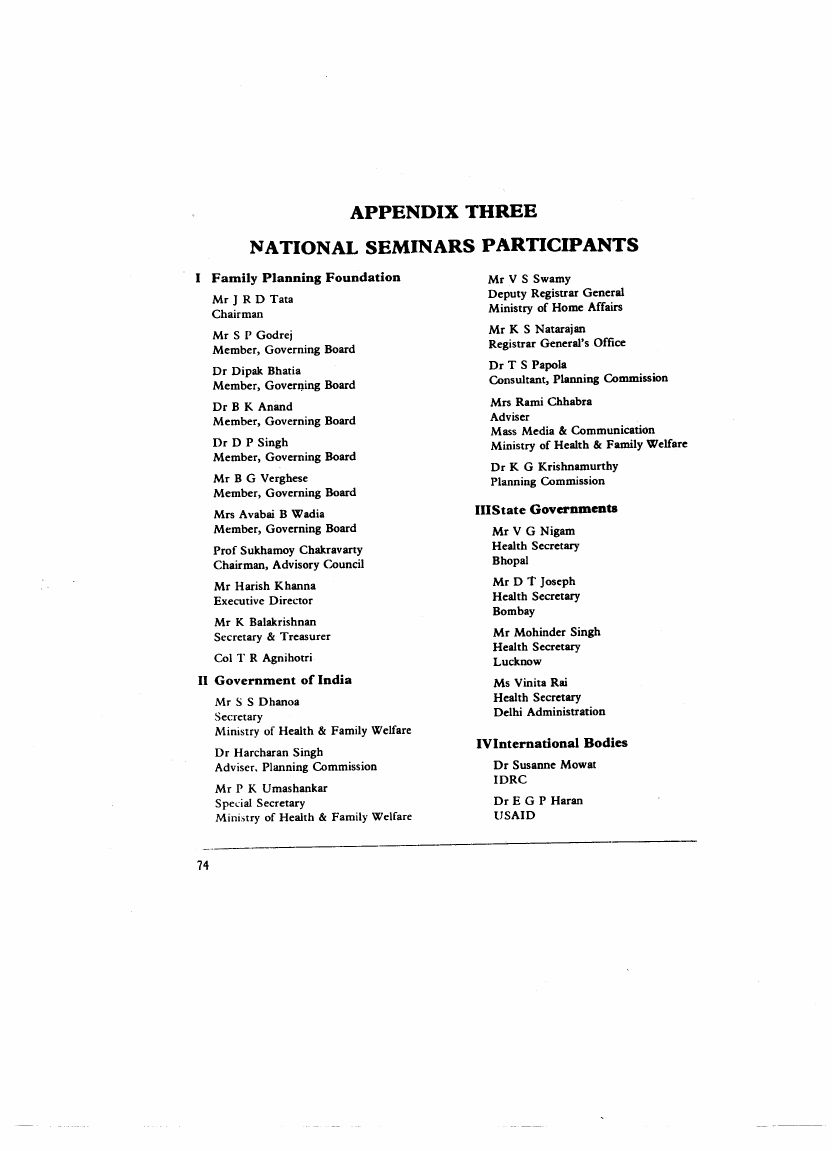
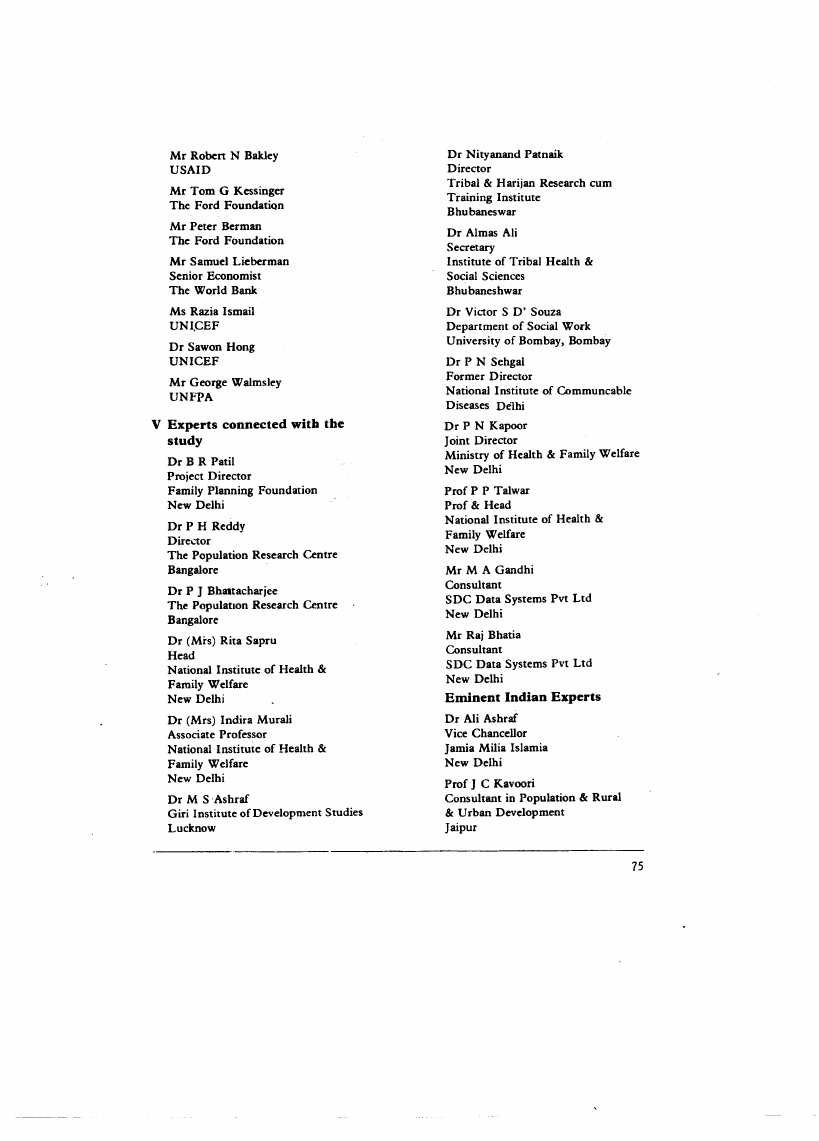
APPENDIX III : National Seminar Participants
74
SECTION B
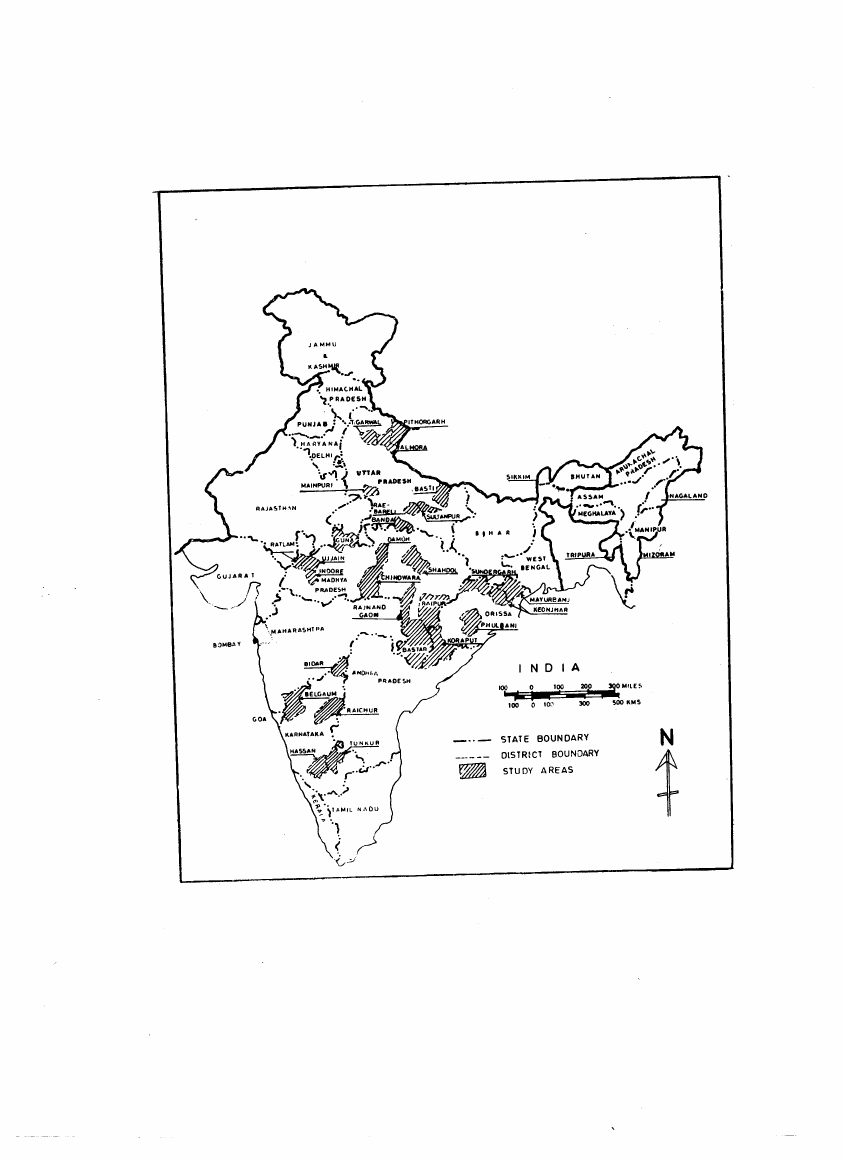
MAP showing Blocks/Qusters Covered 78
I : The Uttar Pradesh Story
79
II: The Madhya Pradesh Story
with 22 tables
85
III : The Orissa Story
102
IV: The Karnataka Story
109
V: Picture in Bombay Slums
115
SECTION C
Schedule I
127
Schedule II
130
Schedule III
135
Schedule IV
138
Select Reading
156

1.9 Page 9

▲back to top


SECTION A;"

1.10 Page 10

▲back to top


The chapter falls into two parts. The first part deals with the present status of the
problem of infant mortality in India. In the second part are stated the objectives
underlying the IDRC-FPF project launched in April, 1986 to study the problem in
some depth. This has to be so because both these parts are bound together in a
cause-and-effect relationship.
I PRESENT STATUS
Next to China, India has the largest population in the world. Today it is around 800*
million. World's 16per cent, Asia's 28 per cent and South Asia's 71 per cent population
lives in India. World's largest number of births (over 26 million), deaths (over 9 million)
and infant deaths (over 2.5 millions) take place in India, each year.
. India's population is rapidly growing at the rate of 2.1 per cent per annum. As a
resul:, net 17 million are added to India's population each year, that is to say, one
Bhutan every month; one Sri Lanka or Nepal or Mghanistan every year; and one BangIa
Desh or Pakistan every six years.
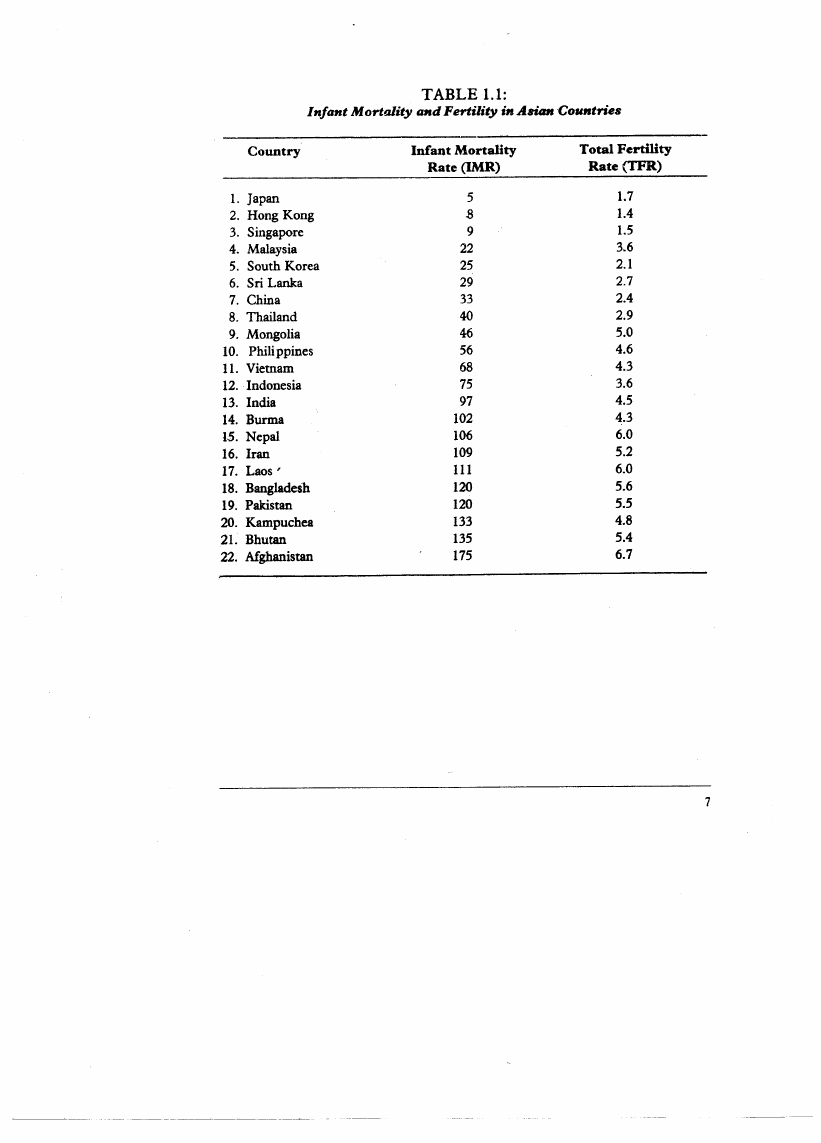
In Table 1.1 (see page 7 ), Asian countries are arranged in an ascending order on
the basis of incidence of infant mortality and corresponding fertility rates. Both the rates
are distressingly high in India. The infant mortality rate was as high as 97 in 1985 as
compared to five in Japan, 22 in Malaysia, 29 in Sri Lanka and 33 in China, and the total
fertility rate was as high as 4.5 in 1984 as compared to 1.7 in Japan, 2.1 in South Korea,
2.4 in China and 2.7 in Sri Lanka. These countries can be divided into three groups:
(1) The countries with infant mortality rate (IMR) less than 45 and total fertilitY rate
(TFR) less than three; (2) the countries with IMR between 45 and 105 and TFR
between four and five; and (3) the countries with IMR above 105 and TFR above five.
India belongs to the second group which means that it is at least 25 years behind the ftrst
group!
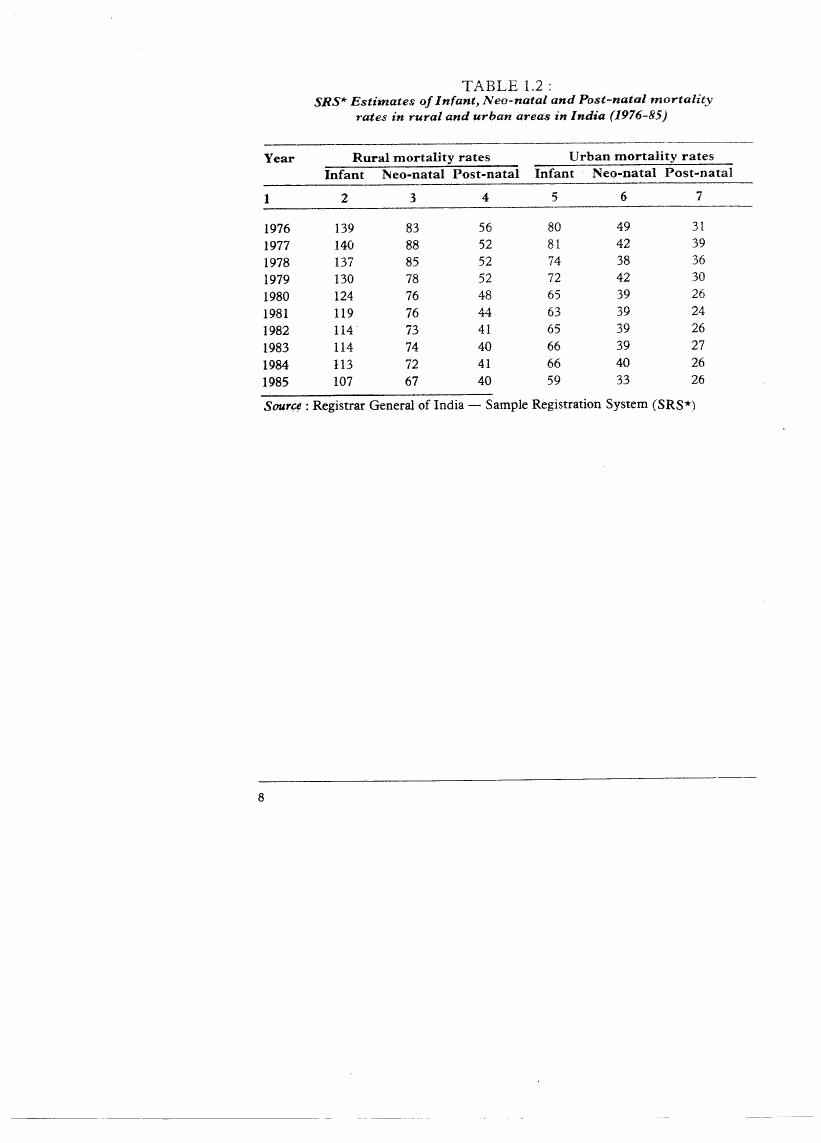
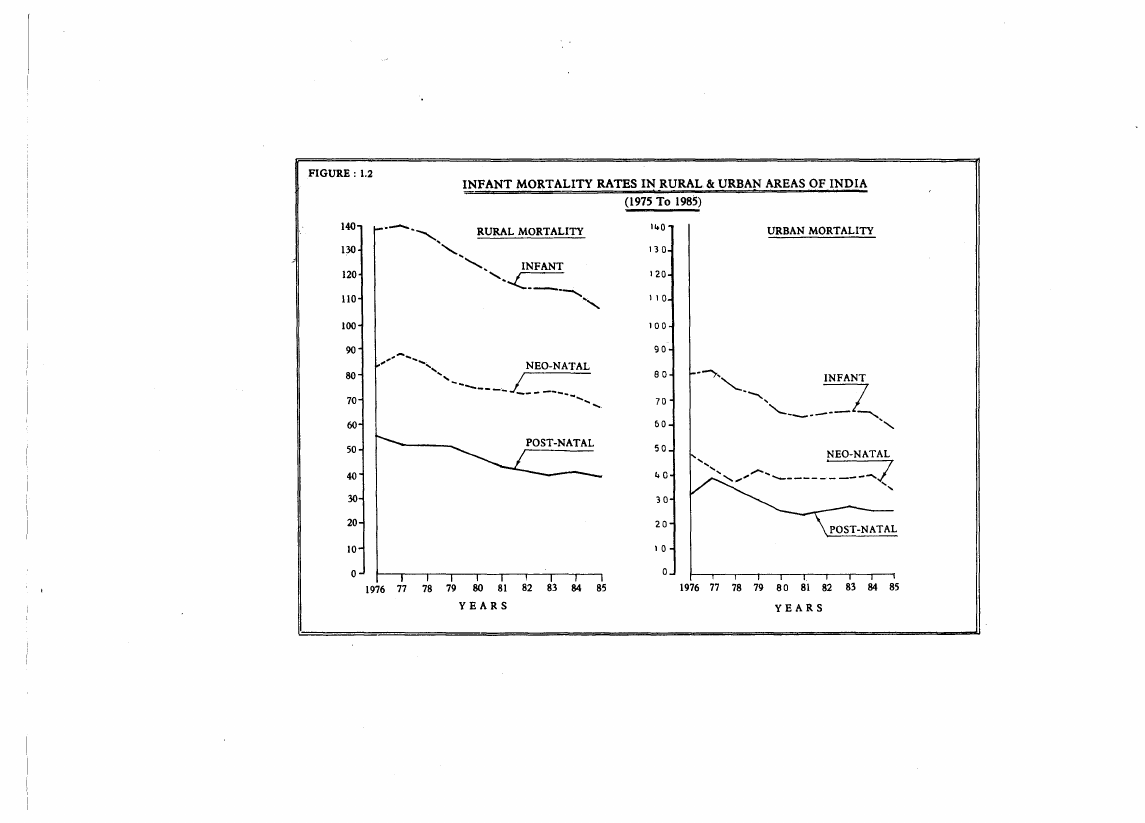
Table 1.2and ftgure 1.2 ( pages 8 and 9) show the latest trend ofIMR along with its
neo-natal and post-natal components during 1976-85, both in the rural and urban areas,
according to the Sample Registration System of the Registrar General of India.
AnalYsis shows some disturbing trends. These are:
1. The rural IMR is almost two times the urban IMR;
2. the urban IMR declined from 80 in 1976 to 72 in 1979, and thereafter stagnated
around 66 up to 1984. It declined to 59 in 1985. The overall decline in urban

2 Pages 11-20

▲back to top


2.1 Page 11

▲back to top


IMR in 1985 as compared to 1976 was 26 per cent;
3. the rural IMR which was around 140 in 1976 declined to 124 in 1980 and
stagnated around 114 during 1982-84. It declined to 107 in 1985. The overall
decline in 1985 as compared to 1976 was 23 per cent;
4. neo-natal IMR (of those dying within one month from birth) declined in rural
areas from around 85 during 1976-78 to 76 ui 1980 and 73 during 1982-84. It
further declined to 67 in 1985. In the urban areas, neo-natal mortality rate
declined from about 43 during 1976-78 to 39 during 1982-84 and 33 in 1985. The
overall decline in neo-natal mortality in 1985 as compared to 1976 was 19 per
cent in rural areas and 33 per cent in urban areas; and
5. post-natal mortality declined in rural areas from 53 during 1976-78 to an average
of 40 during 1982-85. The overall decline during the period 1976 to 1985 was of
the order of 29 per cent though the post-natal mortality during 1982-85 has
stagnated around 40. In the urban areas, the decline in post-natal mortillity was
much slower; it declined from average of 38 during 1976-78 to 26 in 1985,
recording an overall decline of only 16 per cent during 1976-85. Post-natal
mortality seems to have been stagnant during 1982-85 whereas neo-natal
mortality has shown signs of decline.
Share of neo-natal mortality in the total IMR has increased from 53 per cent in 1970
to 64 per cent in 1983. Now almost 64 per:cent of infant deaths occur within one month,
57 per cent dying within one week of birth.
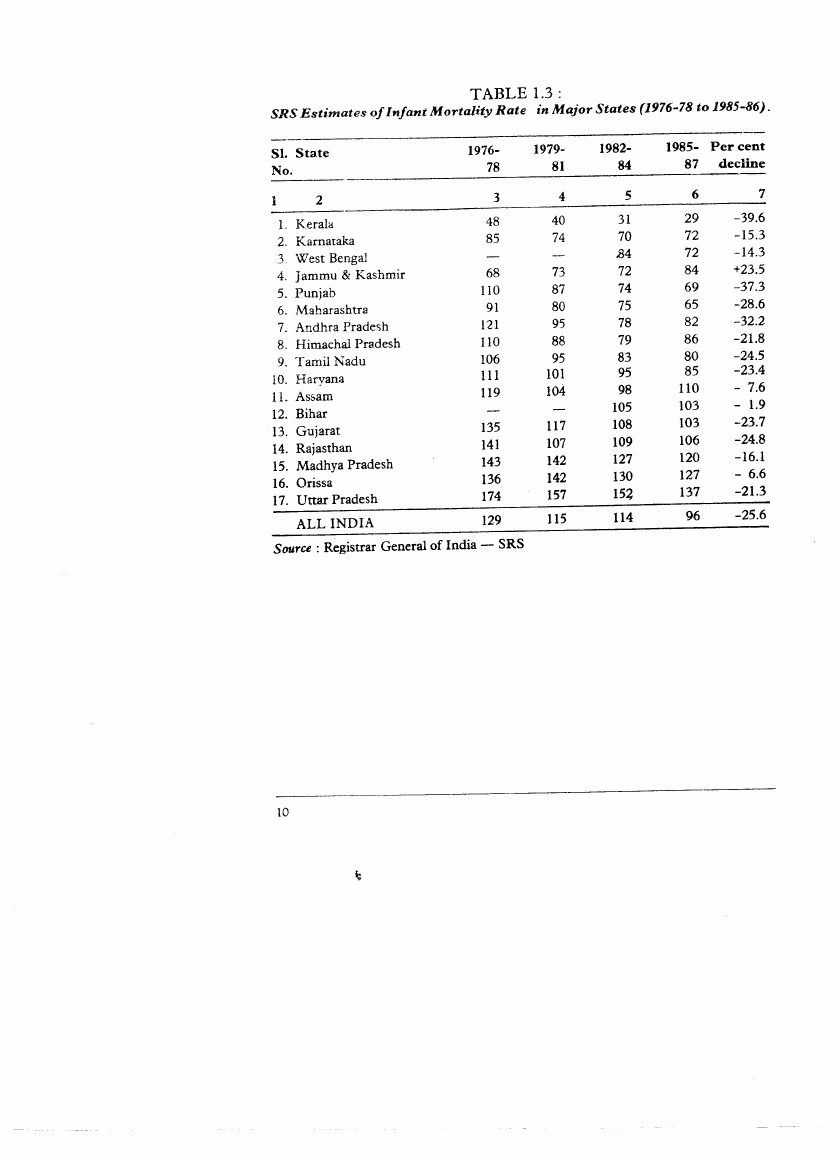
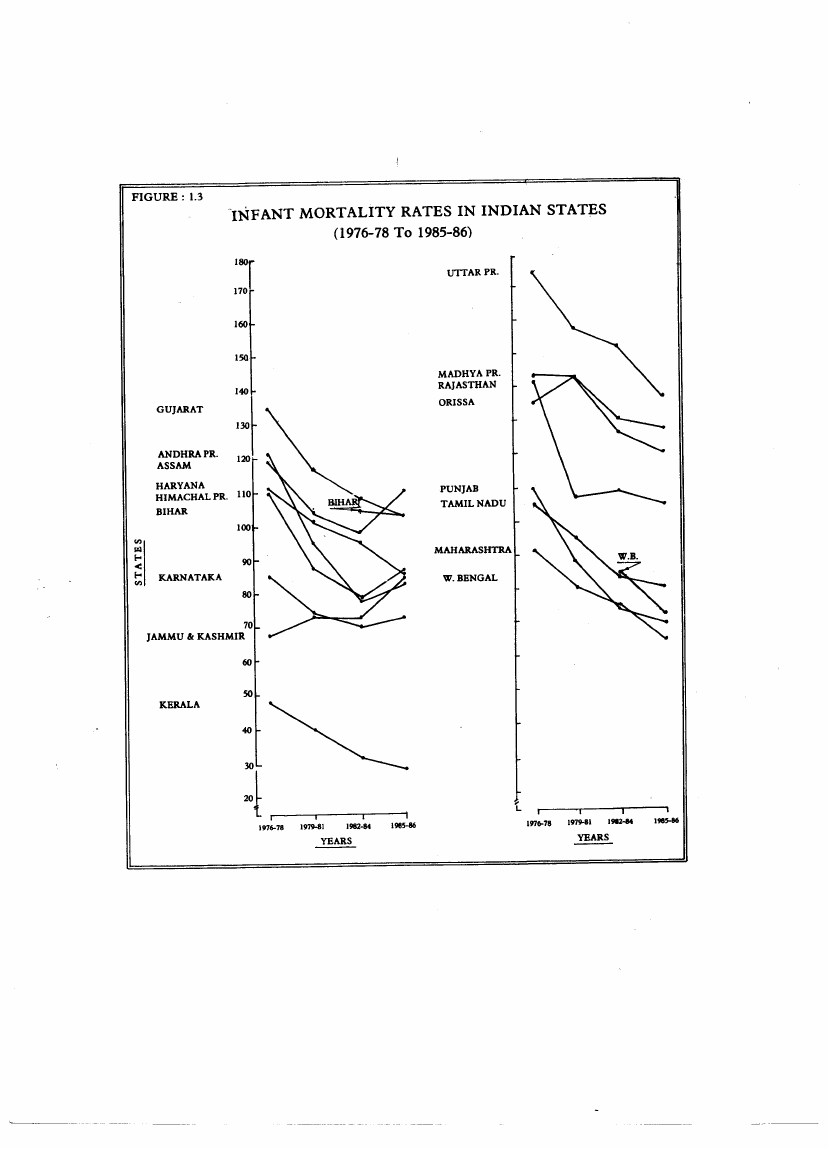
Table 1.3 and figure 1.3 (page 10 and 1I ) show State-wise trends of infant mortality
during 1976-78 to 1985-86, using 3-year averages, according to the Sample Registration
System. During this period, the infant mortality rate declined in all the 17 major States,
except Jammu and Kashmir. IMR declined by more than 30 pel' cent in the States of
Kerala, Punjab and Andhra Pradesh whereas the extent of this decline was below 10per
cent in the case of Assam, Bihar and Orissa. Further, the lowest IMR (29) was recorded
in Kerala and the highest (137) in Uttar Pradesh during 1985-86.
Table 1.3 and figure 1.3 (page 10 and 11 ) show Statewise trends of IMR during
1976-84, using 3-year averages. It shows:
(i) Only in Kerala, Karnatalta, Maharashtra, Tamil Nadu and Gujarat, the IMR is
consistendy and steadily declining;
(ii) in all other States, the IMR showed an upward trend· initially, followed by some
downward trend later on. Only in Jammuand Kashmir, the IMR is rising when in
all other States it is falling; and
(iii) after 1975, however, the IMR has,shown sharper decline in Himachal Pradesh,
Assam, Andhra Pradesh and Punjab as compared to other States.
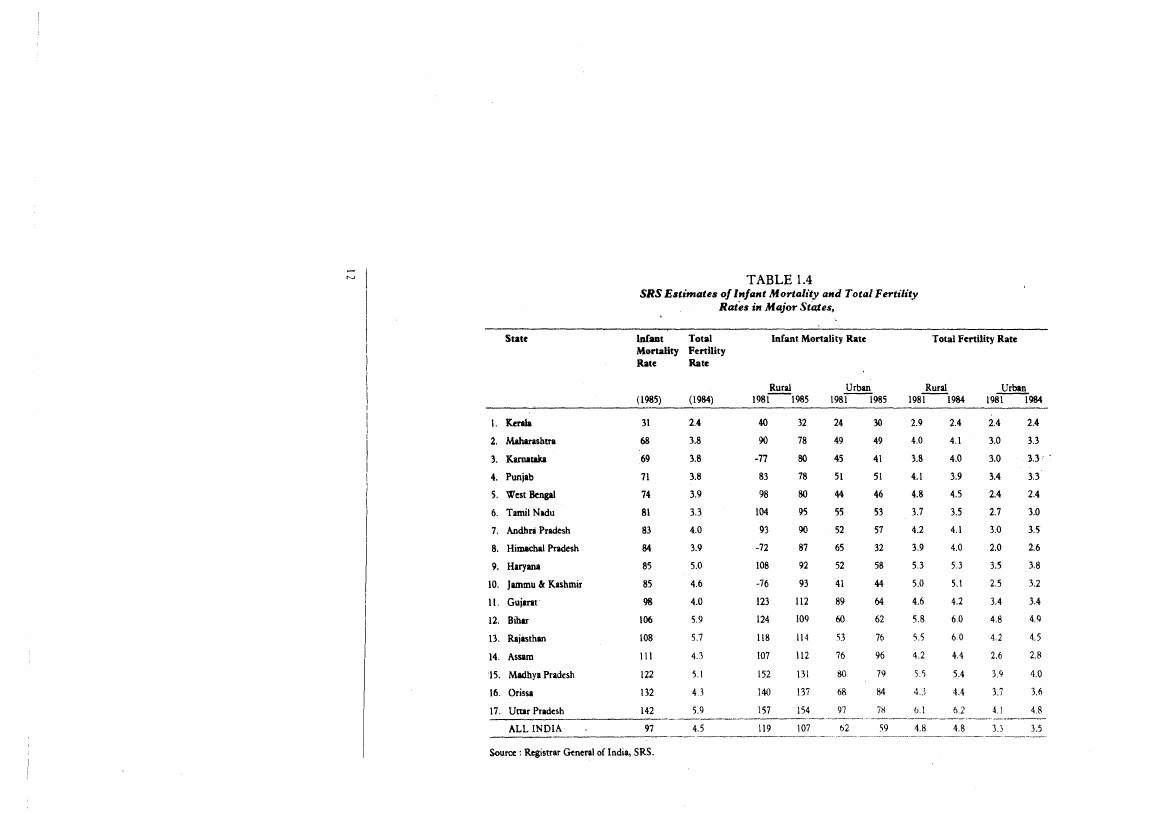
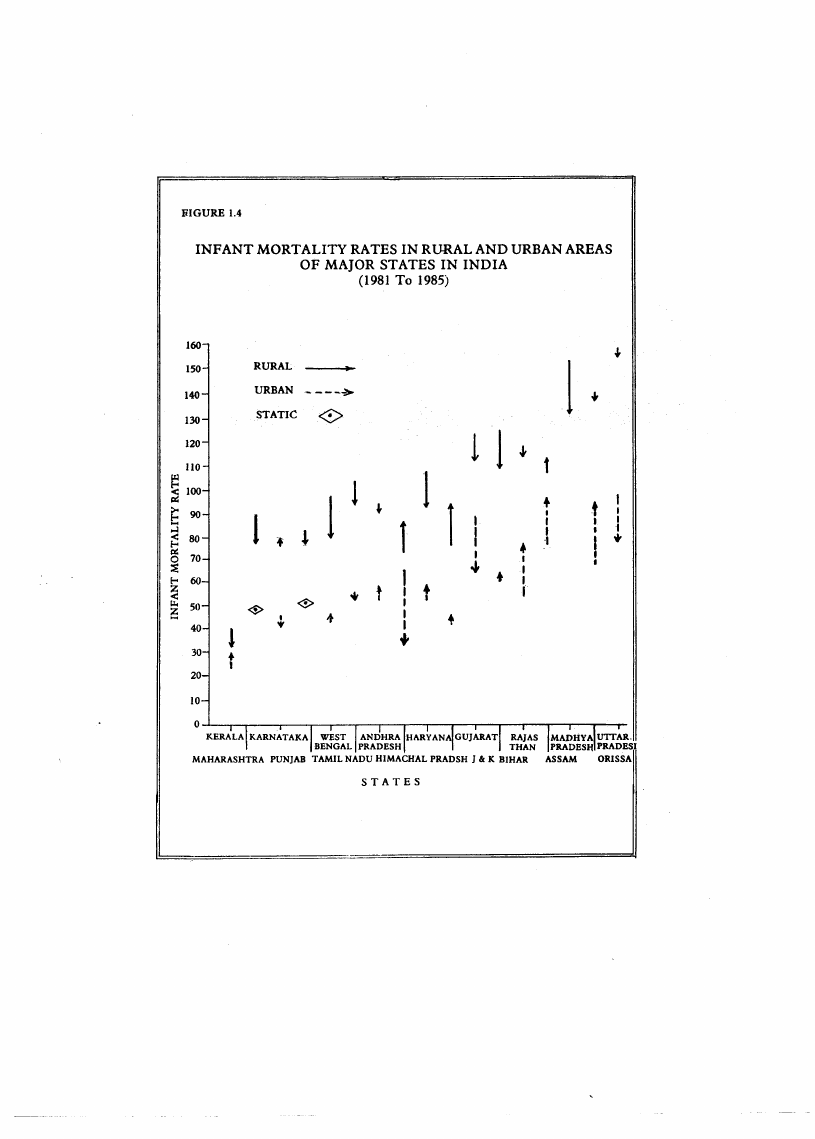
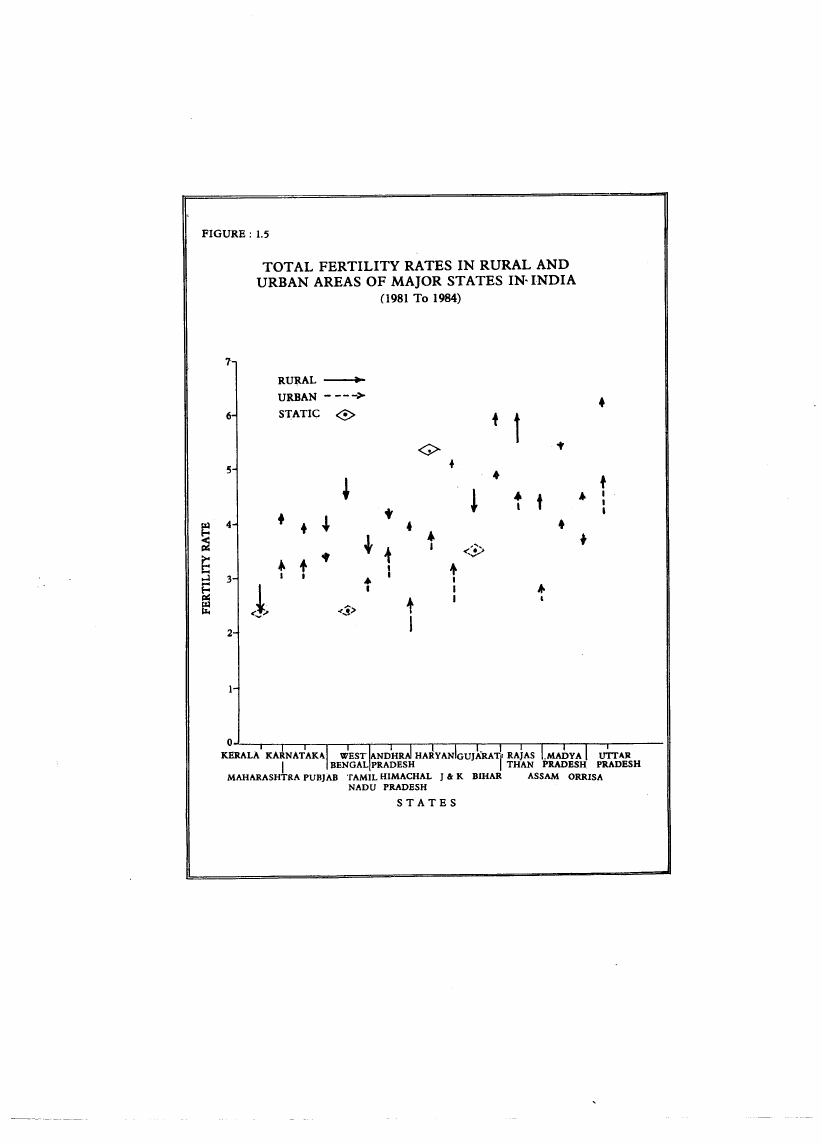
In Table 1.4 and Fig. 1.4ana 1.5 (pagesI2,13 and 14)an attempt is made to arrange
major States in an ascending order on the basis of infant mortality rate and total fertility

2.2 Page 12

▲back to top


rate (TFR) and also to show how they are changing in rural and urban areas at two
points in time, say, 1981 and 1985. The following points emerge from them:
Of the' 17 States for which d'ilta are presented,
(i) the rural IMR declined in 14 States but increased in three States, namely
Karnataka, Himachal Pradesh and Jammu and Kashmir;
(ii) the urban IMR declined in only six States but either remained static or went up in
11 other States;
(iii)the rural TFR went down in six States but either remained static or went up in 11
other States;
(iv) worse still, it is the urban TFR which has either remained static or increased in all
the 17 States; and
(v) both IMR and TFR trends are slighdy heartening in rural areas but extremely
disturbing in urban areas, needing prompt attention and correction.
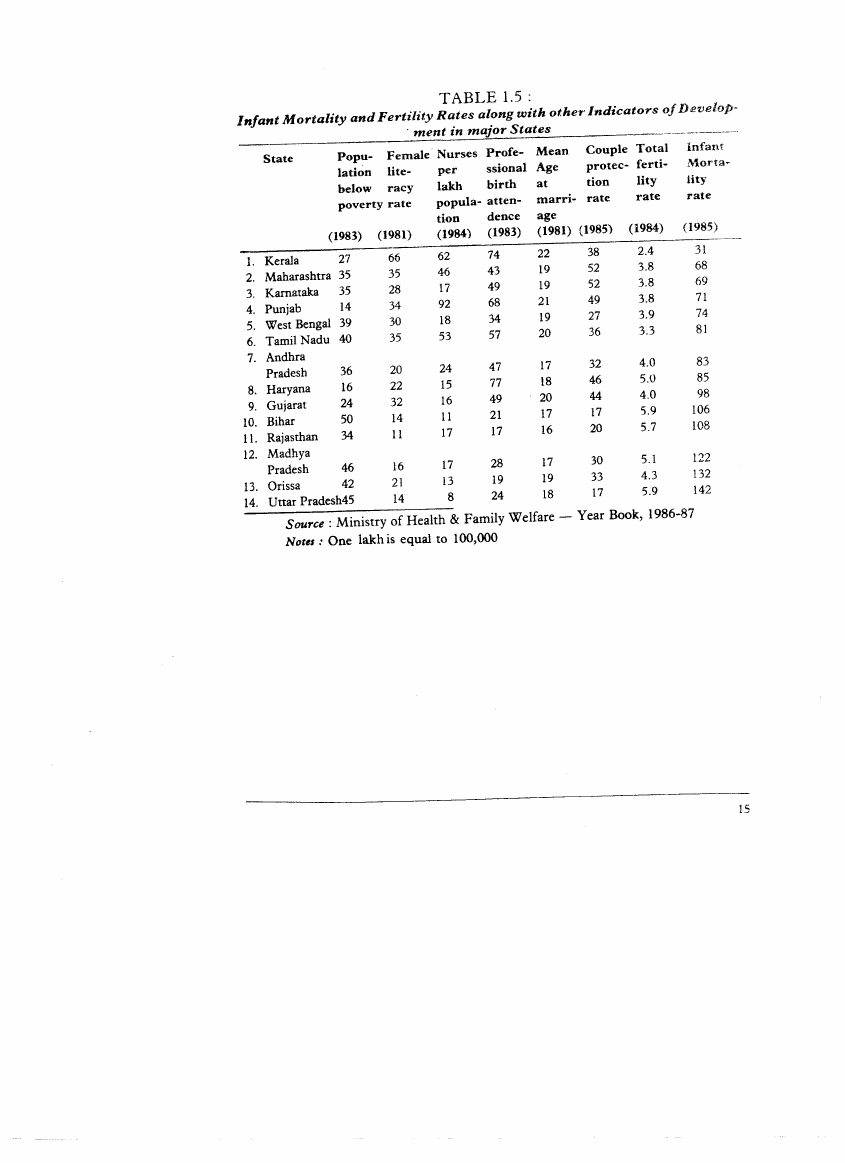
In Table 1.5 (see page 15 ), major 14 Indian States are arranged in an ascending
order on the basis ofIMR in 1985and data are presented on TFR and other indicators of
development. This brings out that the total fertility rate declines along with the infant
mortality rate and both decline as a result of improvements in socio-economic
conditions and health and family welfare services. It drives home the simple point that
fertility declines only when essential socio-economic conditions and health services
improve for the largest possible number, ensuring equity.
U Project Objectives
Against this macro picture, an attempt is made here to investigate the problems of
high infant mortality and fertility at micro-level to identify proximate determinants and
arrive at some feasible and replicable solutions which would work to bring down infant
mortality and fertility to the lowest levels possible with the help of medical and social
interventions, that are already known, but must be made available equitably, without
any loss of time. Otherwise, we have to continue to live with loss of infant lives, whi.ch
comes to five infant deaths out of the 50 odd born every minute in India.
This project was guided by a serious concern for high infant mortality and fertility
rates and the existence of some disturbing trends highlighted in the recent past. It was
designed as an action-research project to obtain objective wtderstanding of the problem
through comprehensive field investigations and identification of effective interventions
as a result of observation and analysis.
(i) to identify risk factors which impinge upon the life of infants directly or indi~
rect1y, and influence the chances of their survival under diverse conditions; .

2.3 Page 13

▲back to top


(ii) to examine the nexus of relationships between infant mortality and fertility and
the manner in which these tend to influence each other and get influenced by
other risk factors, singly or jointly; and
(iii~ to suggest appropriate interventions in order to accelerate the rate of reduction in
infant mortality and fertility rates, 'Simultaneously.
During the interoention phase, the purpose of this project will be:
(i) to plan and implement appropriate interventions on an experimental or pilot
basis in one PHC area in each selected State, already studied with the help and
cooperation of local organisations and Government;
(ii) to monitor and evaluate the efficacy and effectiveness of interventions in bringing
down mortality and fertility; and
(iii) to determine the feasibility and replicability of interventions before there are
introduced elsewhere.
With this purpose in view, the project was taken up in five States namely, Uttar
Pradesh, Madhya Pradesh, Orissa, Karnataka and Bombay concentrating attention on
eight socio-eeonomic population segments. The risk approach that was followed as a
methodological tool on the risk analysis helps bring out 'at risk' target groups and also
highlights priorities of interventions suited to different areas.A summary of results and
conclusions in respect of the five States are presented in a consolidated and comparative
manner in the followi1)gchapters. However, the reader is recommended to refer to
Statewise reports (see Section B) for further details 'and more elaborate interpretations.
In that sense, this concise document is a condensed and consolidated report based on
statistics Compiled in five'States and presented broadly for the.benefit of scientists and
practitioners seriously interested in understanding and'contributing to the solution of
the problems of high incidence of infant mortality and fertility not only in the five·
States, but'also in other States, to the extent these fmdings and suggestions are generally
relevant to them. '
That, then, is the magnitude of the problem of high infant mortality which affects
fertility and consequently the growth of population in India.

2.4 Page 14

▲back to top


TABLE 1.1:
Infant Mortality and Fertility i"A,8UmCountries
1. Japan
2. Hong Kong
3. Singapore
4. Malaysia
5. South Korea
6. Sri Lanka
7. China
8. Thailand
9. Mongolia
10. Philippines
11. Vietnam
12. Indonesia
13. India
14. Burma
15. Nepal
16. Iran
17. Laos'
18. BangladeSh
19. Pakistan
20. Kampuchea
21. Bhutan
22. Afghanistan
Infant Mortality
Rate(IMR)
5
g
9
22
25
29
33
40
46
56
68
75
97
102
106
109
111
120
120
133
135
175
Total Fertility
Rate (TFR)
1.7
1.4
1.5
3.6
2.1
2.7
2.4
2.9
5.0
4.6
4.3
3.6
4.5
4.3
6.0
5.2
6.0
5.6
5.5
4.8
5.4
6.7

2.5 Page 15

▲back to top


TABLE 1.2:
SRS* Estimates oj Infant, Neo-natal and Post-natal mortality
rates in rural and urban areas in India (1976-85)
Year
1
Rural mortality rates
Infant JIIIeo-natal Post-natal
2
3
4
Urban mortality rates
Infant Neo-natal Post-natal
5
6
7
1976
139
83
56
80
49
31
1977
140
88
52
81
42
39
1978
137
85
52
74
38
36
1979
130
78
52
72
42
30
1980
124
76
48
65
39
26
1981
119
76
44
63
39
24
1982
114
73
41
65
39
26
1983
114
74
40
66
39
27
1984
II3
72
41
66
40
26
1985
107
67
40
59
33
26
Source: Registrar General of India - Sample Registration System (SRS*)

2.6 Page 16

▲back to top


INFANT MORTALITY RATES IN RURAL & URBAN AREAS OF INDIA
(1975 To 1985)
-••••• ••••••••..•.•
NEO-NATAL
..... 1 ....""'---_. - --- ----- •...•..•.
.-"'>............
INFANT
-" - . '''-----_..-.~.. ~ •.••..
..... J ...
~NEO---NA-T~AL
...•••... .•..
"""...
.••. -----------..
.....
1976 77 78 79 80 81 82 83 84 85
YEARS
1976 77 78 79 80 81 82 83 84 85
YEARS

2.7 Page 17

▲back to top


TABLE 1.3:
SRS Estimates of Infant Mortality Rate in Major States (1976-78 to 1985-86).
SI. State
No.
1976-
78
1979-
81
1
2
l. Kera1a
2. Karnataka
3 West Bengal
4. Jammu & Kashmir
5. Punjab
6. Maharashtra
7. Andhra Pradesh
8. Himachal Pradesh
9. Tamil Nadu
10. Haryana
II. Assam
12. Bihar
13. Gujarat
14. Rajasthan
15. Madhya Pradesh
16. Orissa
17. Uttar Pradesh
3
4
48
40
85
74
68
73
110
87
91
80
121
95
110
88
106
95
III
101
119
104
135
117
141
107
143
142
136
142
174
157
ALL INDIA
129
115
Source: Registrar General of India - SRS
1982-
84
5
31
70
.84
72
74
75
78
79
83
95
98
105
108
109
127
130
154
114
1985- Percent
87 decline
6
7
29
-39.6
72
-15.3
72
-14.3
84
+23.5
69
-37.3
65
-28.6
82
-32.2
86
-21.8
80
-24.5
85
-23.4
110
- 7.6
103
- 1.9
103
-23.7
106
-24.8
120
-16.1
127
- 6.6
137
-21.3
96
-25.6

2.8 Page 18

▲back to top


-INFANT MORTALITY RATES IN INDIAN STATES
(1976-78 To 1985-86)
lsor
170
160
150
140
GUJARAT
130
ANDHRAPR.
120
ASSAM
HARYANA
HIMACHAL PRo 110
BIHAR
100
~U)
I-<
<I-< KARNATAKA
90
U)
SO
70
JAMMU & KASHMIR
60
50
KERALA
40
MADHYAPR.
RAJASTHAN
ORISSA
PUNJAB
TAMILNADU
~t30
~-I-~---1~--1
1976-78 1979-81
1982-84
1985-86

2.9 Page 19

▲back to top


NI
TABLE 1.4
SRS Estimates of Infant Mortality and Total Fertility
Rates in Major StQ.tes,
State
Infant
Total
Infant Mortality Rate
Total Fertility Rate
Mortality Fertility
Rate
Rate
(1985)
I. KmIa
31
2. Maharashtta
68
3. Karnataka
69
4. Punjab
71
5. West Bengal
74
6. Tamil Nadu
81
7. Andhri Pradesh
83
8. Himachal Pradtsh
84
9. Hatyana
85
10. Jammu & Kashmir
85
11. Gujarat
98
12. Bihar
106
13. Rajasthan
108
14. Assam
III
15. Madhya Pradesh
122
16. Orissa
132
17. Uttar Pradesh
142
ALL INDIA
97
Source : Registrar General of India, SRS.
(1984)
Rural
1981-- 1985
Urban
198-1--1985
Rural
198-1 -1984
Urban
19811984
2.4
40
32
24
30
2.9
2.4
2.4
2.4
3.8
90
78
49
49
4.0
4.1
3.0
3.3
3.8
-77
80
45
41
3.8
4.0
3.0
3.3
3.8
83
78
51
51
4.1
3.9
3.4
3.3
3.9
98
80
44
46
4.8
4.5
2.4
2.4
3.3
104
95
55
53
3.7
3.5
2.7
3.0
4.0
93
90
52
57
4.2
4.1
3.0
3.5
3.9
-72
87
65
32
3.9
4.0
2.0
2.6
5.0
108
92
52
58
5.3
5.3
3.5
3.8
4.6
-76
93
41
44
5.0
5.1
2.5
3.2
4.0
123
112
89
64
4.6
4.2
3.4
3.4
5.9
124
109
60
62
5.8
6.0
4.8
4.9
5.7
118
114
53
76
5.5
60
4.2
4.5
4.3
107
112
76
96
4.2
4.4
2.6
2.8
5.\\
152
131
80
79
5. 'i
5.4
3.9
4.0
4.3
140
137
68
84
4.3
4.4
3.7
3.6
---5-.9-_._-- .._-1_57._---15-4_ .._--9-7-_._, .._-7-8._-~--6-.1---_._6.-2------4-.1,~--,-4-.-8--
4.5
119 ---1-0~7 _._-....6_2._----- .•._5-9-----.4_.8----_4.._8 -.--.-3..3_-----3.5

2.10 Page 20

▲back to top


INFANT MORTALITY RATES IN RURAL AND URBAN AREAS
OF MAJOR STATES IN INDIA
(1981 To 1985)
160
150
140
130
120
110
~
< 100
Ill:
~...• 90
..l
<f-o 80
Ill:
0 70
~
f-o 60
l<Z:..
z...• 50
40
30
20
10
0
RURAL
URBAN ._---~
STATIC <0
1 •••
! 1 ••• 1
1 !
1 1~
,I
1 1 :to ~
I,
,+
I
I
-,
4
,t
I
I
II
t
I, +
<S>
~
I
!,•••
•••
+"t
1,,, +,
.j,
I
I
I
I
I+
••

3 Pages 21-30

▲back to top


3.1 Page 21

▲back to top


TOTAL FERTILITY RATES IN RURAL AND
URBAN AREAS OF MAJOR STATES IN-INDIA
(1981 To 1984)
7-
RURAL
URBAN - --->
6
STATIC 0
tt
<;>
5
+
••
t
4
~~
--~
..J 3
~
III
l><
~
! t
+ ~
t~
4
I
<i>
~
" I
I
,I
I••
+
I
I
J~ .<.i>
t
I
tt
A- I
I
I
+
.t,-
2
I

3.2 Page 22

▲back to top


TABLE 1.5 :
Infant Mortality and Fertility Rates along with other Indicators of Develop-
. ment in major States
----------
State
Popu- Female Nurses Profe- Mean Couple Total infant
lation lite-
per
ssional Age
protec- ferti-
Mona-
below racy
lakh
birth at
don
lity
lity
poverty rate
popula- atten- marri- rate
rate
rate
tion
dence age
(1983) (1981)
(1984) (1983) (1981) (1985) (1984) (1985)
1. Kerala
27
66
62
74
22
38
2.4
31
2. Maharashtra 35
35
46
43
19
52
3.8
68
3. Karnataka
35
28
17
49
19
52
3.8
69
4. Punjab
14
34
92
68
21
49
3.8
71
5. West Bengal 39
30
18
34
19
27
3.9
74
6. Tamil Nadu 40
35
53
57
20
36
3.3
81
7. Andhra
Pradesh
36
20
24
47
17
32
4.0
83
8. Haryana
16
22
15
77
18
46
5.0
85
9. Gujarat
24
32
16
49
20
44
4.0
98
10. Bihar
50
14
11
21
17
17
5.9
106
11. Rajasthan
34
11
17
17
16
20
5.7
108
12. Madhya
Pradesh
46
16
17
28
17
30
5.1
122
13. Orissa
42
21
13
19
19
33
4.3
132
14. Uttar Pradesh45
14
8
24
18
17
5.9
142
Source: Ministry of Health & Family Welfare - Year Book, 1986-87
NotlS .• One lakh is equal to 100,000

3.3 Page 23

▲back to top


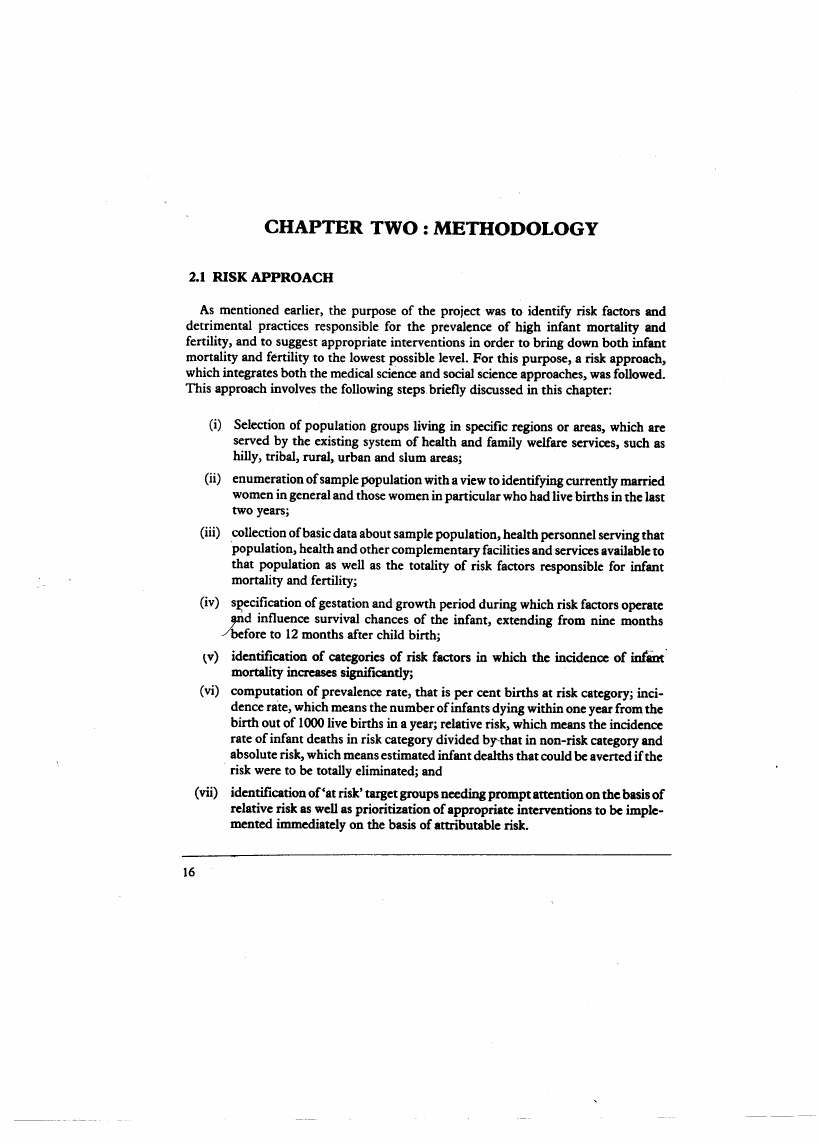
As mentioned earlier, the purpose of the project was to identify risk factors and
detrimental practices responsible for the prevalence of h'gh infant mortality and
fertility, and to suggest appropriate interventions in order to bring down both infant
mortality and fertility to the lowest possible level. For this purpose, a risk approach,
which integrates both the medical science and social science approaches, was followed.
This approach involves the following steps briefly discussed in this chapter:
(i) Selection of population groups living in specific regions or areas, which are
served by the existing system of health and family welfare services, such as
hilly, tribal, rural, urban and slum areas;
(ii) enumeration of sample population with a view to identifying currently married
women in general and those women in particular who had live births in the last
two years;
(iii) collection of basic data about sample population, health personnel serving that
population, health and other complementary facilities and services available to
that population as well as the totality of risk factors responsible for infant
mortality and fertility;
(iv) s~ecification of gestation and growth period during which risk factors operate
l}Odinfluence survival chances of the infant, extending from nine months
/before to 12 months after child birth;
tv) identification of categories of risk factors in which the incidence of intaDt"
mortality increases significantly;
(vi) computation of prevalence rate, that is per cent births at risk category; inci-
dence rate, which means the number of infants dying within one year from the
birth out of 1000 live births in a year; relative risk, which means the incidence
rate of infant deaths in risk category divided by--thatin non-risk category and
absolute risk, which means estimated infant dealths that could be averted if the
risk were to be totally eliminated; and
(vii) identification of 'at risk' target groups needing prompt attention on the basis of
relative risk as well as prioritization of appropriate interventions to be imple-
mented immediately on the basis of attributable risk.

3.4 Page 24

▲back to top


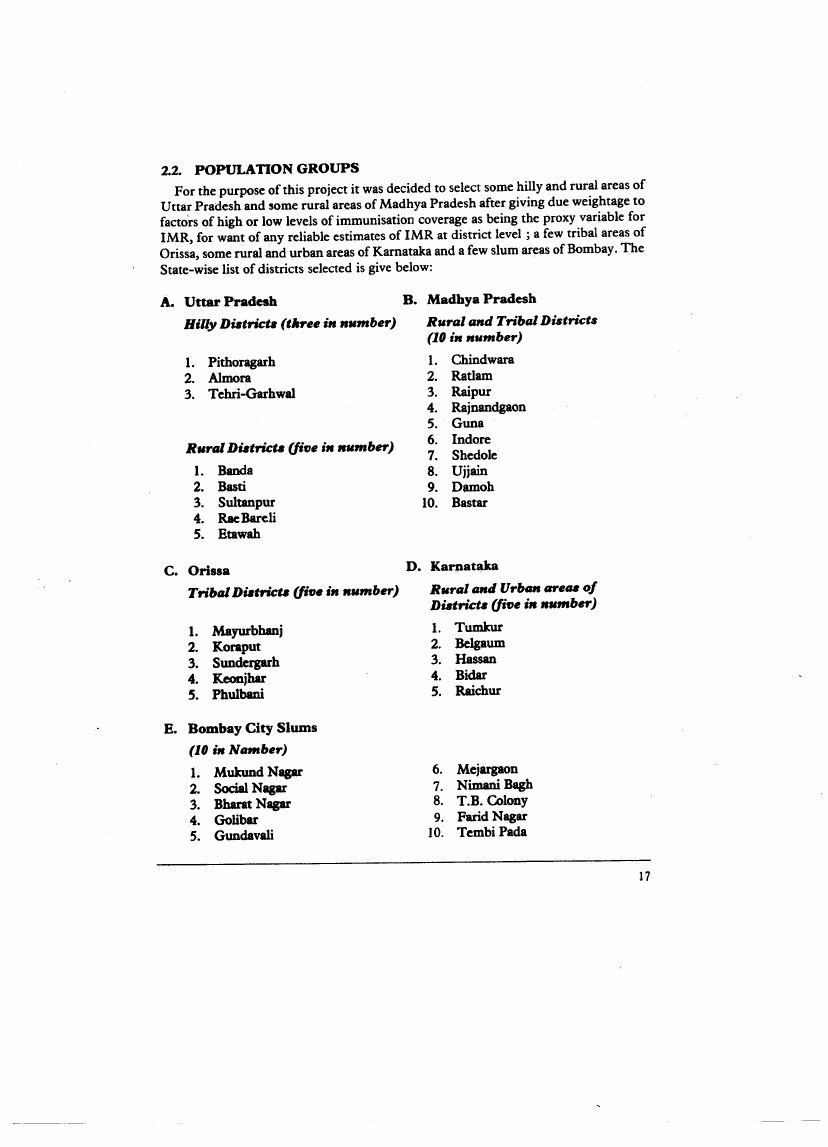
2.2. POPULATION GROUPS
For the purpose of this project it was decided to select some hilly and rural areas of
Uttar Pradesh and some rural areas of Madhya Pradesh after giving due weightage to
factors of high or low levels of immunisation coverage as being the proxy variable for
IMR, for want of any reliable estimates of IMR at district level; a few tribal areas of
Orissa, some rural and urban areas of Kamataka and a few slum areas of Bombay. The
State-wise list of districts selected is give below:
A. Uttar Pradesh
B. Madhya Pradesh
Hilly Di&tricu (t"ree i••••m••ber)
R ••ral a••d Tribal Districts
(10 i••••••mber)
1. Pitho~arh
2- Almora
3. Tehri-Garhwal
R ••ral Di&tricu (jioe i••••••mber)
1. Banda
2. Basti
3. Sultanpur
4. RaeBareli
5. Etawah
1. Chindwara
2. Ratlam
3. Raipur
4. Rajnandga()n
5. Guna
6. Indore
7. Shedole
8. Ujjain
9. Damoh
10. Bastar
C. Orissa
D. Karnataka
Tribal Di&tncu (fioe i••••••mber)
R ••ral and Urban areas of
Di&trict8 (fioe i••••••mber)
1. Mayurbhanj
2. Koraput
3. Sundergarh
4. K.eonjhar
5. Phulbani
1. Tumkur
2. Belgaum
3. Hassan
4. Bidar
5. Raichur
E. Bombay City Slums
(10 i••Namber)
1. Mukund Nagar
2. Social Nagar
3. Bharat Nagar
4. Golibar
5. Gundavali
6. Mejargaon
7. Nimani Bagh
8. T.B. Colony
9. FaridNagar
10. TembiPada
17

3.5 Page 25

▲back to top


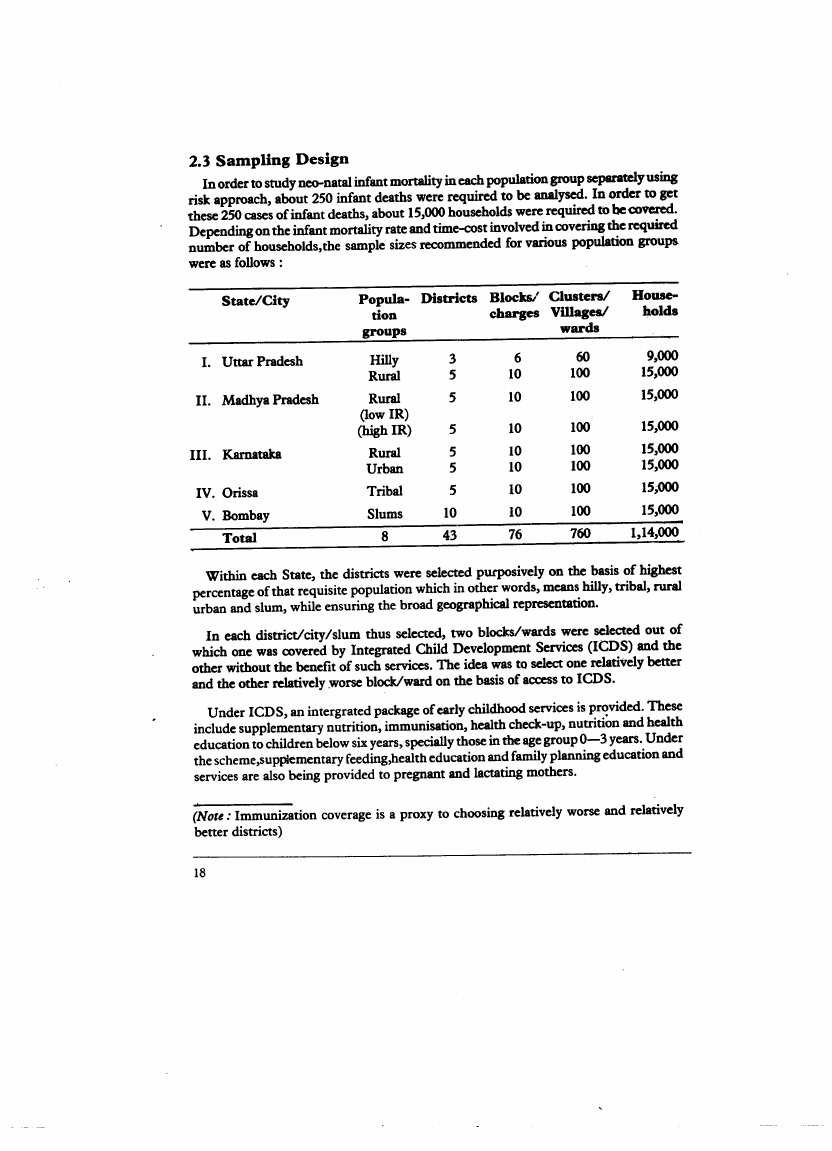
2.3 Sampling Design
In order to study neo-natal infant mortality in each population group separately using
risk approach, about 250 infant deaths were required to be analysed. In order to get
these 250 cases of infant deaths, about 15,000 households were required to bc<:ovcred.
Depending on the infant mortality rate and time-cost involved in covering the required
number of households, the sample sizes recommended for various population groups
were as follows:
State/City
I. Uttar Pradesh
II. Madhya Pradesh
III. Karnataka
IV. Orissa
V. Bombay
Total
Popula-
non
groups
Districts
Hilly
3
Rural
5
Rural
5
Qow IR)
(high IR)
5
Rural
5
Urban
5
Tribal
5
Slums
10
8
43
Blocks/ Clusters!
charges Villages!
wards
6
60
10
100
10
100
10
100
10
100
10
100
10
100
10
100
76
760
House-
holds
9,000
15,000
15,000
15,000
15,000
15,000
15,-000
15,000
1,14,000
Within each State, the districts were selected pucposively on the basis of highest
percentage of that requisite population which in other words, means hilly, tribal, rural
urban and slum, while ensuring the broad geographical representation.
In each district/city/slum thus selected, two blocks/wards were selected out of
which one was covered by Integrated Child Development Services (ICDS) and the
other without the benefit of such services. The idea was to select one relatively better
and the other relatively ~orse block/ward on the basis of access to ICDS.
Under ICDS, an intergrated package of early childhood services is provided. These
inClude supplementary nutrition, immunisation, health check-up, nutrition and health
education to children below six years, specially those in the age group 0-3 years. Under
the scheme,supplementary feeding,health education and family planning education and
services are also being provided to pregnant and lactating mothers.
(Note: Immunization coverage is a proxy to choosing relatively worse and relatively
better districts)

3.6 Page 26

▲back to top


In each block, 10clusters were selected randomly for the purpose of enumeration and
collection of basic demographic data and each cluster consisted of 150 households.
Thi~ was the uniform procedure of selecting districts, blocks and clusters of house-
holds followed in all the five States. Only in the case of hilly areas of Uttar Pradesh,
three instead of five districts were selected due to difficult field conditions, overrun in
both time and cost. In Madhya Pradesh, five districts with relatively better ~d five with
reIa:tivelypoorer performance under the immunization programme were selected while
ensuring regional representation. In analysis, however, they were merged together, for
,greater convenience in presentation.
Sometimes it was difficult to fmd a compact cluster of 150 households.
Four schedules were canvassed to collect the necessary data on risk factors operating
at community, health worker, household and mother and child levels.
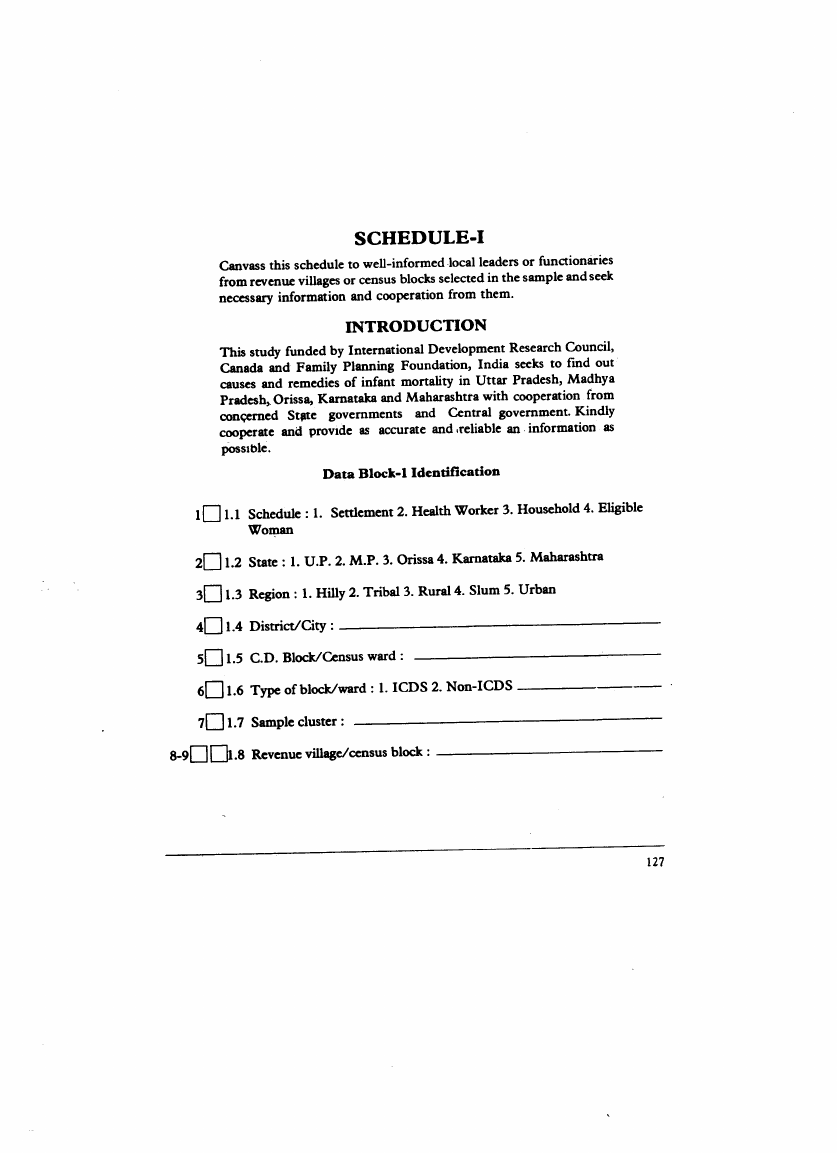
Sched.le-I in respect of the community was designed to collect data about the
availability of health, education and infrastruetural facilities and access to them. This
was canvassed to 'local leaders or heads of local organizations such as panchayat,
cooperative or school.
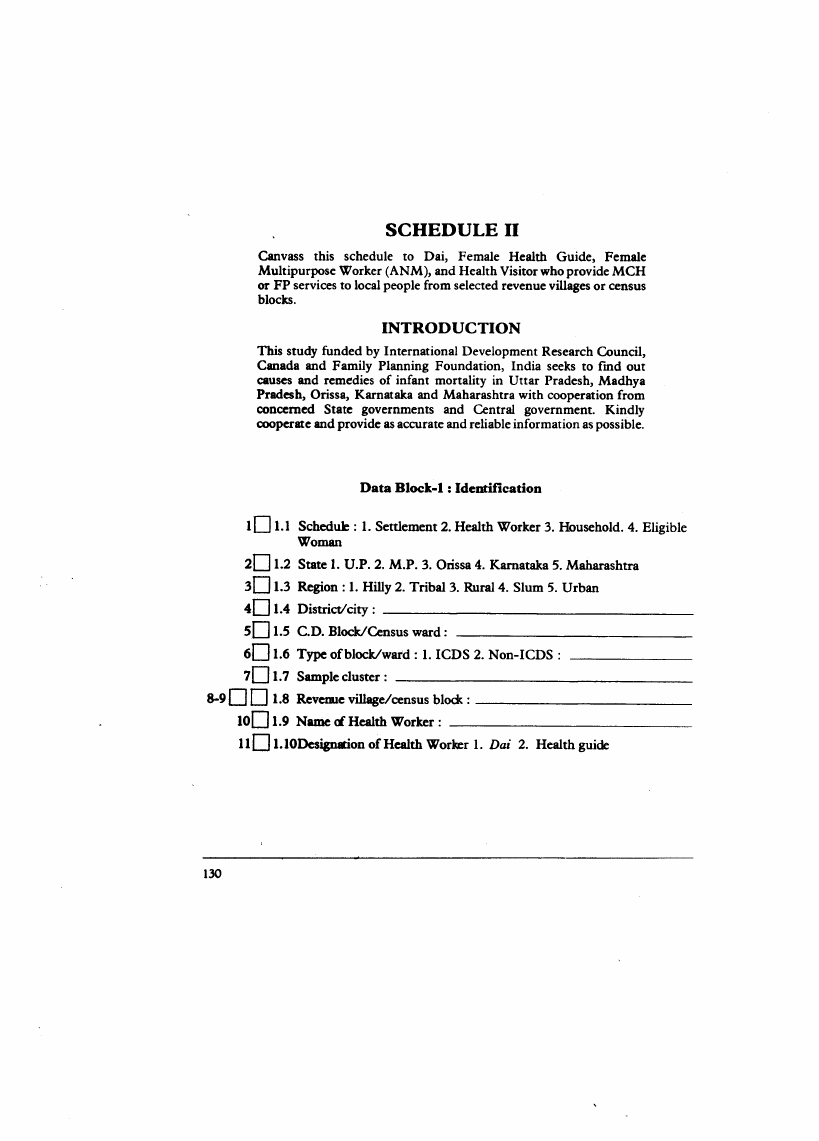
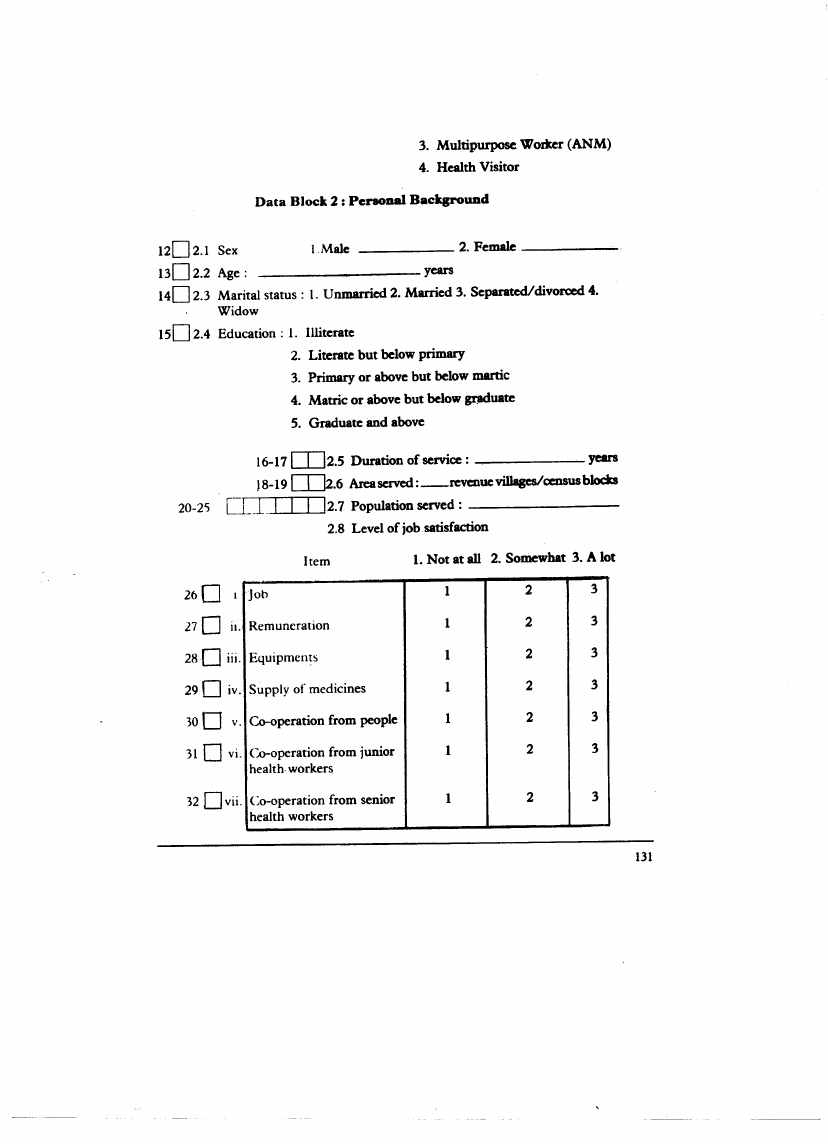
Sched.le-II in respect of the health workers was designed to collect data about
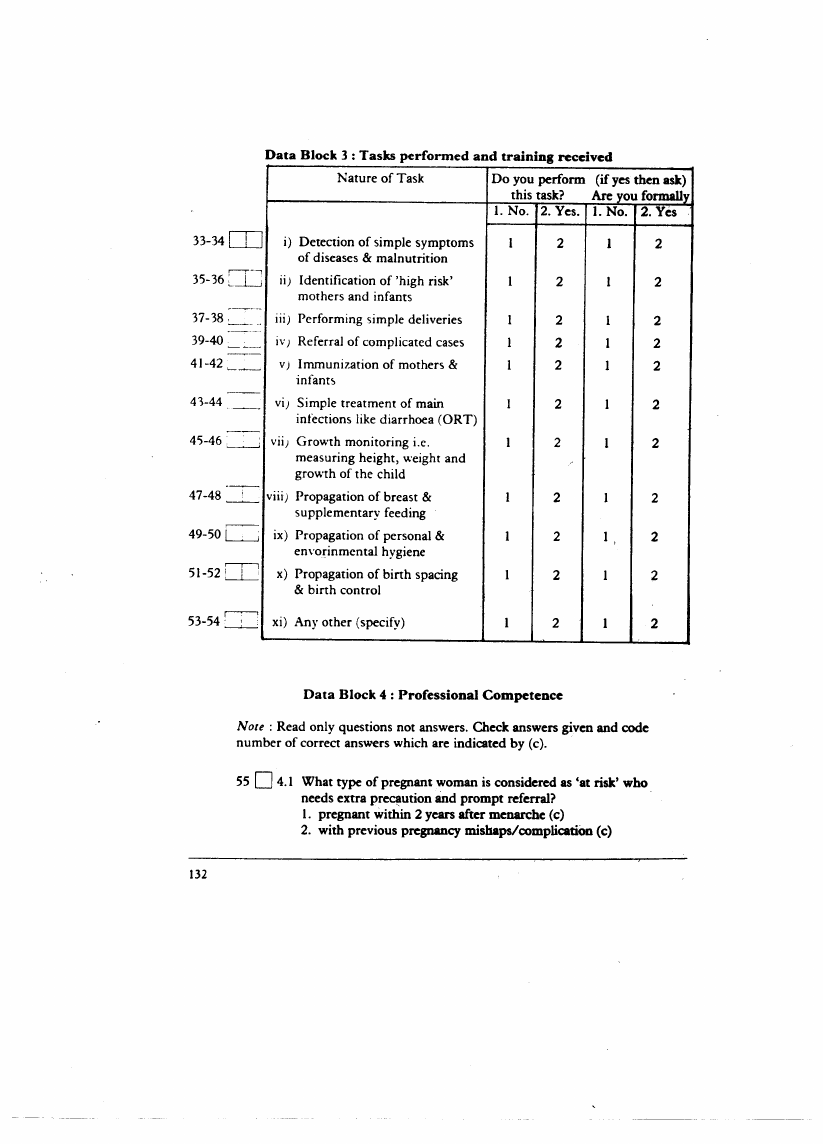
personal and social background, education and training, service experience and job
satisfaction, tasks performed and training received, correctness of knowledge about risk
factors and interventions to deal with them in different situations. This was canvassed to
Dais, Female Health Guides, Female Multi-purpose Workers (ANM), and Health
Visitors who normally provide MCH and FP service&at community level.
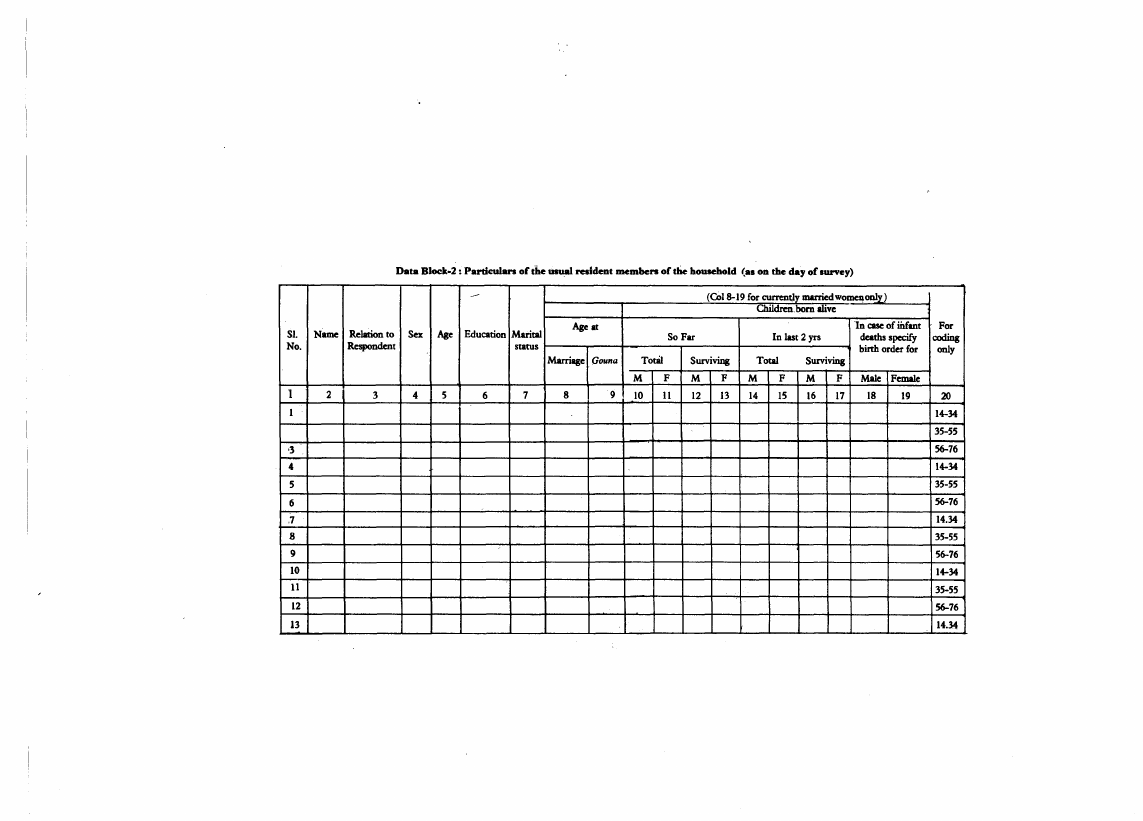
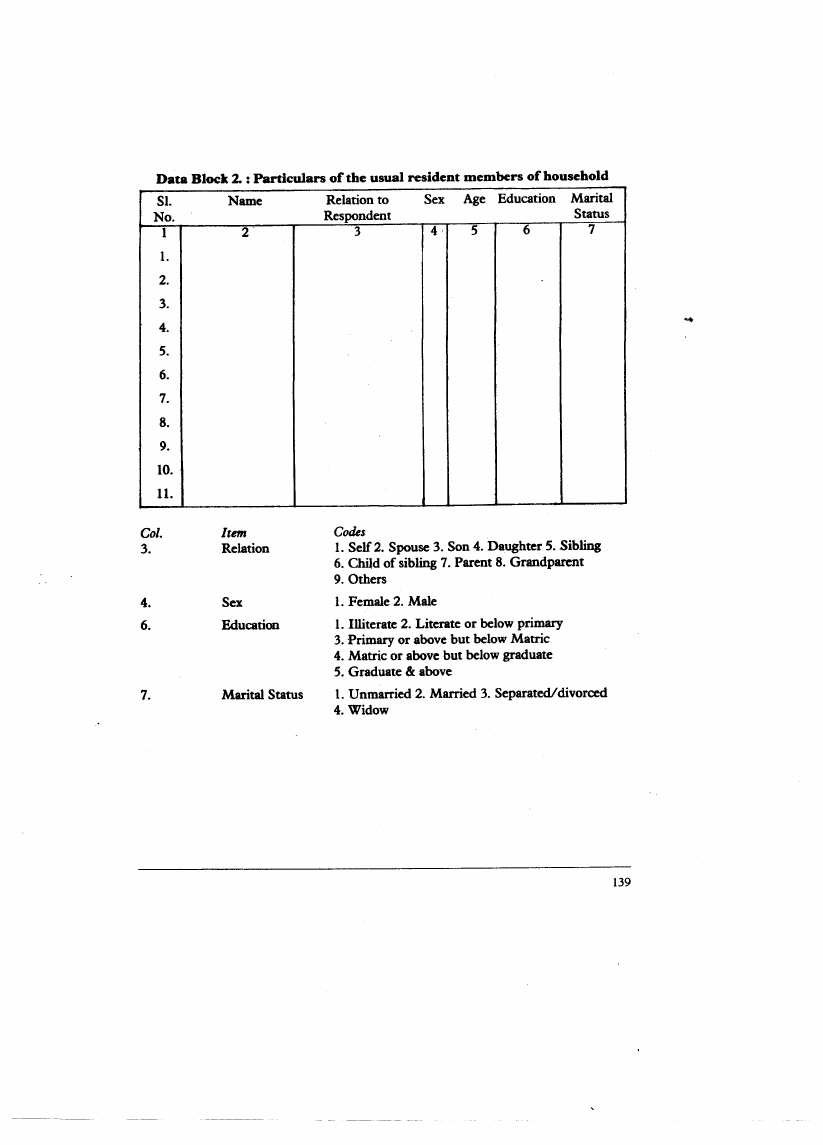
Sched.le -Ill in respect of the households was-designed to collect information about
all resident members of the households and their basic characteristics such as name,
relationship, sex, age, education and marital status and:if married, then about age at
marriage and consummation, children born alive, surviving or dead in the last two
years. This was canvassed to the head or any other knowledgeable member of the
household.
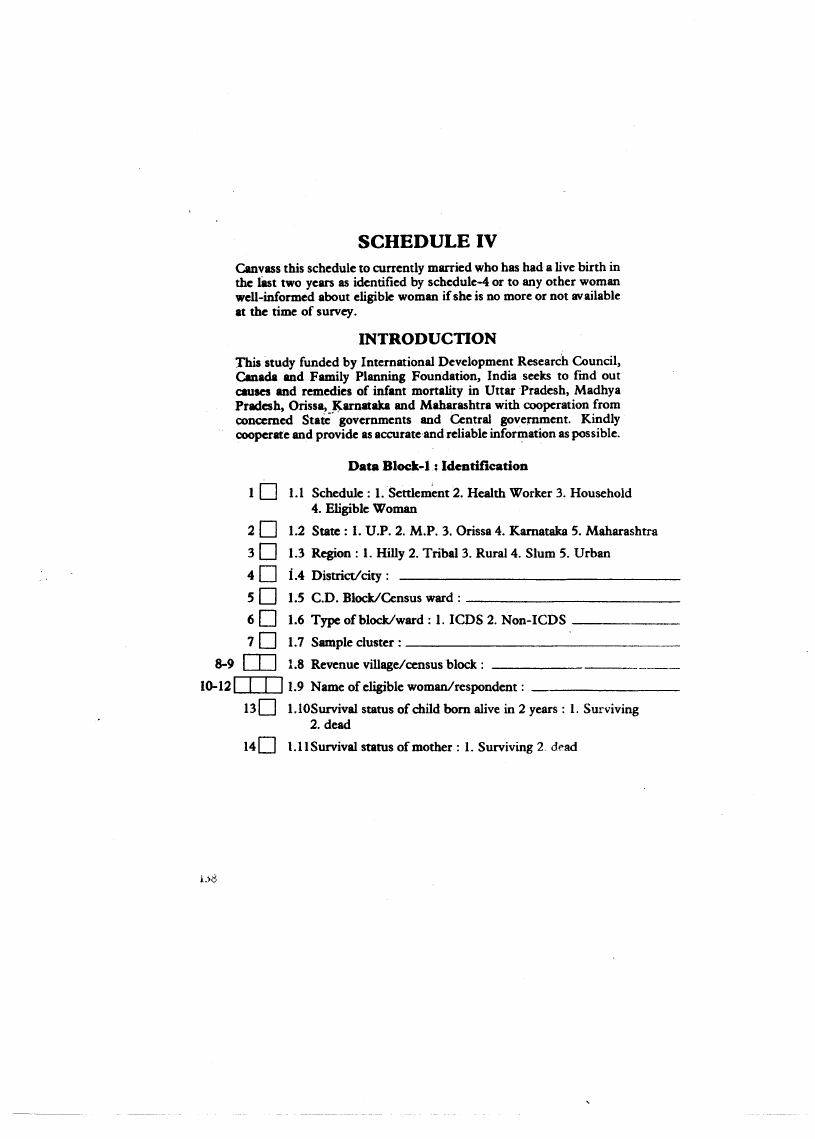
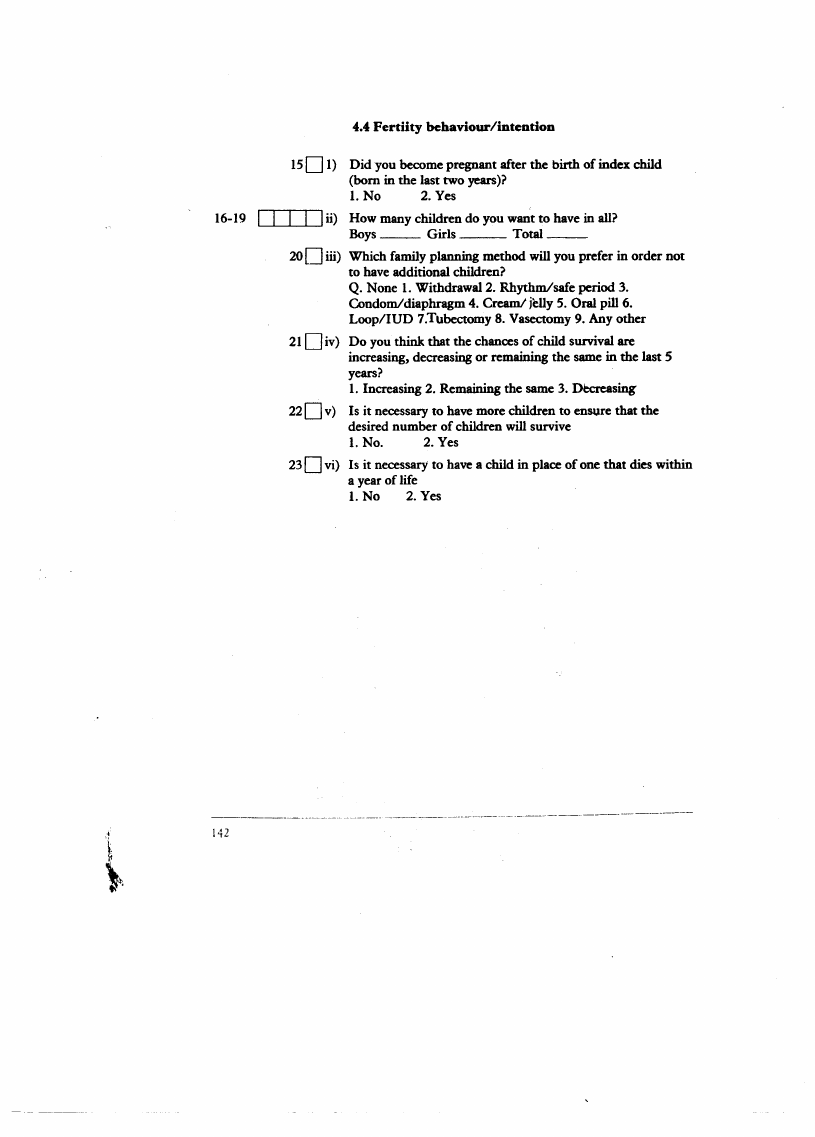
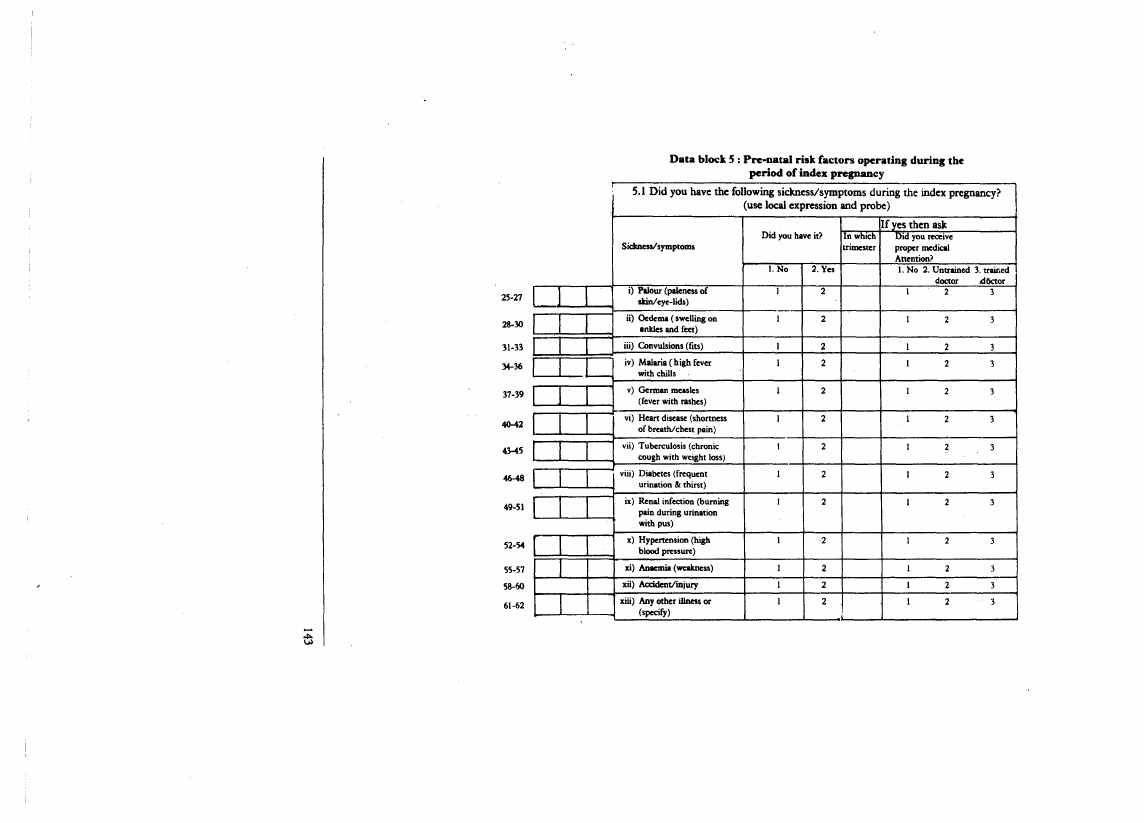
Schedule -IV in respect of the mothers who had had a live birth in the last two
years and was designed to collect information about age, marital status, education,
religion, caste, occupation, income, expenditure, family assets,housing, drinking water,
sanitation, hygiene, social participation, mass media contacts, etc. Similarly, it was
designed to elicit information about socio-economic, cultural, environmental and bio-
logical risk factors operating before, during and after pregnancy, for about one year.
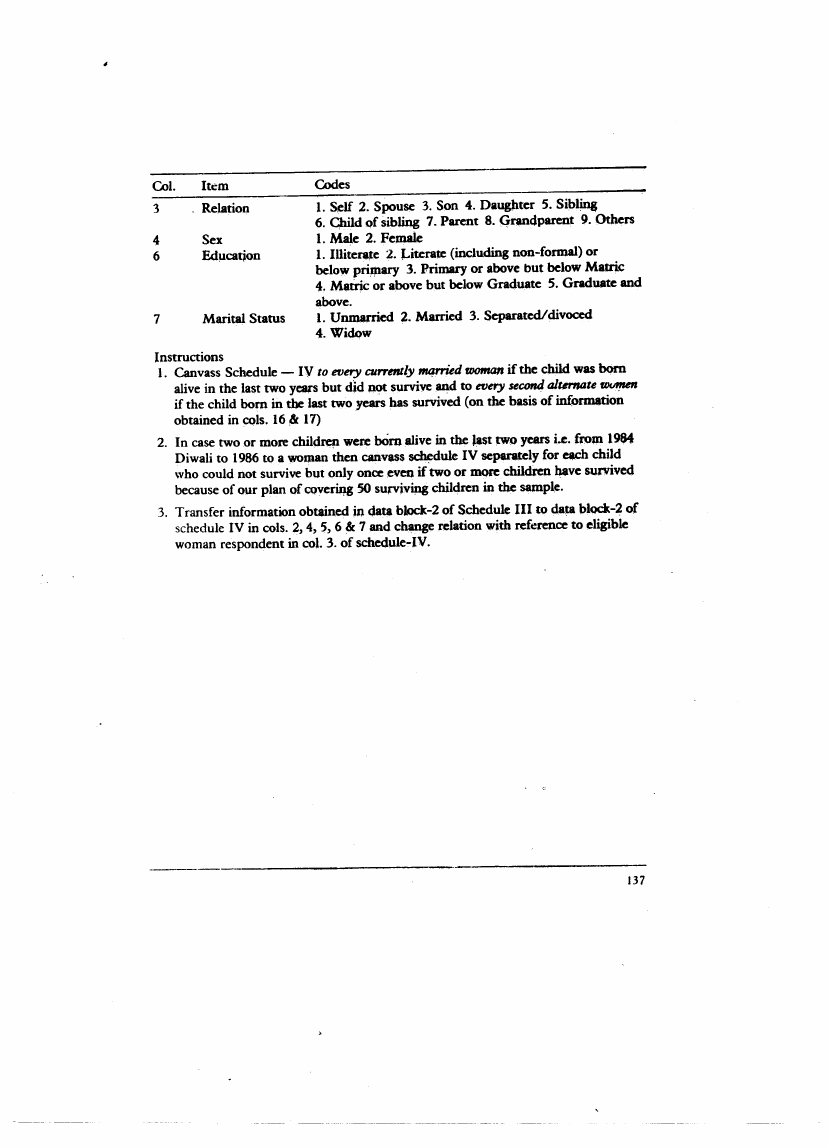
This was canvassed to every currently married women who in the last two years had
given birth to an infant alive but which did not survive, and to every second alternative
women if the chUd born in the last two years had survived.

3.7 Page 27

▲back to top


Since the main focus of this project was on infant mortality, each and every case of an
infant which died and every alternative case of infant which survived, was covered for
indepth and comparative understanding of risk factors responsible for infant mortality
Schedule -IV was comprehensive enough to collect information about all known
risk factors operating at pre-natal, natal and post-natal stages.
All these schedules reviewed by panel of experts were pre-tested, item-analysed and
revised in the light of pretest experience and results, expert comments and suggestions,
available literature and findings. They were mostly structured, formated, pre-coded
and made self-explanatory. Boxes and column numbers were provided in the left-hand
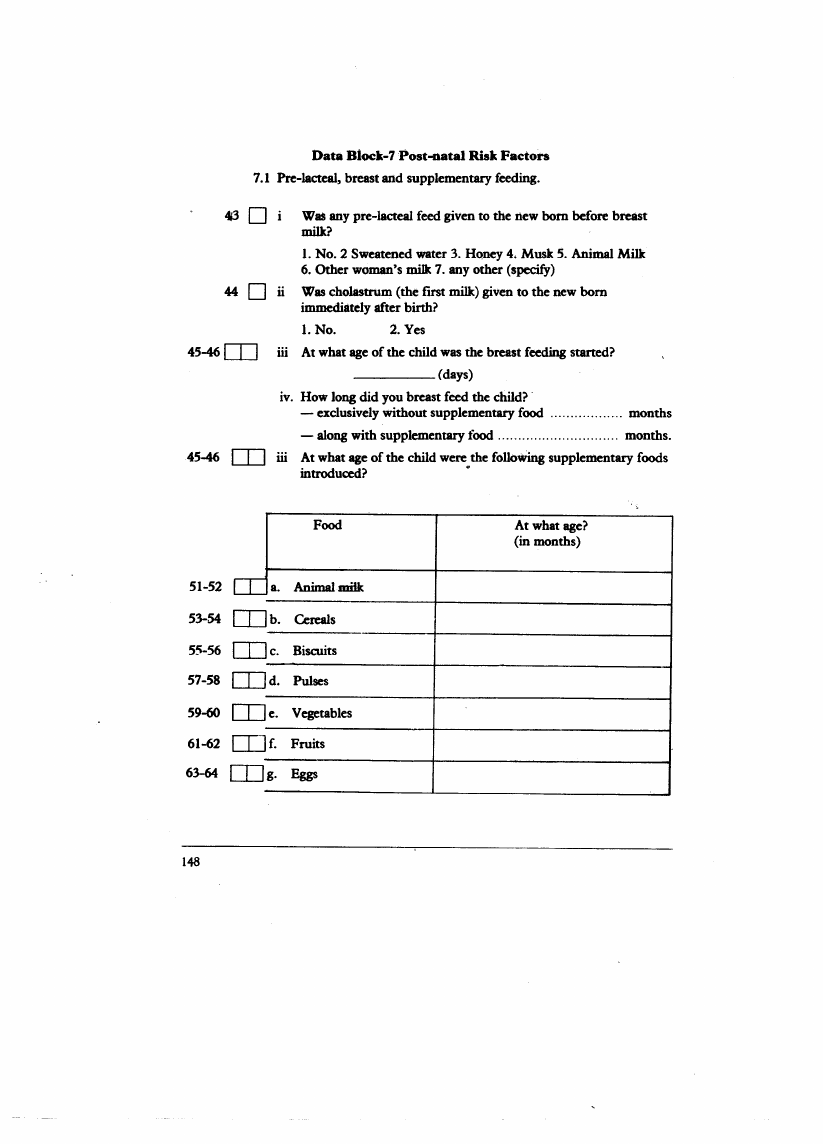
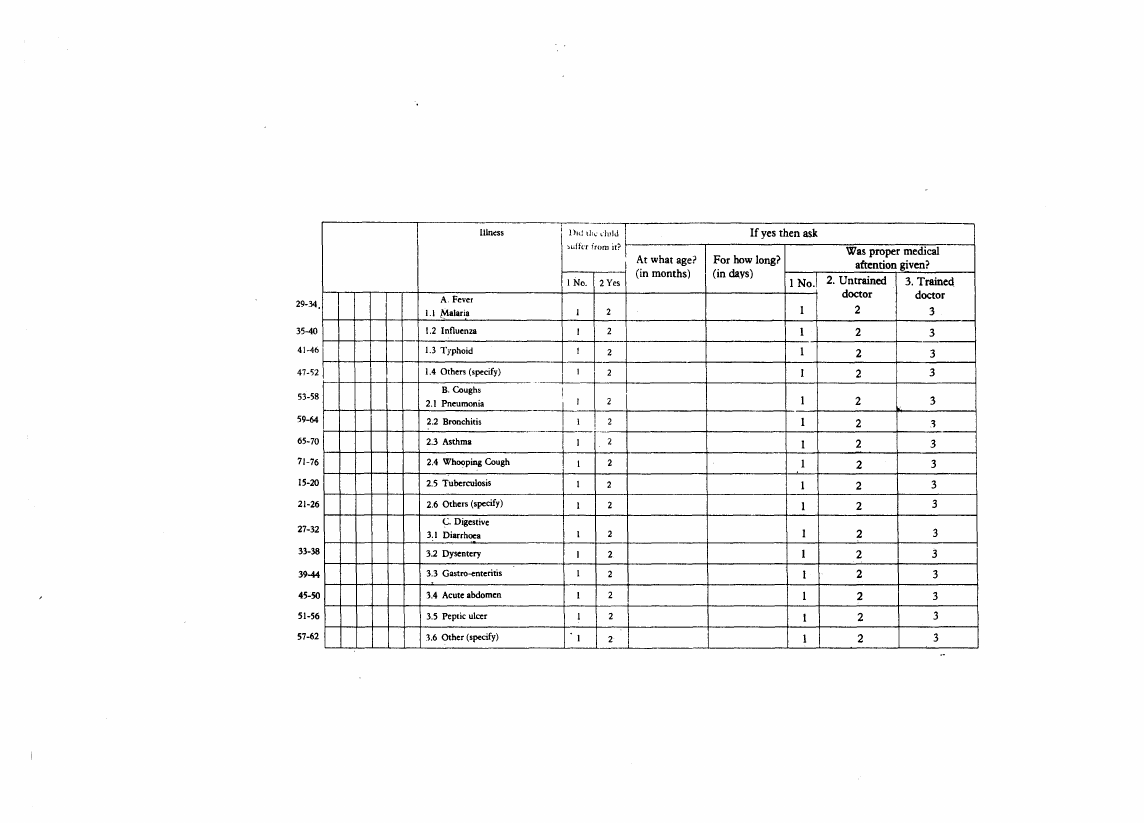
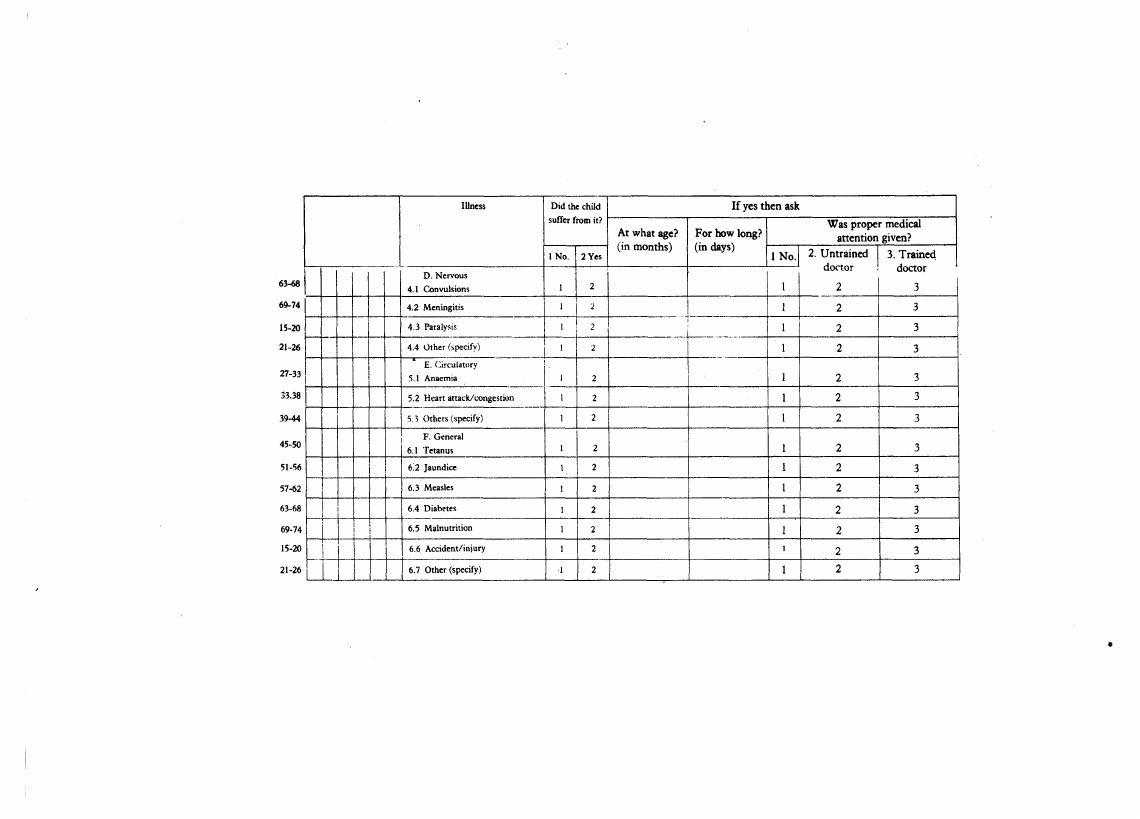
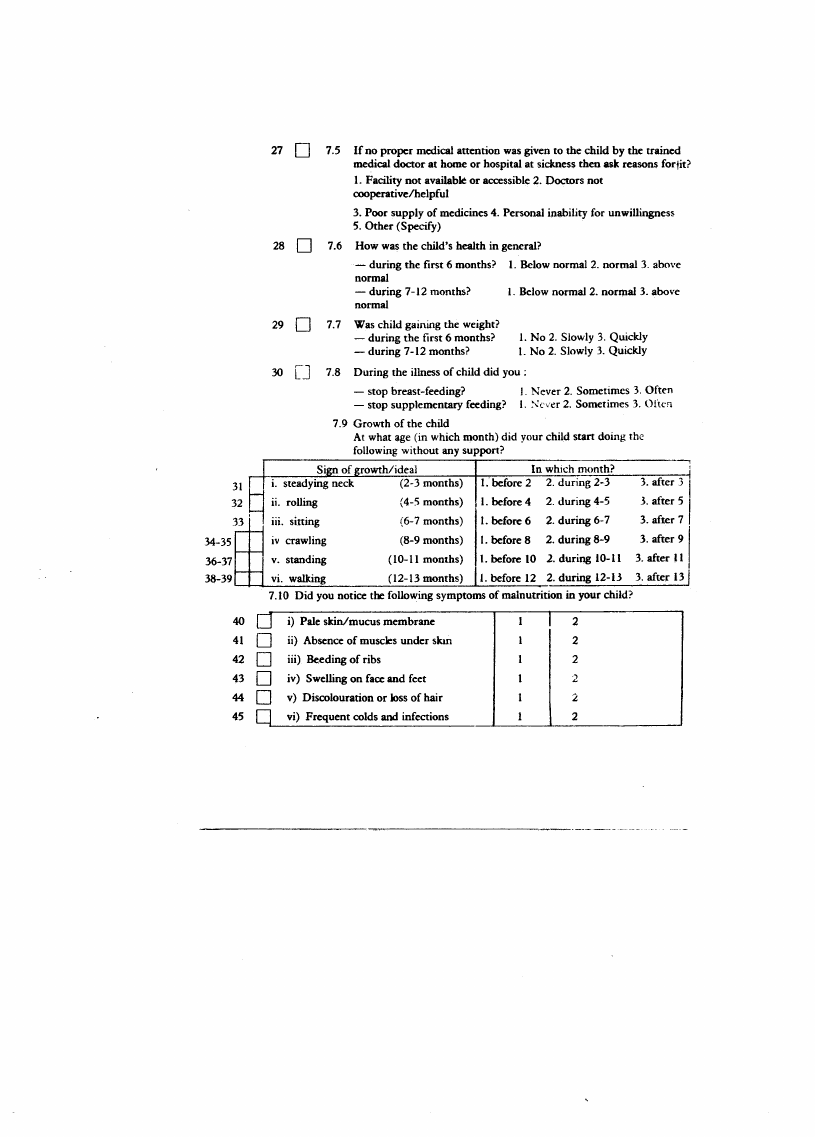
margin to transfer data smoothly and expedite the subsequent work of data entry 011
floppies and processing and analysis of data on computer according to the analysis plan.
All printed schedules along with the original project description, inst~ction manual
and analysis plan, were prepared and finalised jointly by project leaders and advisers
and sent in required number to concerned research teams. Sufficiently qualified and
experienced investigators were recruited by the collaborating field investigation centres
and trained in the art of selecting sample units, canvassing schedules in local languages,
coding and verification for about 8-10 days before they were sent to the field for actual
data collection.
Usually, one team consisting of three investigators and one supervisor was deployed
for each district with slight variations in response to local field conditions. The filled-in
schedules. were checked in all respects at district and State levels before they were
despatched to Delhi for centralized data entry, processing and analysis,according to the
agreed tabulation plan.
Besides these schedules, the team members, particularly supervisors, were also
required to collect qualitative data regarding detrimental cultural practices such as
labour, cord and placenta management, pre-lacteal, breast and supplementary feeding
and weaning practices; methods of bathing, cleaning, fondling and rocking babies,
personal hygiene and cleanliness observed before, during and after pregnancy or child
birth; use of traditional, indigenous, herbal, folk and home remedies and medicines;
child preferences and discriminations entrenched in local customs and traditions;
attitudes towards pre, ante and post-natal care, and services provided by health
workers. Some of these were also built-in into the schedules.
2.S RANGE OF VARIABLES
Through these four schedules, it was possible to generate data on the following
variables having a bearing on infant mortality and fertility, directly or indirectly.
A. Variables related to the Region
1. State.

3.8 Page 28

▲back to top


2. Type of population group (Rurallurban/hilly/tribal).
3. Type of block (ICDS/non-ICDS).
B. Variables related to Locality
1. Size of locality.
2. Per cent literates.
3. Per cent SCiST.
4. Health facilities.
5. Educational facilities.
6. Transport facilities.
C. Variables related to Health Personnel
1. Education.
2. Training.
3. Competence.
4. Job-satisfaction.
5. Knowledge about risk-factors.
D. Variables related to Households
1. Social conditions (religion, caste).
2. Economic conditions (land, cattle, poultry, kitchen-garden).
3. Housmg conditions (structure, rooms, ventilation, kitchen).
4. Environmental conditions (drinking water, drainage, garbage disposal, defeca-
tion, indoor smoke).
5. Houseold assets (clothes, mosquito nets, watch, radio, bicycle, etc.)
6. Household income (monthly - source, earners, earnings).
E. Variables related to the Family
1. Family size.
2. Family type.
3. Family literacy.
4. Family history.
F. Variables related to Maternal history
I. Age at marriage.
2. Age at consummation.

3.9 Page 29

▲back to top


3. Age at first pregnancy.
4. Number of pregnancies.
5. Number of abortions.
6. Number of still births.
7. Number of multiple births.
8. Number of births within two years' interval.
9. Number of births before 18 years of age.
10. Number of pre-term deliveries.
11. Number of births after 35 years of age.
12. Number of infant deaths (below one year).
13. Number of child deaths (1-4 years).
14. Number of complications during pregnancy.
15. Number of complications during delivery.
16. Number of complications/caesarian section.
G. Variables affecting index ehild at Pre-natal and Post-natal stages.
1. Birth order.
2. Term of pregnancy.
3. Sex of the child.
4. Preceding birth interval.
5. Preceding birth complications.
6. Maternal diseases during pregnancy.
7. Maternal malnutrition during pregnancy.
8. Maternal workload during pregnancy.
9. Maternal habits during pregnancy.
10. Maternal diet during pregnancy.
11. Medical attention, health check-up received by the mother.
12. Ante-natal care received by the mother.
13. Immunization received by the mother.
14. Duration of labour.
15. Type of labour.

3.10 Page 30

▲back to top


16. Type of presentation.
17. Place of delivery.
18. Type of birth attendance.
19. Complications at delivery experienced by the mother.
20. Complication at delivery experienced by the child.
21. Ptt-laeteal feeding given to the child.
22. Breast- feeding.
23. Supplementary feeding.
24. Health check-up for the child.
25. Immunization for the child.
26. Medical attention received by the child at sickness.
H. Variables related to Specific Outcomes
1. Mot:bidity status of the child.
2. Health status of the child.
3. Growth'status of the child.
4. Neo-natal infant mortality below one month.
5. Post neo-natal infant mortality (1-11 months).
6. Toddler mortality (12-23 months).
I. Variables related to Fertility behaviour and intentions after the period of
infancy.
1. Fertility status.
2. Ideal spacing between children.
3. Ideal numbr of children.
4. Insurance motive.
5. Replacement motive.
6. Family-planning intention.
ANALYSIS PLAN
A detailed tabulation plan was developed for each data-set generated by the four
schedules separately in consultation with project leaders and advisers. Once ftlled~in
schedules were received from the field agencies, these were scrutinized and checked
before entering the data on floppies. After the data were entered on floppies, these were
again checked and scrutinized before the actual centralised tabulation and analysis was

4 Pages 31-40

▲back to top


4.1 Page 31

▲back to top


done on computer with the help of programmers and consultants. Uniform sets of tables
properly generated and edited according to the analysis plan were sent in triplicate
alongwith suggestive outlines for report-writing by the field project leaders.
The profiles of communities and community health workers based on data generated
by schedules I and II are presented in Chapter three and the analysis of risk factors
derived from schedules III and IV presented in Chapter four.

4.2 Page 32

▲back to top


Before actually going into the identification and analysis of risk factors operating at
micro level, the situation at the macro level is being presented for better understanding
of the processes by which risk factors generally affect infant mortality.
The profile of communities surveyed in terms of access to health, education and
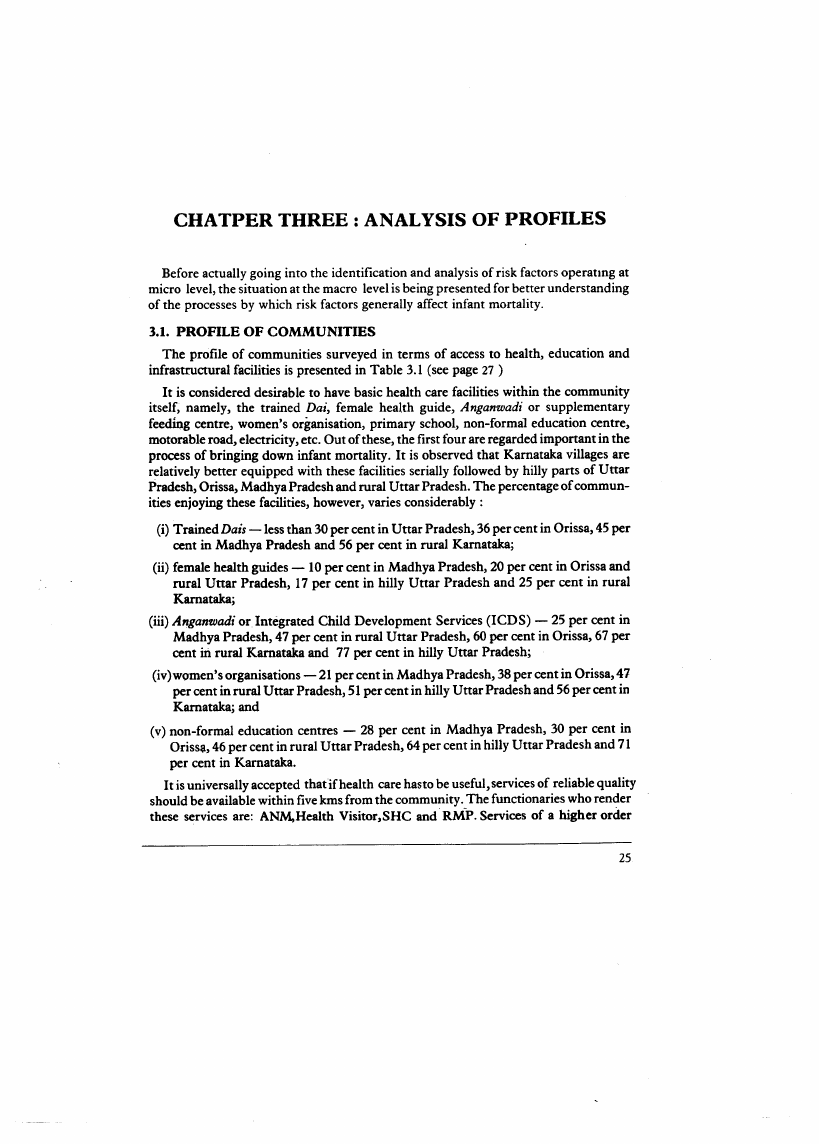
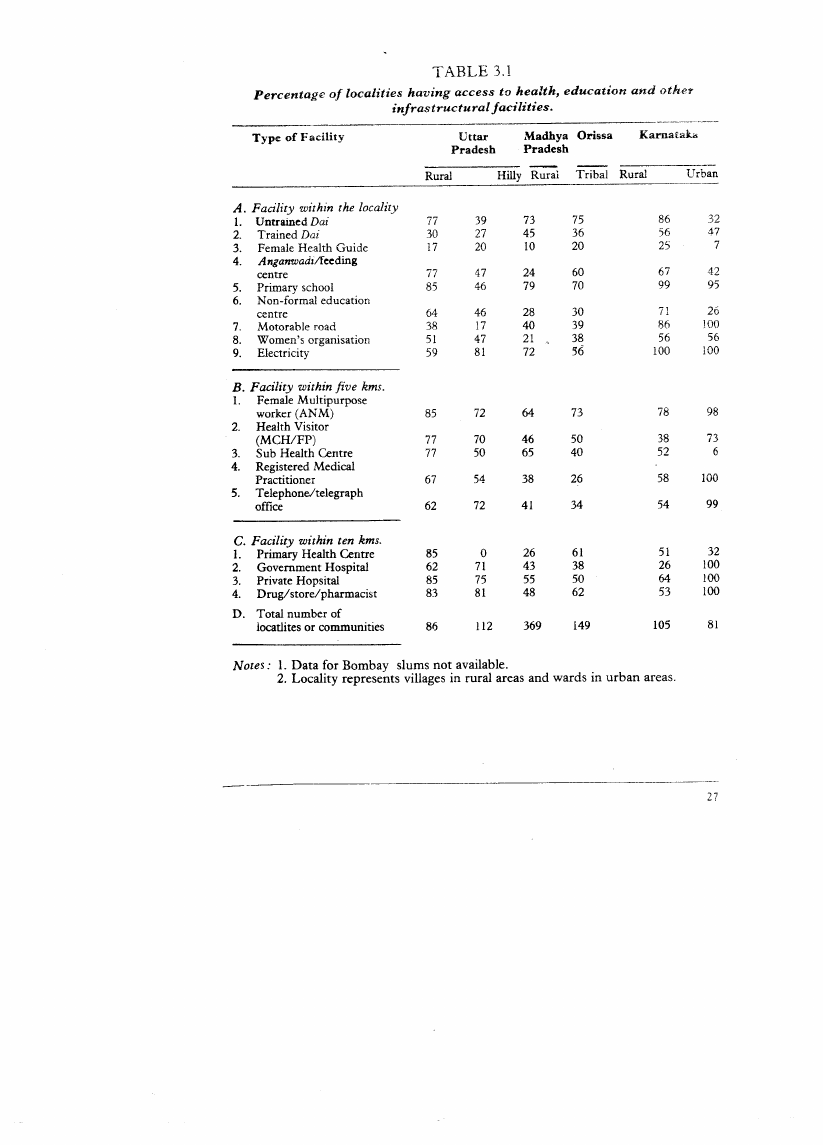
infrastructural facilities is presented in Table 3.1 (see page 27 )
It is considered desirable to have basic health care facilities within the community
itself, namely, the trained Dai, female health guide, Anganwadi or supplementary
feediQ.gcentre, women's organisation, primary school, non-formal education centre,
motorable road, electricity, etc. Out of these, the first four are regarded important in the
process of bringing down infant mortality. It is observed that Karnataka villages are
relatively better equipped with these facilities serially followed by hilly parts of Uttar
Pradesh, Orissa, Madhya Pradesh and rural Uttar Pradesh. The percentage of commun-
ities enjoying these facilities, however, varies considerably:
(i) Trained Dais -less than 30 per cent in Uttar Pradesh, 36 per cent in Orissa, 45 per
cent in Madhya Pradesh and 56 per cent in rural Karnataka;
(ii) female health guides - 10 per cent in Madhya Pradesh, 20 per cent in Orissa and
rural Uttar Pradesh, 17 per cent in hilly Uttar Pradesh and 25 per cent in rural
Karnataka;
(Hi)Anganwadi or Integrated Child Development Services (ICDS) - 25 per cent in
Madhya Pradesh, 47 per cent in rural Uttar Pradesh, 60 per cent in Orissa, 67 per
cent in rural Karnataka and 77 per cent in hilly Uttar Pradesh;
(iv)women's organisations - 21 per cent in Madhya Pradesh, 38 per cent in Orissa, 41
per cent in rural Uttar Pradesh, 51 per cent in hilly Uttar Pradesh and 56 per cent in
Karnataka; and
(v) non-formal education centres - 28 per cent in Madhya Pradesh, 30 per cent in
Oriss~, 46 per cent in rural Uttar Pradesh, 64 per cent in hilly Uttar Pradesh and 71
per cent in Karnataka.
It is universally accepted that if health care hasto be useful, services of reliable quality
should be available within five kms from the community. The functionaries who render
these services are: ANM,Health Visitor,SHC and RMP. Services of a higher order

4.3 Page 33

▲back to top


should be available within 10 kms. These are PHC, hospitall1lld drug store. Using these
distance norms and the percentage of communities within these distance norms, Uttar
Pradesh seems to be better off than Kamataka and Madhya Pradesh and Orissa appear
somewhere in the middle.
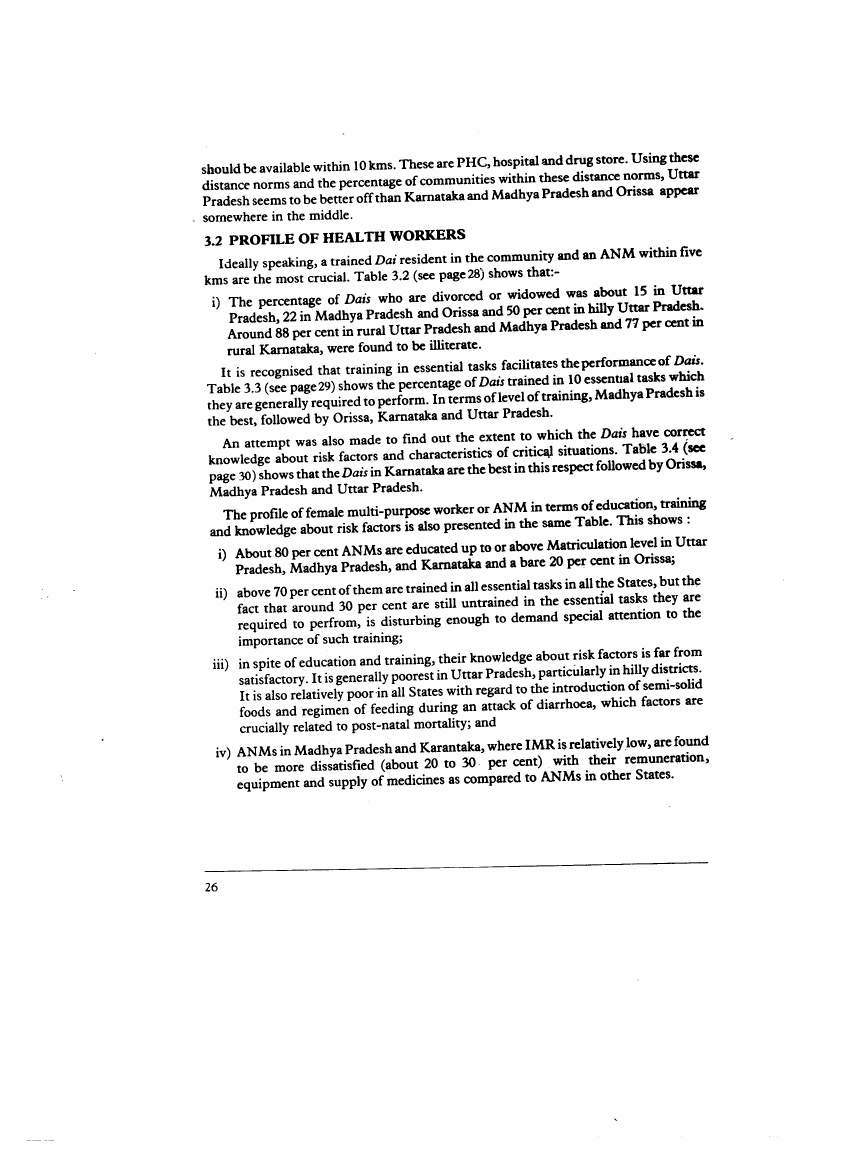
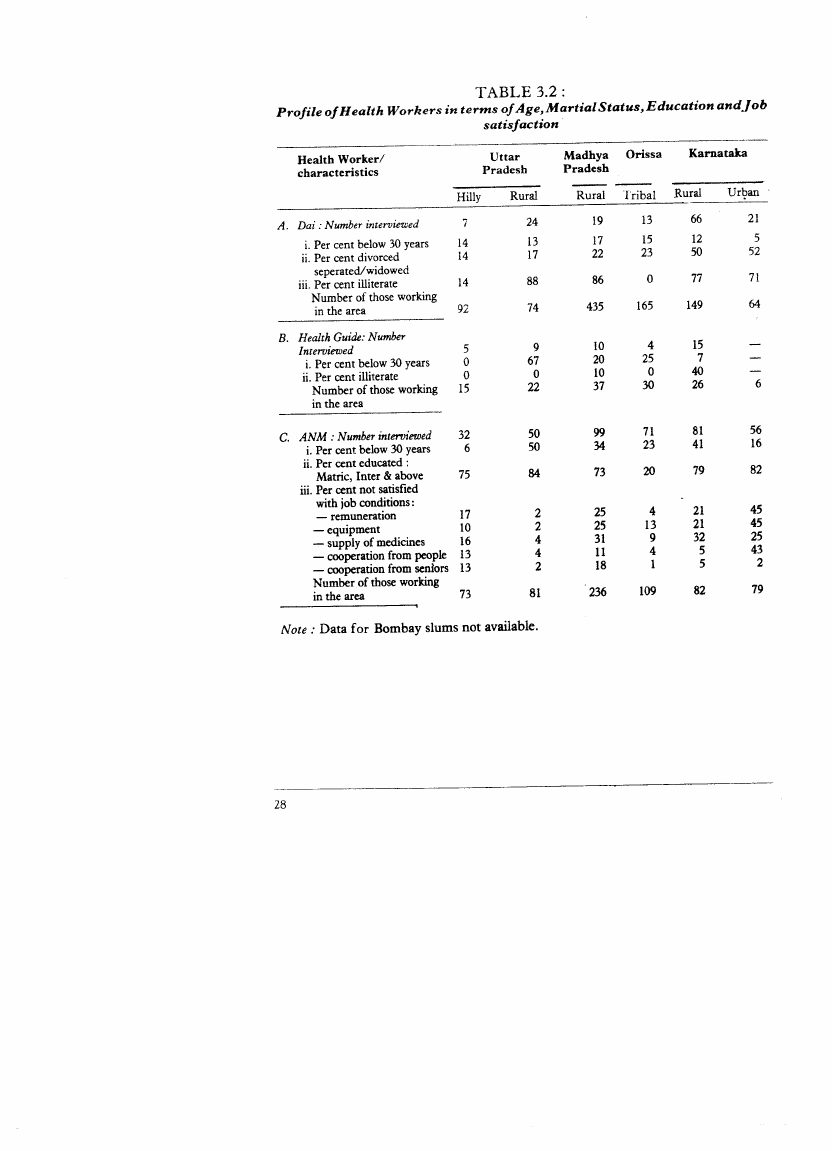
Ideally speaking, a trained Dai resident in the community and an ANM within five
kms are the most crucial. Table 3.2 (see page 28) shows that:-
i) The percentage of Dais who are divorced or widowed was about 15 in Uttar
Pradesh, 22 in Madhya Pradesh and Orissa and 50 per cent in hilly Uttar Pradesh.
Around 88 per cent in rural Uttar Pradesh and Madhya Pradesh and 77 per cent in
rural Kamataka, were found to be illiterate.
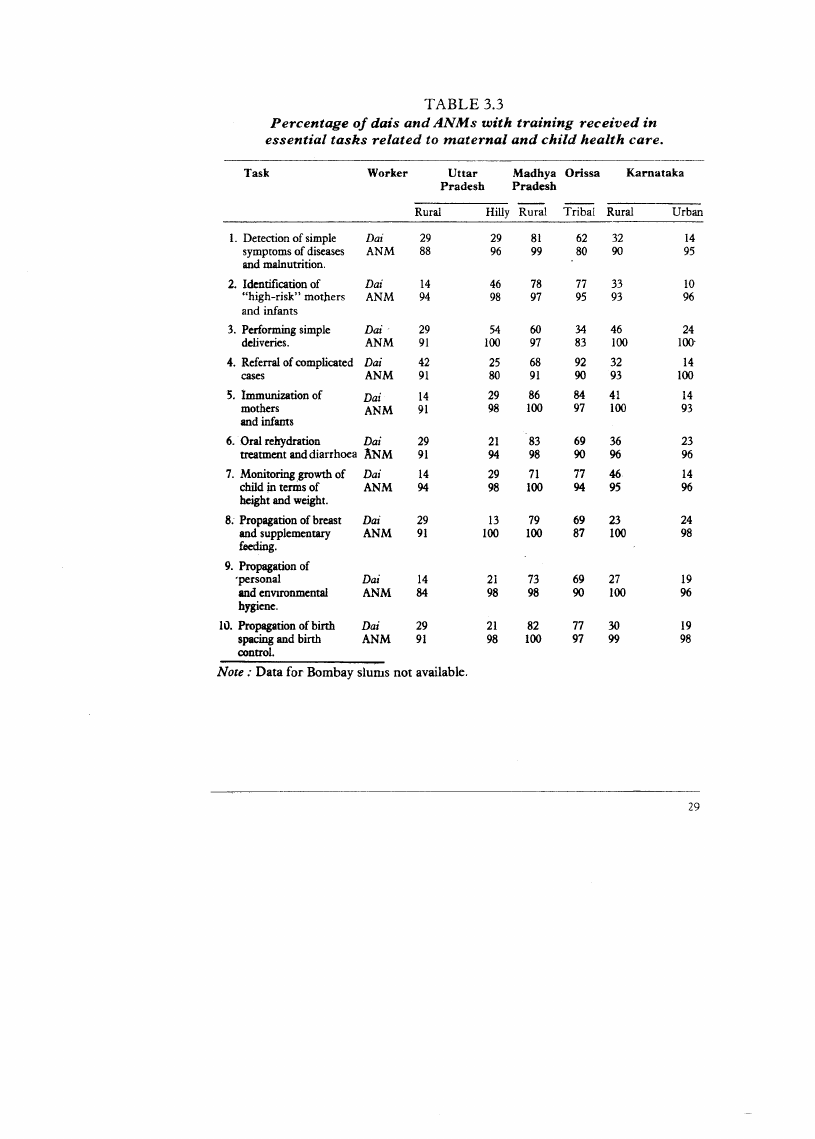
It is recognised that training in essential tasks facilitates the performance of Dais.
Table 3.3 (see page29) shows the percentage of Dais trained in 10 essentlal tasks which
they are generally required to perform. In terms oflevel of training, Madhya Pradesh is
the best, followed by Orissa, Kamataka and Uttar Pradesh.
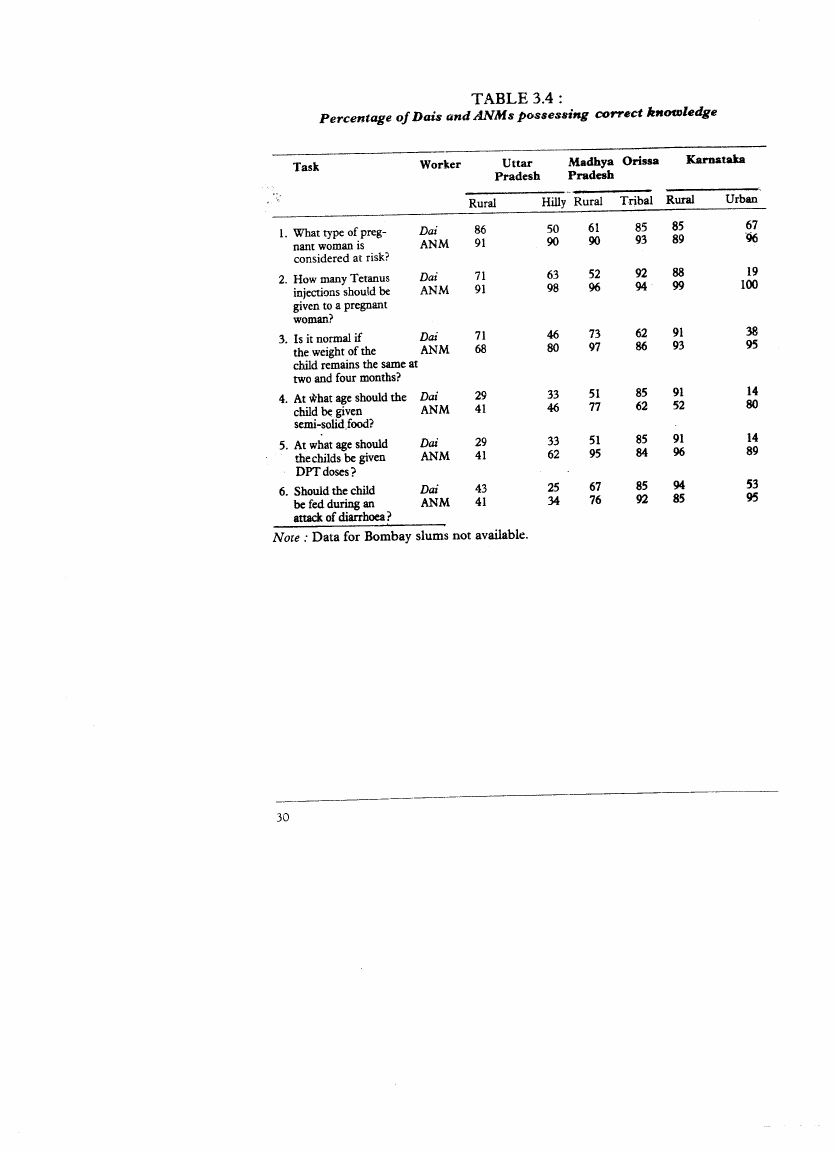
An attempt was also made to find out the extent to which the Dais have correct
knowledge about risk factors and characteristics of criti~ situations. TaBle 3.4 (see
page 30) shows that the Dais in Kamataka are the best in this respect followed by Orissa,
Madhya Pradesh and Uttar Pradesh.
The profile of female multi-purpose worker or ANM in terms of education, training
and knowledge about risk factors is also presented in the same Table. This shows:
i) About 80 per cent ANMs are educated up to or above Matriculation level in Uttar
Pradesh, Madhya Pradesh, and Kamataka and a bare 20 per cent in Orissa;
ii) above 70 per cent of them are trained in all essential tasks in all the States, but the
fact that around 30 per cent are still untrained in the essential tasks they are
required to perfrom, is disturbing enough to demand special attention to the
importance of such training;
iii) in spite of education and training, their knowledge about risk factors is far from
satisfactory. It is generally poorest in Uttar Pradesh, particularly in hilly districts.
It is also relatively poor-in all States with regard to the introduction of semi-solid
foods and regimen of feeding during an attack of diarrhoea, which factors are
crucially related to post-natal mortality; and
iv) ANMs in Madhya Pradesh and Karantaka, where IMR is relatively low, are found
to be more dissatisfied (about 20 to 30 per cent) with their remuneration,
equipment and supply of medicines as compared to ANMs in other States.

4.4 Page 34

▲back to top


Percentage
TABLE 3.1
of localities having access to health, education
infrastructural facilities.
and other
Type of Facility
Uttar
Pradesh
Madhya Orissa
Pradesh
Karnatak ••
Rural
Hilly Rural Tribal Rural
Urban
A. Facility within the locality
1. Untrained Dai
77
39
73
75
2. Trained Dai
30
27
45
36
3. Female Health Guide
17
20
10
20
4. Anganwadl/feeding
centre
77
47
24
60
5. Primary school
85
46
79
70
6. Non-formal education
centre
64
46
28
30
7. Motorable road
38
17
40
39
8. Women's organisation
51
47
21
38
9. Electricity
59
81
72
56
86
32
56
47
25
7
67
42
99
95
71
26
86
100
56
56
100 100
B. Facility within five kms.
1. Female Multipurpose
worker (ANM)
85
72
64
73
2. Health Visitor
(MCH/FP)
77
70
46
50
3. Sub Health Centre
77
50
65
40
4. Registered Medical
Practitioner
67
54
38
26
5. Telephone/telegraph
office
62
72
41
34
78
98
38
73
52
6
58
100
54
99
C. Facility within ten kms.
1. Primary Health Centre
2. Government Hospital
3. Private Hopsital
4. Drug/store/pharmacist
D. Total number of
locatlites or communities
85
0
26
61
62
71
43
38
85
75
55
50
83
81
48
62
86
112 369
149
51
32
26
100
64
100
53
100
105
81
Notes: 1. Data for Bombay slums not available.
2. Locality represents villages in rural areas and wards in urban areas.

4.5 Page 35

▲back to top


TABLE 3.2:
Profile of Health Workers in terms of Age, Martial Status, Education andJob
satisfaction
Health Worker!
characteristics
A. Dai: Number interviewed
i. Per cent below 30 years
ii. Per cent divorced
seperatedl widowed
iii. Per cent illiterate
Number of those working
in the area
B. Health Guide: Number
Interviewed
i. Per cent below 30 years
ii. Per cent illiterate
Number of those working
in the area
Uttar
Pradesh
Hilly
Rural
7
24
14
13
14
17
14
88
92
74
5
9
0
67
0
0
15
22
Madhya
Pradesh
Orissa
Karnataka
Rural Tribal Rural
Url:an
19
13
66
21
17
15
12
5
22
23
50
52
86
0
77
71
435
165
149
64
10
4
15
20
25
7
10
0
40
37
30
26
6
C. ANM : Number interviewed
32
i. Per cent below 30 years
6
ii. Per cent educated :
Matric, Inter & above
75
iii. Per cent not satisfied
with job conditions:
- remuneration
17
-equipment
10
- supply of medicines
16
- cooperation from people 13
- cooperation from seniors 13
Number .of those working
in the area
73
50
99
71
81
56
50
34
23
41
16
84
73
20
79
82
2
25
4
21
45
2
25
13
21
45
4
31
9
32
25
4
11
4
5
43
2
18
1
5
2
81
236
109
82
79
Note: Data for Bombay slums not available.

4.6 Page 36

▲back to top


TABLE 3.3
Percentage oj dais and ANMs with training received in
essential tasks related to maternal and child health care.
Task
Worker
Uttar
Madhya Orissa
Karnataka
Pradesh
Pradesh
Rural
Hilly Rural Tribal Rural
Urban
l. Detection of simple
Dai
29
29
81
62 32
14
symptoms of diseases ANM
88
96
99
80 90
95
and malnutrition.
2. Identification of
Dai
14
"high-risk" mothers
ANM
94
and infants
3. Performing simple
deliveries.
Dai
29
ANM
91
4. Referral of complicated Dai
42
cases
ANM
91
5. Immunization of
mothers
and infants
Dai
14
ANM
91
46
78
77 33
10
98
97
95 93
96
54
60
34 46
24
100
97
83 100
100'
25
68
92 32
14
80
91
90 93
100
29
86
84 41
14
98
100
97 100
93
6.. Oral rehydration
Dai
29
21
83
69 36
23
treatment and diarrhoea ANM
91
94
98
90 96
96
7. Monitoring growth of Dai
14
29
71
77 46
14
child in terms of
ANM
94
98
100
94 95
96
height and weight.
8. Propagation of breast Dai
29
13
79
69 23
24
and supplementary
ANM
91
100 100
87 100
98
feeding.
9. Propagation of
'personal
and enVIrOnmental
hygiene.
Dai
14
ANM
84
21
73
69 27
19
98
98
90 100
96
10. Propagation of birth
Dai
29
21
82
77 30
19
spacing and birth
ANM
91
98
100
97 99
98
control.
Note: Data for Bombay slums not available.

4.7 Page 37

▲back to top


TABLE 3.4:
Percentage of Dais and ANMs possessing correct knowledge
Task
Worker
Uttar
Madhya Orissa
Karnataka
Pradesh
Pradesh
Rural
Hilly Rural Tribal Rural
Urban
1. What type of preg-
Dai
86
50
61
85 85
67
nant woman is
ANM
91
90
90
93 89
96
considered at risk?
2. How many Tetanus
Dai
71
injections should be
ANM
91
given to a pregnant
woman?
63
52
92 88
19
98
96
94 99
100
3. Is it normal if
Dai
71
46
73
62 91
38
the weight of the
ANM
68
80
97
86 93
95
child remains the same at
two and four months?
4. At what age should the Dai
29
33
51
85 91
14
child be given
ANM 41
46
77
62 52
80
semi-solidJood?
5. At what age should
Dai
29
33
51
85 91
14
the childs be given
ANM
41
62
95
84 96
89
DPTdoses?
6. Should the child
Dai
43
25
67
85 94
53
be fed during an
ANM
41
34
76
92 85
95
attack of diarrhoea ?
Note: Data for Bombay slums not available.

4.8 Page 38

▲back to top


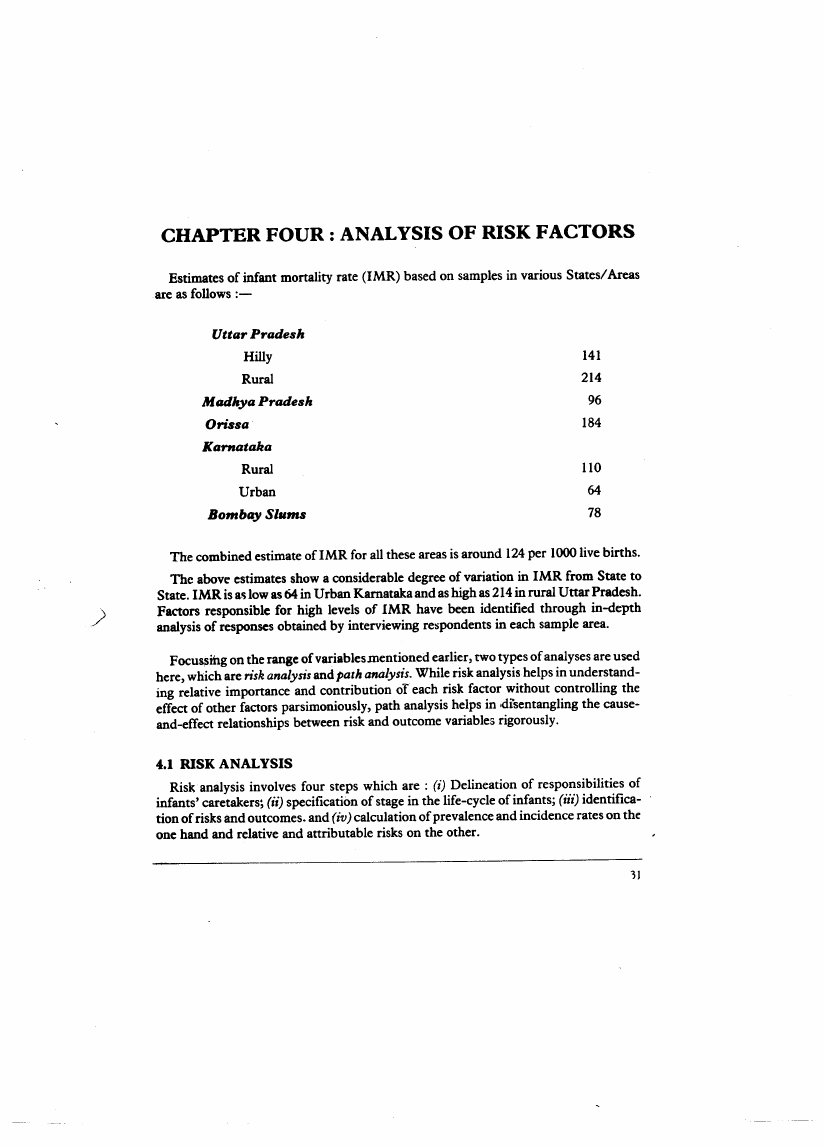
Estimates of infant mortality rate (IMR) based on samples in various States/Areas
are as follows ;-
Uttar Pradesh
Hilly
141
Rural
214
Madhya Pradesh
96
Orissa
184
Kamataka
Rural
110
Urban
64
Bombay Slums
78
The combined estimate of IMR for all these areas is around 124per 1000 live births.
The above estimates show a considerable degree of variation in IMR from State to
State. IMR is alllow as 64 in Urban Kamataka and as high as 214 in rural Uttar Pradesh.
Factors responsible for high levels of IMR have been identified through in-depth
analysis of responses obtained by interviewing respondents in each sample area.
Focussmg on the range of variables mentioned earlier, two types of analyses are used
here, which are risk analysis and parh analysis. While risk analysis helps in understand-
ing relative importance and contribution of each risk factor without controlling the
effect of other factors parsimoniously, path analysis helps in ,disentangling the cause-
and-effect relationships between risk and outcome variables rigorously.
Risk analysis involves four steps which are; (i) Delineation of responsibilities of
infants' caretakers; (ii) specification of stage in the life-cycle of infants; (iii) identifica-
tion of risks and outcomes. and (iv) calculation of prevalence and incidence rates on the
one hand and relative and attributable risks on the other.

4.9 Page 39

▲back to top


i) Delineation of responsibilities
The health and well-being of infants is the prime responsibility of parents and health
workers in the community. Infants are entitled to protective, promotive, and curative
health inputs and services and, therefore, failure to discharge this basic responsibility
means denial of basic care which, in turn, means risk to life of the infant.
ii) Specification of Stages
The life cycle of an infant involves nine months before and 12 montm after birth,
and, therefore) whatever happens during this period has some impact on its life. This
period can be broadly divided into pre-natal and post-natal periods and further subdi-
vided into three trimesters before birth, and into peri--natal, neo-natal and post-neo-
natal around or after hirth, depending on certain inputs and services needed by the
infant at those stages.
iii) Identification of Outcomes and Risks
The main outcome under investigation is infant mortality. However, mortality is the
final outcome of morbidity and debility which are intermediate outcomes. In this
analysis, all these three outcomes are considered as part of the larger morbidity process.
The absence or inadequacy of any essential characteristics like environment, health
inputs or services, that can trigger off and accentuate the morbidity process, and
increase the probability of the final outcome, is considered a risk factor. The critical
factors are : physical and social environment; sanitation and water; mother's education
and fertility history; pre-natal and post-natal care of the mother and the infant; breast
and supplementary feeding, etc.
i'D) Calculation of Pre'Dalence and incidence Rates and Rela#'De'lUldAttribu-
table risks
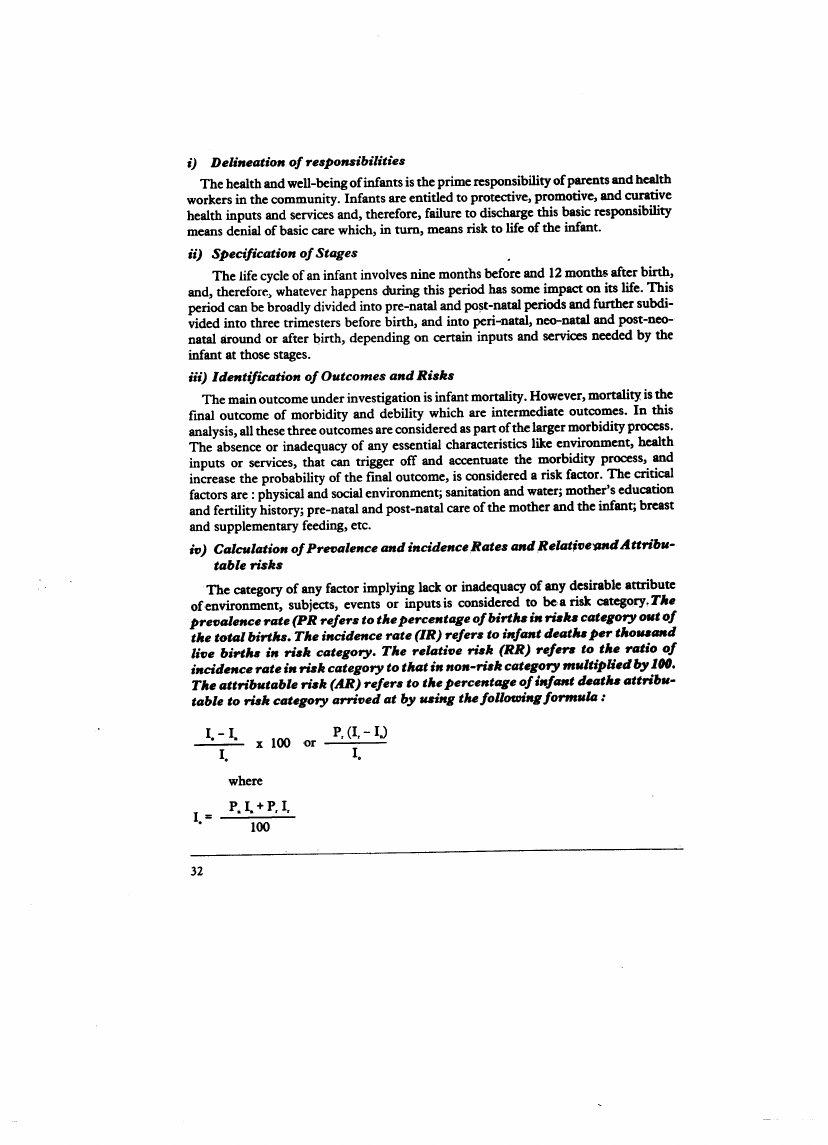
The category of any factor implying lack or inadequacy of any desirable attribute
of environment, subjects, events or inputsis considered to bea risk category,rlle
pre'Dalence rate (PR refers to tile percentage of birtlls in risks category out of
tile tot41 birt,". rile incidence rate (IR) refers to infant deat," per tllo •••and
li'De bin," in risk category. rile relati'De risk (RR) refers to tile ratio of
incidence rate in risk category to tllat in non-risk category ".ultiplied by 100.
rile attributable risk (AR) refers to tile percentage of illfant deat," attribu-
table to risk category arri'Ded at by "';118 tile following formula :
I. - I.
I.
P, (I, - IJ
I.
p. I. + P, I,
100

4.10 Page 40

▲back to top


In := Incidence rate in non-rislll category
Ir = Incidence rate in risk category
Pn = Prevalence rate in non-risk category
P. = Prevalence rate in risk category
In other words, the figure of relative risk tells us how many times (in percentage
terms) the incidence rate in the risk category is bigger than that in the non-risk category.
For example, the relative risk in 120 implies 1.2 times greater inciq,enceof mortality in
risk category as compared to non-risk category. The attributable risk takes prevalence
rate, incidence rate and relative risk into consideration and tells us what percentage of
infant deaths could be avert~d in a given population if the incidence rate in risk category
is equalised to that in non-risk category. While the relative risk helps us to understand
the gravity of risk, the attributable risk helps us to prioritise risk factors according to
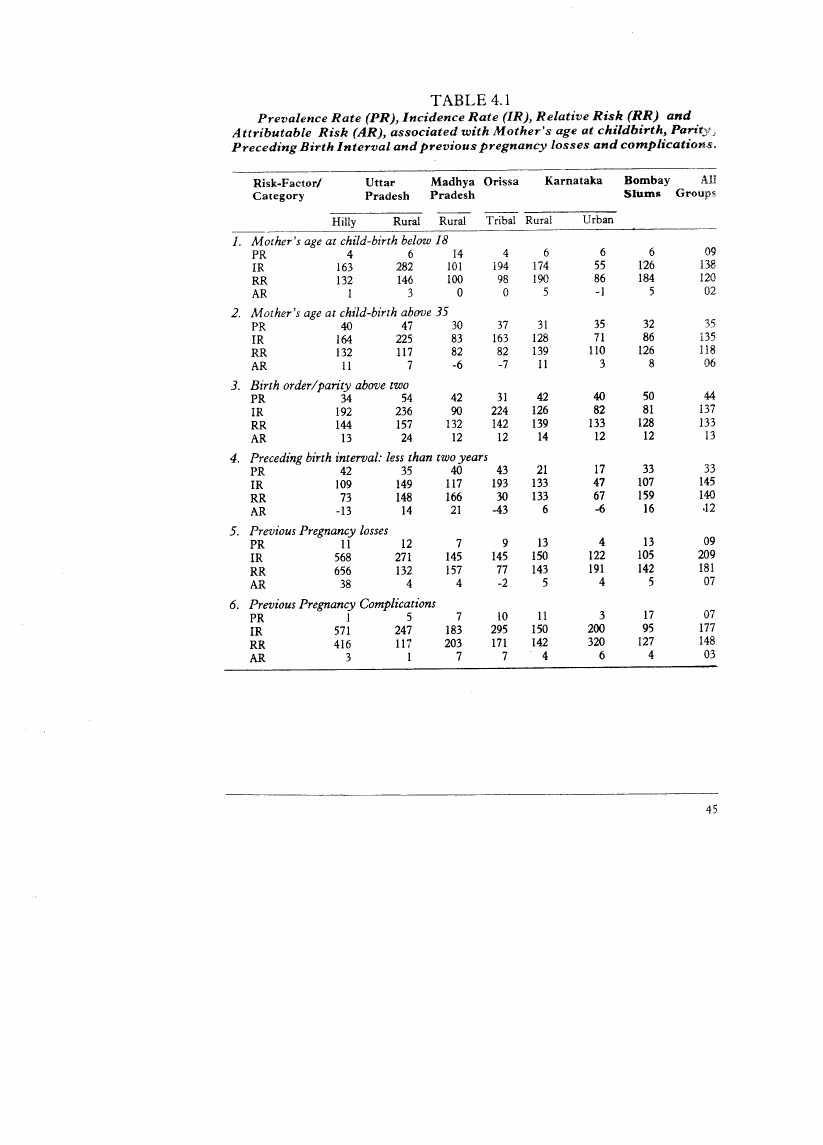
their contribution to the outcome under investigationJTables 4.1 to 4.11( pages4~56)
present these statistics in respect of each population group separately and also when
taken together at the end, with a view to understanding the relative importance and
contribution of individual risk factors and comparing their operation across divergent
population groups. The interpretation of these statistics and conclusions based on them
follows.
4.2 MATERNA'L HISTORY
Table 4.1 shows the relative importance and contribution of six aspects of childbear-
ing to infant mortality in terms of relative risk (RR) and attributable risk (AR).
Almost 44 per cent births were at three and higher order indicating the extent of
deviation from the two-child norm in all population groups and in rural Uttar Pradesh
and Bombay slums above five. For birth order above two, the relative risk increased by
about 33 per cent and in some groups like the rural Uttar Pradesh it increased by 57 per
cent. The infant deaths attributable to this factor are about 13per cent in all groups but
as high as 24 per cent in rural Uttar Pradesh.
The next important risk factor is the preceding birth-interval being shorter than 24
months. Almost 33 per cent children.--WereborQ.within two years from the previous
birth. The relative risk due to this short birth-interval is about 40 per cent in all groups
but as high as 59-per cent in Bombay slums and 66 per cent in Madhya Pradesh. At the
same time, it is not at all a riskfaGtor in Orissa, hilly Uttar Pradesh and urban
Karnataka. In fact, it looks just the opposite and, therefore, needs to be probed further.
Mother's age below 18 and-above 35"is another risk factor. Almost nine per cent
children were born to mothers below 18 and as high as 35 per cent children to those
above 35 years of age. The perce~tage of those born to mothers below 18is as high as 14
per cent in Madhya Pradesh but without any attributable risk. Even in Orissa and urban
Karnataka, maternal age below 18is not a risk factor at all. Only in Uttar Pradesh, rural
Kat:nataka and Bombay slums, it posed considerable risk accounting for three to five per

5 Pages 41-50

▲back to top


5.1 Page 41

▲back to top


cent deaths. Maternal age above 35 is much more prevalent with 18per cent relative risk
and it accounts for six per cent of infant deaths.
Table 4.1 elucidates that the history of previous pregnancy complications and losses
has a tendency to repeat itself, -atleast in five to seven per cent cases, increasing the risk
to child's life by 50 to 80 per cent and taking a toll of about seven and three per cent
infants, respectively.
Further analysis is required to find out the interaction effects of these aspects of
child-bearing on infant mortality, because the effects of multiple risk factors are likely to
be far more devastating than those of any single factor.
4.3 Maternal Health and Diet during Pregnancy
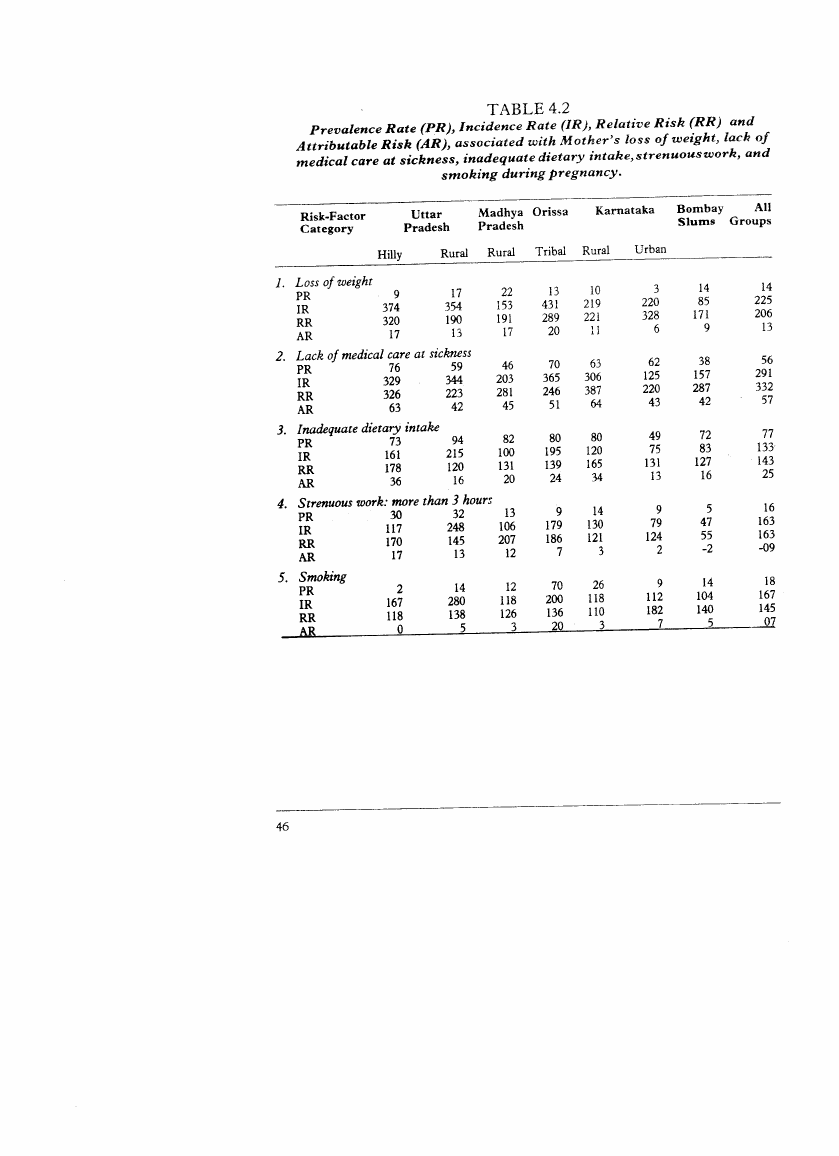
Table 4.2 (see page 46) shows relative and attributable risk associated with maternal
health and dietary factors. Loss of weight during pregnancy is indicative of the risk.
Almost 14 per cent mothers indicated that they were losing weight during preganancy
instead of gaining it. This percentage is as high as 17per cent in rural Uttar Pradesh and
22 per cent in Madhya Pradesh. The relative risk due to this factor almost doubles in all
groups and trebles in hilly Uttar Pradesh, respectively. The relative risk due to this is
three times in all groups, resulting in 57 per cent infant deaths.
Lack of proper medical care at sickness during pregnancy is another risk factor
prevalent in over 56 per cent cases. The prevalence rate goesupto 70 per cent and 76 per
cent in Orissa and hilly Uttar Pradesh, respectively. The relative risk due to this is three
times in all groups, resulting in 57 per cent of infant deaths.
The overall prevalence rate of smoking is 18 per cent but in Orissa it is as high as 70
per cent. The relative risk due to this factor is 45 per cent and that attributable to
smoking in Orissa is about 20 per cent.
Dietary intake during pregnancy is another critical factor. Table 4.2 shows· the
percentage of mothers having dietary intake of different food items below the recom-
mended levels. It is interesting to note that during pregnancy over 50 per cent mothers
are deprived of such essential food items as milk, fat, sugar, eggs and meat which,
combined with strenuous work, emerges as a significant risk factor.
Table 4.2 also shows that the overall relative risk due to inadequate dietary intake is
about 43 per cent but it is as high as 65 per cent and 78 per cent in rural Karnataka and
hilly Uttar Pradesh, respectively. The overall attributable risk is 25 per cent but it is as
high as 35 per cent in rural Karnataka and hilly Uttar Pradesh, respectively. The overall
attributable risk is 25 per cent but it is as high as 35 per cent in rural Karnataka and hilly
Uttar Pradesh.
Note: The attributable risk which means percentage of infant death, is not additive
over the risk factors since this has been extr'acted taking risk factors, one-by-
one, and not all of them together.
.

5.2 Page 42

▲back to top


Strenuous work for more than three hours every day during pregnancy is a risk factor
prevalent in 16 per cent cases. However, in Uttar Pradesh, the prevalanece rate is above
30 per cent, accounting for 15 per cent of infant deaths.
4.4 Pre-natal Care
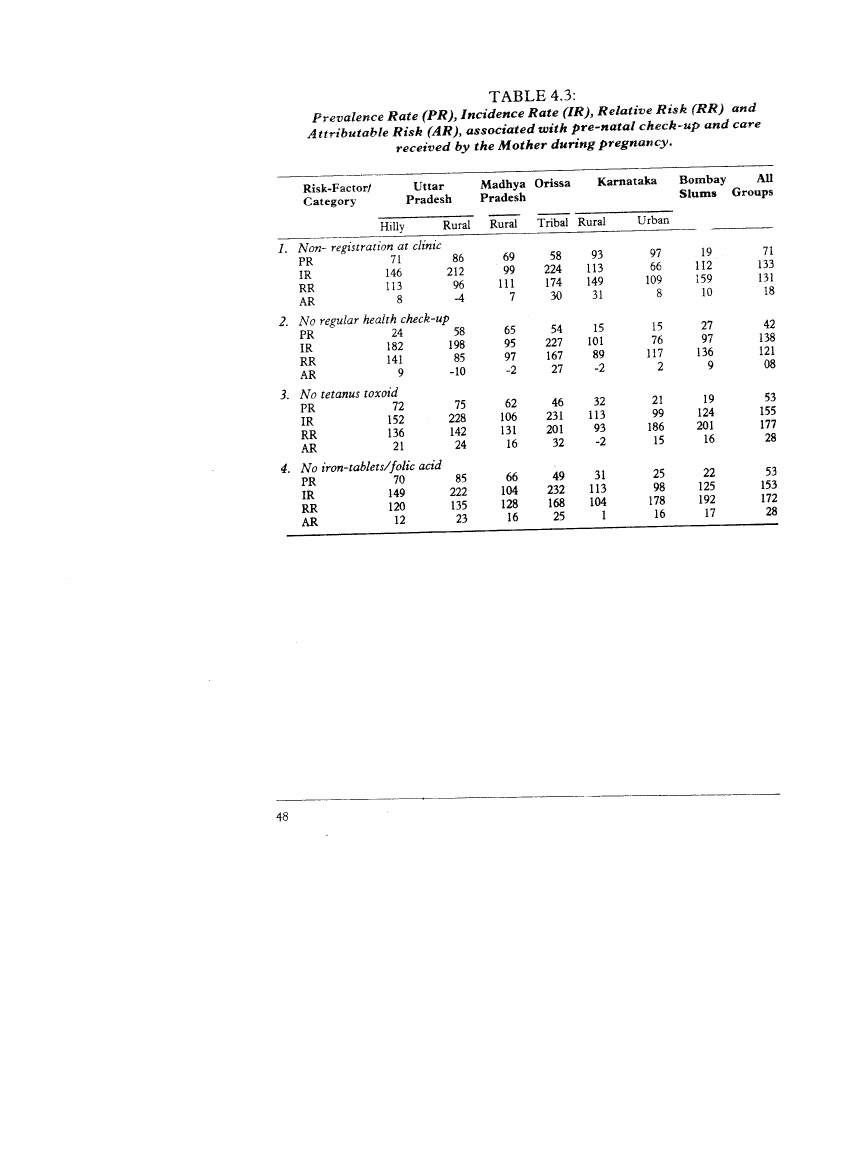
Table 4.3 (see page 48 ) and part of Table 4.5 (see page 50 ) present relative and
attributable risks due to lack of registration and health check-up at clinic including
failure to get tatanus toxoid, iron tablets, folic acid, etc., to mothers before the delivery.
Except for Bombay slums and Karnataka, a large majority of mothers did not receive
tetanus toxoid, iron tablets and folic acid. As a result, the relative risk increased by 75
per cent, accounting for 25 per cent of infant deaths.
Regular health check-up was not available to about 60 per cent mothers in rural Uttar
Pradesh and Madhya Pradesh and above 90 per cent of them did not register themselves
at the clinic in rural Uttar Pradesh and Karnataka.
4.5 Perinatal Factors
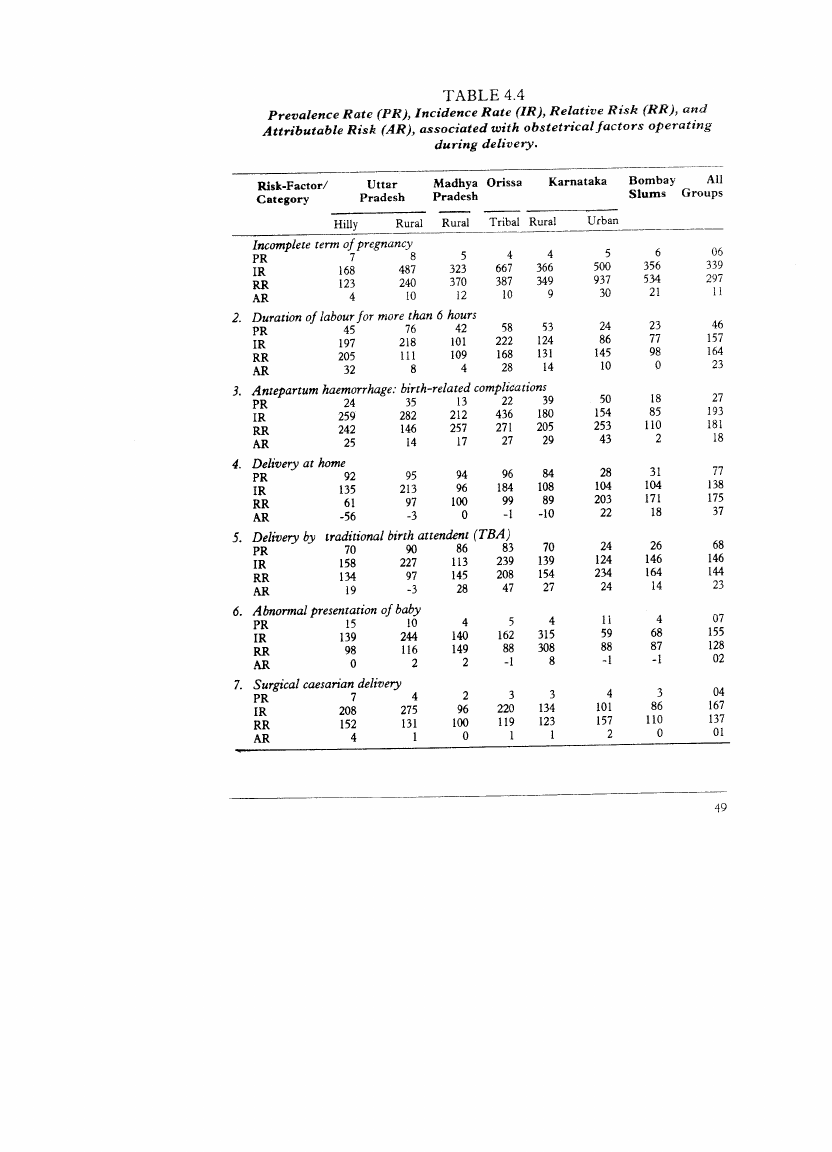
Table 4.4 (see page 49 ) and part of Table 4.5 present relative,and attributable risk
due to peri-natal factors such as incomplete term of pregnancy, duration of labour for
more than six hours, ante-partum haemorrhage, abnormal presentation of baby, surgi-
cal delivery, home delivery, delivery by traditional birth attendent, low birth weight and
birth-related complications.
The prevalence rate of incomplete term of pregnancy varies from four to eight per cent
in most groups but reaches 17 per cent in hilly Uttar Pradesh. The relative risk due to
this factor is roughly three times higher and infant deaths attributable to it are 11 per
cent.
Prolonged labour for more than six hours is prevalent in 46 per cent cases. The
prevalence rate is lowest in urban Karnataka and Bombay slums. In hilly, rural and
tribal groups elsewhere, it varies from 42 to 76 per cent. The relative risk due to this
factor does not increase much in Bombay slums, Madhya Pradesh and rural Uttar
Pradesh, but in other groups, it increases by 30 to 100 per cent, accounting for 23 per
cent of infant deaths.
The prevalence rate of excessive bleeding or antepartum haemorrhage varies from 18
per cent in Bombay slums to 50 per cent in urban Karnataka. The relative risk due to
this also varies from 10per cent in Bombay slums to 17per cent in Orissa, accounting for
30 to 40 per cent of infant deaths.
Abnormal presentation of baby requiring_ surgical delivery are high-risk factors but
least prevalent, accounting for one to two per cent of infant deaths.
Home delivery which is prevalent in more than 84 per cent cases in most groups, takes a
heavy toll of infants except in urban Karnataka lUldBombay slums where it is least

5.3 Page 43

▲back to top


prevalent. Overall, it carries relative risk of 75 per cent, accounting for 37 per cent of
infant deaths. This fmding has two implications. First, there seems to be a tendency in
the rural folk to go to clinic or hospital only in case of grave emergency, leading to .
avoidable deaths. Second, recourse to home delivery in urban areas implies inadequate
a~cess to reliable services and in some cases results in grave risk leading to more infant
deaths.
Delivery by traditional birth attendent is a critical risk factor prevalent in about 68 per
cent cases. Only 25 per cent cases in urban Kamataka and Bombay slums were attended
by traditional birth attendant (TBA), increasing the relative risk by 64 to 134 per cent,
and accounting for 14 to 47 per cent of infant deaths.
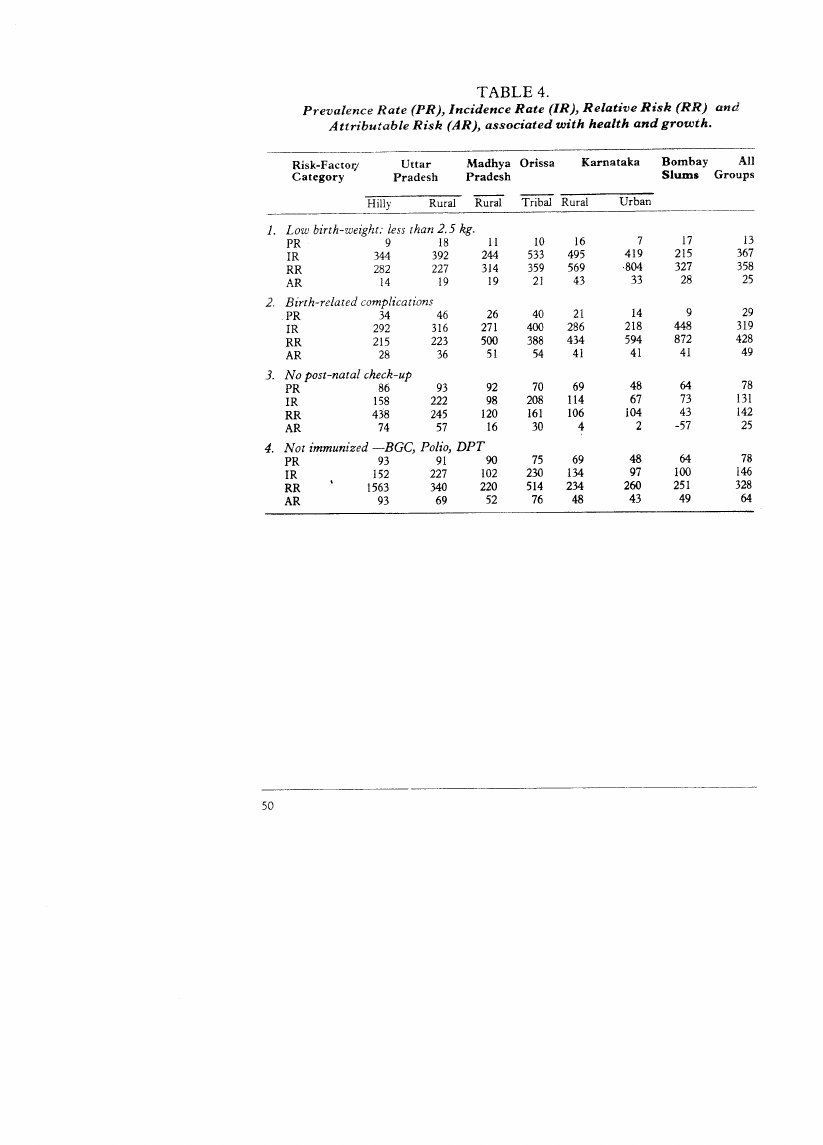
Low birth weight of a baby (below 2.5 Kg) is considered a risk and was found to be
prevalent in and around 10 per cent cases in urban Kamataka, hilly Uttar Pradesh,
Madhya Pradesh, Orissa and around 18 per cent in rural Kamataka, rural Uttar Pradesh
and B(,mbay slums. Almost 25 per cent infant deaths can be attributed·to this factor,
maximum being recorded in Kamataka.
Birth-related complications pose a grave danger to the life of the new-born, particu-
larly when proper medical care and attention is not available. The prevalence rate (or
this risk factor is low in urban Kamataka (14 per cent) and in Bombay slums (nine per
cent) but is quite high in hilly Uttar Pradesh (34 per cent), Orissa (40 per cent) and rural
Uttar Pradesh (46 percent). The relative risk due to this factor is four times higher and
accounts for nearly 50 per cent of infant deaths.
This post-natal check-up immunization was not available to about 80 per cent
chjldren of all groups. Even in urban Kamataka and Bombay slums, around 50 to 60 per
cent were not given immunization. Preliminary analysis, which does not take into
account the fact that in case of early infant deaths the children might not have been
eligible for certain services like immunization, supplementary feeding, etc., and trunca-
tion effects are not considered, shows that in the absence of immunisation, the relative risk
increases by three to five times and endangers the life of about 64 per cent of children.
The percentJlge distribution of mother and children affected by bjrth;related prob-
lems and compltcations is presented in Table 4.12, 4.13 and 4.14 (pages 57,,5&md59 )
4.6 Post-natal Factors
Table 4.6 (see page 51 ) presents post-natal factors such as inadequate breast-
feeding and supplementary feeding, illness, poor heaith, weight loss and growth retar-
dation during the first six months. Here too the analysis does not take into account the
fact that babic;s who died in infancy, were observed only for short periods of time, which
means that effects of truncation are not taken into account.
Alm0S' 59 per cent of infants were inadequately breast-fed in that breast-feeding was
either delayed or interrupted during mother's or child's illness or continued for a longer
time without supplementary feeding. This type of inadequate feeding was most preval-
ent in Orissa (87 per cent) followed by Madhya Pradesh (75 per cent) and least prevafent

5.4 Page 44

▲back to top


in Karnataka. IMR related to this factor, however, was highest in rural Karnataka (556)
and Bombay slums (527). Almost 72 per cent of infant deaths in Bombay slums were
attributable to inadequate breast-feeding, followed by 67 per cent in Madhya Pradesh,
59 per cent in hilly Uttar Pradesh, rural Karnataka and Bombay slums, respectively.
Such a large percentage of children were deprived of timely supplementary feeding.
IMR due to this factor was over 200 in rural Uttar Pradesh and Orissa and the relative
risk was over four times higher in Madhya Pradesh, Orissa and Bombay slums taking
the toll of more than 70 per cent infants born.
Poor health, loss of weight and delayed growth during the first six months was prevalent
in 13,29 and 73 per cent cases, accounting for 30, 49 and 57 per cent deaths respectively.
The cumulative impact must be quite bad because poor health leads to weight loss which
leads to growth tetardation which in turn, leads to premature death.
Growth of the infant can be delayed or retarded due to morbidity, malnutrition and
poor health status described earlier. The baby steadying his neck after two to three
months as the first indication;was prevalent in 48per cent cases,highest being in urban
Karnataka, Bombay slums and rural Uttar Pradesh (over 55 per cent). Rolling after four
to six months was prevalent in 59 per cent cases, highest again in the same population
groups. Crawling after six to seven months, sitting after eight to nine months and
standing after 10-11 months are some more indicators of delayed growth at later stages.
Interestingly, the gro~h retardation rates look higher and faster in Bombay slums,
urban Karnataka and rural Uttar Pradesh during the first six months and in Madhya
Pradesh and Orissa during the next six months of infant's life.
Table 4.7 (see page 52 ) shows prevalence and incidence rates and relative and
attributable risks due to main categories of illness or ill-health. Almost 29 per cent
children suffered from birth-related illnesses followed by fever, diarrhoea and cough for
about 14 per cent each. Analysis of attributable risk shows that 65 per cent deaths are
attributable to birth-related problems and around 25 per cent each to fever, diarrhoea and
cough. Besides these, other clear symptoms account for 32 per cent deaths, circulatory
and nervous disorder for about eight per cent and malnutrition for about 25 per cent.
4.7 Environmental Factors
Drinking water, sanitation, hygiene and housing are other environmental factors
which need to be taken into consideration and provided at a wide scale to avert deaths by
means of providing healthy environment and through proper peri-natal, neo-natal and
post-neo-natal health care. Tables 4.9 and 4.IO( pages 54 and 55) show relative and
attributable risks connected with these factors along with prevalence and incidence
rates.
Unsafe water taken from open ponds, rivers or kutcha wells as well as non-filtering of
water before domestic use are formidable risk factors. Except in Bombay slums and
urban Karnataka, where reasonable tap water facilities are available, a vast majority of
the population living in other project areas continues to be deprived of safe drinking

5.5 Page 45

▲back to top


water. The prevalence rate of'water-bome diseases is as high as 88 per cent in Orissa, 68
and 63 per cent in rural and hilly Uttar Pradesh and 57 per cent in Madhya Pradesh.
Due to this critical factor, IMR tends to increase by 1.6times in all groups, 1.7 times in
Orissa and 1.6 times in the hilly Uttar Pradesh, accounting for 22, 39 and 26 per cent
cdeaths, respectively.
More hazardous than the unsafe water at source is unfiltered water which is perforce
consumed by the people. Its use is prevalent in 81 per cent cases in all groups, 95 per
cent cases in Orissa, 92 per cent in rural Kamataka and 91 per cent in hilly Uttar
Pradesh. Even in urban Kamataka and Bombay slums, it is prevalent in 50 andc75 per
cent cases, respectively. Relative risk due to this factor alone tends to increase mortality
1.6 times, accounting for 33 per cent deaths, the highest bein~ 44 per cent in Bombay
slums and 43 per cent in hilly Uttar Pradesh.
Again, more than 90 per cent people in hilly, rural and tribal groups have the habit of
using open fields or pit latrines. for defecation Even in urban Kamataka and Bombay
slums, 31 and 11 per cent people respectively follow the same highly unhygienic
practice. It is not known to greatly increase relative risk in Orissa and Bombay slums,
but in other population groups, the relative risk due to this factor is 1.6 times higher in
urban Kamataka, 1.7 times in Madhya Pradesh and 1.5 times in rural Uttar Pradesh,
accounting for 17,41 and 32 per cent of infant deaths, respectively.
Open drainage and garbage disposal near or around the house are also serious risk
factors. These factors are prevalent in 34 and 39 per cent cases, increasing the relative
risk by 1.3and 1.2times and accounting for nine and seven per cent deaths, respectively.
As compared to other groups, such drainage is as hazardous in Orissa and Madhya
Pradesh and as is garbage disposal in Orissa and urban Kamataka.
Two aspects of housing are regarded hazardous. These are kutcha construction and
poor ventilation. In Orissa and Madhya Pradesh, 88 and 75 per ceqt people still live in
kutcha houses, where relative risk due to this factor tends to increase by 2.4 and 1.6
times, accounting for ?6 and 31 per cent infant deaths, respectively. Similarly, poor
ventilation is prevalent in 88 and 70 per cent in Orissa and Madhya Pradesh, respec-
tivdy, without any significant relative and attributable risk. However, the relative risk
due to this factor increases by 1.9and 1.6times, accounting for28 and 25 per cent deaths
in hilly Uttar Pradesh and.rural Kamataka, respectively.
Lack of electricity is another negative factor. For instance, electricity was nQtavailable
in about 95 per cent of the houses, almost doubling the relative risk due to living in dark
and dingy environment, accounting for about 49 per cent deaths in Orissa and rural
Uttar Pradesh.
Lack of sufficient warm clothing, mosquiulnets and common medicines within the house
were also counted as contributory factors, increasing relative and attributable risks. In
the absence of sufficient winter clothing, the relative risk of ordinary respiratory
diseases increased almost 1.4 to 1.5 times, accounting for 21 to 31 per cent deaths in

5.6 Page 46

▲back to top


Orissa, Madhya Pradesh and rural Uttar Pradesh.
In the absense of mosquito nets, the infant mortality risk increased by 1.4to 2.2 times
accounting for 25 to 51 per cent infant death in Bombay slums, rural Uttar Pradesh,
Orissa, and Madhya Pradesh where prevalence of malaria or other viral diseases,
varied from 65 to 86 per cent.
Common indoor medicines were not available in 70 to 99 per cent homes in almost all
population groups. Consequently. the chances of infant mortality increased 1.5 to 2.1
times, accounting for 31 to 51 per cent deaths. Only in urban Karnataka, where too 52
per cent houses did not have access to indoor common medicines, the mortality chances
increased marginally by 1.3 times, resulting in 15 per cent of infant deaths.
Season of delivery was also found to be a risk factor. Interestingly, about 40 per cent of
deliveries took place in winter, 21 per cent in summer and the rest 39 per cent during the
monsoons. Summer seems to have increased the mortality chances by 1.2 to 1.5 times,
accounting for five to 16per cent infant deaths in Uttar Pradesh, Orissa and Karnataka.
4.8 Socio-Economic Factors
Table 4.11 (see page56) shows relative and attributable risks due to adverse socio-
economic conditions such as working-class background; low family income (below ~s .
.500.00 per month); illiterate parents;and lack of participation in local organizations.
These factors generally imply overall deprivation or poor access to resources, which
could enable or motivate parents to secure proper care at pre-natal and post-natal stages
for mother and child, thus reducing the risk to child's life.
In occupational terms, in Orissa, Madhya Pradesh and rural Uttar Pradesh, 72,47,
and 21 per cent parents, respectively belonged to labour class and mortality chances in
this group increased by 2.5 to 3.0 times, accounting for 28 to 51 per cent of infant
deaths. Even in urban Karnataka, where only 23 per cent parents belonged to labour
class, the mortality hazards increased by 2.2 times, accounting for 21 per cent of infant
deaths.
The percentage of families having income less than Rs. 500 a month is as high as77 in
Orissa, 56 in rural Karnataka, 51 in rural Uttar Pradesh and 50 in Madhya Pradesh. As a
result of this low family income, the mortality chances increased by 1.5 to 2.3 times,
accounting for 11to 31 per cent infant deaths. Poverty is rampant in Orissa, rural Uttar
Pradesh and Madhya Pradesh, taking a heavy toll of infant life.
Neither the father nor the mother was found to be literate in 61 per cent cases in hilly
Uttar Pradesh. As a result of such pervasive illiteracy among parents, the mortality
chances increased by 1.3to 2.7 times, accounting for 12to 42 per cent of infant deaths in
most of these groups.
Lack of mother's participation in local organization appears to be a crucial risk factor. It
is more important than any other socio-economic status factor considered in this
analysis. Almost 90 to 98 per cent mothers did not participate in any local organization.

5.7 Page 47

▲back to top


As a result of this denial of exposure to the natural modernisation process, programme
impulses or social influences, the mortality chances increased in some groups by as
much as 1.8 to 10.0 times, accounting for 36 to 89 per cent deaths. In Orissa, almost 89
, per cent deaths were attributable to non-participation of mothers in local organization
which in actual effect denoted even the most ordinary lack of access to health-eare
services.
4.9 Fertility Factors
Some fertility factors were used in this analysis as antecedent and others as conse-
quent factors. Earlier on, maternal and pregnancy history factors were used as antece-
dent factors. These were: mother's age at child birth; parity; preceding birth. interval;
previous pregnancy losses; and medical complications. It was found that high-parity
and short birth-intervals were risks which tended to increase considerably in combina-
tion with other factors like maternal age at child-birth, and past history of previous
pregnancy complications and losses.
An attempt has been made to find out the extent to which infant mortality affects the
later part of fertility behaviour and intentions. Table 4.8 (see page 53) shows that the
percentage of women wanting more than three children varies from 66 in Orissa, 59 in
rural Uttar Pradesh, 57 in Bombay slums, 45 in urban Kamataka and 41 in hilly Uttar
Pradesh to 39 in rural Karnataka and 36 in Madhya Pradesh. The desire to have more
children increases by 1.1 to 1.2 times as a result of infant deaths in all groups except in
Madhya Pradesh and hilly Uttar Pradesh. The percentage of mothers wanting more
children to ensure that the desired number eventually survived is as high as 84 in rural'
Karnataka, 72 in hilly Uttar Pradesh, 65 in Bombay slums and 50 to 57 in other groups.
The replacement or insurance motive becomes stronger as a result of infant mortality
earlier by about 1.5times in urban Karnataka, Madhya Pradesh and rural Uttar Pradesh
and by 1.4 times in Orissa. Infant mortality does not affect this motive significantly in
hilly Uttar Pradesh, rural Karnataka, and Bombay slums. There the effect is just the
opposite in that they do not seem to want more children!
It is interesting to note from this table that almost seven per cent mothers became
pregnant after the birth of the index child. Those who became pregnant had relative risk
of 201 per cent implying that they register almost double the infant mortality as
compared to women who did not become pregnant up to the time of survey. This shows
that infant mortality possibly affects behaviour more than fertility intention, .in almost all
groups.
So far, risk analysis has been presented in the foregoing paragraphs. It was simple
enough to understand relative and attributable risk' of various factors, operating at
pre-natal and post-natal stages. However, it was not possible to control socio-economic
and environmental factors. as well as maternal attributes with a view to rigorously
ascertaining independent and direct contribution of those factors. It was not possible

5.8 Page 48

▲back to top


to decompose direct and, indirect effects and firmly establish cause-and-effect relation-
ships. On the contrary, itwas assumed as if it was the only cause and it had nothing to do
with other causes. In order to overcome this problem, path analysis is used for-finer
analysis.
Path analysis is a multivariate, multi-stage, regression model. Cause-and-effect
relationships between relevant factors postulated on the basis of theory, logic and
temporal sequence are empirically examined by multiple regression, using
standardized regression or beta or path co-efficients, indicating independent and
direct effect of a causative .factor on the concerned dependent variable or fact.
For path analysis, the following steps were taken:
i) Only the £ases completing one year after birth were included in analysis;
ii) most of the variables were transformed into dichotomous ones having risk as well as
non-risk categories, coded as one and zero respectively as used in risk-analysis;
iii) values of unidimensional, consistent and scalable variables were simply added to
give summated scores to be used in path analysis;
iv) outcome factors were distinguished from risk factors and equations were set up to
explain each outcome separately and together; and
v) beta co-efficients were used to ascertain independent and direct contribution of
each risk factor to outcome factor after controlling or parcelling out the effects of all
the rest in the equation.
The results thus generated using otigin option (without intercept) are presented in
Tables 4.15 and 4.16 (pages 60 and 61 ) in a condensed and summary form for each
group, separately and also together. Tables 4.8 and 4.9 concern mothers and infants as
affected by the symptoms of-diseases and malnutrition.
Three outcome factors were identified as morbidity based on the history of child's illness,
debility based on indicators of delayed or retarded growth at various stages and mortality
based on survival status. They caused impact singly or collectively.
These outcome factor:s were explained recursively by five risk factors derived from
relevant reliables sucl)'as: Lack of improved sanitation and water; lack of mother's
education and social participation; lack of fertility regulation of any kind in the past; lack
of pre-natal care for the mother; and lack of post-natal care for the child.
Pre-natal care includes concern about mother's diet, immunization, treatment at
sickness and at child birth. Post-natal care includes child's treatment at birth and at
sickness, immunization, breast and supplementary feeding.
The R2 indicates the per cent variance explained in any dependent variable. Table
4.15 shows that the per cent variance explained in mortality by the above mentioned
factors is hardly eight in Bombay slums, nine in urban Karnataka and 25 and 29 in

5.9 Page 49

▲back to top


Orissa and Madhya Pradesh, respectively. In generalR21s small because the cases of
infant deaths are very few and it is comparatively smaller in urban Karnataka and
Bombay slums, which means in urban areas, and bigger in Orissa and Madhya Pradesh,
to which means in tribal areas, because of differential access health services.
The per cent variance explained in debility ranged from 41 in Madhya Pradesh to 69
in rural Uttar Pradesh and that in morbidity ranged from 46 in urban Karnataka to 89 in
Orissa (Table 4.15).
Since risk factors operate through morbidity and debility and ultimately lead to
mortality, a simple index varying from zero to three was developed and used in
regression again, where zero means no morbidity and debility, one means either
morbidity or debility, two means both morbidity and debility and three means mortal-
ity. The variance spelt out in this composite index is not only better but it brings out the
effects of other risk factors more prominently. It ranges from 72 in urban Karnataka, to
83 in rural Uttar Pradesh (nble 4.16). If only ail explanation of mortality is attempted,
all the five factors turn out to be insignificant in urban Karnataka and all but post-natal
care are insignificant in rural Karnataka, Madhya Pradesh and rural Uttar Pradesh. In
other groups, just two or three factors are significant but without such consequence.
Since any intervention would aim at preventing anyone or combination of these
outcomes, a composite index was used later on.
.
If the aim is to prevent only morbidity then it seems that post-natal care is most
crucial in urban areas of Karnataka and rural areas of Uttar Pradesh ,..1lothpre-natal and
post-natal care are most crucial inUttar Pradesh and Madhya Pradesh (fable 4.16), and
mother's education is crucial in all groups except in Madhya Pradesh ,and urban
Karnataka. Improved sanitation plays important role in all areas except Karnataka and
fertility history matters significantly in all groups except Madhya Pradesh and Orissa
(Table 4.16).
If the aim IS to prevent all three adverse outcomes, then different interventions will be
needed in different groups. These are listed below in the order of their contribution and
importance (table 4.16):
- in hilly Uttar Pr,adesh, it is post-natal care, fertility regulation, imporved sanitation
and mother's education;
- in rural Uttar Pradesh, it is the post-natal care, pre-natal care, mother's education,
fertili!.y regulation and impr.oved sanitation; and in Madhya Pradesh, it is just
the post-natal care;
in Orissa, it is the post-natal care and pre-natal care;
in rural Karnataka, it is mother's education, post-natal care, pre-natal care and
fertility regulation;
.in urban Karnataka, it is post-natal care, pre-natal care and fertility regulation; and

5.10 Page 50

▲back to top


in Bombay slums, it is post-natal care, mother's education, pre-natal care and
fertility regulation.
Group-wise analysis by stages could further help in identifying specific items within
each factor in order to arrive at the optimum mix of intemventions required to prevent
morbidity, debility and mortality outcomes on the basis of attributable risks.
Path analysis has also brought out (seeThble 4.16) that lack of mother's education and
fertiflity regulation was clearly responsible for pre-natal and post-natal neglect, because
it implies mother's ignorance, irresponsible parenthood and inability to avail pre-natal
and post-natal services, when required.
While considering fertility bahaviour as a dependent v~iable to be explained by all
the rest, it was found that when the child suffers or dies or when pre and post-natal care
is not available and mother is illiterate, then the replacement and insurance behaviour
sets in much more prominently almost in all groups.
Considering the cause-and-effeet relationships of these risk and outcome factors,
they can mediate to produce happy outcomes and play an important role by empower-
ing mothers on the one hand and the community health workers on the other. The
following paradigm which has considerable practical implications, can be suggested.

6 Pages 51-60

▲back to top


6.1 Page 51

▲back to top


The paradigm indicates that by empowering mothers with the knowledge of risk
factors and enhancing their individual capacity to cope with them, a mother will be able
to improve sanitation, adopt sound health practices, use pre-natal and post-natal care
and eventually prevent the undesirable outcomes of infant morbidity, debility and
mortality and avoid too early and too many unwanted pregnancies.
Similarly, it suggests that by empowering grass-root community health workers with
necessary knowledge of risk factors and enhancing their capability and improving
health services, they will be able to provide better pre-natal and post-natal care, help
mothers in improving domestic sanitation and regulating fertility and through a health·
care regimen help prevent undesirable outcomes like morbidity, debility and mortality
and consequently fertility.
The two-way relationship between empowered mothers and heaith workers rests on
the premise that while workers will provide necessary services and monitor health,
mothers will avail themselves of the services and also provide feed-back. Through
regular training and systematic visits of health workers and contact with mothers, a
sound health-care relationship between the two can be established.

6.2 Page 52

▲back to top


TABLE 4.1
Prevalence Rate (PR), Incidence Rate (IR), Relative Risk (RR) and
Attributable Risk (AR), associated with Mother's age at childbirth, ParitY3
Preceding Birth Interval and previous pregnancy losses and complicationso
Risk-Factor/
Category
Uttar
Pradesh
Madhya Orissa
Pradesh
Karnataka
Bombay
An
Sltlmll Groups
Hilly Rural Rural Tribal Rural Urban
1. Mother's age at child-birth below 18
PR
4
6
14
4
6
6
6
09
IR
163
282
101 194 174
55
126
138
RR
132
146
100
98 190
86
184
120
AR
1
3
0
0
5
-1
5
02
2. Mother's age at child-birth above 35
PR
40
47
30
37 31
35
32
35
IR
164
225
83 163 128
71
86
135
RR
132
117
82
82 139
110
126
118
AR
II
7
-6
-7 11
3
8
06
3. Birth order/parity above two
PR
34
54
42
31 42
40
50
44
IR
192
236
90 224 126
82
81
137
RR
144
157
132 142 139
133
128
133
AR
13
24
12
12 14
12
12
13
4. Preceding birth interval: less than two years
PR
42
35
40
43 21
17
33
33
IR
109
149
117 193 133
47
107
145
RR
73
148
166
30 133
67
159
140
AR
-13
14
21 -43
6
-6
16
-12
5. Previous Pregnancy losses
PR
11
12
7
9 13
4
13
09
IR
568
271
145 145 150
122
105
209
RR
656
132
157
77 143
191
142
181
AR
38
4
4
-2
5
4
5
07
6. Previous Pregnancy Complications
PR
1
5
7
10 11
3
17
07
IR
571
247
183 295 150
200
95
177
RR
416
117
203
171 142
320
127
148
AR
3
1
7
7
4
6
4
03

6.3 Page 53

▲back to top


TABLE 4.2
Prevalence Rate (PR), Incidence Rate (IR), Relative Risk (RR) and
Attributable Risk (AR), associated with Mother's loss of weight, lack of
medical care at sickness, inadequate dietary intake,strenuouswork, and
smoking during pregnancy.
Risk-Factor
Category
Uttar
Pradesh
Madhya Orissa
Pradesh
Karnataka
Bombay
All
Slums Groups
Hilly
Rural Rural Tribal Rural Urban
1. Loss of weight
PR
9
17
22
13 10
3
14
14
IR
374
354
153 431 219
220
85
225
RR
320
190
191 289 221
328
171
206
AR
17
13
17
20 11
6
9
13
2. Lack of medical care at sickness
PR
76
59
46
70 63
62
38
56
IR
329
344
203 365 306
125
157
291
RR
326
223
281 246 387
220
287
332
AR
63
42
45
51 64
43
42
57
3. Inadequate dietary intake
PR
73
94
82
80 80
49
72
77
IR
161
215
100 195 120
75
83
133
RR
178
120
131 139 165
131
127
143
AR
36
16
20
24 34
13
16
25
4. Strenuous work: more than 3 hours
PR
30
32
13
9 14
9
5
16
IR
117
248
106 179 130
79
47
163
RR
170
145
207 186 121
124
55
163
AR
17
13
12
7
3
2
-2
-09
5. Smoking
PR
2
14
12
70 26
9
14
18
IR
167
280
118 200 118
112
104
167
RR
118
138
126 136 110
182
140
145
AR
0
5
3
20
3
7
5
07

6.4 Page 54

▲back to top


TABLE 4.2 (a)
Percentage Distribution of mothers having inadequate
dietary intake of different food items.
Food
Below
Recommendation
Cereals
(up to 9 chapaties
Pulses
(up to 3 bowls)
Leafy vegetables
(up to 2 bowls)
Other vegetables
(up to 1 bowl)
Roots and tubers
(up to 1 bowl)
Milk
(up to one cup)
Fat/oil
(up to 1 teaspoon)
Sugar/Jaggery
(up to 1 teaspoon)
Eggs (in a week)
up to 6
Meat/fish
(in a week)
up to 200 gms.
Uttar
Pradesh
Madhya Orissa
Pradesh
Hilly
Rural Rural Tribal
46
41
55
36
40
41
50
32
41
46
60
37
43
57
66
39
45
68
71
55
48
61
79
79
65
66
72
79
44
64
68
79
73
94
94
76
72
93
82
88
Karnataka
Bombay
All
Slums Groups
Rural Urban
32
26
52
37
33
17
61
35
35
28
63
46
36
23
55
50
42
30
77
59
49
49
72
65
51
49
64
65
47
43
49
58
80
61
83
84
65
59
72
77

6.5 Page 55

▲back to top


TABLE 4.3:
Prevalence Rate (PR), Incidence Rate (IR), Relative Risk (RR) and
Attributable Risk (AR), associated with pre-natal check-up and care
received by the Mother during pregnancy.
Risk-Factor!
Category
Uttar
Pradesh
Madhya Orissa
Pradesh
Karnataka
Bombay
All
Slums Groups
Hilly
Rural Rural Tribal Rural Urban
1. Non- registration at clinic
PR
71
86
69
58 93
97
19
71
lR
146
212
99 224 113
66
112
133
RR
113
96
III 174 149
109
159
13l
AR
8
-4
7
30 31
8
10
18
2. No regular health check-up
PR
24
58
65
54 15
15
27
42
IR
182
198
95 227 101
76
97
138
RR
141
85
97 167 89
117
136
121
AR
9
-10
-2
27 -2
2
9
08
3. No tetanus toxoid
PR
72
75
62
46 32
21
19
53
IR
152
228
106 231 113
99
124
155
RR
136
142
13l 201 93
186
201
177
AR
21
24
16
32 -2
15
16
28
4. No iron-tablets/folic acid
PR
70
85
66
49 31
25
22
53
IR
149
222
104 232 113
98
125
153
RR
120
135
128 168 104
178
192
172
AR
12
23
16
25
1
16
17
28

6.6 Page 56

▲back to top


Prevalence
Attributable
TABLE 4.4
Rate (PR), Incidence Rate (IR), Relative Risk
Risk (AR), associated with obstetrical factors
during delivery.
(RR), and
operating
Risk-Factor/
Category
Uttar
Pradesh
Madhya Orissa
Pradesh
Karnataka
Bombay
All
Slums Groups
Hilly
Rural Rural Tribal Rural
Urban
Incomplete term of pregnancy
PR
7
8
5
4
4
5
6
06
IR
168
487
323 667 366
500
356
339
RR
123
240
370 387 349
937
534
297
AR
4
10
12
10
9
30
21
11
2. Duration of labour for more than 6 hours
PR
45
76
42
58 53
24
23
46
IR
197
218
101 222 124
86
77
157
RR
205
III
109 168 131
145
98
164
AR
32
8
4
28 14
10
0
23
3. Antepartum haemorrhage: birth-related complications
PR
24
35
13
22 39
50
18
27
IR
259
282
212 436 180
154
85
193
RR
242
146
257 271 205
253
110
181
AR
25
14
17
27 29
43
2
18
4. Delivery at home
PR
92
95
94
96 84
28
31
77
IR
135
213
96 184 108
104
104
138
RR
61
97
100
99 89
203
171
175
AR
-56
-3
0
-1 -10
22
18
37
5. Delivery by traditional birth attendent (TBA)
PR
70
90
86
83 70
24
26
68
IR
158
227
113 239 139
124
146
146
RR
134
97
145 208 154
234
164
144
AR
19
-3
28
47 27
24
14
23
6. Abnormal presentation of baby
PR
15
10
4
5
4
11
4
07
IR
139
244
140 162 315
59
68
155
RR
98
116
149
88 308
88
87
128
AR
0
2
2
-1
8
-1
-1
02
7. Surgical caesan'an delivery
PR
7
4
2
3
3
4
3
04
IR
208
275
96 220 134
101
86
167
RR
152
131
100 119 123
157
110
137
AR
4
1
0
1
1
2
0
01

6.7 Page 57

▲back to top


TABLE 4.
Prevalence Rate (PR), Incidence Rate (IR), Relative Risk (RR) and
A ttributable Risk (AR), associated with health and growth.
Risk-Factor;
Category
Uttar
Pradesh
Madhya Orissa
Pradesh
Karnataka
Bombay
All
Slums Groups
Hilly
Rural Rural Tribal Rural
Urban
1. Low birth-weight: less than 2.5 kg.
PR
9
18
II
10 16
7
17
13
IR
344
392
244 533 495
419
215
367
RR
282
227
314 359 569
·804 327
358
AR
14
19
19
21 43
33
28
25
2. Birth-related complications
PR
34
46
26
40 21
14
9
29
IR
292
316
271 400 286
218
448
319
RR
215
223
500 388 434
594
872
428
AR
28
36
51
54 41
41
41
49
3. No post-natal check-up
PR
86
93
92
70 69
48
64
78
IR
158
222
98 208 114
67
73
131
RR
438
245
120 161 106
104
43
142
AR
74
57
16
30
4
2
-57
25
4. Not immunized -BGC, Polio, DPT
PR
93
91
90
75 69
48
64
711
IR
152
227
102 230 134
97
100
146
RR
1563
340
220 514 234
260
251
328
AR
93
69
52
76 48
43
49
64

6.8 Page 58

▲back to top


Prevalence
Attributable
TABLE 4.6
Rate (PR), Incidence Rate (IR), Relative
Risk (AR), associated with breasts-feeding,
feeding and immunization.
Risk (RR) and
supplementary
Risk-Factorj
Category
Uttar
Pradesh
Madhya Orissa
Pradesh
Karnataka
Bombay
All
Slums Groups
Hilly Rural Rural Tribal Rural Urban
1. Inadequate breast-feeding
PR
48
38
75
87 26
34
39
59
IR
361
382
315 315 558
171 527
320
RR
397
193
373 201 608
282
761
284
AR
59
26
67
47 57
38
72
52
2. Inadequate supplementary feeding
PR
87
85
93
80 89
63
89
85
IR
152
226
101 216 118
76
85
135
RR
214
163 442 411 248
152 487
218
AR
50
35
76
71 57
25
77
50
3. Suffering from illness
PR
33
62
53
67 50
36
48
34
IR
243
307
171 219 208
137
89
183
RR
258
645
570 468 526
570
102
426
AR
34
77
71
71 68
63
1
53
4. Poor health status in the first six months
PR
8
15
17
15 15
5
9
13
IR
343
521
299 527 345
318
192
371
RR
328
318
542 427 491
571
284
423
AR
15
25
43
33 37
19
14
30
5. Static/decreasing weight in the first six months
PR
21
37
23
19 29
23
50
29
IR
418
378
284 548 240
138
121
273
RR
617
330
693 539 420
310
354
434
AR
52
46
58
45 48
33
56
49
6. Growth faltering in the first six months
PR
77
80
76
71 64
68
72
73
IR
175
242
108 223 160
79
98
150
RR
529
238
190 244 746
207
351
284
AR
77
52
41
51 81
42
64
57

6.9 Page 59

▲back to top


TABLE 4.7
Prevalence Rate (PR), Incidence Rate (lR), Relative Risk (RR) und
Attributable Risk (AR), associated with infection and malnutrition.
Risk-Factor/
Category
Uttar
Pradesh
Madhya Orissa
Pradesh
Karnataka
Bombay
All
Slums Groups
Hilly
Rural Rural Tribal Rural
Urban
1. Causes peculiar to infancy
PR
34
46
.26
IR
292
316
271
RR
310
658
903
AR
42
72
68
2. Fevers (malaria, influenza)
PR
IS
24
21
IR
198
169
122
RR
208
352
406
AR
14
38
39
3. Digestive (gastro-enteritis, dysentery)
PR
10
19
24
IR
288
204
139
RR
304
428
463
AR
17
38
47
4. Coughs (pneumonia, bronchitis)
PR
5
15
26
IR
235
315
126
RR
249
661
418
AR
7
46
45
5. Other clear symptoms
PR
32
17
11
IR
419
564
363
RR
444
1184 1206
AR
52
65
55
6. Circulatory (anaemia, etc.)
PR
2
3
3
IR
272
385
205
RR
289
808
682
AR
4
18
15
7. Nervous (convulsions, meningitis)
PR
1
2
2
IR
'. 428
440
345
RR
454
924 1149
AR
3
14
17
8. Symptoms of malnutrition
PR
8
8
4
IR
270
492
308
RR
287
1025 1027
AR
13
43
27
40 21
400 286
851 715
75 56
34 21
130 75
277 191
38 16
35 14
271 179
379 453
63 33
15 33
189 126
404 318
31 42
6
5
429 619
914 1562
33 42
4
2
852 778
1817 1969
41 27
2
1
667 846
1422 2142
21 17
6
3
539 548
1146 1370
39 28
14
9
218
448
838
515
51
27
18
11
148
31
616
35
48
-8
13
22
123
48
512
55
35
-11
14
17
73
89
304
102
22
0
13
344
85
1428
97
44
0
2
1
556
500
2308
573
31
5
2
2
363
363
1511 417
22
6
2
8
529
40
2034
46
28
-5
29
319
142
)5
i4
120
279
20
14
146
340
25
13
140
326
23
06
383
890
32
01
440
1023
08
01
374
870
07
04
394
916
25

6.10 Page 60

▲back to top


TABLE 4.8
Prevalence Rate (PR), Incidence Rate (IR), Relative Risk (RR) and
Attributable Risk (AR), associated with fertility behaviour and intentions.
Risk-FactoIX
Category
Uttar
Pradesh
Madhya Orissa
Pradesh
Karnataka
Bombay
All
Slums Groups
Hilly
Rural Rural Tribal Rural Urban
1. Contraceptives not used before the index child
PR
45
86
86
97 62
56
87
77
IR
156
217
94
94 117
75
78
130
RR
108
143
82
78 68
146
133
II7
AR
3
27
-18 -27 -25
20
22
12
2. Wants more than thr,eechildren
PR
41
59
36
66 39
45
51
51
IR
136
224
87 193 127
76
83
133
RR
90
122
73 llO 117
121
122
107
AR
-4
II
-11
6
6
9
10
03
3. Wants more children to ensure the survival of desired number
PR
72
50
58
54 84
57
65
62
IR
75
259
112 210 105
78
69
132
RR
52
154
152 135 75
159
74
121
AR
-53
21
23
16 -27
25
-20
12
4. Became pregnant after the index child
PR
6
8
10
8
4
6
7
07
IR
258
237
176 295 486
140
125
231
RR
193
113
201
175 509
228
364
201
AR
5
I
9
6 14
7
16
07

7 Pages 61-70

▲back to top


7.1 Page 61

▲back to top


TABLE 4.9
Prevalence Rate (PR), Incidence Rate (IR), Relative Risk (RR) and
Attributable Risk (AR), associated with drinking water and
environmental sanitation.
Risk-Factor/
Category
Uttar
Pradesh
Madhya Orissa
Pradesh
Karnatalta
Bombay
All
Slums Groups
Hilly
Rural Rural Tribal Rural Urban
1. Unsafe water from pond, river or well used
PR
63
68
57
8 44
IR
163
219
102 194 119
RR
155
109
115 173 114
AR
26
6
8
39
6
2. Unfiltered water used
PR
91
86
IR
148
210
RR
178
90
AR
42
-9
84
95 92
101 186 112
147 121 132
28
17 23
3. Pit-latrine used
PR
91
IR
142
RR
102
AR
2
91
97
98 91
221
97 184 113
152
173
'83 133
32
41 -20 23
4. Open drainage near the house
PR
42
39
IR
153
227
'RR
115
111
AR
6
4
35
40 39
114 220 108
132 137 94
10
13 -2
5. Garbage disposed of near the house
PR
42
40
39
IR
147
229
97
RR
107
113
100
AR
3
5
0
40 47
244 120
170 117
22
7
5
2
35
24
52
30
-2
-1
50
75
87
90
193 205
32
44
31
11
105
51
164
0
17
-12
18
27
87
76
141
95
7
-1
34
37
91
70
171
83
19
-7
47
154
159
22
81
113
162
33
73
. 140
143
24
34
145
128
09
39
137
119
07

7.2 Page 62

▲back to top


TABLE 4.10
Prevalence Rate (PR), Incidence Rate (IR), Relative Risk (RR) and
Attributable Risk (AR), associated with housing co';'ditions.
Risk-Factor/
Category
Uttar
Pradesh
Madhya Orissa
Pradesh
Karnataka
Bombay
All
Slums Groups
Hilly
Rural Rural Tribal Rural Urban
1. Kurcha house
PR
12
56
75
88 31
14
9
46
IR
303
221
105 188 114
118
96
149
RR
223
151
161 244 92
258
183
168
AR
13
22
31
56 -3
18
7
24
2. Poor ventilalion
PR
45
53
70
88 58
30
68
60
IR
191
132
97 185 129
81
76
134
RR
188
121
104 101 156
136
92
125
AR
28
10
3
I 25
10
-6
13
3. Lack of eleetndty in the house
PR
47
95
67
96 60
16
10
58
IR
174
219
96 189 122
131
59
154
RR
155
197
100 201 133
243
73
186
AR
21
48
0
49 17
19
-3
33
4. Insufficient winter clothing
PR
30
56
73
88 76
33
30
57
IR
164
248
104 192 112
84
82
142
RR
125
147
141 150 106
148
108
142
AR
7
21
23
31
4
14
2
19
5. Lack of mosquito nets
PR
38
64
85
73 74
19
86
67
IR
115
239
101 196 114
98
84
133
RR
75
198
140 154 119
196
221
160
AR
-10
39
25
28 12
15
51
29
6. Lack of common medicines
PR
89
94
92
99 90
53
70
85
IR
150
218
99 186 116
76
89
135
RR
211
156
148 152 216
134
168
213
AR
50
34
31
40 51
15
32
49
7. Delivery in summer
PR
26
19
15
21 24
27
23
21
IR
118
249
142 186 13l
51
76
136
RR
86
151
160 109 141
82
98
128
AR
-4
9
8
2
9
-5
0
06
8. Delivery in winter
PR
47
46
52
38 17
25
39
40
IR
154
Z35
87 209 143
80
81
135
RR
113
142
98 127 154
121
105
127
AR
6
16
-1
9
8
5
2
10

7.3 Page 63

▲back to top


TABLE 4.11
Prevalence Rate (PR), Incidence Rate (IR), Relative Risk (RR) and
Attributable 'Risk (AR), associated with socio-economic background of
infants's Parents.
Risk-Fact0Ij'
Category
Uttar
Pradesh
Madhya Orissa
Pradesh
Karnataka
Bombay
All
Slums Groups
Hilly
Rural Rural Tribal Rural Urban
1. Labour-class background
PR
20
27
47
72 50
23
15
37
IR
165
254
120 199 113
118
85
150
RR
112
245
293 245 74
215
56
218
AR
,2
28
48
51 -15
21
-7
30
2. Family income:belowRs, 500.00 per month
PR
15
51
50
77 56
9
13
40
IR
223
256
115 201 120
136
113
116
RR
175
152
148 158 123
232
154
173
AR
10
21
19
31 11
11
7
23
3. Illiterate paren~s
PR
40
43
56
61 57
13
21
40
IR
156
285
103
98 119
128
99
144
RR
100
131
110 132 226
274
154
146
AR
0
12
5
16 42
18
10
16
4. No organizational participation
PR
67
98
97
93 95
91
98
93
IR
166
215
95 196 101
70
78
127
RR
185
200
72 982 91
288
107
156
AR
36
49
-37
89 -9
63
6
34

7.4 Page 64

▲back to top


TABLE 4.12
Percentage Distribution of Mothers affected by the
symptoms of diseases and malnutrition
Svmptoms of diseases
Malnutrition
A During Pregnancy
1. Previous pregnancy losses
2. Previous pregnancy complications
3. Palour
4. Oedema
5. Convulsions
6. Malaria
7. German measles
8. Heart disease
9. Tuberculosis
10. Diabetes
11. Renal infection
12. Hypertension
13. Anaemia
14. Accident/injury
15. Poor health
16. Loss of weight
B. During delivery
Uttar
Pradesh
-
Hilly
Rural
Madhya Orissa
Pradesh
--- ---
Rural Tribal
.__ ._----_.-.-~-_._.._----
Karnataka
Bombay
All
Slums
Groups
Rural
Urban
~------
11
12
7
9
13
4
13
09
1
5
7
10
11
3
17
0'1
63
41
41
58
53
58
30
47
1
5
1
3
3
1
1
02
5
6
2
3
4
[
4
03
15
3
1
1
1
2
1
03
8
8
5
5
3
!
[
04
I
0
I
4
0
0
4
01
1
1
0
3
2
1
I
01
0
1
0
0
1
0
0
00
0
1
0
1
1
0
0
01
0
0
0
1
1
1
1
00
3
2
0
0
0
0
0
01
9
8
5
6
8
4
6
06
21
19
11
19
1
[
1
10
9
17
22
13
\\0
3
14
14
1. Excessive bleeding before the
onset of labour
2. Excessive bleeding after delivery
3. Rupture of perineal region
::;1
18
16
4
10
8
5
2
OF
16
I
25
3
10
~ [7..,
I
I
36
1
48
11
4
'7
ry)
L •.·.
!J')
Coutd

7.5 Page 65

▲back to top


7.6 Page 66

▲back to top


TABLE 4.14
Percentage of Infants by morbidity, malnutrition, poor health and delayed-growth status
Symptoms of diseast
Malnutrition
A Morbidity status
Fevers (malaria)
Coughs (pneumonia)
Digestive disorder (dysentery)
Nervous disorder (meningitis)
Circulatory disorder (anaemia)
General disorder (measles, tetanus)
B Malnutrition status
Pale skin/mucus membrane
Absence of muscles under skin
Deeding of ribs
Swelling on face and feet
Discolouration or loss of hair
Frequent colds and infections
C Poor-health status
Poor health· in general during:
-0-6 months
.
- 7-12 months
Loss of weight during:
- 0-6 months
- 7-12 months
Vl
\\()
Uttar
Pradesh
Hilly
Rural
Madhya
Prade!lh
-Rural
Orissa
Tribal
Karnataka
Bombay
Slums
Rural
Urban
All
Groups
5
24
21
34
21
18
11
14
5
15
·26
IS
33
14
17
13
10
19
24
35
14
13
22
14
I
2
2
2
I
2
2
01
2
3
3
4
2
2
1
01
4
17
II
6
5
6
13
06
2
8
3
5
2
2
8
04
I
4
3
6
2
I
2
03
I
4
4
1
2
I
I
03
4
3
I
5
3
1
1
02
8
4
2
4
2
I
1
03
8
13
10
27
29
18
18
16
8
15
2
5
21
\\
;
37
75
72
17
15
15
6
13
6
23
19
29
78
74
64
5
9
13
3
5
5
23
50
29
77
82
75
Contd.

7.7 Page 67

▲back to top


Outcome of:
1. Morbidity
2. Debility
TABLE 4.15
Determinants of Infant Moridity, Debility and Mortality as indicated
by Beta Coefficients, Multiple Rand R2.
Risk due to lack of:
Uttar
Pradesh
Madhya Orissa
Pradesh
--------_._----_.-
Karnataka
Bombay All
Slums Groups
Hilly Rural
"Rural
Tribal R-ural Urban
1. Improved sanitation
2. Mother's educatioll
3. Fertility regulation
4. Pre-natal care
5. Post-natal care
R
R2
1. Improved sanitation
2. Mother's education
.08
.05
.17
.29
.06@
.10
.09
.10
.21
.21
.17
.22
.21
.06
.41
.19
.07
.11
.12
.05
.18
.07
.08@
.10
54
.28
.30
.19
.24
.01@
.O5@ .26
.24
.29
.20
.25
.18
.36
.24
.27
.80
.87
.87
.95
.78
.68
.81
.84
.64
.76
.76
.89
'.60
.46
.65
.70
.23
.15
.OO@ .01@
.01@
.OO@ .OO@ .Ol@
.13
.17
.03@
.lO@
.36
.O2@ .13
.07
Cootd

7.8 Page 68

▲back to top


Could
3. Morbidity
3. Fertility regulation
4. Pre-natal care
5. Post-natal care
R
R2
1. Improved sanitation
2. Motner's education
3. Fertility regulation
4. Pre-natal care
5. Post-natal care
R
R2
.13
.09
.17
.01@
.08
.22
.18
.14
.07@
.29
.36
.31
.26
.24
.28
.22
.40
.20
.13
.54
.13
.49
.21
.37
.72
.83
.64
.73
.75
.82
.73
.74
.52
.69
Al
.53
.56
.67
.53
.55
.01@
.05@
.09@
.lO@
.()()@
.06@
.O3@
.07
.I0@
.O;@
.01@
.01@
.09@
.05@
.27
.O-l@
.18
.05
.03
.01
.05
.10
.16
.04
.I5@
.OO@ .05@
.32
.07@
.07
.19
.07
.17
.46
Al
.27
.28@
.09
.29
.27
.38
.43
.54
.50
.34
.30
.29
.42
.14
.18
.29
.25
.13
.09
.08
.18
Note: All Beta Co-efficients are significant at 5% level except those marked @
TABLE 4.16
Determinants of Morbidity, Debility,Mortality, Post-natal and Pre-natal Negteet
and Fertility as Indicated by Beta Coefficients and Multiple R.
1. Morbidity
Debility
Mortality
Together
1. Improved sanitation
2. Mother's education
3. Fertility regulation
4. Pre-natal care
Uttar
Pradesh
Hilly Rural
.16
.09
.10
.20
.19
.11
.06@
.27
Madhya Orissa
Pradesh
Rural
Tribal
.09@
.11@
.Ol@
.Ol@
.08@
.37
.03@
.03@
.13
.05@
.33
18
Bombay All
Slums Groups
1O@
.03(ai
01@
.27
1,S
21
.!6
Ir;
23
19
.22
Contd.

7.9 Page 69

▲back to top


'"tv
5. Post-natal care
.44
.32
.41
.37
.26
2. Port-natal
neglect
R
.85
.91
.87
.89
.87
R2
.73
.83
.75
.80
.76
1. Improved sanitation
.19
.14
.07
.44
.05@
2. Mother's education
.04@
.24
.31
.11
.48
3. Fertility regulation
.21
.15
.12
.08
.06
4. Pre-natal care
.54
.44
.39
.52
.35
R
.89
.90
.83
.92
.88
R2
.79
;80
.70
.84
.77
3. Pre-natal
1. Improved sanitation
.31
.40
.39
.74
.39
2. Mother's education
.46
.38
.34
.09
.40
3. Fertility regulation
.22
.17
.24
.14
.08
R
.86
.88
.90
.94
.81
R2
.73
.77
.80
.88
.66
4. Fertility
1. Improved sanitation
.06@
.09
.16
.13@
.08@
2. Mother's education
.06@
.23
.18
.23
.38
3. Pre-natal care
.10@
.09
.29
.28
.02@
4. Post-natal care
.30
.20
.07
.16 '
.06@
5. Infant's health,
growth and survival. .30
.25
.18
.05@
.25
R
.62
.61
.77
.77
.63
R2
.38
.38
.60
.60
.40
Note : All Beta Co-efficients are significant at 5% level except those marked @
.51
.85
.72
.10
.29
.34
.23
.78
.62
.17
.34
.36
.71
.50
.05@
.06@
.15
.24
.34
.60
.36
Cootd
.29
.39
.86
.87
.74
.76
.01@
.13
Al
.21
.31
.17
.19
.43
.85
.86
.72
.73
.11
043
.44
.30
.35
.22
.83
.86
.69
.73
.07
.08
.21
.23
.22
.15
.26
.15
.17
.25
.77
.fi6
.59
.44

7.10 Page 70

▲back to top


This is agist of the study of infant mortality in relation to fertility. The proJect was
sponsored jointly by the Family Planning Foundation (India) and the International
Development Research Centre, Canada (IDRC), approved by the Central and State
Governments and implemented with the help of five leading institutes in five States
(Uttar Pradesh, Madhya Pradesh, Orissa, Kamataka and Bombay) during 1987-88.
The main purpose of this project was to identify the risk factors responsible for high
incidence of infant mortality, examine its relationship with fertility and suggest possible
interventions to simultaneously bring down both infant mortality and fertility in
various population segments viz. hilly, tribal, rural, urban and slum, studied under the
project.
It was prompted by deep concern for distressingly high levels of infant mortality and
the extremely slow decline in IMR. Our research rests on the desire that infant
mortality and fertility rates must fall rapidly and simultaneously through removal of
inequities in the distribution of resources and services with the help of a strong political
will, without any further delay
5.2 UNIQUE FEATURE
This is a unique project and first of its own kind in many ways. First, it is a piagnostic
investigation which is to be followed by experimentation with interventions. It has
therefore far-reaching practical and policy implications. Secondly, its purpose is not to
make estimations and generalizations or to develop theoties and models, but to gain
iIidepth understanding of the complex network of various risk factors which tend to
determine levels of high mortality in order to develop a practical and pragmatic
programme of interventions and control. Thirdly, it follows risk approach which
integrates both medical and social science approaches for dealing with this twin prob-
lem and seeks to offer solutions which will work in our socio-cultural setting and -
produc~ desired results. Fourthly, it takes not only the span of child's life of nine months
before and 12months after the birth but even goes beyond to find out which risk factors
operate when, where and how, in order to know which of the interventions will work
when, where and how to prevent, reduce and eliminate risk factors. Fifthly, it takes into
account a whole range of risk factors, looks at them in their totality and then attempts to .
determine their relative and attributable risk to the life of the infant with a view to
controlling them. It deals with only those risk factors which can and, therefore, must be

8 Pages 71-80

▲back to top


8.1 Page 71

▲back to top


controlled without any delay and at whatever cost. Lastly, it firmly believes that the
people who provide data for changing the conditions and circumstances under which an
infant dies, and may continue to die without timely interventions,should now the able to
use proven scientific methods.
5.3 COVERAGE AND SAMPLING
For the purpose of this cross-region study, three hilly and live ruraJ districts of UrtIr
Pradesh; 10 rural districts of Madhya Pradesh; five tribal districts of Orissa; five
districts (with interlocked sample of rural and urban areas.)of Kamataka, and 10 slums
of Bombay, were selected purposively, on the basis of predominance of identif18ble
characteristics. In each district, two blocks were selected purposively which means one
with and the other without the benefit of Integrated Child Development Services
(IeDS). In each block, 10 clusters of 150 households were selected randomly while
ensuring geographical representation at each stage of the sampling. At the last stage,
schedule III to study households was canvassed to enumerate and list out all usually
resident members who had had live births in the last two years; schedule IV for
mothers was canvassed to every mother whose child did not survive and every alternate
one whose child survived, with a view to probing into risk factors operating at pre-
conception, pre-natal, peri-natal, neo-natal and post-neo-natal stages.
In addition,data regarding essential educational and infrastruetura1 facilities, availa-
ble at the community level, were collected through schedule I, and data about levels of
education, training, service, experience, job satisfaction and correctness of knowledge
about risk factors etc. were collected from Dais, ANMs and other grass-root health
workers engaged in providing health and family welfare services, through schedule II.
';.4 ANALYSIS OF PROFILES
Based on these data, analysis of proflles of communities, health workers and popula-
tion groups was done and presented in Chapter III which brought out the following
conclusions:
i) In order to tackle the twin problem of high infant mortality and fertility, basic
facilities like trained Dais, Health Guides, Angamoadis, Primary schools, non-
formal education centres, women's organisations, motorable roads and elec-
tricity, which are still either absent or inadequate in many communities, are
absolutely essential. For satisfactory basic services or facilities, ANMs and
sub-centres should be available within five kilometres and for still higher level
services, a Primary Health Centre, private/government doctor and hospital,
drug store, etc., should be available within 10. kilometres from communities.
Facilities within communities are far more effective than those within five or
ten kilometres;
ii) health, education and infrastructural facilities within communities are neces-
sary but not sufficient to take care of the problem. To bring down infant
mortality and high fertility, these must be complemented and integrated in a

8.2 Page 72

▲back to top


nested hierarchy, with higher-order services for efficient and equitable distri-
bution of health and family welfare services.
iii) The facilities mentioned above without essential training in cr:ucial tasks
related to child survival which Dais, ANMs and other grass-root health
workers are supposed to perform, have no meaning. Training of Dais was found
to be inadequate and unsatisfactory to a great extent and for ANMs to some
extent. Even the correctness of their knowledge about major risk factors and
required interventions to control them, was far from satisfactory even among
ANMs, particularly with regard to precise knowledge about supplementary
feeding and or~ rehydration therapy; and
iv) the percentage of currently married women who got married before the legal
age of 18 was as high as 90 in Madhya Pradesh, 87 in hilly Uttar Pradesh, and
that of those who conceived before the legal age af marriage was 59 in Madhya
Pradesh and 45 in rural Karnataka.
The general fertility rate varied from 91 in Bombay slums to 230 in rural Uttar
Pradesh and infant mortality rate ranged from 64 in urban Karnataka to 214 in rural
Uttar Pradesh. The infant mortality rate was generally higher for male infants than for
female inf~nts in all areas except in hilly Uttar Pradesh and the neo-natal rate was
around 60 per cent of the total infant mortality-rate in most of the population groups.
55 ANALYSIS OF RISK FACTORS
From the State-wise analysis and inter-State comparisons of risk factors in terms of
prevalence and incidence rates as well as relative and attributable risks, interesting and
meaningful patterns and configurations of risk factors operating at various levels
emerged rather consistently and distinctly. These are presented and summarlsed here as
follows:
5.,5.1 Pre. Prepancy and Post-Infancy Stage
At the pre-pregnancy stage, where risk factors related to previous maternal, fertility
and pregnancy history interact and combine with each other, the result is increased
infant mortality. It very clearly brings out a simple fact that the history of previous
pregnancy complications, pregnancy losses and infant death have a tendency to repeat
themselves unless effectively tackled through suitable and timely interventions. Sim~'-
ilarly, if a women bears children too early (before 18) or too late (after 35), too close
(within two years) or too many (more than two), the next child also is exposed to
mortality risk. There also appears the vidous circle of having too early, too close and too
many children, which leads to frequent pregnancy complications, losses and infant
deaths, which, in turn, impels the intention or desire to have too many children, even
too late, adding further risk for the life of the next child cumulatively. This is further
confirmed and substantiated by the analysis of risk factors operating on fertility
'intention and behaviour. About 5-10 per cent women became pregnant within less
than two years from the birth of the index child, and in all Sta~es the infant mortality

8.3 Page 73

▲back to top


rate was two times higher among such mothers than the rest. It was over five times
higher in Karnataka. This reflects the replacement or insurance hypothesis of child
survival in concrete behavioural terms.
Family planning is the best intervention to break this vicious circle. Identification of
high-parity women with traumatic history of previous pregnancy complications includ-
ing losses due to infant deaths, who in all probability also happen to be above 35 years,
and provision of contraceptive advice and services by health and family planning
workers, is the most important and urgent task. Prevention is better than cure. This
must be done before they become pregnant and run into risk.
No doubt it is a difficult task, particularly in rural Uttar Pradesh, Orissa and rural
Kamataka where women do not adopt any family planning methods in spite of higher
relative risk of infant deaths. In rural Uttar Pradesh, urban Kamataka and Bombay
slums, infant mortality rate is substantially higher in the case of those women who did
not use any contraceptive. This indicates that if appropriatocontraceptives are used as an
intervention, infant mortality can be reduced by about ·12 per cent.
5.5.2 Pre- Natal Stage
At the pre-natal stage, signs of mother's il1-h~alth are mainly palour, malaria, .
German measles, convulsions, oedema and anaemia, resulting in loss of weight; inade-
quate dietary intake of nutritious and high protein foods like eggs, meat, fish and milk;
lack of medical care at sickness and lack of pre-natal care by avoiding tetanus toxoid,
iron tablets and folic acid have emerged as the most important risk factors in all
population groups. Smoking also emerged as an important factor with mo.re than 145
per cent relative risk in all States. In Orissa, where 70 per cent women smoke. it was
found to be the most hazardous risk factor. Invariably these risks are closely associated
with poverty. It is, therefore, suggested that women below the poverty line should be
identified on the basis of severity and chronicity of diseases and inadequacy of dietary
intake and registered with clinics. They should get supplementary food and health and
nutrition .education through women's organizations and also receive proper treatment
of infection, tetanus toxoid, iron tablets and folic acid and regular check-ups while
keeping a watch on their health and weight.
At the pre-natal stage, the factors identified as risk factors were pre-term; prolonged
labour; antepartum haemorrhage; breach presentation; surgical delivery; home deliv-
ery; traditional birth attendance; low birth-weight of less than 2.5 kilogram; and other
complications experienced by the baby at birth, such as birth injury and cord infection,
cyanosis and icterus, convulsions, respiratory distress, malformation, abdominal dis-
tension and poorJeeding, etc., ~ well as the denial of cholastrum and breast-feeding
from the first day.
Analysis of these risk factors has shown that birth-related complication for mothers
(mainly antepartum haemorrhage which was prevalent in more than 30 per cent cases)
and also for the new-born (mainly immaturity and low birth-weight, cord infection and

8.4 Page 74

▲back to top


birth injury, respiratory distress, cyanosis and icterus and poor feeding) were far more
common and serious than imagined. In the absence of proper medical attention, care
and supervision of these problems, which demand prompt intervention, become worse
multiplying the risk manifold. Except in urban areas of Karnataka and slums of
Bombay; about 70 - 90 per cent deliveries are attended by the traditional birth attendant
called Dai who is often untrained and also ill-equipped to manage a safe delivery.
Keeping this syndrome in view the following interventions are considered appropriate:
i) Training of Dais, provision of safe delivery kits depending on the case load,
regular availability of common medicine, cultivating in them the ability of early
deteCtion and timely referral; an~
ii) screening of high-risk mother and babies and provision of intensive, hospital
based (if necesSary) peri-natal and natal care through systematic and regular
visits bv ANMs and doctors.
55.3 Post-Natal Stage
At the post-natal stage, another set of risk factors were found playing a part. These
are: Inadequate breast-feeding and supplementary feeding; lack of immunization for
BeG, Polio and DPT; poor health status; and infections, malnutrition and growth
faultering.
During the first six months of infant's life, late breast feeding and self-care including
oral rehydration therapy, immunisation and growth monitoring are obviously the most
powerful interventions already recognized by the developing world. The problematic
aspect, however, is not the short duration but the denial of cholastrum or flrSt milk right
from the day one after birth as well as stoppage of breast milk during the attacks of
sickness like diarrhoea and poor personal hygiene. Education is needed on these aspects
for all mothers.
Among the diseases which affect infants, the following are more prevalent, serious
and fat~ in that order: Causes peculiar to infancy (mentionec\\ earlier); other .clear
symptoms (mainly tetanus, jaundice, measles); digestive disorders (mainly gesnoenteri-
tis and dysentery); coughs (mainly pneumonia and bronchitis); fevers (mainly malaria);
and circulatory (mainly anaemia).
The symptoms of malnutrition appear during the second half of infant's life in about
four to eight per cent cases with the relative risk of over 900 per Cent.
Perhaps the most appropriate intervention that is taken for granted and therefore
ignored is training in mother-craft. This involves close interaction between mothers and
Dais, AN Ms and Health Educators and a continuous process of dialogue and education.
Not many mothers know the best methods of bathing, cleaning, fondling and rocking
the babies, and, about pre-lacteal, breast and supplementary feeding and weaning
practices, environmental and personal hygiene, best traditional, indigenous, herbal,.
folk and home remedies and tonics. This kind of education alone can make them
well-versed in mothercraft.

8.5 Page 75

▲back to top


Generally speaking, the degree of exposure to different mass-media for health
information was found to be extremely low except in Karnataka cities and Bombay
slums where radio was the most popular medium. Radio and posters can be most
effectively used for this purpose because of their reach and penetration and absence of
dependence on formal literacy .
Personal contacts with health workers like the Dai, ANM, ,private or government
doctor for pre-natal and post-natal care are few and far between. As compared to
pre-natal stage, contacts and visits for check-up, referral and follow-up are more erratic
and scare mothers during post-natal care phase. People have a tendency to go to ANM
or doctor only as a last resort, particularly when the problem becomes serious and is
beyond control. That perhaps is the reason why infant mortality rate is found to be
higher among those who do not make timely contact with these health functionaries
even though they are there.
5.5.4 Perennial Risk Factors
Perennial risk factors are present at all stages and several environmental factors are at
work. They include use of water from ponds, rivers or wells, use of unfiltered water,
exposure to open drainage and garbage disposed near the house, open or pit latrines out
of which all manner of infections and diseases spread, kutcha house, poor ventilation,
dense smoke and lack of electricity, which maKe the life of mother and child miserable,
lack or insufficiency of warm clothing, mosquito nets and common medicines, which
can protect or cure the infant ·from cold and malaria and factors like working class
background, endemic poverty and illiteracy of the parents and lack of mother's partici-
pation in women's organisations, which restricts normal opportunities of access to
health resources and services.
Analysis of these parennial risk factors which operate at all levels and all the time,
brought out a number of interesting findings.
First, these factors are nothing but different facets of endemic poverty we have been
referring to at different places and reflect lack of basic necessities, of life. Correlation
analysis has clearly brought out that poverty has two broad dimensions, namely, lack of
access to resources and basic necessities of life such as housing, clothing, sanitation,
drinking water, education and health information through the mass media or otherwise.
Except for Orissa and hilly Uttar Pradesh, all these factors are significantly related to
monthly household income ofless than Rs. 500.00 as a crude proxy of poverty. It is also
found to be singnificantly related to another set of factors viz. the lack of access to
medical care or health services for mother and child at the time of birth, as well as when
subsequent compllCaUOnl>anse.
It is because of these significant correlations that poverty factor remains critically
operational at all stages, all the time and manifests in all forms, taking a heavy toll of
infant life in a much more devastating manner than even war, flimine or epidemic.
Poverty triggers off, through malnutrition, diseases and ignorance the vicious chain of

8.6 Page 76

▲back to top


morbidity. which inevitably results in innumerable infant deaths.
I t is for this reason alone that we wish to suggest the introduction of a comprehensive
scheme of family income supplement, particularly, for the low-wage earning workers
those below the poverty line, which may include supply of free milk and vitamins to
mothers at least for one year, which means six months before and six months after the
child-birth; grant of hospital fare to enable mothers to visit PHC or hospital on referral;
items like mosquito nets in malaria zones, small blankets for babies in colder zones and
common medicines for infants' mothers in zones where there are no doctors. It was
found that the relative risk to infant life was almost 150 per cent in summer in rural
Uttar Pradesh, Madhya Pradesh and rural Karnataka and almost the same in winter in
rural Uttar Pradesh and Orissa due to lack of blankets, mosquito nets and common
medicines.
Except for urban Karnataka and Bombay slums, where taps or pumps are generally
available, the percentage of mothers using unsafe and contaminated water from open
ponds, rivers or wells was around 90 per cent in Orissa, between 60 and 70 per cent in
Uttar Pradesh and Madhya Pradesh and 44 per cent in rural Kainataka. The percentage
of those who regularly use this unsafe water without any kind of f1lteration, is above 90
per cent in all these areas, and between 50 to 75 per cent in urban Karnataka and
Bombay slums. If a safe drinking water source cannot be made available to rural people,
then the simplest intervention that would help is to get the people to boil and f1lter the
water before use especially for the baby, at least for the first six months. 'Safe water to
save the child' is a time-tested motto.
Among the sanitation items, open or pit latrine is the most hazardous one unfortu-
,nately still being used by over 90 per cent ofthe rural population in the groups studied.
Except for Madhya Pradesh and rural Karnataka, smoky kitchens and poor ventila-
tion tend to increase the risk to infant life by 150 per cent. Is it not possible to provide
smokeless ehullahs at a subsidised price and "Sulabh Sauchalayas" on a community or
even commercial basis, to save the life of infants? If the Government cannot afford to
provide these basic, bare minimum needs, then why cannot people organise themselves
to procure them?
The analysis of socio-economic risk factors like working class background, poverty
and illiteracy of parents and lack of participation in women's organisations reveals that
lack of participation in women's organisations alone means 160 per cent more infant
deaths. Among occupational categories, wage labourers are in the most disadvantageous
position, running more than 220 per cent higher risk to their infants. The children of
migrant labourers die sooner and die more often' because they are much more deprived
of attention and care and are exposed to hazards and risks normally associated with the
nature of their jobs besides crushing poverty. Setting up creches for them can be a
solution.

8.7 Page 77

▲back to top


The purpose of this study was to prioritize the risk (actors and suggest appropriate
interventions to bring down infant mortality and eventually fertility.
The findings of this study were discussed in a national seminar in 1988chaired by Mr
J R D Tata, Chairman, Family Planning Foundation in which several eminent scholars,
practitioners and health planners participated.
The Foundation showed a video hIm entItled 'Too many, Too early, Too soon' based
on concurrent reportage of the studies in five states, on this occasion to sharply focus on
the gruesome aspects of infant mortality as recorded by can4id camera.
The seminar advocated the followine agenda for action:
1. Children have a nght to live and live well and this right must be recogmsed and
respected as much by the family as by the litate.
2. It is the duty and responsibility of the family and the State to provide every thing
that is necessary for children to live and grow in good health.
3.. It is the mother in the family and the community health worker in the State-
sponsored primary health care system, who must be made responsible for provid-
ing the necessary care and attention to children and thus ensure their survival and
growth.
4. It is basically the grass-root community workers in the primary health-care system
such as traditional birth attendants (TBA) and village health guides, Anganwadi
workers and multi-purpose health workers who must be made capable, through
systematic training and retraining, of handling health-care role with competence,
equipped with necessary 'knowledge, skills, equipments and medicines and also
sensitized to quickly identifying relevant risk factors through their regular contacts, .
scheduled visits and timely services to mothers and children needing such health
care, and eventually made responsible for bringing down infant mortality and
fertility with the help of health communications, efficient infrastructural support
and services.
5. Similarly, it is basically the pregnant and lactating mothers who must be made-
capable and responsible for providing basic care and attention as well as healthy
environment for the child to live and live well. They must be regularly and
adequately educated in essentials of hygiene, oral rehydration, immunization,

8.8 Page 78

▲back to top


breast-feeding, supplementary nutrmon and family planning -in short, in basics
of mother-craft and responsible· parenthood.
6. Within the resource constraints, special attention must be paid to "high-risk"
mo!hers and children and priority must be accorded to peri-natal and neo-natal care
to prevent majority of infant deaths.
7. Path analysis conducted as a part of this study brought out not just one option for all
but three distinct options, namely, child-oriented, child-and-mother-oriented, and
child-mother-and-community oriented options, most suited to varying population
groups.The most correct option ensuring a synergy of appropriate interventions
must be chosen on the basis of careful analysis of local situations ·to JIl~e it moo;t
cost-ettecuve.
8. The interventions must be designed not only to prevent the outcome which is
mortality, but may be the whole chain of undesirable outcomes like morbidity,
debility and mortality, sequentially or simultaneously.
9. Preventive care must be combined with curative one and maternal child-care must
be integrated with family planning in order to accelerate the role of reduction in
infant mortality and fertility rates simultaneously and to achieve the goals set for
2001 A.D.
10. When mothers in the family system and community workers in the primary health-
care system are jointly made capable of and responsible for providing care and
attention to children as their basic need and human right, and simple as well as
afforda ble technologies are made available to them systematically, then the goals set
for 2001 A.D. will not look impossible to achieve.
11. Rest of the risk factors are already known, and so are the risk-moaerati~g1nterven-
tions. Simple, affordable technologies are also available as is the infrastruetu~e,
manned by a large number of medical and para-medical workers. What is lacking,
however, is faith and 'confidence in the capacity of mothers in the family, and
grass-root health workers in the community, provided that they have the power and
ability to give essential health-care and create a salutary environment for the
children, not merely as a basic need but as a human right. That has to be done as a
conscious and deliberate effort to build that capacity through extensive community
interaction, and more meaningful and participative social communication, educa-
tion and training, on a continuous and sustained basis.

8.9 Page 79

▲back to top


APPENDIX ONE
Name
1. Dr. B.R. Patil
Members of the Study Team
Designation
Project Director
Institute
Family Planning
Foundation,
New Delhi.
Proje~t
Territories
All States
2. Dr. T.S. Papola
'3. Dr. M.S. Ashraf
Leader
Co-leader
Giri Institute
Uttar Pradesh
of Development
Studies, Luelmow.
4. Dr. Rita Sapru
5. Dr. Indira Murali
Leader
Co-leader
National Institute
of Health and
Family Welfare,
New Delhi.
Madhya Pradesh
6. Dr. Nj!yanand
Patnaik
7. Dr. Almas All
Leader
Co-leader
Institute of
Tribal Health
and Social
Sciences,
Bhubaneswar .
Orissa
8. Dr. P.H. Reddy
Leader
9. Dr. P.]. Bhattaeharjee Co-leader
Population
Centre,
Bangalore.
Karnataka
10. Dr. Victor S. D'Souza .Leader
11. Mrs. Rajani Paranjpe Co-leader
Department of
Sociology,
University of
.tsombay
Bombay slums.

8.10 Page 80

▲back to top


Name
1. Dr. T.N. Madan
2. Dr. P.P .Talwar
3. Mr. P.N. Kapoor
4. Prof. O.P. Gbai
5. Dr. P.N. Sehgal
Specialization
Sociology
Demography
Statistics
Paediatrics
Epidemiology
Community
Medicine
Institute of Economic
Growth, Delhi
National Institute of Health
and Family Welfare, New Delhi.
Ministry of Health and Family
Welfare, New Delhi.
All India Institute of
Medical Sciences, New Delhi.
National institute of
Communicable Diseases,
New Delhi.
Post-graduate Institute of
Medical Education and
Research,Chandigarh.
I. Mr. Raj Bhatia
2. Mr. M.A. Gandhi
SDC Data Systems Private
Limited, New Delhi.

9 Pages 81-90

▲back to top


9.1 Page 81

▲back to top


APPENDIX THREE
NATIONAL SEMINARS PARTICIPANTS
I Family Planning Foundation
Mr J R D Tata
Chairman
Mr S P Godrej
Member, Governing Board
Dr Dipak Bhatia
Member, Gover~ing Board
Dr B K Anand
Member, Governing Board
Dr D P Singh
Member, Governing Board
Mr B G Verghese
Member, Governing Board
Mrs Avabai B Wadia
Member, Governing Board
Prof Sukhamoy Chakravarty
Chairman, Advisory C..ouncil
Mr Harish Khanna
Executive Director
Mr K Balakrishnan
Secretary & Treasurer
Col T R Agnihotri
II Government of India
Mr S S Dhanoa
Secretary
Ministry of Health & Family Welfare
Dr Harcharan Singh
Adviser, Planning Commission
Mr P K Umashankar
Special Secretary
Ministry of Health & Family Welfare
Mr V S Swamy
Deputy Registrar General
Ministry of Home Affairs
Mr K S Natarajan
Registrar General's Office
Dr l' S Papola
Consultant, Planning Commission
Mrs Rami Chhabra
Adviser
Mass Media & Communication
Ministry of Health & Family Welfare
Dr KG Krishnamurthy
Planning Commission
IllState Governments
Mr V G Nigam
Health Secretary
Bhopal
Mr D T Joseph
Health Secretary
Bombay
Mr Mohinder Singh
Health Secretary
Lucknow
Ms Vinita Rai
Health Secretary
Delhi Administration
Dr Susanne Mowat
IDRC
Dr E G P Haran
USAID

9.2 Page 82

▲back to top


Mr Robert N Bakley
USAID
Mr Tom G Kessinger
The Ford Foundation
Mr Peter Berman
The Ford Foundation
Mr Samuel Lieberman
Senior Economist
The World Bank
Ms Razia Ismail
UN~CEF
Dr Sawon Hong
UNICEF
Mr George Walmsley
UNFPA
V Experts connected witb the
study
Dr B R Patil
Project Director
Family Planning Foundation
New Delhi
Dr PH Reddy
Director
The Population Research Centre
Bangalore
Dr P J Bhattacharjee
The Population Research Centre
Bangalore
Dr (Mrs) Rita Sapru
Head
National Institute of Health &
Family Welfare
New Delhi
Dr (Mrs) Indira Murali
Associate Professor
National Institute of Health &
Family Welfare
New Delhi
Dr M SAshraf
Giri Institute of Development Studies
Lucknow
Dr Nityanand Patnaik
Director
Tribal & Harijan Research cum
Training Institute
Bhubaneswar
Dr Almas Ali
Secretary
Institute of Tribal Health &
Social Sciences
Bhubaneshwar
Dr Victor S D'Souza
Department of Social Wock
University of Bombay, Bombay
Dr P N Sehgal
Former Director
National Institute of Communcable
Diseases Delhi
Dr P N Kapoor
Joint Director
Ministry of Health & Family Welfare
New Delhi
Prof P P Talwar
Prof & Head
National Institute of Health &
Family Welfare
New Delhi
Mr M A Gandhi
Consultant
SDC Data Systems Pvt Ltd
New Delhi
Mr Raj Bhatia
Consultant
SDC Data Systems Pvt Ltd
New Delhi
Eminent Indian Experts
Dr Ali Ashraf
Vice Chancellor
Jamia Milia Islamia
New Delhi
Prof J C Kavoori
Consultant in Population & Rural
& Urban Development
Jaipur

9.3 Page 83

▲back to top


Prof Ashish Bose
Director
Institute of Economic Growth
Delhi
Dr P C Joshi
Institute of Economic Growth
Delhi
Dr K Srinivasan
Director
International Institute of
Population Sciences
Bombay
Dr Shanti Ghosh
MCH Consultant
New Delhi
Prof P B Desai
Gujarat Vidyapeeth Ahmedabad
Dr R S Arole
Society for Comprehensive Rural
Health Project in India
Jamkhed
Dr Pravin Visaria
Director
The Gujarat Institute of Area Planning
Ahmedabad
Dr V K Paul
Department of Paediatrics
All India Institute of Medical Sciences
New Delhi
DrM E Khan
Operations Research Group
Baroda
Prot 1J Jianel'J1
Centre for Social Medicine &
Community Health
JNU
New Delhi
Dr G N Reddi
IRRM
Bangalore
Mr P Padmanabha
Former Registrar General &
Census Commissioner
Bangalore
Dr (Mrs) Vina Mazumdar
Centre for Women's Development
Studies
New Delhi
Dr (Mrs) Sudha Tewari
Parivar Seva Sanstha
New Delhi
Mr L M Mehta
Operations Research Group
New Delhi
Smt Vidyaben Shah
Indian Council of Child Welfare
New Delhi
Dr Nina Ranjan
National Institute of Public
Cooperation
& Child Development
New Delhi
Ms Anees Jung
Author & Joprnalist
New Delhi
Dr (Mrs) Kusum Chopra
Sr Medical Officer
National Institute of Health &
Family Welfare
New Delhi
Mr Jia Lal Saaz
Journalist
RAPPORTEUR:
Dr P L TRAKROO
National Institute of Health
& Family Welfare
New Delhi

9.4 Page 84

▲back to top


SECTION B:
SUMMARISED FINDINGS
of Field Investigation Studies
Uttar Pradesh, Madhya Pradesh,
Orissa, Karnataka and Bombay

9.5 Page 85

▲back to top


••••••••• 100
0
208 100
_M1lE5
100 0 100
300
SOO KMS
STATE BOUNDARY
D1STRlCT BOUNDARY
STUDY AREAS
N
t

9.6 Page 86

▲back to top


The survey in Uttar Pradesh covered rural and hilly population. The rural group
covered five districts namely, Basti and Sultanpur in Eastern, Etawah in Western, Rae
Bareli in Central and Banda in the Bundelkhand regions of the_State.The hilly segment
included three districts, namely, Almora, Pithoragarh and Tehri Garhwal. The districts
selected have the highest proporation of rural population. Two blocks per district in the
rural and three blocks per district in the hilly group were selected, on the same basis.
From all the five districts in the rural group a total of 112 villages forming 74 clusters
were covered. A totalof 11,419 household in the rural group and 8,572 in the hilly
groups were surveyed. 3,837 mothers in the rural and 1,572 in the hilly group were
interviewed with a view to: (a) identifying the determinants of infant mortality; (b)
determining relative risk; and, (c) examining the inter-relationship between infant
mortality and fertility. The findings of the study are, therefore, based on a sample of
5,409 mothers of 19,991 households belonging to the hills and plains of Uttar Pradesh.
The survey was conducted between January and June, 1987.
MORTALITY RATE
We fmd theIMRin the rural group as 213.9 (218.9 for males, 208.0 for females). The
JMR of the cClmbinedgroup was 191.2 (194.2 for males, 187.7 for females). Thus, the
study indicates a very high IMR, particularly in the rural population group. In "the
hilly districts, Almora had the lowest IMR (61.5) and Pithoragarh the highest (189.6)
The data indicated:
(a) A higher IMR among males (218.9) as compared to the females (208.0) in the rural
group while no such difference was obserbed in the hilly group (Male 141,4;
FemAlf' 141.7);
Authored by Dr. M.S. Ashraf on behalf of the Giri Institute of Developement Studies
Lucknow.

9.7 Page 87

▲back to top


(b) mortality rat~ at the post-natal stage rural ( M 114.8;F 127.6); and hilly(M 73.2 and
~ 76.1) was hlgherthan at the neo-natal stage in both the rural (MI04.l; F 80.4) and
hilly (M 68.2, F 65.0) groups; and
ec) ~ortali~y rat~ among toddlers was significantly low as compared to IMR. However,
It was higher 10 the rural (M 29.1; F 37.4) group as against the hilly (M 22.5; F 35.6)
group.
CRITICAL FACTORS
The study examined a number of risk factors considered critical to infant mortality at
three stages, pre-natal, natal and post-natal. The relationship between infant mortality
and fertility behaviour as well as that with socio-economic risk factors was also exam-
ined. The significant fmdings are summerised below:
I Pre-natal Risk Factors
1. Mother's A.ge: We find the highest IMR in rural group (281.8) and nearly the
highest (163.6) in hilly group when mothers happened to be up to 18 years old.
in The IMR was the lowest both the population group when mothers were
between 19 and 25 years (R 194.6, H 123.9). The IMR increased sharply for
mothers in 26-35 (R 225.3, H 165.4).
2. Birth Order: Among the rural population, the IMR was lowest at the second-
order births (149.7) which increased significantly to 241.7 and 243.2 at the third and
fourth order births, respectively.
In the hilly areas, the lowest IMR was found at the fl1'St-order births (105.0)
which almost consistently increased to 210.5 at the fifth-<'order births.
3. Preceding Birth-i ••terval: The IMR was lowest (167.6) in the rural group when
the interval between two births was more than 36 months, while it was highest
(247.9) in case the birth interval was up to 24 months. In the hilly group, the lowest
IMR (108.5) was observed when the preceding birth interval was only up to 24
months: the IMR was highest when it was between 25 and 36 months (205.0).
4. Complicatio ••s duri ••g Prepa ••cy: Such complications had a serious bearing
on ~nfant mortality. The IMR was very high where mothers faced complica-
tions during pregnancy (R246.9; H 571.4); in the case of incomplete pregnancy
IMR was R 486.7; H 168.1; and in the case of earlier pregnancy losses, IMR was R
271.3; H 567.9.
5. lll ••esses duri ••g PrepaJtcy : In the rural group, the IMR was found very high
in the case of mothers suffering from hypertension (833.3). The incidence of IMR
significantly declined in other cases: the heart diseases (384.6), oedema (365.5),
M stands for male.F stands for female, R stands for Rural Population Group, H stands
for Hilly Population Group.

9.8 Page 88

▲back to top


accident/injury (359.0), convulsions (325.7), diabetes (304.4), malaria (283.0),
aQaemia (258.1), palour (256.4), tuberculosis (235.3) and renal infection (230.8).
In the hilly group, the infants invariably died in case mothers had suffered from
renal infection. The IMR was also found very high, if during pregnancy, mothers
had suffered from oedema (666.7), anaemia (234.0), convulsions (228.6), malaria
(220.2), German measles (196.3), accident/injury (173.6) or palour (145.4).
6. Antenatal Care during Pregnancy: Timely contacts with health workers at the
time of emergency or problem had very positive effect. The IMR, in both the rural
and hilly groups, remained low when such contacts were established with Health
Guide(R 128.7; H 111.l),ANM/Nurse (RI50.0; H 114.0), Health Visitor (R94.3;
H 73.2) or a Government doctor (R 174.6; H 99.0).
Three doses of tetanus toxoid injections and iron tablets were associated with a
low IMR In the rural sample, it was 160.2 and 164.2, respectively and in the hilly
sample, it was 111.7 and 123.5, respectively.
7. Dietary Intake and Addicti'De Habits
(a) A low IMR was found in both the population groups, if mothers maintained a
normal diet (R214.6; H 137.9) during pregnancy. The IMR was higher if mothers
took extra food (R225.0; H 250.0). (b) The IMR was significantly higher in both the .
population groups (except in hilly in case of alcohol), if mothers had the habit of
smoking or chewing tobacco, drinking liquor or consuming addictive drugs.
II Natal Risk Factors
These risk factors relate to the conditions oflabour and delivery and complications
as experienced by children at birth.
1. Type and Place of Deli'Dery: Higher IMR was found; in both the population
groups in case of a caesarian delivery (R300.8; H 203.9); delivery in hospital (R
238.1; H 221.2); delivery at home (R 212.6; H 253.0) or after delivery (R 259.0; H
291.5).
2. Birth Attendant: Surprisingly, a significantly high IMR was found in the rural
sample (317.1) when the birth was attended upon by a government doctor or by a
private doctor (235.3). In the hilly group, the highest IMR was found when there
was no one to attend upon the birth (267.6) or when it was attended upon by a
government doctor (212.1).
3. Size of Baby: The smaller than usual size of the baby at birth was related to a very
high IMR among both the rural (392.4) and the hilly population groups (344.0).
4. Complications experienced by Children at Birth: Some of the complications
experienced by children at birth proved a serious risk to their lives. The IMR was .
found very high in both the population groups when children suffered from: cord
infection (R 344.3, H 500.0); birth injury (R 342.9, H 200.0); prematurity (R 482.4,

9.9 Page 89

▲back to top


H 263.2); low weight (R 409.7; H 254.9); cyanosis (R 377.4; H 176.5); convulsions
(R 490.9; H 225.8); respiratory distress (R 354-.2; H 333:3); malformation (R
428.6.6; H 150.0); abdominal distension (R 252.5; H 302.3); and other unspecified
illnesses (R 529.4; H 1000.0).
In Post-natal Risk Factors
1. Pre-lacteal Feed: A very high IMR was found wh~n no pre-lacteal feed was
given to the baby (R 397.1; H 417.7).
2. Breast Feeding :The IMR among the infants which did not receive breast milk at
all wu as high as 635.8 in the rural and 549.1 in the hilly groups. In comparison, the
IMR among those who received breast feeding for a longer duration (more than 12
months) was very low (R 110.7; H 39.6).
J. Immunization: Immunization of the infants against certain serious diseases had a
very positive effect on their survival. The IMR among the infants who had BeG (R
141.5; H 14.4), three doses of Polio (R 58.5; H 0.0) and DPTlTriple Antigen (R
225.3; H 14.1) vaccines was very low as against those who did not have BCG (R
225.3; H 163.1), Polio (R 236.5; H 150.0) or DPTlTriple Antigen (R 227.8, H
151.5) vaccines.
.
4. GeneralHealth Conditions: The IMR among infants with below normal health
conditions during the first six months was 525.4 in the rural and 392.2 in the hilly
group. The IMR under similar conditions between the seventh and 12 th months
was 449.7 in the rural and 200 in the hilly group.
The IMR was also very high among the children who had their general health
conditions above normal during the first six months (R 350.8, H 457.1) as against
among those with similar conditions between the seven and 12th months (R 258.1,
H 173.2).
5. Di8ease8: Over half of the infants (58.5 per cent) born in the rural areas and 18.4
per cent in the hilly areas suffered from one or the other serious illness. The highest
IMR was found aiDong those who suffered from the ailments categorized as
'general' (R 583.5; H 563.6). These included jaundice, tetanus, measles, diabetes,
malnutrition and accident or injury. Circulatory ailments such as anaemia and
heart trouble, in the rural group (408.2) and nervous disorders (convulsions,
meningitis and paralysis) in the hilly group (428.6) were also associated with a very
high IMR. The IMR among the infants which suffered from coughs, namely,
pneumonia, bronchitis, asthma, whooping cough and, tuberculosis was also
significantly high (R 361.3, H 360.0). In the hilly group, the IMR was also high
among infants which suffered from circulatory ailments (285.7), fevers including
malaria, influenza and typhoid (222.8) and digestive disorders (210.1)
The mortality rate among the toddler group who suffered from circulatory (98.0)
and 'general' (97.5) ailments in the rural grouop was also found high.

9.10 Page 90

▲back to top


Gain m weight, either below or above normal, during the first year of the child
was associated with a very high IMR among both the population groups.
6. Malnutritio,,:The IMR and the toddler mortality rate were very high among
both population groups if the infants had suffered from malnutrition. Various
symptoms of malnutrition affecting IMR were: Pale skin/mucus membrane (R
481.8; H 225.8); absence of muscles under skin (R 492.3; H 333.3) beeding of rib&{R
426.5; H 300.0); swelling on face and feet (R 511.6; H 272.7); discolouration/loss of
hair (R 471.1; H 150.4); and frequent colds and infections (R 247.5; H 156.0).
IV Socio-economic Risk Factors
1. Pare"ts'Educatio,,: A higher IMR was found to be existing in families where·
neither of the parents was literate (R 234.6; H 156.5). In comparison, the IMR in
the rural group was 183.0 and in the hilly group 154.7, if both the parents were
literate.
2. Religio" a"d Caste: Hindus in the rural (218.8) and Christians in the hilly group
(500.0) had the highest IMR amongst the various religious communities.
The Scheduled Castes in the rural (231.6) and Scheduled Tribes in the' hilly'
a group (200.0) had a higher IMR as compared to that in the other castes (R 208.5;
138.6).
3. Possessio" oj La"dholdi"8s, Milch Cattle a"d Poultry Birds : In die
absence of any definite trend, it seems that the size of agricultural landholding had.
no relationship with infant mortality.
The households without milch cattle had a higher IMR (R 240.9; H 160.0) while
those having more than two animals had a significantly lower iMR (R 240.8; H
118.7). Similarly, the IMR among the families without a poultry bird was signifl-
cantly higher (R 215.1; H 147.4) than among those having more than five birds (R
184.2; H 80.0).
4. Housi"g Co"ditio"s: Some of the living conditions indicate adverse effect on the
survival of infants. The IMR was considerably high among the families residing in
kutcha houses (R 220.8; H 302.9); with insufficient ventilation (R 232.0; H 191.8);
severe smoke inside (R 285.7; H 220.1); open latrine (R 220.5; H 141.8); and place
of garbage disposal near ,their houses (R 228.4; H 147.1).
5. Family Occupatio" a"d I"come: We find the families of artisans in the rural
group (277.8) and those of the wage labour group in the hilly group (165.5) had the
highest IMR while among those in trade and business had the lowest IMR in both
the rural (103.5) and the hilly (74.6) groups.
The families within the lowest monthly earning group of up to Rs. 500.00 had the .
highest IMR (R 255.8; H 222.8).

10 Pages 91-100

▲back to top


10.1 Page 91

▲back to top


V Fertility Behaviour
1 he relationsDlp between fertility behaviour and infant mortality was also examined.
Wefmd:
1. A significantly higher IMR resulted when mothers became pregnant after the birth
of the index child (R 237.7; H 258.4); when mothers felt it necessary to have a child
in place of the one that had died within a year of its life (R, 265.9; H 160.5); and when
mothers did not adopt any method of family planning (R 222.2; H 176.5). In
comparison, the IMR was low when mothers did not become pregnant (R 211.5; H
133.6); when they did not feel it necessary to have a child for the one dead (R 186.4;
H 126.5); and when they preferred spacing (R 217.1; H 138;8) or terminal method
(R 121.5; H 166.7) offamily planning;
. 2. desire for having just one child in the family was found associated with lower IMR,
both in the rural (73.2) and the hilly (116.3) groups, while that for two children in
the rural (245.9) and three in the hilly group (152.3) was associated with higher
IMR; and
3. in order to ensme that the desired number of children survived, those in the rural
group who wanted to have more children had a significantly higher infant mortality
in their family (258.7) than those who did ~ot go in for more children (169.8). In the
hilly group, however, there was no significant difference between the IMR and the
desire for having more children or otherwise.

10.2 Page 92

▲back to top


National Institute of Health and Family Welfare did the study in rural areas of
Madhya Pradesh with high and low immunisation performance. Selection of the rural
areas according to this criterion was done by using the State Health Directorate's annual
report for 1985-86. Five districts with high immunisation performance, namely, Raj-
nand Gaon, Damoh, Raipur, Ratlam and Ujjain, and five with low immunisation
performance namely, Indore, Bastar,Chindwara, Shahdol and Guna were selected for
study.
In each district, two blocks, one preferably with ICDS back-up, were selected for
study by the State Health authorities. By systematic ,random method 10 villages or
clusters were sampled from each block and 150 households from each sampled village
or cluster, were taken up for study.
Epidemiological approach was adopted and all factors social, cultural, economic,
biological and environmental, affecting the mother and baby during pregnancy, deliv-
ery and infancy, were taken into consideration.
Data collection was done with the help of four structured interview schedules to collect
data on:
Basic demographic and infrastructural information about the villages;
knowledge of primary level health care among functionaries providing MCH/FP
services;
ante-natal, intra-natal and post-natal details of women experiencing child birth in
the preceding two years and who had lost the child and 50 per cent of those in whose
case the child had survived.
Authored by Dr. (Mrs.) Rita Sapru on behalf of the National Institute of Health and
FamIly Welfare, New Delhi

10.3 Page 93

▲back to top


Research teams each comprising four interviewers and one field supervisor were
deployed in the field after initial training at Indore and Bhopal. Four faculty members
of National Institute of Health and Family Welfare from Departments of CHA, Social
Sciences and Reproductive Biomedicine helped in recruitment, training, deployment,
periodic checking and supervision of the work in the field. Data collection started in
January, 1987 and was completed in all districts by May, 1987.
STUDY FINDINGS:
1 Attributable Risks o/the Studied Factors:
Tables 1 12 show in ranking order, factors in relation to maternal attributes, lack of
antenatal care, mother's dietary intake, circumstances of delivery, post-natal complica-
tions among new-born and their treatment, child-rearing and child health-eare along
with the identified socio-cultural, economic and fertility determinants.
!t may be seen from Table I that amongst the maternal attributes, the highest risk of
infant mortality was in index mothers with a past history of obstetrical complications
(118 per cent), followed by mothers who had previously experienced infant deaths (85
per cent). The next highest risk group was mothers who had perceived weight loss
during the index pregnancy (70%per cent). However, z.mongst the maternal attribute/
biological factors, the lowest risk was in relation to parity status. Prima pares mothers
were second from bottom in the rank order for risk of infant mortality (20 per cent) and
mothers of birth order four and above showed lowest risk of 6 per cent. Another
interesting finding was the fact that the women who took country liquor, for example,
toddy had.a21 per cent lower risk of infant mortality as compared with women who did
not habitually take liquor during the index pregnancy.
As compared with the biological factors, risk of infant mortality in relation to
maternal diet during the index pregnancy was of a much lower order. The two top-most
risk factors (Table 2) emerged as nil/inadequate intake of vegetables (22 per cent)
followed by nil/inadequate intake of pulses (19 per cent).
Regarding the risk of infant mortality as a result of inadequate ante-natal care, the risk
levels were even lower than those in relation to maternal diet. The topmost risk factor in
this area was nil antenatal tetanus toxoid immunisation (II per cent) followed by nil
antenatal intake offolifer tablets (9 per cent). It may be seen that nil antenatal contact
with Dais, ANMs and government doctors showed an attributable risk of infant
mortality only to the extent one to four per cent. It may be further noted that there was
absolutely no higher risk of infant mortality in the group of index mothers who made no
antenatal contact with the rural medical practitioners (Table 3). These findings show
that the guidance and treatment offered by these practitioners was of a neutral kind with
no significant influence on the-survival of the index clUld.
The topmost risk factors of infant mortality during the process of delivery emerged as
birth injury (300 per cent), premature labour (269 percent), and delivery complicated
by haemorrhage (93 per cent). It will be noted that these levels of risk are much higher
than those observed even for the biological factors/maternal attributes.

10.4 Page 94

▲back to top


In regard to intta-natal risk factors, the absence of prolonged labour as a risk factor
was probably due to the fact that such cases died invariably in the remote rural villages.
Index births whose mothers had died were excluded from the study and so prolonged
labou~ as such did not emerge as an intra-natal risk factor in this study (Table 4.).
The highest attributable risk levels observed may be seen from Table 5 which pertain
to conditions of the index child in the early neo-natal period namely the first io days
after birth. Conditions like cyanosis (63 per cent), convulsions (56 per cent), respiratory
distress ( 49 per cent), and refusal to suck (47 per cent) showed very high attributable
risks of infant mortality. These were followed by low··birth weight (339 per cent). It may
be noted that cord infection had the lowest attributable risk in this group (16 percent).
Table 6 showed that treatment of these conditions gave 34 per cent higher chance of
infant survival.
Regarding child-rearing, the factor with highest percentage of attributable risk was
total absence of breast feeding (528 per cent), foJlowed by 441 per cent in infants whose
weight gain in first six months of life was perceived to be below normal by their mothers.
The next highest risk factor was similar perception Onthe part of mothers for the second
six months of infant's life. As against that denial of cholastrum proved an attributable
risk of only five to six per cent. Contrary to popular belief, giving of pre-lacteal feeds
actually improved the chances of infant survival by 14 per cent (Table 7).
The lowest levels of attributable risk was the inadequate child health-care (Table 8).
Negligibly higher risk of one to four per cent were found pertaining to nil BCG and
Polio immunisation and nil well-baby contact with the ANM. Absence of well-baby
contact with health guides, LHVs, government doctors and registered medical practi-
tioners gave one per cent better chance of infant survival, and nil/incomplete immuni-
·sation with DPT actually gave two per cent better chance of survival to the infant!
These findings particularly on infant immunisation are difficUlt to explain. However,
the possibility of used vaccines which had lost their potency in the fi~d, cannot be
ignored. Besides, health personnel of all categories hardly seem to have paid attention to
educating the mothers in aspects of promotive and preventive child health-care. These
could again be due to inadequate training and. monitoring and supervision
As about the socio-cultural determinants of infant mortality, Table 9 shows that the
levels of attributable risk were much lower than those present in the index mothers and
children. The highest level of attributable risk of infant mortality (13 per cent) was.in
Scheduled Caste families followed by eight per cent famlies in which both parents were
illiterate. However, in contrast, infant survival among the Scheduled Tribes was one per
cent higher than that in the general population.
Further, infant survival in families with two and more female children was actually 55
per cent higher than in families with less number of female children. This clearly
showed that the presence of a large number of female children in a household did not
only pose no serious hazard but actually increased the chances of infant survival. This
could perhaps be due to the fact that female children even at a tender age help in the
rearing of younger siblings at home.

10.5 Page 95

▲back to top


A one-room dwelling as the crowded shelter of the family emerged as a high risk
factor (31 per cent - Table 10). Landless or marginal land holding families and those
with monthly expenditure and income of less than Rs. 500.00 per month showed
attributable risks of 29,26 and 22 per cent, respectively .
.Absence of sanitation and drainage showed the next higher percentage of attributable
,risk of21 per cent. However, absence of sanitary latrines gave only a negligibly higher
attributable risk of one or two per cent.
Attributable risk of infant mortality due to index mother's inl!dequate or nil exposure
to different types of mass media ranged from the-highest level of seven per cent for
radio health talks to three per cent for T.V. health talks. These levels of risk were,
therefore, somewhat higher than those connected with the utilisation of child health-
care services.
Lastly, as regards the relationship between infant mortality and fertility, attributable
risk of infant mortality was lOOper cent higher among index children whose mothers
became pregnant within two years oflast birth (Table 12). Mothers who lost the index
child felt that the dead child must be replaced. This. factor was responsible· for 35 per
cent higher risk of infant mortality. Similarly, children of mothers who felt the need for
having more children to ensure survival of a desired number, showed a 19 per cent
higher risk of infant mortality. Pro-natalist attitudes in the mother and short-birth
intervals, therefore, adversely influenced infant survival. However, risk of infant mor-
tality because of the mothers simply having a desire for more than two children, was a
negligible two per cent.
o PRIORITIZATION OF THE STUDIED FACTORS FOR FORMULA-
TION OF INTERVENTION STRATEGIES
For the formulation of intervention measures to reduce IMR in Madhya Pradesh, it
is important not only to know the attributable risk of infant deaths in relation to
identified causative factors but also to take into consideration the extent of exposure to
these risk factors in the target population of expectant mothers and infants.
Tables 13-22 regarding prioritization of interventions show the results of these
calculations for the different groups of risk factors and determinants of infant mortality
that were included in this study.
Table 13 shows that amongst the biologicaldb,d other maternai attributes, birth
interval. equal to or less than two years and antenatal anaemia deserve the highest
priority for intervention measures. Also expectant women giving a past history of infant
death or those who have perceived weight loss during pregnancy, should be looked upon
as very high-risk infant mortality cases. Primary health workers and mothers them-
selves may be informed that these are high-risk conditions, deserving special attention
to the new-born infant. Compared to these maternal attributes,high parity status of the
mothers had a much lower level of priority. Indeed, the study showed tliat greater
attention needs to be paid primipares to the ex~ctant mothers as compared with those
of parity status four and above insofar as risk of infant death is concerned.

10.6 Page 96

▲back to top


As regards the ante-natal health care, Table 14 shows that ante-natal tetanus toxoid
immunisation and distribution of folifer tablets were the only two activities,deserving of
priority but this priority was of much lower order than that obtained by maternal
attribute risk factors.
ReglJrding maternal dietary factors, intake of green leafy vegetables and pulses by
expectant mothers emerged as the topmost priority area for intervention. Improved
maternal diet regarding the~e two categories of food stuffs is shown by the study
findings to deserve a nigher priority than any ante-natal health-care activity (Table 15).·
Table 16 shows that measures to prevent and handle delivery complications such as
.haemorrhage, premature onset of labour, etc., deserve the same level of priority for
intervention as do the biological risk factors (compare Tables 13 and 16).
The risk factors endangering the new-born and those related to mfant.rearmg
practices, may be seen from Tables 17 and 18. The top-ranking conditions in these two
areas need to perceive the highest level of priority for intervention measures. Low birth
weight, and refusal to suck breast can be easily identified by mothers and household
members and hence is deserving of immediate action. Out of the total 4966 index births,
1282 (25.8 per cent) gave history of post-natal complications in the new-born. Of these,
799 received treatment and IMR in this group was 183.98 as compared with 271.22 in
the untreated group comprising 483 infants. Treatment of post-natal complications,
thus, gave a 34 per cent higher chance of survival to the infant.
Again, in the child-rearing practices, it was.the total absence ofbreast;feeding which
emerged as a top priority area followed by the mother's own perception of poor weight
gain by her infant in the first six months of life. Denial of cholastrum was another
child-rearing practice change. As compared with these, weaning practices emerged as
having lower parity. Since the giving of pre-lacteal feed posed no hazard, but actually
increased the chances of infant survival in this study, one may conclude that both
cholastrum and customary pre-lacteal feed need to be advocated in order to enhance the
chances of infant survival. The primary health workers should be instructed to educate
the mothers accordingly. This information can a'lsobe promoted through mass media.
Infant health care activities such as immunisation and routine well-baby contacts
with primary health workers such as ANM/MPW (F) emerged as the lowest priorit~
,areas for reduction in infant mortality. In any case, their level of priority was lower than
that of antenatal health-care activities (compare Table 14-19).
Lastly, coming to the socio-cultural determinants 01 infant mortality, Table 20 shows
that special attention be given to families with both parents being illiterate or belonging
to the Scheduled Castes. But in terms of priority, if was lower than those compared with
the risk to mothers and the new-born, previously discussed.
Not much over-all lowering of infant mortality, therefore, results from adult literacy
campaigns perse or even from welfare and relief measures, because they are primarily
directed to the Scheduled Castes.
In Table 21, economic conditions of individual households revealed higher level of
priority for intervention as compared with social and cultural factors regarding caste or

10.7 Page 97

▲back to top


literacy. Amongst the household economic determinants the top three priority interven-
tions emerged as: (i) landless and marginalland-holding households and those having
expenditure and income equal to or less than Rs. 500.00 per month; (ii) inadequacy of
~inter clothing and bedding; and (iii) size, and quality of dwellings, landlessness and
low income. It is notable that absence of proper housing, drainage, sanitary latrines,
fuel, kitchen gardens, etc., which have been the focus of educationsl activities under
different programmes, actually emerged as low-priority areas of intervention and not
much reduction in IMR can be expected to result from these. Indeed, household
filteration of water no matter how simple and crude, emerged as a practice of greater
importance for reducing infant mortality than use of sanitary latrines, etc.
Finally, coming to the relationship between fertility and infant mortality, Table 22
shows that topmost priorityneeds tobeglven toeducational campaigns for countering
pro~atalist attitudes which compel mothers to undergo pregnancies in substitution of a
lost child or in excess of the actual number of children desired because of fear of low
level of child survival. Low-birth intervals equal to or less than two years emerged as the
third priority area for interventation. But this factor was obviously related to pronatalist
attitudes. However, it may be noted that the priority level pertaining to these determi-
nants was oflower order than the one pertaining to intervention measures in relation to
maternal attributes, intra-natal and post-natal risk factors, child-rearing practices and
monthly household expenditure.

10.8 Page 98

▲back to top


TABLE 1
Maternal Attributes as Risk Factors of Infant Deaths in Rank Order.
Factor
1. Past history of obstetrical Complications
% A.R.*
118%
2. Past history of infant deaths
85%
3. Perceived antenatal weight loss by mother
70%
4. Past history of abortions/miscarriages
60%
5. Birth interval less than two years
48%
6. Ante-natal oedema
42%
7. Antenatal anaemia
41%
8. Tobacco chewing
25%
9. Primi pare~
20%
10. Birth order four and above
6%
Note: Habitual intake of country liquor like toddy had a favourable influence. Women
who did not take liquor showed a 21 per cent higher risk of infant deaths as
compared with women who did.
TABLE 2.
Maternal Dietary Risk Factors of InfaFlt Deaths .in Rank Order
1. Nil or inadequate intake of green leafy vegetables
2. Nil or inadequate-intake of pulses
3. Nil or inadequate intake of meat/fish
4. Nil or inadequate intake of milk
5. Nil or inadequate intake of fats and oils
6. Nil or inadequate intake of cereals
%A.R.
22%
19%
8%
7%
4%
1%

10.9 Page 99

▲back to top


TABLE 3
Lack o/Antenatal-Care llisk Factors 0/ In/ant Deaths in Rank Order
Factor
% A.R.
1. Nil ante-natal tatanus toxoid immunisation
11%
2. Nil a.me-natal intake of folifer tablets
9%
3. Nil routine antenatal contact with ANM
4%
4. Nil ,ante-natal contact with Dai
2%
5. Nil ante-natal contact with Government doctor
1%
6. Nil ante-natal contact with rural medical practitioner
0%
TABLE 4
Natal Risk Factors olin/ant Deaths in Rank Order
Factor
Percentage
A.R.
1. Birth injury
2. Onset of labour in or before the eighth month
3. Delivery complicated by haemorrhage, perinatal rupture or
other conditions
4. Abnormal foetal presentation
300%
269%
93%
50%
Note:
There were nil cases of labour prolonged beyond 48 hours as perhaps they
invariably died. Index births whose mothers had died have been excluded
from study. Seven per cent less risk of infant death was found when labour lasted
for 12-24 hours as compared to when it lasted for less than 12 hours

10.10 Page 100

▲back to top


TABLE 5
Early Neonatal Risk Factors of Infant Deaths in Rank Order ~~,-----
Factor
Percentage
A.R.
_. __ .,---
1. Cyanosis
630%
2. Convulsions
5600/:
3. Respiratory distress
494%
4. Refusal to suck
471%
5. Low birth.rweight
339%
6. Abdominal distension
314%
7. Jaundice
274%
8. Congenital malformation
100%
9. Persistent vomitting
98%
10. Cord infection
16%
TABLE 6
Reduction in Risk of Infant Death with Treatment of Post-natal Complication
ID
IS
TOTAL
131
352
483
147
652
799
278
1004
1282
Note: Treatment of postnatal complicatlOns gave a 34 percent higher chance of infant
survival as compared with the untreated group.

11 Pages 101-110

▲back to top


11.1 Page 101

▲back to top


TABLE 7
Child rearing Risk Factors of Infant Deaths in Rank Order
Factor
Percentage
A.R.
1. Absence of breast-feeding
2. Mother's perception of weight gain in the first six months
to be below normal
3. Mother's perception of weight gain to be below normal
in second half of infancy
4. Nil intake of cholastrum
5. 'Prelacteal feed given
6. Weaning with animal milk delayed till eighth month
7. Weaning with cereals delayed till eighth month
8. Weaning with pulses delayed till eighth month
528%
441%
193%
39%
14%
9%
6%
5%
TABLE 8
First two-month Child Health-care related Risk Factors of Infant Deaths in'
Rank Order
Percentage
A.R.
1. Nil B.C.G. immunisation
4%
2. Nil well-baby contact with ANM
2%
3. Nil or incomplete Polio immunisation
1%
4. Nil well-baby contacts with Health Guide
-1%
5. Nil well-baby contacts with L.H.V.
-1%
6. Nil well-baby contacts with Government doctor
-1%
7. Nil well-baby contacts with R.M. practitioner
-1%
8. Nil or incomplete immunisation with DPT
-2%

11.2 Page 102

▲back to top


TABLE 9:
Socio-cultural Determinates of Infant Mortality in Rank Order
Daterminant
Percentage
A.R.
l. Scheduled-Caste family
2. Illiteracy in both the parents
3. Alive great or grandparents
4. Scheduled-Tribes family
5. More than two female siblings
13%
8%
1%
-1%
-55%
TABLE 10:
Household Economic Determinants of Infant Deaths in Rank Order
Determinant
Percentage
A.R.
l. One-room dwelling
31%
2. Household landless or with marginal landholding
29%
3. Household expenditure Rs. 500.00 and less
26%
4. Household income Rs. 500.00 and less
22%
5. Open or stagnant household waste-water drainage
21%
6. Household without cows or buffalows
16%
7. Use of any waste material as cooking fuel
(excluding kerosene, gas, electricity, coal and firewood)
13%
8. Rented dwelling
13%
9. Nil or inadequate household winter clothing
11%
10. Completely kutcha dwelling
10%
11. Nil or inadequate blankets
9%
12. Lack of home filteration of drinking water
6%
13. Household without poultry and/or without kitchen garden
2%
14. Dwelling with nil or inadequate ventilation and/or
without sanitary latrine.
1%
Note:
No higher risk for IMR was found in households which disposed of their
garbage nearby as compared with far away. Households which used coal and
firewood as fuel for cooking did not show higher risk of IMR as compared with
kerosene, gas and electricity.

11.3 Page 103

▲back to top


TABLE 11
Determinants of Infant Fertility in relation to lEG Exposure in Rank Order
Determinant
Percentage
A.R.
1. Nil exposure of mother to radio health talks
7%
2. Nil exposure of mother to health messages from hoarctings and posters
6%
3. Nil exposure of mother to film health-messages
3%
4. Nil exposure of mother to TV health talks
3%
Note.: Nil exposure to newspaper health messages did not carry any higher risk of
IMR.
TABLE'12
Fertility Determinants of IMR in Rank Order
Determinant
1. Subsequent pregnancy in mother within two years
2, Mother of the opinion that if a child dies it must be replaced
3, Mother's need for more children to ensure
surVival of the desired number
4. Mother's desire for more than two children
Percentage
A.R.
100%
35%
19%
2%

11.4 Page 104

▲back to top


TABLE 13
Prioritization of Maternal Attribute Risk Factors in Relation to
Infant Mortality
Factor
l. Birth interval < 2 years
2. Antenatal anaemia
3. Past history of infant death
4. Mother's perception of weight loss in pregnancy
5. Past history of obstetric complications
6. History of previous abortions/miscarriages
7. Prima pares birth
8. Tobacco - chewing habit in mother
9. Parity four and above
10. ~lenatal oedema
M*x w**
19.2
16.8
16.2
15.4
8.3
4.3
6.2
3.0
1.5
0.4
p***
2
3
4
5
6
7
8
9
10
* M = Magnitude i.e. proportion of index births having exposure to the risk factor.
** W = Weightage i.e. percentage attributable risk of IMR related to the risk factor.
*** P = Priority
Note: This was done. by calculating the product of magnitude of the risk
factor/determinant which means percentage of index births in which it was
present with its weightage percentage attributable risk.

11.5 Page 105

▲back to top


TABLE 14
Prioritization of Factors of Antenatal Care in relation to Infant Mortality
Factor
1. Nil ante-natal T.T.
Mx W
p
6.8
2. Nil ante-natal folifer intake
5.9
2
3. Nil ante-natal contact with ANM for routine
pregnancy check-up
3.2
3
4. Nil antenatal contact with Government doctor for
routine pregnancy check-up
0.9
4
TABLE 15
Priorit.zation of Maternal Dietary Factors in relation to Infant Mortality
Factor
1. Nil or below-normal intake of green leafy vegetables
2. Nil or below-normal intake of pulses
3. Nil or below-normal intake of meat/fish
4. Nil or below-normal intake of rililk
5. Nil or below-normal intake of fats and oils
MxW
P
11.88
1
7.98
2
6.16
3
5.04
4
2.56
5
TABLE 16
Prioritization of Intra-natal Risk Factors in relation to Infant Mortality
Factor
1. Delivery complicated by haemorrhage,
peri-natal rupture, etc.
2. Premature labour i.e. in or before the eighth month
3. Birth injury
4. Foetal malpresentation (not leading to
prolonged/obstructed labour)
MxW
P
18.5
1
14.5
2
4.8
3
2.1
4

11.6 Page 106

▲back to top


Prioritization
of post-natal
TABLE 17
risk factors in newborns in )-elation to Infant
Mortality
Factor
1. Low birth-weight
MxW
P
26.2
1
2. Refusal to suck
24.1
2
3. Respiratory distress
13.0
3
4. Cyanosis
. 12.4
4
5. Jaundice
6.6
5
6. Persistent vomitting
5.7
6
7. Abdominal distension
5.6
7
8. Cord infection
1.0
8
9. Congenital malformation
0.9
9
TABLE IS
Prioritization of child-rearing risk factors in relation to infant mortality
'Factor
M xW
P
Nil breast-feeding
56.7
1
Mother's perception of infant's weight gain in the first six
months less than normal
50.2
Denial of cholastrum
26.2
Not giving of prelacteal feed
8.5
Not weaning with animal milk by eighth month
7.8
Mother's perception of infant's weight gain in the second
six months less than nqrmal
7. Not weaning. with cereals by the e.ighth month
8. Not weaning with pulses by the seventh month

11.7 Page 107

▲back to top


Prioritization
TABLEllJ
of Infant Health-Care Risk Factors In Relation to Infant
Mortality
Factor
Nil BeG
Nil routine contact with ANM
Nil Polio
MxW
P
0.91x4==3.6
I
0.92x2== 1.8
2
0.94 x 1 ==0.94
3
TABLE 20
Prioritization of socio-cultural determinants of Infant Mortality
Determinant
Illiteracy in both parents
Scheduled- caste family
MxW
0.56 x 8 == 4.48
0.3 x 13 ==3.9

11.8 Page 108

▲back to top


TABLE 21
Prioritization of Household economic determinants in relation to infant
Mortality
Determinant
Landless or marginal land holding
Expenditure Rs. 500.00 per month
Income Rs. 500.00 per month
Inadequate winter clothing
One-room house
Completely kutcha house
Inadequate blankets
Nil household filteration of drinking water
Nil livestock
Open and stagnant household drainage
Nil poultry
Nil kitchen garden
Absence of proper fuel
Nil sanitary latrine
Inadequately ventilated house
Nil house ownership
Nil electricity in house
MxW
p
0.58 x 29 = 16.9
1
0.5 x 26 = 13.1
2
0.47 x 22 = 10.9
3
0.71 x 11 = 7.9
4
0.25 x 31 = 7.8
5
0.75 x 10 = 7.5
6
0.7x9=6.4
7
0.84 x 6 = 5
8
0.28 x 16 = 4.5
9
0.35 x 6 = 2.1
10
0.74>:<2 = 1.5
11
0.7x2=1.4
12
10.99 x 1 = 0.99
13
0.97 x 1 = 0.97
14
0.7,:<1=0.7
15
0.06 x 12 = 0.7
0.66 xl = 0.6
16
TABLE 22
Prioritization of Fertility determinants of IMR
1. Mother considers .it important to substitute
a lost infant
2. Mother thinks there is need for more children to be
able to ensure survival of desired number
0.58 x 19 = 11.1
3. Subsequent pregnancy within two years
0.100 x 100 = 10
4. Mother desirous of more than two children
0.86 x 3 = 2.6

11.9 Page 109

▲back to top


The Scheduled Tribes population according to 1981 census, is 22.43 per cent of the
total population of the State. There are some 62 different tribal communities in the
State, each differing from the other in culture, language and economic condition. Not
all areas of the State show equal concentration of tribal communities. Indeed, some
districts have a large concentration, say, above 50 per cent whereas some others have a
low concentration, below 50 per cent.
Among the tribal groups, there are a few communities which s~illdepend primarily on
hunting and food gathering for their livelihood and have a nomadic style of life. A
sizeable tribal population is still at the pre-agricultural level of technology, practising
slash-and-burn type of cultivation on the hill-slopes. Many tribal people have taken to
wet cultivation and live in permanent habitats. Some tribal people have been employed
in mining and industrial set-ups as unskilled labourers.
The tribal people are educationally most backward, the level of education being 13.96
per cent in general and 4.3 per cent among women in particular. The average age of
women at marriage among the tribal population of the State is 17.22 years. As per the
Sample Registration Scheme, the infant mortality rate stands around 132ranging from
114 to 133 during 1981-86.
Lacking any base-lin~ data on health and nutrition status, it would be difficult to say
anything exactly about the disease pattern and health conditions, dietetic habits and
nutritional status of the tribal communities. However, the general observations show'
that the level of nutrition in the tribal areas is considerably low. Poor nutrition is largely
due to such factors as over-population, over-cultivation, monetized economy, indus-
trialization, deforestation and ecological·imbalances.
Authored by Dr. Nityanand Patnaik and Dr. Almas Ali on behalf of the Institute of Tribal
Health and Social Sciences, Bhubaneswar.

11.10 Page 110

▲back to top


Like the nutritional problem, maternal and child-care in the tribal communities is
full of obscurities. Most of the diseases affecting the tribals and particularly women and
children are mainly due to insanitary conditions and superstitious beliefs andpraetices.
Diseases of digestive system and worm infestation, skin diseases, malaria, leprosy and
tuberculosis and such like health problems are widely prevalent. Among some tribes,
incidence of genetically-linked diseases is quite common.
The tribal people are generally reluctant to avail themselves of the medical facilities
available in their locality. Their superstitious beliefs, novelty and strange surroundings
of health centres, impersonal approach of the medical staff and also their ignorance
about tribal habits and customs are some of the important reasons for the indifferent
attitude of tribal people towards medical institutions and modern ~dical practices.
COVERAGE OF STUDY
The study was taken up in five districts of the State and its coverage is given in the·
follo\\\\,i_llgs_t~!~~~t :
.
District
Mayur. Koraput Sunder- Keon-
bhanj
garh
jhar
Phulbani
Blocks '
2
2
2
2
2
Cluster (149 villages)
10+10 10+10 10+10 10+10 10+10
Households
319
2859
2150
2150
2844
Average size of house-
holds
4-6
3-5
3-5
4-5
3-5
Households members
794M
801F
6556M 4825M 5304M 6439M
6545F 4443F 5049F 6149F
Number of married women 229
2446
1589
1841
2319
Number of children born 2488M
alive to currently married 2094F
women
2456M
2394F
2142M
1847F
2793M
2576F
2760M
2389F
Villages and facilities available:
Out of the 149 villages covered in the survey, Dais are present in III (74.50 per
cent) villages, M.C.H. in 19 (12.75 per cent) villages, Sub-Health Centre in 21 (14.09
per cent) villages, P.H. C. in three (2.01 per cent) villages, Government HospitallQinic
in two (1.34 per cent) Private Hospital/Clinic in one village, Drug-store in two (1.34 per
cent) villages and A nganwadi or Feeding Centres in 90 (60.40 per cent) villages, primary
schools in 199 (69.80 per cent) villages and women organization centres in 56 (38.88 per
cent) villages. There are 83 (55.70 per cent} villages having electricity.
Health Workers
There are on the whole 97 health workers (94 females and 3 males) to serve all the 149
study villages. Among them there are 13Dais, Health guides, 71 AN Ms and nine Health

12 Pages 111-120

▲back to top


12.1 Page 111

▲back to top


Visitors. Most of the health workers are above 30 years of age and also married. A
majority of the Health workers of all categories is literate. The health workers of all
"categoriesresponded correctly'to such situtations as doses of tetanus toxiod, women-at-
risk, age for DPT doses, and feeding in diarrhoea. But knowledge about age at BCG
vaccination, ingredients for CRS, mother in labour and DPT doses in thetirst year
is "lacking.
Respondents by present age at marriage
Out of 1,589 respondents of all age groups, 96 (6.04 per cent) had got married at the
age up to 15years and818(51.16per cent) at age16-18years, 886 respondents (55.76 per
cent) belong to the age-group 19-25 years and 560 (58.24 per cent) to ·the age-gro\\lp of
16-18 year!': .
"
Age at consummation
Outaf 1589respondents~806 (50.72 per cent).have both their marriage and consum-
mation achieved at an early age of 16-18 years.
Age at first pregnallcy
37 respondents (77.08 per cent) of the total group of 480f age 16-18 years had their
first pregnancy at 16-18 years ..The 19-25 years old respondents numbering 886 had in
279 cases (31.49 per cent) their fi~st pregnancy aUhe age 16-18 years and in 586 cases
(66.16 per cent) between 19-25 years.
.
Child-death by age
The data.show that by the completion of one year, death occurred by 83.27 per cent in
the case of male infant and by 77.63 per cent in the case of the female infants. The data
further reveal that by the completion of 12 months, 86 per cent deaths of male infants
and 68 per cent deaths of female infants had occurred in the first birth order.
Infant death at various ages as experienced by mothers
At the early age up to 18 years the mothers experienced death of their male infant by
5.95 per cent and of their female infants by 5.02 per cent. The proportion of infant
deaths of at the age 19-25 years ofthe others has gone up to 63.57 per cent and 65.30 per
cent, for male and female infants.
Causes of infant deaths
The important causes of infant deaths are diarrhoea, dysentery, congestion, malaria
and typhoid. In the case of diarrhoea, the cases of infant deaths were of greater
proportions in the first, second and third birth orders than in subsequent birth orders.
MORTALITY RATES AS RELATED TO AGE AND OTHER FACTORS:
1. "Both male and female infant mortality rates are the highest in all age-groups (below
18 yeats, 19-25 years, 26-35 years and above 35 years).

12.2 Page 112

▲back to top


2. As the age increases, male infant mortality decreases from 266.67 in age below 18
years to 111.11 in age above 35 years. But the female infant mortality rare increases
from 125.00 in age below 18 years to 159.20 in age 19-25 years and decreases to
128.71 in age 26-35 years and again increases to 166.67 in age above 35 years.
3. In other categories, the highest mortality is 147.81 in the case of male post-neonatal
and the lowest is zero in the case of male toddlers.
4. As regards the female counterparts, the highest mortality is 111.11 in the case of
female toddlers and the lowest is 31.25 in the case offemale neonatals.
5. Of the five districts, Keonjhar records the highest infant mortality rate. In the case
of male infants, it is 343.28 and in the case of female infants, it is 291.67. Next comes
the Phulbani.district where the male and female infant mortality rates are 241.07
and 150.54, respectively. Next in order are Sundargarh (182.61M and 135;I<F),
Koraput (149.77; 57.37 F) and Mayurbhanj (96.15 M; 70.00 F).
6. Keonjhar records the highest mortality not only of the infants but also of the other
three categories of children. Phulbani records fairly high mortality rates in all
categories of children.
7. Female illiteracy is the highest in Koraput (96.35 per cent). Next in order are
Phulbani (86.86 per cent), Keonjhar (79.96 per cent), Mayurbhanj (76.53 per cent)
and Sundargarh (76.10 per cent). The order in which the districts have been
mentioned in respect of infant mortality rate from the highest to the lowest, is not in
conformity with the order in which the districts are mentioned in respect of female
illiteracy from the highest to the lowest.
8. The proportion of women who married as well as had consummation at an early age
ending 18 years, is highest in Phulbani (80.15 per cent). The next in order are
Sundargarh (78.47 per cent), Koraput (62.82 per cent), Mayurbhanj (57.64 per
cent) and Keonjhar (51.90 per cent).
9. The household size which varies from four to five members in majority casesis the
same in all the districts.
10. Mothers up to the age of 18years, had experienced 5.95 per cent male infant deaths
and ~.02 per cent female infant deaths. But the proportions shore up to 63.57 per
cent in the case of female infant deaths in mothers age group 19-25 years.
11. The IMR below 18years of age at child-birth was 266.67 for male children and 125
for female children. These rates got reduced in the case of male children, as the age
at child-birth advanced but fluctuated in the case of female children.

12.3 Page 113

▲back to top


1. Taking into consideration the birth order from the first to the fourth and above five
deaths, it is seen that the male IMR far exceeds female IMR and it is highest
(317.07) in respect of maternal attributes above five deaths.
2. IMR b~comes higher under the ill-effects of such diseases as palour, fits, measles,
injury, irrespective of the sex of the infants as well as the stages of their growth.
3. Interestingly, mortality rates are unexpectedly higher for the mothers having
medical treatment than those not having it.
4. The mortality rates are seen to have been reduced to a great extent as a result of
routine contacts of the mothers with health workers. Some categories of health
workers are more effective than others. The health workers who have been more
effective are RMP, HG and Dai. Even the Government doctors have not been as
effective as these health workers.
5. Special contact has worked more effectively in reducing the mortality rate in the
case of toddlers. The data show that the Dai's special contact has reduced mortality
rates in all the eight categories of children.
6. Special contacts of ANMs and HV s have instead oflowering mortality rate, worked
in the reverse direction.
7. Tetanus toxoid doses have greater effect than the iron tablets in lowering the
mortality rate.
8. The mothers who do not take milk experienced very high mortality rates in respect
of all categories of children. Those who took normal quantity of milk were able to
reduce male infant mortality from 666.67 to 192.77 and female infant mortality
from 1000 to 100.
9. The normal intake of meat and fish shows lower mortality rates than the intake of
eggs.
10. The mothers who have the habit of smoking or chewing tobacoo have experienced
higher mortality rates, for all categories of children.
11. The mothers who had lost weight, experienced very high mortality rates.
12. As regards the month of onset oflabour, the attributes of the eighth month record a
very high mortality rate.
13. The labour of longer duration of 6-12 hours records high mortality rates.
14. Of all the problems, those relating to pre-maturity, low weight, convulsions,
respiratory distress, poor feeding and abdominal distension have increased mortal-
ity rate for all categories of children.

12.4 Page 114

▲back to top


1. Of all items of feed, the items like "other women's milk" and "musk" were the
worst.
2. The breast-fed children are better than die non-breast-fed children in that the
former show a lower rate of mortality than the latter. The duratio~of breast-
feeding which has to a considerable extent lowered mortality ratC;3isfuore than 12
months.~·~
3. The BCG, Polio and DPT vaccination has marvellous effect in reducing the
mortality rates.
4. As regards routine contact, it is observed that of all the sontacts, the contact with
the private doctor was the most effective and the contact with the Government
doctor was the least effective in reducing the mortality rates.
5. The reduction in mortality rate with normal gain in weight is not as spectacular in
the period covering the first six months as in the following six months.
6. As regards religion, the mortality rate obtaining among the Hindu households
appears to be lower than the corresponding figures obtained for Muslim and
Christian households.
7. The Scheduled Castes have a lower mortality rate than the Scheduled Tribes.
8. Landless households show a higher IMR than the land-holding households.
9. The IMR is higher in single-room households than in multi-room households.
10. Separate kitchens have worked more effectively in lowering both the male and
female mortality among neo-natal, post-neonatal and infant groups but not among
toddlers.
11. The mortality rates are on the higher side under conditions of severe indoor smoke.
12. The mortality rates in such households as are away from garbage disposal are on the
lower side as compared with those situated near the garbage disposal.
13. Electric lighting has proved to be very favourable for the decline of infant mortality·
as compared with lighting by oil lamps and lanterns. Of these three sources, oil
lamp has been the worst.
14. The use of mosquito net has a positive effect in reducing the infant mortality.
15. The mortality rates are invariably lower among all categories of children belonging
to the households of higher income groups.
16. The ICDS blocks have done better than the non-ICDS blocks, but in both the
cases the mortality rates are not very low.
17. The IMR where the parents have a need for more children is higher than the other
way round.

12.5 Page 115

▲back to top


18. Mortality recorded for both small and large types of bodies is very high.
19. Winter season records the highest mortality rates whereas the monsoon season
records the lowest.
20. Women taking part in association activities experience low infant mortality.
21. Radio has helped in lowering infant mortality rate for the neonatal and post-
neonatal infants whereas posters have worked as effectively for toddlers.

12.6 Page 116

▲back to top


INTRODUCTION
In Karnataka, the study of infant mortality and its relationship with fertility as per the
plan was conducted in both the rural and urban population groups. For the rural
sample, the five selected districts represented all the four re-venuedivisions of the State.
The first four districts were selected on the basis of highe~t concentration of rural
population, one from each of the four revenue divisions. The fifth district was selected
on the basis of having the second highest percentage of rural population from the State~s
most backward division. From each selected district, one ICDS block and one non-
ICDS blocks were selected. In the case of ICDS blocks, the oldest one from each
district was selected; in the case of non-ICDS blocks, these were selected by random
sampling method'. In one district, where all the blocks were covered by the ICDS
programme, the choice fell on the oldest as well as the latest ICDS block. From each
selected block, 10 villages were randomly selected. 150 households were then selected
from each of the villages by segmentation method if the size of the village was large; if
the village had less than 150 households, the nearest village was taken in order to cover
150 households.
The urban sample also came from the same five distrIcts selected for the rural sample.
In each such district, all the class I and class II cities were arranged in a descending
order on the basis of 1981 population and one city from each of the districts was selected
by systematic r.andom method.
It was observed that the selected districts did not have both class I and class II cities,
on the basis of 1981 census. Each district had either one class I or one class II city and
this happened to be the district headquarter. From each city, 20 wards were selected
and from each ward 150 households were selected at random. If a selected city had less
than 20 wards, the number of households to be selected from each ward was proportion-
ately increased in order to cover 3000 households.
Authored by P.R. Reddy and P.]. Bhaltacharjee on behaLf of Popu'ationResearch Centre,
Banga/ore,

12.7 Page 117

▲back to top


1. llifant Mortality Rates:
IMR was 109 in the rural areas and 64 in the urban areas;
in the rural areas, IMR was 127 for the males and 92 for the females. The
corresponding rates for the urban areas were 68 and 59, respectively; and
in the rural areas, neo-natal deaths accounted for 37 per cent of the infant deaths
and post-neonatal deaths 63 per cent. The corresponding percentages for the urb~n
areas were about 33 and 67, respectively.
11. Maternal A.ttributes:
In the rural areas, the highest IMR was 187 observed among the children born to
mothers aged less than 18 years. In the urban areas, highest infant mortality rate of
106 was observed among those born to mothers aged more than 35 years;
IMR was higher in the lower-order and higher-order births. This was specially so
in the rural areas;
in both the rural and urban areas, the longer the birth interval, the lower was the
IMR;
IMR was higher in both the rural and urban areas if there were complications
during pregnancy and if the term of pregnancy was incomplete;
in the rural areas, IMR was higher (157) among the children born to mothers with
previous pregnancy losses and lower (108) among children born to mothers without
previous pregnancy losses; and
in both· the rural and urban areas, IMR was higher among the children born to
mother8"'With previous infapt deaths than among those born to mothers without
previous infant deaths.
111. Pre-natal Risk Factors (Mother's IUness):
IMR was higher in both the rural and urban areas among the children born to
mothers with diseases like palour, oedema, convulsions, malaria, German measles,
etc., during pregnancy than among the children born to women without such
diseases. However, the proportion of women who suffered from the diseases during
pregnancy was very low - the only exception being the proportion of women (53
per cent in the rural areas and 57 per cent in the urban areas) who suffered from
palour during pregnancy.
IV. Pre-natal Factors (Medical A.ttention, etc.):
The proportion of women who received medical attention during pregnancy was
very low in both rural and urban areas. Those who did receive medical attention
during pregnancy perhaps had some complications. Because of these reasons, IMR
among the children born to mothers who received medical attention was sometimes
higher than among those born to mothers who didllot receive medical attention;

12.8 Page 118

▲back to top


it is significant that IMR was lower among the children born to mothers who took
during pregnancy normal quantities of pulses, vegetables, roots and tuber, fat,
sugar/jaggery, eggs, meat and fish than among those born to mothers who did not
take during pregnancy normal quantities of these foods.
the association between infant mortality on the one hand and hours of domestic
work with strain, hours of wage-earning work with strain, hours of rest and hours of
sleep in the rural and urban areas was not found to conform to a consistent pattern;
and
IMR was higher in both the rural and urban areas among the children born to
mothers who smoked or chewed tobacco, took liquor' and consumed addictive
drugs than among those born to mothers who did not indulge in these habits.
V. Natal Risk Factors:
It is interesting to note that infant mortality was higher in both the rural and urban
areas when the labour started below eight months of pregnancy or when the
duration of labour was more than six hours or when the presentation was parts
other than the head;
,the IMR as related to the place of delivery showed contradictory result in rural and
urban areas. In the rural areas, IMR was about 125 when the place of delivery was
hospital and about 107 when it was home. The corresponding rates for the urban
areas were 50 and 103, respectively. This is perhaps because rural women go to the
hospitals for delivery when confronted with complications, whereas urban women
go there as a matter of routine;
in the rural areas, about 13 per cent of the deliveries that took place at home were
attended by untrained Dais and about 11 per cent by trained pai$. The IMR was
125 among the former group and 139 among the latter group.
contrary to expectation, in the rural areas, IMR was higher among the vaginal
births than among the caesarian births. However, in the urban areas, it was the
other way round. In both the rural and urban areas, caesarian births accounted for
abou,t four~r cent;
when mothers experienced excess pre-bleed, excess post-bleed and rupture at the
time of delivery, infant mortality rate was higher in both the rural and urban areas;
and
as might be expected; when the new-born experienced cord infection, birth injury,
pre-maturity, low weight, cyanosis, icterus, convulsions, respiratory distress, mal-
formation, vomitting, poor feeding, abdominal distensions and similar other
illnesses, infant mortality rate was markedly higher in both the rural and urban.
areas.
VI. Post-natal Risk Factors:
- In many parts of India. customarily the new-born are not breast-fed for three or

12.9 Page 119

▲back to top


four days after birth for a variety of reasons. They are instead fed with sweetened
water, honey, musk, animal milk, etc. Sometimes they are not fed with anything.
This results in the death of many infans. The study revealed the infant mortality
rate as higher in both the rural and urban areas where the new-born were not fed at
all for three or four days after birth;
IMR was lower in both the rural and urban areas among the infants who were
breast-fed for more than seven months;
in our country, supplementary foods are introduced to infants rather late. They are
only breast-fed until past one year. In fact, breast milk is sufficient for the infant
only up to three or four months of age after which infants need supplementary food.
The study clearly shows that IMR was higher among the children to whom
supplementary foods like animal milk, cereals, biscuits, pulses, vegetables and
fJ:"uitswere introduced after eight months than among those to whom supplemen-
tary foods were introduced before eight months;
the study also clearly reveals that when the children are immunised with BeG
doses, Polio doses and DPT doses, IMR is lower in both the rural and urban areas;
IMR was higher among the children who were routinely contacted by Dais and
health guides than among those who were not routinely contacted by ANMINurse,
Health Visitors, Government doctors and private doctors. This was true of both
the rural and urban areas;
as might be expected, when the general health is normal during the first six months
after birth, IMR was lower in both the rural and urban areas. Similar was the case
when the general health was normal between seven and 12 months; and
when the weight was below normal or above normal during the first six months and
also during 7-12 months, IMR was higher in both the rural and urban areas.
VII. Background Socio-Economic Risk Factors:
It has often been said that education of parents, particularly that of mothers,
drastically reduces infant mortality. The study reveals that in the rural areas IMR
was lower when both the parents were educated. It did not reveal reduction in
infant mortality rate when only one of the parents was educated. We do not know
whether it was father or mother who was educated; also, we do not know the level of
education. This may be the reason for lack of reduction in infant mortality rate
when either of the two parents was educated. However, in urban areas, IMR was
higher when both of the parents were not educated, lower when either of the two
parents was educated and lowest when both the parents were educated;
in rural areas, IMR was higher among the Hindus (109) than among the Muslims
(94). In the urban areas, however, it was about the same among the Hindus and the
Muslims;

12.10 Page 120

▲back to top


in the rural areas, infant mortality rate was higher among the Caste Hindus ( 113),
lower among the Scheduled Castes(109) and lowest among the Scheduled Tribes
(93). The pattern was slightly different in urban areas; it was 59 among the Caste
Hindus, 113 among the Scheduled Castes and 33 among the Scheduled Tribes;
there was no clear association between infant mortality rate on the one hand and
size of landholdings, number of milch cattle and poultry birds owned by the
households on the other. However, IMR was lower, in both the rural and urban
areas in the households which maintained kitchen gardens;
IMR was lower in the case of those who owned houses in rural areas. But it was
lower in the case of those who lived in rented houses in urban areas. This perhaps
denotes better economic conditions for both of them;
in rural areas, the structure of houses made no difference in the case of IMR. But in
the urban areas, IMR was higher among those who lived in kutcha houses, lower
among those who lived in semi-kutcha houses and lowest among those who lived in
pucca houses;
in rural areas, the number of rooms in a house made no difference to IMR. But in
the urban areas, IMR was higher among those who lived in houses with one or two
rooms than among those who lived in houses with three or more rooms;
IMR was markedly higher in both rural and urban areas where cross ventilation
was insufficient in the houses than in the houses where cross ventilation was
sufficient;
IMR was again markedly higher in both the rural and urban areas in the case of
those houses where there was no separate kitchen than in those where there was a
separate kitchen;
contrary to expectations, type of latrine used made no difference in respect of IMR
in rural areas. But in the urban areas, IMR was lower in the households who used
pits and lowest in those who used flush;
In both the rural and urban areas, IMR was higher among those who disposed of
garbage nearby their house than among those who disposed it of far away;
in the rural areas, the type of water drainage made no difference in respect of IMR.
But in the urban areas, IMR was higher among those who had open, stagnant
drainage, lower among those who had open running drainage and lowest among
those who had closed drainage;
there was no clear association between sources of drinking water and IMR in the
rural areas. However, in the urban areas, it was lower among those whose sources of
drinking water were stream/river and bore-well;
in both the rural and urban areas, IMR was lower among those who filtered
drinking water than among those who did not;

13 Pages 121-130

▲back to top


13.1 Page 121

▲back to top


IMR was lower in both rural and urban areas among those whose source oflighting
was electricity rather than among those who had other source oflight~ng such as oil
lamp and lantern;
in the rural areas, IMR was lower among those who used kerosene and gas for
cooking. In the urban areas, it was lower among those who used gas and electricity
for cooking.
in the urban areas, IMR was lower among those who had sufficient winter clothing,
quilts/blankets and mosquito nets. In the rural areas, these did not make much
difference to IMR;
in both the rural and urban areas, IMR was lower among those who owned
watch/clock, radio/transistor, bicycle and motorcycle/scooter;
in both rural and urban areas, IMR was lower in those households which had
first-aid and common medicines.
in both the rural and urban areas, IMR decreased as the income and expenditure of
the household increased; and
in the rural areas, IMR was about 124 in the ICDS blocks and about 89 in the
non-ICDS blocks. In the urban areas also, infant mortality rate was higher in the
ICDS block (68) than in the non-ICDS (62). It should not surprise one in that
generally the socio-economically backward classes/blocks have been selected for
ICDS programme.
-
VIlI.lnfant Mortality and Fertility:
IMR was higher in both the rural and urban areas among the children born to
mothers who, became pregnant after the--index child, who wanted two or more sons
and who wanted four or more children;
the study clearly reveals that IMR was higher among the chjldren b9rn to mothers
who felt the need to have a child in place of the one lost. This was true of both the
rural and urban areas. For example, in the rural areas, infant mortality rate was 134
among the children of women who felt such a need and 79 who did not feel such a
need; in the urban areas, the corresponding rates were 76 and 51, respectively. In
addition to this motivational factor, there is the psychological factor, which is that
in the absence of breast-feeding due to the loss of infant, the fOllowing conception
might take place earlier. Thus, the crude birth-rate (29) and infant mortality rate
(109) were higher in the rpral areas than in the urban areas where the crude birth
rate was 25 and infant mortality rate 64. There is a two-way relationship between
fertility and infant mortality. With frequent cycles of pregnancy and lactation,
women are likely to become anaemic, the birth weight of the child is likely to be low
and so on. All these factors are likely to result in high IMR; and
in the urban areas, IMR was higher among children born to women who perceived
the need for more children and who thought that survival chances of children
during the last five years were either the same or decreasing. There was no such
clear association obtaining in the rural areas, however.

13.2 Page 122

▲back to top


INTRODUC;TION
The IMR in Bombay in 1956was 59. Although it is less than the national target of 60
to be achieved by 2000 A.D., for a metropolitan city which should give a lead in health
matters, it is on the higher side. In any case, if the national average ofIMR is expected to
be 60, the IMR in the metro cities has to be much lower. It is only axiomatic that IMR is,
higher in the slum areas of cities and if bringing down of IMR is desired, then attention
must be focussed on these areas. Partly with this idea in mind and partly in the hope that
a similar situation as in Bombay also prevails in the slums of other big citIes, the study of
Bombay slums in relation to infant mortality was t~en up.
The study, in precise terms, aims at identifying the risk factors in infant mortality so
that remedial measures could be devised on the basis of empirical knowledge. Since the
study is based on the assumption that a reduction in IMR would also result in a decline
in fertility, due attention is also paid in examining the nexus that is known to exist
between infant mortality and fertility.
It is largely known that IMRs are vastly uneven between the neonatal and post-
neonatal phases, being much higher in the former phase. Moreover, the causes of infant
deaths are by and large different at the two phases; genetic and intra-uterine environ-
mental factors are mostly operative at the neo-natal phase and external environmental
factors including infections become more important at the post-neonatal phase. There
are also economic and socio-cultural factors which exert considerable influence, in an
indirect manner, at both the phases.
Although the population of Greater Bombay has been growing by about 40 per cent
per decade during 51-61, 61-71 and 71-81, the slum population has been growing much
faster. The percentage of slum population to the population of the metropolis in 1.961,
Authored by Dr. Victor S D'Souza on behalf of the Department of Sociology, University
of Bombay.

13.3 Page 123

▲back to top


1971 and 1981 was 12, 22 and 45, respectively. At present, iris estimatedto be over 55
per cent which means more than half the population of Bombay now lives in slums only.
Another aspect of the slums in Bombay is that the rapidly-growing slum population
instead of making an implosion in the inner City, has exploded into the suburbs and
extended suburbs. This can be seen from the growth rates of the island city, the suburbs
and extended suburbs in 1971-81, which were 6, 29 and 196, respectively.
The slum dwellers can be broadly distinguished from the non-slum people in
Bombay in that the former work mostly in the informal sector of the economy, live in
highly degraded housing and environmental conditions, are relatively poor and over-
represented by Scheduled Castes, Backward Classes, Buddhists, Muslims, younger
population, women as well as have higher morbidity, mortality and infant mortality
rates.
As the units for study of risk factors were mothers who had given birth to live babies
during the two years prior to the study, whether they were living or dead at the time of
the study, such mothers had to be located from a larger sample of households. It
consisted of 10clusters of slum households from five wards of Bombay city, each cluster
comprising about 1500 households. General information was also obtained from these
households only.
The detailed schedule on risk factors was convassed to all the mothers who had lost
their babies during the past two years and to every alternate mother whose baby born
during the past two years was surviving.
The general information obtained from 15,000 households covered a population of
about 75,000. The main characteristics of sample population conformed to the general
characteristics of slum population of Bombay as revealed in other studies. Similarly, the
background characteristics of the mothers of children born during the past two years is
consistent with those of the married women in the 15,000 families canvassed. Therefore,
even though our sample is not randomly drawn, it would appear to be fairly representa-
tive of the slum population.
The mothers in our sample were mostly of younger age groups, only 2.58 per cent
crossing the age of35. It would mean that most women in the slums generally complete
their families by the time they reach 35. It is still more significant to know that most of
them marry too young - 38 per cent having married before 15 and 39 per cent when
between 16-18 years.
Eight per cent of the women had even experienced their first pregnancy before 15
while another 39 per cent had done so before 18. Practically all the women had become
pregnant for the first time before 25.
The average number of children born to a mother is 2.91 and the average number of
deaths of children is 0.35. Fewer girls were born (sex ratio being 972) and fewer still died
(SR = 775). The percentage of child-deaths at infancy, toddler phase and beyond was
81.57,9.34 and 9.07, respectively -:- infancy taking the highest toll.

13.4 Page 124

▲back to top


In all, there were 2174 mothers of infants and 2104 of the toddlers, although the
actual number of mothers may be slightly smaller than the number of mothers with two
births during the two year period,who were combed twice.
170 infants and 28 toddlers had died. Infant mortality rate was 78.34 which is far
higher than the mortality rate among the toddlers (14). It is important to note that the
IMR in the slums is much higher than tha.t in Greater Bombay in 1986.
Other broad features of infant deaths in the slums were: (a) significantly higher
number of deaths at the neo-natal phase than the post-neonatal phase (67 agains~ 33 per
cent); (b) more male infants dying than the female infants at the neo-natal phase (71
against 61); and more female infants than male infants dying at post-neonatal phase (29
against 39). An important aspect ofIMR in the slums was that it was very much higher
among boys (90.59) than among girls (64.86). It compares though not to the same degree
with gender differences in IMR in Greater Bombay which in 1983 was 68.27 for boys
and 63.23 for girls.
'I)ETERMINANTS OF INFANT MORTALITY
We now turn to our major concern, namely the determinants of infant mortality. A
large number of possible risk factors which were suggested by the previous studies were
taken into .account. These are eategorised under the broad heads of: (i) Maternal.
attributes; (2) problems experienced by the babies; and (3) socio-economic cultural and
environmental factors. The risk-analysis is according to the neo-natal and post-neonatal
phases as also accordinK to gender differences. However, analysis of risk factors
according to gender difference may be of special significance in this study in view of its
very marked nature.
Each risk factor is evaluated both by the degree of IMR and the number of infants
affected by it. For example, even if a factor is 100 per cent fatal;but if only one or two
babies are affected by it, then it may not be considered influential in determining the
IMR as a whole. In the presentation of data, we have also graded the risk factors into
several categories - from the highly favourable to the very grave.
MATERNAL ATTRIBUTES
Maternal attributes have been studied by dividing them into factors related to: (1)
Mother's pregnancy history;(2) her iilnesses and health •.care:(3) her diet and use of
intoxicants during pregnancy; (4) her work and rest; and (5) her delivery.
Age at child-birth, parity, preceaing birth interval, previous complications during
pregnancy, incomplete term -Of pregnancy, previous pregnancy losses and previous
infant deaths ate some ofthe important risk factors related to the mother's pregnancy
history.
These risk factors, however, have some important nuances associated with them.
These are considered to be risky mainly at the neo-natal pha~. But some of them
continue to pose the risk even at the post-neonatal phase also. What is curious to note is

13.5 Page 125

▲back to top


post-neonatal phase. Similarly, a few of the factors related to the pregnancy history are
applicable only to girls while a few others only to the boys.
For example, whereas the two extremes of age of the mother are risky for the infants,
too young an age has been found to be more risky for the girls and too old for the boys
-the latter attacking male infants both at the neo-natal and post-neonatal phases.
Again, whereas the lowest and very high parities of mother are found risky, the lowest
parity is risky only at the neo-natal phase while the very high parity at the post-neonatal
phase.
Several mothers suffered from various illnesses and even when these were treated,
posed mild to serious risk to the infant. The general health-care of the mother is
beneficial to the survival of the infants, as the infants of mothers registered at clinics
during pregnancy had better survival chances than those of mothers who did not. When
the mothers had special contacts with health personnel for serious ailments, the survival
chances of boys improved but those of the girls deteriorated.
The maternal factors discussed so far are operative more at the neo-natal phase, both
for boys and girls, but on the whole they are more risky for boys at the neo-natal phase
and for the girls at the PNN phase.
The food taken in insufficient quantities by the mothers during pregnancy poses mild
risks to the infants. Its cumulative effect (not analysed) would be considerable. How-
ever, deficiencies of the mother are less of a risk to the male infants at the neo-natal
phase whereas the girls run the risk throughout their infancy.
The women in our sample, for the most part, are not habituated to intoxicants except
some who used tobacco. In their case, the infants were exposed to risk both at the
neo,natal and post-neonatal phases, the risk being graver to the boys at the post-
neonatal phase.
Work and rest
It was presumed for the purposes of our study that mothers in the slums would have
to work more and rest less, and this condition would pose risk to their infants. The
situation as it obtained, however, tells a different story. Only 46 mothers reported part
or full-time work..In their case, only the male infants faced serious risks.
Consequently, the major activity of the woman is domestic work and here again a
great majority of them did less than three hours of work. Among those who worked
more than three hour!>,their baby boys faced a grave risk at post-neonatal phase. It,
therefore, appears thllt economic employment or domestic overwork of mothers renders
the male infants more vulnerable. Surprisingly, more than normal sleep for mothers and
absence of domestic work also poses mild risks to infants. Maybe, such mothers
happened to be too sickly to take care of their babies.
Factors related to dolivery
The time of delivery is fraught with many dangers both for the mother and the child

13.6 Page 126

▲back to top


born and since the hospitals are equipped with facilities to deal with such emergencies,
hospital deliveries are usually less risky for the newborn. This is so in the slums also.
But 31 per cent of the mothers in our sample had home deliveries and their intants have
suffered a greater degree of risk at both the phases of infancy. The: risk in home
deliveries was relatively less where a qualified doctor was in attendance but such cases
were really few and far between. Long duration of labour, presentation of parts of the
baby other than head and caesarian section posed mild to serious risk, but the factors
which caused grave dangers are the premature onset of labour and excessive bleeding
before delivery.
PROBLEMS EXPERIENCED BY THE NEWBORN
Like the set of factors termed maternal attributes stated as above, there are various
problems which the infants themselves experience directly. In. the case of newborns,
these are more risky. These include physical dangers and feeding practices. Among the
physical dangers, there are various kinds of illnesses. Although the incidence of each
illness is rather small, taken together these affect a large number of infants and
invariably take a high toll of infant life, whether they are treated Ornot. Besides illnesses
and injuries, there are conditions of the newborn such as pre-maturity, low weight and
abnormal size, some of which interact and are more lethal to many infants. Cord
infection which is totally avoidable with hygienic handling, had affected 207 of the
infants and it is a serious risk to boys at the neo-natal and girls at the post-neonatal
phase.
These physical dangers invariably pose serious to grave risks to boys and girls at the
neo-natal phase. But sometimes they have proved risky at the post-neonatal phase as
well. This is especially so to the girls.
Feeding of the newborn which posed many a grave risk, are delay in administering
prelacteal feed, breast-feeding itself and not having breast-feeding at all. Givin&
sweetened water as prelacteal feed, has been widely practised and it is more beneficial to
the infant's survival. Only about one-fourths of the mothers have fed the cholastrum to
their babies. These babies had much better survival rate throughout infancy.
Risk factors at post-neonatal phase
Practices of introducing supplementary foods, immunization and healtb-care and
some indicators of general health and development were studied among risk factors at
the post-neonatal phase.
Infants which were not breast-fed at all suffered from grave risks, irrespective of their
gender. Particular attention was paid in our study to judge the effect of the timing of
introduction of supplementary foods, the distinctive timings being before seven
months, between seven and eight months and after eight months, which, ill· turn,
represent early, normal and late introductions. The usual practice among overWhelming
majority of mothers is to introduce the supplementary feed after eight months although·
relatively more mothers introduced animal milk earlier. While, on the whole, such late

13.7 Page 127

▲back to top


introduction of supplementary milk posed average risk, in the case of girls it tended to
have more adverse effect. Not just that. The early introduction of animal milk as well as
fruits spelled greater risk and that of cereals had more beneficial effect for both boys and
girls. As regards the other kinds of foods such as pulses, vegetables and meat and eggs,
early start was harmful to boys but beneficial to girls. The differential degree of
tolerance by boys and girls of the introduction of certain supplementary foods at a given
point of time is also confirmed by the pattern of IMR among the toddlers. These are
new fmdings which need further investigation by nutritionists and dieticians.
Immunizadon and health-e:are
. Lack of immunization has resulted in mild to grave risks and the girls have suffered
.on account of this even at the toddler's phase. Over 900 mothers were found going for
routine check-ups of their infants by medical or para-medical personnel. Among them,
infants under the care of the Government doctors had better survival chances. A
considerable number of mothers had consulted health personnel in case of serious
illnesses of their infants. Risks had been much higher in such cases irrespective of the
type of health personnel consulted.
Indicators of health and development
Infants whose general health and weight are perceived by their mothers as normal,
are also known to faced very grave risks. But the infants who take more than normal time
in achieving the development milestones, run greater risk, which is more evident in the
case of girls.
The set off actors included in the broad rubric below, operate throughout the life of
children, but in an indirect fashion.
Housing Environment and utilities
Better construction and spaciousness of the house, having a separate kitchen; proper
ventilation and absence of indoor smoke make for better survival chances of children at
all phases. But the prevalence of relatively better environmental surroundings within
the slums such as closed drains and proper garbage disposal do not necessarily become
advantageous. Maybe, the more repulsive overall environmental effect outweighs the
improvement in the individual surroundings.
There is a relative homogeneity with regard to household utilities such as water,
lighting and fuel inasmuch as overwhelming majority of the households use the tap,
electriCity and kerosene, respectively, for these purposes. However, there are com-
plaints voiced about water and those who have no complaints as well as those who use
filtered water have lower IMR at all phases.
Those who have sufficient winter clothing and mosquito nets have better survival
chances for their children. Households which stock common medicines, thereby show-

13.8 Page 128

▲back to top


ing an awareness of the need for immediate attention to illness, have also experiened
lower IMR.
Although winters in Bombay are milder, the newborns seem to be specially vulnera-
ble to this weather. The study shows mortality among the neonates being higher in
winter whereas among the post-neonates it is higher in the summer and rainy seasons;
The toddlers are affected the most during the summer.
Economic Factors
The ownership of the dwelling, possession of some of the items indicating a higher
level of living and generally higher monthly income and expenditure make for lower
IMR. However, unexpectedly, the highest brackets of monthly income as well as
expenditure of over Rs 2000 revealed unusually high IMR; the number of child births
and deaths in 'these groups being 134 and 54, respectively. Our classification of sources
of income into categories such as wage labour, artisan, business, service and others, was
however too coarse to permit proper discrimination among different levels of IMR.
In overall terms, however, the economic background of mothers represents an
important risk factor inasmuch as the economically more deprived mothers tend to
experience higher IMR.
Cultural Factors
Among the cultural factors considered were religion, caste, the presence of grandpar-
ents in the households, education of parents and the role of the mother in the household.
Although, the mothers belonged to four major religious group such as Hindu, Muslim,
Christian and Buddhist, only the former two categories were represented in strength
(70%and 24%respectively) whereas the latter two categories were represented by three
per cent each. The Muslims who constitute about 15 per cent ofthe population in the
city are clearly over-represented in the slums.
If we ignore the Christians and the Buddhists because of their father small numbers,
we find that the IMR among the Hindus (80.0) is much higher than that among the
Muslims (73.4). The relatively higher IMR among the Hindus is due to the fact that
they also include the Scheduled Castes and the Scheduled Tribes, and these two classes
have much·higher IMR than rest of the population.
The presence of the grandparents in the household did not play the supposedly
beneficial role in child survival, ostensibly because the mothers in our sample were
full-time housewives, capable of looking after their children themselves.
The education of the parents, especially of the mother is found clearly beneficial for
chil.d survival. So also, if the mother assumes a prominent role in the household
activities, the IMR tends to be lower.
The mother's exposure to mass media is distinctly advantageous for child survival.
This .advantage is uniformly good in respect of all types of media, fOfthe survival of
girls, both infants and toddlers.

13.9 Page 129

▲back to top


,
The mothers are classified on each of the several criteria having to do with fertility,
such as: (a) number of boys wanted; (b) number of girls wanted; (c) total number of
chidren wanted; (d) number of children already given birth to; (e) whether or not more
children are needed in order to ensure the desired number? (f) whether the survival
chances of children during the last five years have been increasing? (g) whether or not
one should have another child to replace a dead one? (h) whether one preferred spacing
or terminal method in family planning? The items e, f, g and h were intended to test out
directly, the hypothesis about the positive relationship between infant mortality and
fertility.
It is astonishing that in every criteria related to fertility, the mothers classified in
different categories have different degrees of IMR. In items e, g and h which aimed at
testing the "insurance" and "replacement" hypotheses pertaining to the relationship
betWeenfertility and infant mortality, the hypotheses about replacement behaviour are
fully confirmed. A majority of mothers affirmed that there should be more children in
order to ensure the survival of a desired number, and the mothers who said that one
shpuld have another child to replace the lost one are also those whose infants suffered
from higher degrees of IMR. Apart from the attitudes, the actual behaviour also shows
that women who had become pregnant after the index child had experienced extremely
high degrees of IMR.
In the case of the other variables related to fertility, women with different attitudes or
behaviour as regards these variables of fertility, have different degrees of IMR. But how
these differences are logically related to the hypothesis about the relationship between
infant mortality and fertility, is not so apparent. It is, however, interesting to note that
women who desire more than two sons, more than two daughters or a large family in
general, have higher IMR. But on the contrary, women who desire one child and those
who achieved small families with one or two children also have higher IMR but with a
difference that in this case the female infant mortality is excessively high. Another
extremely interesting piece of information found in this connection is that in the case of
wpmen who desire one or two children and in the case of those who have achieved small
families of one or two children and in case of those who have index infants, IMR is
excessively high, being 60 to 89 per cent, respectively. On the contrary, in the case of
the larger families whether desired or actual, the percentage of girls among the index
infants is more. Similar patterns are found for toddlers also. Obviously, such a pattern
is not natural but a contrived one, which is understandable in view of preference for
male children, which is found to be very high in our samples. But how contrived it is
ne~to be probed further.
Our study, on the whole provides copious evidence to show the relationship between
infant mortality and fertility.
HIGHLIGHTS OF THE FINDINGS
Most of the risk factors causing infant mortality, which are revealed by other sludie~

13.10 Page 130

▲back to top


are also operative in the Bombay slums. But our findings are noteworthy in other counts
as well. These, in the main are :
(i) The IMR in the slums is far higher than in the non-slum areas of Bombay;
(ii) unlike the general trend, the male IMR in Greater Bombay is slightly W"eater
than female IMR, but in the slums this difference is highly accentuatedt
(iii) while in agreement with the general trend, the neonatal IMR in the slums is
higher than the post-neonatal IMR. This difference is also accentuated,
(iv) most studies have dwelt on the differential impact of risk factors at the neo-natal
and post-neonatal phases. The present study has also focussed on the differential
impact of risk factors on male and female infants. In particular, the maternal
attributes account for greater risk to boys at the neo-natal phase and to girls at
the post-neonatal phase, which to some extent explains why neo-natal mortlllity
as well as total IMR are higher among the boys:
(v) a matter of gender-related risk which is little ·known, but nevertheless revealed
in this study, is that the defiCiencies in the diet of pregnant mothers and the
timings of the introducing of supplementary foods to the infants, pose differen-
tial risks to boy as well as to girl infants;
(vi) housing and environmental factors, and mother's preoccupation with work are
reskier for boys whereas some of the fertility-related factors are riskier for girls;
(vii) some of the curvilinear risk factors have different targets of risks at their
extremes. It is specially interesting to note this phenoDlenon in the case of the
variables of mother's age and parity. Whereas the mother's age below 18 poses
more risk to girls at neo-natal phase, age above 35 is riskier for boys .-t die
post-neonatal phase. Similarly, whereas very low and high parities of mother are
risky for both the boys and girls, the former holds good at the neo-natal phase
and the latter at the post-neonatal phase. These peculiarities discount the usual
assumption that age and parity are related, although apparently they seem to be
so
(viii) although the slum dwellers as a whole suffer from adversesocio-economic,
.cultural and environmental short-falls, &icsompared with the non-slum popula-
tion, there is a considerable degree of heterogeneity among the slum dwellers
themselves; and the mothers in the slums who are exposed to more adverse
conditions, experience higher degrees of infant mortality;
(ix) There is strong evidence that when the actual family size is small, which means
with one or two children, the parents contrive to have an inordinately high
proportion of boys. In this category, infant mortality among girls is extremely
high
.
(x) there is also a good deal of evidence in our study to confirm the hypothesis about
the positive relationship between fertility and infant mortality.

14 Pages 131-140

▲back to top


14.1 Page 131

▲back to top


SECTION C:
SCHEDULES I TO IV
and
SELECT READING

14.2 Page 132

▲back to top


Canvass this schedule to well-informed local leaders or functionaries
from revenue villages or census blocks selected in the sample and seek
necessary information and cooperation from them.
This study funded by International Development Research Council,
Canada and Family Planning Foundation, India seeks to fmd out
causes and remedies of infant mortality in Uttar Pradesh, Madhya
Pradesh, Orissa, Kamataka and Maharashtra with cooperation from
conc;erned St_e governments and Central government. Kindly
cooperate and provlde as accurate and .reliable an .information as
posslble.
DI 1.1 Schedule: 1. Settlement 2. Health Worker 3. Household 4. Eligible
Woman
201.2 State: 1. U.P. 2. M.P. 3. Orissa 4. Karnataka 5. Maharashtra
30 1.3 Region: 1. Hilly 2. Tribal 3. Rural 4. Slum 5. Urban
401.4 District/City:
_
sO 1.5 C.D. Block/Census ward:
601.6 Type of block/ward : 1. ICDS 2. Non-ICDS
"
_
70 1.7 Sample cluster:
8-900.8 Revenue village/census block:
_

14.3 Page 133

▲back to top


2.1 Population
10-15
16-21
22-27
28-33
i) Total
ii) Literates
iii) Scheduled Castes
iv) Scheduled Tribes
Data Block-3 Access to Facilities Commonly used by local people
(Code "00" if available within settlement or else distance in kilometres
from the nearest one that is most commonly used)
34-35
i) Untrained Dai
1---+----1
36-37 I---+---l ii) Trained Dai
38-39
iii) Famale Health Guid~
1---+----1
40-41
iv) Famale Multi-purpose worker (ANMINurse)
1---+---1
42-43
v) Health Visitor (MCHlFP)
1---+----1
44-45
vi) Sub Health Contre
1---+---1
46-47 1---+---1 vii) Primary Health Centre
48-49
viii) Government Hospital/Clinic
1---+---1
50-51 1---+---1 ix) Private Hospital/Clinic
52-53 I---+---l x) Drug Store/pharmacist
54-55 '---'-----J xi) Private allopathic doctor (RMP)
56-57
t:--t---l
58-59 1---4---1
60-61
1---+----1
62-63
i) Anganwadi/feeding centre
ii) Primary School
iii) Non-formal education centre
iv) Women's organization (specify)

14.4 Page 134

▲back to top


64-65
i) Motorable road
t--t---i
66-67
ii) Bus stop
t--t---i
68-69
iii) Railwaystation
~-+--,/
70-71
iv) Telephone/telegraph office
t--t---i
72-73 ~-'---' v) Ekctricity
Name of interviewer:
Date of interview:
Name of supervisor:
Date of verfication :
_

14.5 Page 135

▲back to top


Canvass this schedule to Dai, Female Health Guide, Female
Multipurpose Worker (ANM), and Health Visitor who provide MCH
or FP services to local people from selected revenue villages or census
blocks.
This study funded by International Development Research Council,
Canada and Family Planning Foundation, India seeks to frod out
causes and remedies of infant mortality in Uttar Pradesh, Madhya
Pradesh, Orissa, Karnataka and Maharashtra with cooperation from
concerned State governments and Central government. Kindly
cooperate and provide as accurate and reliable information as possible.
10 1.1 Sched~: 1. Settlement 2. Health Worker 3. Household. 4. Eligible
Woman
20 1.2 State 1. U.P. 2. M.P. 3. Orissa 4. Kamataka 5. Maharashtra
3D 1.3 Region: 1. Hilly 2. Tribal 3. Rural 4. Slum 5. Urban
401.4 District/city:
50 1.5 C.D. Block/Census ward:
601.6 Type of block/ward : 1. ICDS 2. Non-ICDS :
701.7 Sample cluster:
_
8-900 1.8 Revenue village/census blod: :
_
1001.9 NamecLHealthWorker:
_
110 I.I0Desigmrion of Health Wor1ler 1. Da; 2. Health guide

14.6 Page 136

▲back to top


3. Multipurpose Wolker (ANM)
4. Health Visitor
1202.1 Sex
IMale
2. Female
_
1302.2 Age:
years
1402.3 Marital status: I. Unmarried 2. Married 3. Separated/divorced 4.
Widow
1502.4 Education: 1. Illiterate
2. Literate but below primary
3. Primary or above but below martic
4. Matric or above but below grJduate
5. Graduate Ilnd above
16-170]2.5 Duration ofservice:
['::-rrr=IJ]2.7 20-2'5
}8-19 0]2.6 Area served: _revenue
Population served:
ye&rS
vilJagesIcensus b10cb
_
2.8 Level of job satisfaction
260 1 Job
1
0 27
11. Remuneration
1
28Diii. Equipmcnts
I
290 iv. Supply of medicines
I
300 v. Co-operation from people
I
310 vi. Co-operation from junior
I
health· workers
Co-operation from senior
1
health workers
2
3
2
3
2
3
2
3
2
3
2
3
2
3

14.7 Page 137

▲back to top


Nature of Task
Do you perform (if yes then ask)
this task?
Are you formally
l. No. 2. Yes. l. No. 2. Yes
i) Detection of simple symptoms
I
of diseases & malnutrition
ii) Identification of 'high risk'
I
mothers and infants
37-38,
iii) Performing simple deliveries
I
39-40
IV) Referral of complicated cases
1
41-42 '--"---' V) Immunization of mothers &
I
infants
VI) Simple treatment of main
I
infections like diarrhoea (ORT)
vii) Growth monitoring i.e.
I
measuring height, weight and
growth of the child
viii) Propagation of breast &
I
supplementary feeding
ix) Propagation of personal &
I
envorinmental hygiene
x) Propagation of birth spacing
I
& birth control
2
1
2
2
I
2
2
I
2
2
1
2
2
1
2
2
1
2
2
I
2
"
2
1
2
2
I
2
I
2
I
2
xi) Any other (specify)
I
2
1
2
Note: Read only questions not answers. Check answers given and code
number of correct answers which are indicated by (c).
0 55 4.1 What type of pregnant woman is considered as 'at risk' who
needs extra preqlUtion and prompt referral?
.
I. pregnant within 2 years after menarche (c)
2. with previous pregnancy mishaps/complicatiOn (c)

14.8 Page 138

▲back to top


3. with bleeding prior to or during labour (c)
4. with premature labour or r&1pture(c)
5. Chronic anaemia (c)
6. Other specify.
_
D 56 4.2 If a woman pregnant for the second time is in labour for about
36 hours, which course of action would you take?
1. wait and watch for 24 hours more
2. prescribe medicinCi and look after her
3. show the patient to a senior health personnel like lady health
visitor/doctor
4. refer the patient to taluk/distriet hospital (c)
D 57 4.3 How many tetanus toxoid injections should initially be given to a
pregnant woman: o. none 1. one 2. two (c) 3. three 4. four
58.04.4 If a child does not breathe immediately after birth, what should
be done?
1. wait and watch
2. throw water on the new born
3. c:Iean ora1Inasal passages (c)
4. physical stimulation (c)
5. mouth to mouthlblg-mask respiration (C)
6. any otIier (specify)
0 59 4.5 If the weight of a child at 2 months was 3.0 kg and again at 4
months is 3.0 kg., is it normal or abnormal?
1. Normal 2. Abnormal (c) 3. Can't say
D 60 4.6 At what age the child should be given BeG vaccine?
1. below 3 months (c)
2. 3-5 months
3. 6-11 months
4. after one year
61 04.7 At what age the child should be given the semi-solid food?
1. 4-5 months (c)
2. 6-8 months
3. 9-11 months
4. after one year

14.9 Page 139

▲back to top


D 62 4.8 What ingredients in different proportions arc used in the oral
rehydration solution that can be prepared at home in order to
treat diarrhoea?
IfJgredieret.
AffIOMftt
1. Boiled Water
I litre (c)
2. Sugar/Honey/jaggery
2 tablespoons (c)
3. Ordinary Salt
~ tablespoon (c)
4. Baking Soda
~ tablespoon (c)
5. Any other (specify)
D 63 4.9 At what age the child should be given OPT doses?
1. 0-2 months 2.3-5 months (c) 3.6-8 months 4. after 9 month'
D 64 4.10How many doses oftripple antigenlDPT arc necessary for the
child during the fIrSt year of life?
O. Zero 1. one 2. two 3. three (c) 4. four or more
D 65 4.11Should child be fed during an attack of diarrhoea?
1. No 2. Yes (c)

14.10 Page 140

▲back to top


Canvass this schedule to the head or any other well-informed member
of the household selected from the sample village or census block.
This study funded by International Development Research Council,
Canada and Family Planning Foundatioll, India seeks to fmd out
causes and remedies of infant mortality in Uttar Pradesh, Madhya
Pradesh, Orissa, Karnataka and Maharashtra with cooperation from
COncemedState governments and Central government .. Kindly
cooperate and provide as accurate and reliable an information as
possible.
D I
1.1 Schedule: 1. Settlement 2. Health Worker 3. Household
4. Eligible Woman
D 2
1.2 State: 1. U.P. 2. M.P. 3. Orissa 4. Kamataka 5. Maharashtra
D 3
1.3 Region: 1. Hilly 2. Tribal 3. Rural 4. Slum 5. Urban
D 4
1.4 District/city:
~D 1.5 CD. Block/Census ward :
_
D 6 1.6 Typeofblocklward: I.ICDS 2. Non-ICDS -
_
D 7 1.7 SImple cluster :
OJ 8-9
1.8 Revmuevillage/census block :
[II] 10-12
1.9 House number:
130 l.iOName of head of household :
_

15 Pages 141-150

▲back to top


15.1 Page 141

▲back to top


~
Sl. Name Relation to Sex Age Education Marital
No.
Respondent
status
Age at
Marrilge Gouna
1
2
3
4
5
6
7
8
9
1
'3
4
5
6
,7
8
-
9
10
11
12
13
(CoI8-19 for currentlv marriedwolllCllonly)
Children.born alive
So Far
Tow
Surviving
In last 2 yrs
Total
Surviving
In CISCof mant
deaths specify
birth order for
M F M F M F M F Male Female
10 11 12 13 14 15 16 17 18
19
.
For
coding
only
20
14-34
35-55
56-76
14-34
35-55
56-76
14.34
35-55
56-76
14-34
35-55
56-76
14.34

15.2 Page 142

▲back to top


Co1. Item
Codes
3
< Relation
4
Sex
6
Ed~cation
1. Self 2. Spouse 3. Son 4. Daughter 5. Sibling
6. Oilld of sibling 7. Parent 8. Gnmdparent 9. Others
I. Male 2. Female
1. IUiterate 2. J..iterate (including non-formal) or
below pri~ 3. Primary or above but below Mattie
4. Mattie or above but below Graduate 5. Graduate and
above.
1. UlUlWTied 2. Married 3. Separatedldivoced
4. Widow
Instructions
I. Canvass Schedule - IV to every currently mqrried woman if the child was born
alive in the last two years but d.d not survive and to every second alurnate 'f.DCAIIm
if the child born in the last two years has survived (on the basis of iIlij)rmation
obtained in cols. 16 ~ 17)
2. In case two or more childrep were bOrn "'ive in the leasttwo years i.e. ftoJD1984
Diwali to 1986 to a woman then canvasS ~dule IV separately for ~ child
who could not survive but only once even if two or more children have survived
because of our plan of coveriJJg 50 survjvipg children in the sample.
3. Transfer information obtained in 4ata block-2 of Schedule III to data b1QCk-2 of
schedule IV in cols. 2, 4, 5, 6 & 7 and c~ relation with reference to eligible
woman respondent in col. 3. of schedule-IV.

15.3 Page 143

▲back to top


Canvass this schedule to currently married who has had a live birth in
the last two years as identified by schedule-4 or to any other woman
well-informed about eligible woman if she is no more or not available
at the time of survey.
INTRODUCTION
This study funded by International Development Research Council,
Canada and Family Planning Foundation, India seeks to fmd out
causes and remedies of infant mortality in Uttar Pradesh, Madhya
Pradesh. Orissa, Karnataka and Maharashtra with cooperation from
concerned State" 'governments and Central government. Kindly
cooperate and provide as accurate and reliable information as possible.
Data Block-I: Identification
1 0 1.1 Schedule: 1.Settlem~nt 2. Health Worker 3. Household
4. Eligible Woman
20 1.2 State: 1. U.P. 2. M.P. 3. Orissa 4. Kamataka 5. Maharashtra
30 1.3 Region: 1. Hilly 2. Tribal 3. Rural 4. Slum 5. Urban
40 i.4 District/city:
5 0 1.5 C.D. Block/Census ward:
_
60 1.6 Type of block/ward : 1. ICDS 2. Non-ICDS
._
70 1.7 Sample cluster:
8-9 [I] 1.8 Revenue village/census block:
ITIJ 10-12
1.9 Name of eligible woman/respondent: _.
_
._
_
130 1.10Survival status of child born alive in 2 years: 1. Surviving
2. dead
140 1.1I Survival status of mother : 1. Surviving 2. dt'ad

15.4 Page 144

▲back to top


Sl.
No.
1
1.
2.
3.
4.
5.
6.
7.
8.
9.
10.
11.
Col.
3.
Name
2
Item
Relation
Sex
Education
Relation to
Respondent
3
Sex Age Education Marital
Status
4, 5
6
7
Coths
1. Self2. Spouse 3. Son 4. Daughter 5. Sibling
6. Child of sibling 7. Parent 8. Grandparent
9. Others
1. Female 2. Male
1. Illiterate 2. Literate or below primary
3. Primary or above but below Matric
4. Matric or above but below graduate
5. Graduate & above
1. Unmarried 2. Married 3. Separated/divorced
4. Widow

15.5 Page 145

▲back to top


For coding p...-poses only
15-16
1. Woman's age
17 2. Woman's education
18-19
3. Husband's age
20 4. Husband's education
21 5. Total sons
22 6. Sons above 5 years
23 7. Literate sons
..;.•;...
24 8. Total daughters
25 9. Daughters above 5 years
26 10. Literate daughters
27 11. Parents/grandpareQts
28 12. Currently married women
29 13. Literate male members
30 14. Literate f~e members
Data block-3: Maternal History
31-32
33-34
35-36
[I]3.1
[I]3.2
[I]3.3
Age at marriage:
Age at oonsummationl gauna:
Age at the fmt p~
:
3703.4 Total number of pregnancies :
3.5 Outcomes of pregnancies
380
i) Spontaneous abortions :
390
ii) Induced abortions:
400
iii) Still births:
410
iv) Live births:
420
v) Multiple births :
4303.6 Complicated pregnancies :
44 3.7 Complicated deliveries :
4503.8 Cesaerian/surgical operations:
4647 [I]3.9 When did you experience the last live birth?
yrs.
yrs.
yrs.
months ago

15.6 Page 146

▲back to top


Carc1l1Qd
column
numben
fQl' codinI
Birth
Order
_.
2: 15-35
2: 36-56
2: 57-77
3: 15-35
3: 36-56
3: 57-77
4: 15-35
4: 36-56
4: 57-77
Duration of
pregnancy
(in months)
Data block. f: History of Un Births
(Start from the Jut Hvc birth aacllO backwards while probiq)
Type of birth Mother's
1. still birth lie at
2. live birth- child
3. multiple birth
birth
(in years)
Preceding
birth
interval
Sex of
Child
.. I. male
(in months) 2. Female
Age of Child
(in years. months & weeks
At present
(if surviving)
at death
(if dead)
Cause of
death
(if dead)
Codeas~r
7.4
ymw ymw
Modem
const:rac:'lentivca
used before
1. No.
,
2. Yes
,

15.7 Page 147

▲back to top


16-19
D 15 I) Did you become pregnant after the birth of index child
(born in the last two years)?
1. No
2. Yes
CII:IJ ii) How many children do you want to have in all?
Boys __
Girls
Total---
D 20 Hi) Which family planning method will you prefer in order not
to have additional children?
Q. None 1. Withdrawal 2. Rhythm/safe period 3.
Condom/diaphragm 4. Cream! jelly 5. Oral pill 6.
Loop/IUD 7.Tubectomy 8. Vasectomy 9. Any other
D 21 iv) Do you think that the chances of child survival are
increasing, decreasing or remaining the same in the last 5
years?
1. Increasing 2. Remaining the same 3. Decreasing
D 22 v) Is it necessary to have more children to ensure that the
desired number of children will survive
1. No.2.
Yes
D 23 vi) Is it necessary to have a child in place of one that dies within
a year of life
1. No 2. Yes

15.8 Page 148

▲back to top


-I
~-4>0
25-27
28-30
31-33
34-36
37-39
40-42
43-45
46-48
49-51
52-54
55-57
58-60
61-62
Data blCK:k5 : Pre-natal risk factors operating durinl the
l period of index pregnancy
5.1 Did you have the following sickness/symptoms during the index pregnancy?
Sickness/symptoms
i) Palour (paleness of
sIdnI eye-lids)
ii) Oedema (swelling on
ankles and feet)
iii) Convulsions (fits)
iv) Malaria (high fever
with chills
v) German measles
(fever with rashes)
vi) Heart disease (shortness
of breath/chest pain)
vii) Tuberculosis (chronic
cough with weight loss)
viii) Diabetes (frequent
urination & thirst)
ix) Renal infection (burning
pain during urination
with pus)
x) Hypertension (high
blood pressure)
xi) Anaemia (weakness)
xii) Accident/injury
xiii) Any other illness or
(specify)
Did you have it?
I. No
I
2. Yes
2
If yes then ask
In whIch Did you receive
trimester proper medical
Anention?
I. No 2. Untrained
doctor
1
2
3. trair.ed
dOCtor
3
1
2
1
2
3
I
2
I
2
1
2
3
I
2
3
I
2
1
2
3
1
2
1
2
3
I
2
I
2
3
1
2
I
2
3
I
2
I
2
3
I
2
1
2
1
2
1
2
1
2
3
1
2
3
I
2
3
I
2
3

15.9 Page 149

▲back to top


If no propet medical attention received from the trained doctor at home or
hospital at lillYsickness mentioned above then ask reasons for it?
6505.3
6605.4
1. Facility not available or aceessibie 2. Doctors not cooperative or helpful
3. Poor supply of medicines 4. Personal inability dr unwillingness
5. Other (Specify)
How was your health in general during pregencYf
1. Below normal 2. Normal 3. Above normal
Was your health getting better or worse?
6705.5 Were you losing or gaining weight?
1. losing 2. Neither losing nor gaining 3.Gaining
5.6
15 0
Antenatal care received during the index pregnancy
Was your name registered at government or provate nealth
centre/clinic?
1. No.2. Yes
If yes, in which month of pregnancy? _ th mOilth
ii How many contacts did you h~ve with the following health persons
for ahtenatal care?
18-31
Health
person
a; Dai
b. Health Guide
c. ANM/Nurse
d. Health Visitor
e. Govt doctor
f. Private doctor (RMP)
g. Any other (specify)
Number of contacts
Routine
Special purpose
,
Did you receive it?
[fyes
32-35
a. Tetanus toxoid doses
1. No
I
2. Yes
2
How many?
b. [rOil tablets/foiic acid
I
2
5.7 Pelsonal habits during pregnancy,
Did you do the following during the index pregnllllCY?
.. Smoke/chew tobacco
--~ii. Drink· liquor / alcohol
i--
L--L- _._ HI ._Co_n_su_me addicitve drugs
1. Never
1
I
I
2. Sometimes
2
2
2
3. Often
3
3
3

15.10 Page 150

▲back to top


5.8 Diet of mother duriDa pregnancy :
What was your nonna! daily dietary intake during pregnancy?
Food (Unit)
i. Cereals (chapatislbowls)
ii. Pulses (bowls)
iii. Leafy vegetables (bowls)
iv. Other vegetables (boWls)
v. Roots and tubers (bowls)
vi. Milk (cup)
vii. Fat/oil (tablespoon)
viii. Sugar/jaggery (tllble~poon)
ix. Eggs (number in week)
x. Meat/fish etc (kg. in week)
1. .Below normal
1. less than 9
1. less than 3
1. less than 2
1. less than I
1. less than I
I. less than 1
1. less than I
1. less than I
1. less than 6
1. less than 200
2. Normal
2. about 9-10
2. about 3-4
2. about 2
2. about I
2. about I
about 1-2
2. about 1-2
2. about 1-2
2. about 6-7
2. about 200-
250
3. Above norma)
3. more than 10
~. mote thai:>4
3. more than 2
3. more than 1
3. more than 1
3. more than 2
3. more than 2
3. more than 2
3. more than 7
3. more than 250
xi. Did you eat extra food!
xii. Did you avoid some food?
xiii. Are you vegetarian
or non vegetarian?
1. No
1. No
1. Vegetarian
2Yes(S~)
2 Yes (Specify)
2. Nort-
Vegetarian
5.9 Work arid leisure during last trimester
i. Normally how many hours in a day did you spend in the follOwing activities
particularly during your last trimestet of index pregnancy?
Number of hours spent
Activity
without much
physical strain
with considerable physical
strain (due to lifting or
eatrying heavy loads)
EE 55-56
a. Domestic
b. wage-eaning
ii. Normally how many hours of rest and sleep aid you have during the last
trimester or your index pregnancy? Was it enough?
Activity
EE 57-58
59-60
a. Rest
b. Sleep
Duration
(in hours)
Was it enough?
1. No
2. Yes
1
2
I
2

16 Pages 151-160

▲back to top


16.1 Page 151

▲back to top


Data Block-6 Natal risk factors operating at index delivery
6.1 Conditions during labour and delivery :
61
I 62-63
64
i. On-set of labour
ii. Duration of labour
iii. Type of labour
65 -
iv. Type of presentation
(part of baby's body ooming out first)
v. Type of delivery
C vi. Size of baby at birth
C vii. Place of delivery •
viii. Season of Delivery
[ ix. Birth attendence
(in case of home delivery)
In _. month of pregnancy
For - hours
1. Spontaneous
2. Induced
I. Foot/hand 2. Head 3. Buttocks
4. Sideways
1. Vaginal 2. Caesarian
1. Smaller than usual 2. Usual
3. Larger than usual
L Parent's home. 2. In-law's home
3. Clinic/Hospital 4. SHClPHC
• Summer 2. Monsoon 3. Winter
1. No one 2. Female relative/friend
3. Untrained Dai 4. Trained Dai
5. ANMINurse 6. Private doctor
7. GoYl. doctor.
71-72
73-74
75·76
77-78
6.2 Problem/complication
experienced by mother at
delivery
Did you
have it?
1. No 2. Yes
12
(if yes then ask)
Did you receive proper
medical attention?
1. No. 2. Un-trained 3. Trained
doctor
doctor
2
3
ii. Excessive bleeing after the
2
de~ivery
Rupture of perineal region
2
iv. Any other (specify)
2
2
3
2
3
2
3

16.2 Page 152

▲back to top


6.3 Problem! complication
experienced by child at
birth
Did child have it?
1. No 2. Yes
1. Cord infection (discharge or I
2
redness)
(if yes then ask)
Did the child receive proper
medical attention?
1. No. 2. Untrained 3. Trained
doctor
doctor
I
2
3
ii. Birth injury (by passage or
I
2
I
2
3
manipulation)
iii. Immaturity (small &
premature baby)
I
2
I
2
3
iv. Low birth weight (too thin
I
2
I
2
3
or small baby with less than
say 2.5 Kg)
v. Cyanosis (d~p blue colour I
2
I
2
3
over skin lasting more than ~
minutes after birth)
vi. Icterus (yellow colour over
I
2
I
2
3
skin & mucous membrane
within 48 hrs. after birth)
vii. Convulsions (twitching with I
2
I
2
3
loss of consciousness)
viii. Respiratory distress (difr-
I
2
I
2
3
culty in breathing)
ix. Malformation (in head size
I
2
I
2
3
fingers & limbs)
x. Vomitting (expulsion of
I
2
I
2
3
entire milk)
xi. Poor feeding (not sucking
I
2
I
2
3
or refusing to suck)
xii. Abdominal distension
I
2
I
2
3
(bloating of abdomen)
xiii. Any other (specify)
I
2
I
2
3
6.4 If no proper medical attention received from the trained doctor at home or hospital
for anyone of the problems mentioned above then ask reasons for it?
1. Facility not available or accessible 2. Doctors not co-operative or helpful
3. Poor supply of medicines 4. Personal inability or unwilligness 5. Other (Specify)

16.3 Page 153

▲back to top


Data Block-7Post-natal Risk Factors
7.1 Pre-lacteal, breast and supplementary feeding.
D -t3
i W8$ any pre-lacteal feed given to the new born before breast
milk?
44 D ii
1. No.2 Sweatened water 3. Honey 4. Musk 5. Animal Milk
6. Other woman's milk 7. any other (specify)
Was cholastrUm (tht: first milk) given to the new born
immediately after birth?
1. No.2.
Yes
45-46 [IJ
iii At what age of the child was the breast feeding startt:d?
____
(days)
45-46 []J
iv. How long did you breast feed the child?'
- exclusivt:ly without supplementary food
months
- along with supplementary tOad
months.
iii At what age of the child were the following supplementary foods
mtroduced?
~
Food
ITa.
Animal milk
[]Jb.
Cereals
[]Jc.
Biscuits
[IJd.
Pulses
[]Je.
Vegetables
[]Jf.
Fruits
g. Eggs
At what age?
(m months)

16.4 Page 154

▲back to top


7.2 At what age of the child was dose( s) of the following immunization or vaccine
given (code '0' if not given)?
L i) BeG
66-68[II] ii) Polio
69-7l[II] iii) DPT /Triple antegin
72-74[II] iv) Measles
75-78ITJ] v) Vitamin A&D
1st dose
2nd dose
3rd dose
7.3 How many contactS did you have with the following health persons for postnatal
care for your child within two months after delivery?
Health Persons
a. Dai
rI nI b. Health Guide
rnc. ANMlNurse
IT] d. Health Visitor
rne. Govt Doctor
rnf. Private Doctor
IT] g. Any other (Specify)
Number of contacts
Routine
Special purpose

16.5 Page 155

▲back to top


Illness
A. Fever
1.1 ~alaria
!lId Ib~ l.-}ulJ
! ildfn from it?
I
I No. 2 Yes
At what age?
(in months)
I
2
If yes then ask
For how long?
(in days)
I No.
I
Was proper medical
aftention given?
2. Untrained
doctor
3. Trained
doctor
2
3
1.2 Influenza
I
2
I
1.3 Typhoid
I
1.4 Others (specify)
B. Coughs
2.1 Pneumonia
~
1
2
-~
tI-: 2
2.2 Bronchitis
-----+.--_!I ..-.2
2.3 Asthma
1
2
71-76
2.4 Whooping Cough
I
2
15-20
2.5 Tuberculosis
1
2
I
2
I
2
I
2
I
2
I
2
I
2
-
I
2
I
2
3--
3
3
3
.'J
3
3
3
2.6 Others (specify)
C. Digestive
3: I Diarrhoea
I
2
I
2
I
2
3
I
2
3
3.2 Dysentery
I
2
I
2
3
3.3 Gastro-enteritis
I
2
I
2
3
45-50
51-56
3.4 Acute abdomen
3.5 Peptic ulcer
I
2
1
2
I
2
3
1
2
3
57-62
3.6 Other (specify)
I
2I
I
2
3

16.6 Page 156

▲back to top


I
15-20
21-26
I
Illness
Did the child
If yes then ask
D. Nervous
4.1 Convulsions
4.2 Meningitis
4.3 Paraly,is
4.4 Uther (specify)
suffer from it?
I No. 2 Ves
,
At what age?
(in months)
For how long?
(in days)
I No.
Was proper medical
I attention given?
2. Untrained 3. Trained
doctor . doctor
I
2
=i±=
2
2
iI
2
I
I -_.- --t
I
._._ ..\\---_ -.•. ....
1
.
I
1
._2 --
2
2
2
3
I
3
3
3
E. Circulatory
I
~--
5.1 Anaemia
5.2 Heart artack/congestion
I
.•
2
1
2
I
2
3
II
2
3
5.3 Others (specify)
I
F. General
6.1 Tetanus
6:2 Jaundice
I
2
1
2
I
2
1
2
1
2
I
2
3 --
3
3
6.3 Measles
I
2
1
2
3
II
6.4 Diabetes
~ti~ 69-74
15-20
6.5 Malnutrition
6.6. Accident/injury
Ui
6.7 Other (specify)
I
2
I
2
I
2
I
2
I
2
3
I
2
3
1
2
3
I
2
3

16.7 Page 157

▲back to top


31
32
33
34-35
36-37
38-39
0 27
7.5 If no proper medical attention was given to the child by the trained
medical doctor at home or hospital at sickness then ask reasons fortit?
1. Facility not available or accessible 2. Doctors not
cooperative/helpful
3. Poor supply of medicines 4. Personal inability for unwillingness
5. Other (Specify)
0 28
7.6 How was the child's health in general?
- during the first 6 months? 1. Below normal 2. normal 3. above
normal
- dUring 7-12 months?
1. Below normal 2. normal 3. above
normal
0 29
7.7 Was child gaining the weight?
- during the first 6 months?
1. No 2. Slowly 3. Quickly
- during 7-12 months?
1. No 2. Slowly 3. Quickly
30 [] 7.8 During the illness of child did you:
- stop breast-feeding?
I. Never 2. Sometimes 3. Often
- stop supplementary feeding? 1. ~'cver 2. Sometimes 3. Often
7.9 Growth of the child
At what age (in which month) did your child start doing the
following without any support?
Si n of rowthlideal
steadying neck
(2-3 months)
In which month?
L before 2 2. during 2-3
I---,i
3. after 3
ii. rolling
(4-5 months) 1. before 4 2. during 4-5
3. after 51
iii. sitting
(6-7 months) 1. before 6 2. during 6-7
3. after 7
iv crawling
v. standing
(8-9 months)
(10-11 months)
1. before 8 2. during 8-9
3. after 9
l. before 10 2. during 10-11 3. after II
vi. walking
(12-13 months) l. before 12 2. during 12-13 3. after 131
7.10 Did you notice the following symptoms of malnutrition in your child?
0 40
i) Pale skin/mucus membrane
2
0 41
ii) Absence of muscles under skin
2
0 42
iii) Deeding of ribs
2
0 43
iv) Swelling on face and feet
2
0 44
v) Discolouration or loss of hair
2
q 45
vi) Frequent colds and infections
2

16.8 Page 158

▲back to top


CD 46-47
7.11 Whom do you normally consult on health problems?
I. No one
2. Family members
3. Relatives/friends
4. Untrained medical persons
5.Trained meftical persons
6. Others
7.12 Have you received any useful information about usual health problems and
remedies from the following mass media?
Sources
d 48
i) Radio
0 49
ii) Television
0 50
iii) Newspapers/magazines
0 51
iv) Film
f1V) 52
hoardings/posters
I. No
2. Yes
2
2
2
'2
2
.
LJ i) household?
o ii) women's association?
~~~~i.mity?
I. No
I
I
I
2. Yes
2
2
2

16.9 Page 159

▲back to top


Data Block-8 Socio-economic and environmental risk factors.
8.1 Socio-economicconditions
0 56. i. Religion
1. Hindu 2. Muslim 3. Christian
4. Buddhist 5. Sikh 6. Other
1. Scheduled Tribe 2. Scheduled
Caste 3. Others
0 58 iii. Landholding (own) 1. No land 2. less than 1 hectare
3 1-2 hectares 4. more than 2 hectares
a. Cows,
b. buffaloes
_
c. sheep/goat
d. pigs
_
63-64 OJ v. Poultry birds
0 65 vi. Kitchen garden
8.2 Housing Conditions
D 66 i. ownership of house
I. rented 2. own
0 67 ii. structure of house
1. kutcha 2. semi kutcha-Pucca
C 68 iii number of rooms
D 69 iv. cross ventilation in rooms
I.insufficient 2. sufficient
0 70 v. separate kitchen
1. Ko 2. Yes
0 71 vi. indoor smoke
I mild 2. moderate 3. severe
0 72 vii. latrine
1. open (field) 2. Pit. 3. Flush
0 73 viii. garbage disposal
0 74 ix. water drainage
1. near the house 2. away from the hQuse
1. open/stagnant 2. open running 3. closed
0 ·75 x. source of drinking water
I. pond/tank 2. stream/river 3. well
4. hand pump 5. tap
0 76 xi. is water filtered/purified before use? 1. No 2 yes
15-16OJxii any problem with water
supply
0 17 xii. Source of lighting
1. difficult access 2. acute shortage
3. poor maintenance 4. contamination
5. other (specify)
1. oil lamp 2. lantern with chim*y
3. electric bulb 4. other
1. waste/dung cake 2. coalIsoft coal
3. firewood/twigS' 4. kerosene
5. gas.6. electricity

16.10 Page 160

▲back to top


27-28
29-30
31
i. winter clothes
ii. quilts/blankets
1. N9.
1
1
2. Insufficient
2
2
3. Sufficient
3
3
iii. mosquito nets
I
2
3
iv. watch! clock
1. no
2. Yes
v. radio/transistors
1. no
2 Yes
vi. bicycle
1. no
2 Yes
vii. motor cycle/scooter
1. no
2 Yes
viii. first aid! common
-
medicines
1. no
2. Yes
8.4 Household Income
i) Sources of earning
ii) Number of earners in,household
1. Wage labour 2. Agriculture
3. Artisan/craft! 4. Business/
industry 5. Service/profession
6.0ther
Male
Female
_
iii) Monthly household earnings (Rs.) 1. upto 500 2. SOI-I000
3. 10001-2000 4. more than 2000
32-34
35-37
38-40
41-43
44-46
47-52
51-52
53-54
55-56
57-58
59-60
i) Food
p) Education
iii) Medical care
iv) clothing
v Miscellaneous
vi Total
For office purpose only
i. Date of Inte~ew
ii. Time taken for interviewing
iii. Name of interviewer
iv. Name of l;Oder
v. Name of verifier/supervisor
.---- ................ ... ......
~ . ..... .. . . .......
·............... ....... ... .. ......... ........... ..
·........... .................... . .. ..... .... ........
........................................ .... ...... ..
.............. ................ ... .... ...............
·.................. ............... ..... . ... .........

17 Pages 161-170

▲back to top


17.1 Page 161

▲back to top


1. Agarwal, V K et al (1982). Some Observations on Perinatal Mortality. Indian Paediatrics,
19 (3)
2. Agrawal R D and Jaiswal S S. Recent Trends in Infant Mortality in India. Sample
Registration Bulletin, Vol. VI, July-December 1972, pp 27-34
3. Agrawal R D. Influence of Infant and Child Mortality on Fertility in India. Seminar on
Infant in Relation to the level of Fertility, May 6-12 1975, Bangkok (Thailand), Circed,
1975, pp 163-183.
4. Armstrong, Anne. Infant Mortality - Some Possible Determinants.Canadian Journal of
Public Health, June 1966.
5. Arora Y L. Infant Mortality and Family Planning. Journal of Family Welfare, Volume 26,
No.4, June 1980, pp 73-78.
6. Bajpai P C, Kutty D, Rajagopalan K C and Wahal K M. Observations on Perinatal
Mortality. Indian Paediatrics, March 1966.
7. Barbara D M (1981). The Endangered Sex: Neglect of Female Children in Rural North
India. Itaca : Cornell University Press.
8. Behm H (1980). Socio Economic Determinants of Mortality. Latin America Population
Bulletin, (13) : 1-15.
9·. Benjamin B. Social and Economic Factors affecting Mortality (The Hague: Mouton & Co,
1966)
10. Bhargava S K, Mittal S K (1982). The Challenge of Infant Mortality - Need for a
National Commitment. Indian Practitioner, Editorial 19 April (4) : 87-289.
11. Bhargava S. K. Identification of High Risk Infants and Mothers: Preliminary Results of a
National Collaboration Study. Presented at the Seminar on the Determinants of Infant
Mortality in India. Gujarat Institute of Area Planning and Population Council (New York)
Ahmedabad, 1984.
12. Bhargava S K, Srinivasa S, Kishan J. A. Simplified Scoring System for Identification of
High-risk Births. Indian Practitioner 1982, 19:209-215
13. Bhargava V, Ghosh S, Bhargava S K. Survival Rate, Growth and Development Pattern of
Low Birth..:Weight Babies in First Year of Life~Indian Paediatrics. 6:226, .April 1969.
14. Bhinder P K. Impressions on Infant Feeding in Different Parts of India. Alumni Associa-
tion Bulletin, Calcutta: All India Institute of Hygiene and Public Health, April 1960.

17.2 Page 162

▲back to top


15. B):lattacharya B Net al (1980). Some Sex Differentials oflnfant Mortality in Rural Areas.
The Journal of Family Welfare, 27 (2)
16. Butler N R. Cause and Prevention of Perinatal Mortality. WHO Chronicle, February
1967.
17. Chakraborty P N. Study of Differential Infant Mortality among the Residents of Bustees
and Non-Bustees in Chetla Area. Alumni Association Bulletin, Calcutta : All India
Institute of Hygiene and Public Health, April 1963.
18. Chandra R K and Neberne P M (1977). Nutrition, Immunity'and Infection. New York
Plenum Press.
19. Chandrasekhar S (1972). Infant Mortality,Population:Growth and Family Planning in
India. London: George Allen and Unwin, Limited.
20. Chandrasekhar S. Infant Mortality in India 1ge1~51.Proceedings of the World Population
Conference-, Rome, 1954, Vol I, New York: United Nations 1955.
21. Chandrasekhar S. Infant Mortality in India 1901-55. London: Allen & Unwin, 1959.
22. Chen C Lincoln (1983). Child Survival: Levels, Trends and Determinants. Part A,
Committee on Population and Demography. National Academy Press. pp 163-190.
23. Chen L C, S Ahmed, M C Gesche, and W H Mosley (1974). A Perspective Study of
Birth-interval Dynamics in rural Bangladesh. Population Studies 28 : 277.
24. CIRCED and WHO (1983). Infant and Child Mortality in the Third World. Inter Centre
Cooperative Research Programme, Project No.1: Final Report.
25. Dayal R S, Prasad R, and Mathur G P. Morbidity and Mortality Data. Indian Journal of
Child Health, December 1962.
26. Dange A S. Estimation of Under-registration of Infant Deaths. Sample Registration
Bulletin, Vol X, No 2, April 1976 pp 18-25.
27. Das K K, Rahaman A, Sen A K and Mukherjee. Infant Mortality in an Urban Locality of
Calcutta. Indian Journal of Public Health, Vol 23, 3, Sept. 1979 pp 139-146.
28. Das, Narayan and Dey A S. Mortality Decline in India; Influence of Development vs.
Public Health Programme in Population Policy Perspectives in Developing Countries.
Edited by Vatsala Narain and CP Prakasam, Himalaya Publishing House, Bombay 1983,
pp 325-341.
29. Datta N, Kumar V, Kumar L Infant Mortality Related to Birth Weight in a Rural
Community. A cohort study. (Under Publication)
30. Dyson, Tim and Mick Moore, 1983. On Kinship Structure, Female Automony and
Demographic Behaviour in India. Population and Development Review. 9 (1), 35-39.
31. Edmonstron Barry and Radheshyam Bairagi. (1982). Infant and Child Mortality in
Bangaldesh. Bangladesh Institute of Statistics, Research and Training. University of
Dacca. pp 1-223.
32. Feldstein M S et al. Analysis of Factors Affecting Perinatal Mortality; A Multivariate
Statistical Approach. British Journal of Preventive and Social Medicine 19 : 129-34. 1965.

17.3 Page 163

▲back to top


33. Fernando F S, Dallas (1981). Factors Influencing the Infant Mortality Rate in Sri Lanka.
Journal of Biosocial Sciences, 13,281-86.
34. Gandotra MM, Narayana Das, et al. Effect of Child Mortality on Fertility: Some Evidence
from India Studies - Proceedings of the ICMR/Ford Foundation Workshop on Child
Health, Nutrition and Family Planning held at Jammu during Dee, 1983. pp 98-111
35. Gandotra MM, Das Narayan and Dey Devamony. Influence oflnfantand Child Mortality
on Fertility in India. A Brief Report on Ford and Rockefeller Foundations Research
P-oject. Population Research Centre, Baroda, Feb. 1981.
36. G.nosh S. Discrimination Begins at Birth. Indian Paediatrician 1986; 23:9-15
37. Ghosh $. Study of Childhood Mortality. Indian Journal of Child Health, May 1961.
38. Gopal Y S and Chandra Mouli A S. Infant Mortality and Fertility Limitation: An
Empirical Investigation. Health and Population Perspective and Issues, Vol. 4, No.4
Oct-Dee 1981, pp 266-277.
39. Gordon J R, Gideon H, Wyon J B. Child Birth in Rural Punjab - India. Am J Med Sci.
1964: 126:344 - 461.
40. Government of India. 1982. Report of the Task Force on Minimum Perinatal Care. pp
1-49.
41. Gunasekaran S. Determinants of Infant Mortality in Rural Areas of Tamil Nadu. Pres-
ented at the seminar on 'The Determinants of Infant Mortality in India', Ahmedabad
1984.
42. Gupta D, Jain T P, Joshi S, Mangal D K (1981). Infant Mortality in Rajasthan Villages,
Indian Paediatrics, 18 (2) : 101-5.
43. Gupta S R. Mortality Pattern and Demographic Trends in India, Edited by R B Chari, 0 P
Sllarma and R K Bhatia. Sunlight Printers Delhi, 1975, pp 44-45.
44. Gwaddl} D R and Sarah K Brnadel (1980). Infant and Child Mortality in the Developmg
World~ 1980-2000. Washington D C, Overseas Development Council.
45. Gupta S..Infant Mortality. Indian Paediti:rics 1976: 13:403-404.
46. Haich J P, Lehtig A C, Yarbrough, and Klen R E (1976). Maternal Nutrition Birth Weight
'and Infant Mortality. In K E Elliot and Knight (eds). Size at Birth. Associated Scientific
Publishers.
47. Haldar AK, and Bhattarcharya N (1969). Fertility and Sex Sequence of Children of
Indian Couples. Sankhya Series B, 31:144.
48. Immerwahr G E. Survivorship of Sons Under Conditions of Improving Mortality. Demo- .
gr.aphy, Vol. 4, No.2, pp 710-720.
49. 'Infant Mortality - An Appraisal of World Situation for the Decade 1949 - 58. Indian
Medical JQurnal, August 1963.
SO. Islam, M S c;t. al (1982). Infant Mortality in Rural Bangladesh: An Analysis of Causes
puring Neonatal and Postnatal Periods. Journal of Tropical Paediatrics. Dee: 28 (6)
294-98.

17.4 Page 164

▲back to top


51. Jain V C. Some Social Components of Infant Mortality in India. Indian Journal of
Paediatrics 196; 35 : 109-112.
52. Jayant K. Birth Weight and Some Others Factors in Relation to Infant Survival: A Study
of-an Indian Sample. Annals of Human Genetics, March 1964.
53. Kabir M H (1982). Determinants and Consequences ofInfant Mortality: A Short Review.
ISRT: Dacca University
54. Kabir M and Howiader A A (1980). Socio-economic Determinants of Mortality in Bangla-
desh. Rural Demography. 7 (1-2) 1-13
55. Kanitkar T, Murthy B N. Factors Associated with Infant Mortality in Orissa and Rajas-
than. Presented at the seminar on 'DeterminaI!ts ofInfant Mortality in India'. Ahmedabad
1984.
56. Kaprro S K, Reddiah V P, Lobo J. Antenatal Care and Prenatal Mortality. Indian J
Paediatr., 1985:159-162.
57. Karkal M (1980). Child Morbidity and Mortality in Greater Bombay: UPS (Mim~o);
58. Khan M E. Factors Affecting Spacing of Births. The Journal of Family Welfare, Vol 20,
No 2, December 1973, pp 54-67
59. Kielmann A A et al (1978). The N arangwal Experiement on Interaction of Nutrition and
Infections : Morbidity and Mortality Effects. Indian Journal of Medical Research,
68:21-41.
60. Krishnan P (1975). Mortality Decline in India, 1951-61. Development Vs Public Health
Programme, Hypothesis. Secondary Schooling & Medicine, Vol 9:475-79.
61. Kohli K L. (1977). Mortality in India. A Statewise Study. New Delhi: Sterling Publishers
Pvt Ltd.
62. Kulkarni G A, Relation between Infant Mortality and Fertility. Sample Registration
Bulletin, Vol IX, No.1, January 1975 and Vol IX No 2 April 1975, pp 11-16
63. Kumar V, Datta N, Saini S S-Infant Mortality ina Rural Community Development Block
in Haryana. Indian J Paediatr. 1982; 49:795-802
64. Kumar V, Datta N. Reduction of Infant Mortality in India. Indian Paediatrics 1982,
49-777-780.
65. Kumar V, Datta N. Community and Studies on Infant Mortality in Haryana : Methodo-
logical issues of Reporting and Causation. Presented at the Seminar on 'The Determinants
of Infant Mortality in India', Ahmedabad 1984.
66. Kumar V. Infant Mortality and Fertility - What Do We Know About? Proceedings of
ICMR/Ford FOundation Workshop on Child Health, Nutrition and Family Planning,
December 1983, p. 8~.97
67. Kumar V,Datta N. 'Intervention Strategies for Reduction of Infant Mortality. Indian J
Paediatr: 1985; 52: 127-132
68. Kumar V, Datta N. Lay Reporting and Verbal Autopsy in Assessment of Infant Mortality.
Indian J Paediatr (under publi~tion)

17.5 Page 165

▲back to top


69. Kurup R S. On the Contribution of Infant Mortality in explaining the Variation in Birth
Rates.among the States in India: Population Policy in India edited M M Gandotra and
Narayan Das. Blackie and Sons Publishers Pvt. Ltd. Bombay, 1984, pp 156-160.
70. Lal A. Infant Mortality: Some Socio-economic and Biological Determinants. Indian
Journal of Child Health.
71. Lal Brijesh B. Infant Mortality in Rural India. Sample Registration Bulletin, No 20, Office
of the Registrar General, India, August 1968, pp 8-11
72. Lokeshwar S M, Pal P M. Mortality in Children - An Analysis of 1690 Deaths. Indian
Pediatr. 1980; 17:145-149
73. Mahadevan K (1983). Rethinking of Policy and Interventions to Control Infant and
Childhood Mortality in Developing Countries. Seminar on Social and Health Policy and
Mortality Prospects. Parts: INED and IUSSP. (Mimeo).
74. Manchanda S Sand Sachdev K K. Morbidity and Mortality in Children in Northern
India. Indian Journal of Paediatrics, October 1962.
75. May, David A and Hear, David M. Son Survivorship Motivation in Children and Family
size in India: A Computer Simulation, Population Studies Vol 22, No 2, 1969 pp 199-210
76. Meerdink J, and Ramachandran K V. Infant Mortality according to Social Status in
Greater Bombay. Journal of the Indian Medical Association May 1, 1962.
77. Mir N A. Regionalization of Perinatal Care and its Control Vol I, Abhinav Publications,
New Delhi, 1978, Chapter IV, pp 114-132
78. Mitra Ashok. India's Population: Aspects of Quality and Control. Vol I, Abhinav
Publications, New Delhi, 1978, Chapter IV, pp 114-132
79. Mohan V, Singh H C, Singh S et al. A Retrospective Study of Infant Mortality. Indian
Pediatr. 1975; 12:693-701
80. Mosley W H (1979). Health, Nutrition and Mortality in Bangladesh in Sirageldin (Ed.).
Research in Human Capital Development. Greenwich: Jal Press. pp 77-94.
81. Mosley W Henry (1983). Will Primary Health Care Reduce Infant and Child Mortality? A
critique of some current strategies with special reference to Africa and Asia. INED and
IUSSP Conference.
82. Mosley W Henry (1977) (ed.) Nutrition and Human Reproduction. New York: Plenum
Press.
83. Mudaliar A L. The Causes of Antenatal, Natill and Neonatal Mortality of Infants with
specific reference to South Africa (Uniye(Sity of Madras 1928).
84. Mukerjee S. Assessment of Infant Mortality Childhood MortaIity and Family Planning
Targets from Fertility Data : Population Policy in India - with special reference to Infant
Mortality and Fertility edited by M M Gandotra and Narayan Das, Blackie & Sons
Publishers Pvt Ltd, Bombay 1984, pp 191-202
85. Mundo F D. Infant Mortality - A Challenge. Journal of the Indian Paediatric Society
-January 1962.

17.6 Page 166

▲back to top


86. Muthusubramanian A. Infant Mortality and Population Growth, Indian Journal of Social
Work, April 1962.
87. Nag Moni (1983). Impact of Social Development and Economic Development on Mortal-
ity. Comparative study of Kerala and West Bengal. Economic and Political Weekly.
Annual Number XVIII (19, 20, 21): 877-900
88. Nair N Sand Nayar T C V. Pre-natal Mortality in Calicut, Kerala. Journal of Obstetrics
and Gynaecology of India, August 1965.
29. Panikkar P G K (1975). Fall in Mortality Rates in Kerala : An Explanatory Hypothesis.
Economic and Political Weekly November, 22:1811-18
90. Patel M (1980). Effects of the Health Service and Environmental Factors on Infant
Mortality: The Case of Sri Lanka. Journal of Epidemiology and Community Health.
34(2): 76-82
91. Patwardhan V N and Kamel W W. Studies of Vitamin A Deficiency in Infants and Young
Children in Jordan. (WHO, 1967)
92. Padmanabha P (1982). Mortaiity in India: A Note on Trends and Implications. Economic
and Political Weekly (XVII) 32, 1285-1290
93. Phadke M V. Causes of Infant Mortality and Morbidity. Journal of Indian Paediatric
Society, October 1962.
94. Poti S Janardan and Biswas S. Study of Child Health during the First Year of Life.Sankhya
(B), November 1963.
95. Preston Samuel H (1979). Causes and Consequences of Mortality Decline in less-
developed Countries during the Twentieth Century. In Richard Easterlin (eds), Popula-
tion and Economic Change in less-developed Countries, N.E. Eco. Research.
96. Preston Samuel H (1975). Introduction in S H Preston (ed). The Effects of Infant 9Pd',
Child Mortality on Fertility. New York: Academic Press.
97. Preston SHand Nelson V E (1974). Struture and Change in Causes of Death: An
International Summary, Population Studies, 28(1) : 19-51
98. Preston Samuel H (1975). The Changing Relation between Mortality and Fertility Trends.,
Public Health Reports, 831:715-27
99. Pufer R R and Serrano C V (1975). Birth Weight, Maternal Age and Birth Order: Three
Determinants of Infant Mortility. Washington DC: Pan American Health Organisation
Publication no.294.
100. Pichat, Jean Bourgeois (1981). Measuring Infant Mortality, Principles and Methods II.
Causes of Death. Population.
101. Raddian V ~atha L M. Infant Mortality in Rural Area of Comprehensive Rural Health
ServicesProJeet Bal1abgarh. Indian Pediatr 1978:67:245-254
101. Rao P S S, Inbaraj S C'A Perspective Study of Infant Mortility and O)D.geni~Intra-
uterine Growth Rates in South India. Indian J. Med Res 1975;~1;245':'I54

17.7 Page 167

▲back to top


103. Rao V N, Coyaji B J. A Short Study on Infant Survival: Vadu Rural Health Project.
Presented in the Seminar on 'The Determinants of Infant Mortality in Inm.: Ahmedabad
1984.
104. Reddy P H et al. Fertility, Mortality and Demand for Family Planning: A Longitudinal
Study in Progress, Newsletter, Vol12, No.4, Population Centre, Bangladesh 1975.
105. Registrar General (1980). Survey on Infant and Child Mortality: A Premilinary .Report.
N. Delhi : Office of the Registrar General, India.
106. Ruzicka L T and Tara Kanitkar (1972). Infant Mortality in the Urban Setting :The Case of
Greater Bombay. In K E Vaidyanathan (ed), Studies on Mortality in India. GIRH and
FPF Monograph,pp.200
107. Saksena D N and Srivastava J N (1980). Bio-social Correlates of Perinatal Mortality :
Experiences of an Indian Hospital. Journal of Bio-social Scientes. 12 (l).: 69-81
108. Salimano, Georgio R and Vine Marty (1980). Malnutrition, Infection and Infant MOrJ;al-
ity. In S H Preston (ed), Biological & Social Aspects of Mortality and the Length o(Life.
Liege : Ordina editions pp 83-111
109. Satur D M & Bhatia S. A Review of Work done on Infant Mortality (New Delhi: Indian
Council of Medical Research) 1975.
110. Sampath S, Jain P C and Prasad B G. A StudyofInfant Mortality in Lucknow Canton-
ment. Indian J Med Res. 1970; 58:772-781.
Ill. Saxena G B. Analysis of Inequalities in Infantile Mortality; A Sample Survey of rural
Uttar Pradesh, Medical Digest, March 1962.
112. Script P P. Inter-relationship between Infant Mortality and Fertility; Some Evidence from
Indian Studies. Proceedings of the ICMRlFord Foundation Workshop on Child HealtH,
Nutrition and Family Planning held at Jammu during December 1983,PI1112-123.
113. Sen Gupta N. Infant Mortality and Hindu Customs. Medical Review of Reviews, 5, 1930.
114. Shah F K & Abbey H (1971). Effects of Some Factors on Neonatal and Post-neonatal
Mortality. Milbank Memorial Fund Quarterly, 49:33-57
115. Shah P., Udani P M. Anaylsis of Vital Statistics from rural Community Palghar H.
Perinatal, Neonatal and Infant Mortality. Indian Pediatr. 1969; 6:651-668.
116. Shah U. Perinatal Mortality in India: Can it be reduced'thorugh Primary Health Care?
Indian J Pediatr. 1986; 53: 327-334
117. Simmons, George B, Cheleste Smuckler, Stan Bern Stein and Eric Jenson (1982). Post-
neonatal Mortality in Rural India: Implications of an Economicl\\iOdel of Demography.
Vol 19 No 3: 371-89
118. Singh K P. Influence of Infant and Child Mortality on Fertility: Paper presented in the
Conference on 'Child in India' organised by IASP at India International Centre, New
Delhi, 22-24 March 1979.
119. Singh K P. Child Mortality, Social Status and Fertility in India. Social Biology Vol
21, No 4, 1974, 385-388.

17.8 Page 168

▲back to top


120. Singh S N and Chakraborty K C. Some Findings of the influence of Infant Mortality on
Fertility in a Rural Environment in India. Presented in Seminar on Infant Mortality in
Relation to the level of Fertility, CIRCED, Bangkok (Thailand), 1975, pp351-356
121. Singh M. Hospital-based Data on Perinatal and Neonatal Mortality in India. Indian
pediatr. 1986,23:579-584
122. Singhal P K, Mathur G P, Mathur S, Singh Y D. Mortality Pattern in under six children in
ICDS Urban Slum'. Indian Pediatr 1986; 23:617-622
123. Sivamurthy M. Perspectives for Mortality Decline in India, in Population Policy Perspec-
tive in Developing Countries edited by Vatsala Narain & CPP Prakasam; Himalaya
Publishing House Bombay, 1983 pp. 265-278
124. Srinivasan K. Some Methodological Issues and Suggestions in the Study of Determinants
of Infants Mortality. Presented at the Seminar on the Determinants of Infant Mortality in
India. Gujarat Institute of Area Planning and Population Council (New York),
Ahmedabad.
125. Srivastava D K, Danabalam K, Anand D. Certain Aspects of Infant Mortality - A
Prespeetive Study in an Urban Community. Indian Pediatr. 1976 13:409-413
126. Srivastava D K, Danabalatt K, Gyanasujayan Met a1. Influence of Maternal Care, Parity
and Birth Weight on Neonatal Mortality - A perspective Study in an Urban Community.
Indian J Med Res. 1976; 64:358-364
127. Srivastava V K and Pandey G D.lnfant Mortality and Fertility - An Empirical Investiga-
tion, Journal of Family Welfare, Vol XXV No 3, March 1979, pp 57-63
128. Srivastava and Saksena D N (1981). Infant Mortality Differentials in an Indian Context:
Follow-up of Hospital Deliveries. Journal of Bio-social Sciences, 13,467-78,
129. Subhadra Devi V. Effect of Perception of Infant Mortality on Acutal Family-size. The
Journal of Family Welfare, Vol 24, No.4, June 1978 pp 26-33.
130. Sugathan T N and Kashyap. Padma. Trends on Infant and Child Mortality and Fertility,
in Population Policy in Indian with special reference to Infant Mortality and Fertility.
Edited by M M Gandotra and Narayan Das, Blackie & Sons Publishers Pvt Ltd. Bombay.
131. Swami A, and Mangol S. Economic Implications of Infant Mortality, Journal of Family
Welfare, June 1961
132. Talwar P P. Determinants of Infant Mortality: Some· Evidence from Madhya Pradesh
India. Presented at the Seminar on the Determinants of Infant Mortality in India. Gujarat
Institute of Area Planning and Population Council (New York), Ahmedabad 1984.
1.33. Talwalker M A. Association of Infant Mortality and High Fertility : An Empirical
Investigation, Newsletter Vol 22, Nos 1, January 1981, lIPS Bombay pp 2-11.
134. Taylor C E, Newman J S and Kelley, Narinder U. The Child Survival Hypothesis,
Population Studies, Vol 30, No 2, July 1976, Pp 273-374
135. The Population Council (WANAR). (1980). The Health and Mortality in Infancy and
Early Childhood : Reports of a Study Group. Cairo.

17.9 Page 169

▲back to top


136. Thora S, Awadhiya S, Chaurasiya M, Kaul K K. Perinatal and Infant Mortality in Urban
Slums under lens scheme. Indian Pediatr. 1986.23:595-598.
137. Tylor C E et al (1978). The Narangwal Experiment on Interaction of Nutrition and
Infections: Project Designand Effects upon Growth. Indian Journal of M~dical Research,
68 (supplem¢nt) : 1-20
138. Udani P M. Morbidity and Mortality. Indian Journal of Child Health, June 1962.
139. Vaidyanathan K E (Ed) (1972). Studies on Mortality in India. Gandhigram Tamilnadu,
The Gandhigram Institute of Rural Health and Family Planning.
140. Venkatacharya K.Influence of Variations in Child Mortality on Fertility: A Simulation
Model Study, in : Seminar on infant mortality in relation to the level of fertility, CIRCED
Bangkok (Thailand) 1975 pp 37-102.
141. Visaria P M (1989). Mortality and Fertility in India: 1951 -1961 Milbank Memorial Fund
Quarterly, 47 (I), 91-116
142. Viswanathan T K and Athvale V B. Morbidity and Mortality in the Neo-nates. Indian
Paedia~, Aptill969.
143. Wadia E M, et al, Observations in 1,000live-born Infants. Indian Journal of Child Health,
April 1963.
144. WH 0 (1978): Risk Approach for Maternal and Child Health-eare No 39
145. WHO (1978). Report on Social and Biological Effects on Perinatal Mortality. Vols 1 & II,
Geneva.
146. WHO (1976).causes of Infant Moetality. Chronicle, Vol 30, 198-201
147. WHO & Sudan Ministry. (1~81). Infant and Early Childhood Mortality in relation to
Fertili!V Patterns.,Rel)Ort on Ad-hoc Survey 1974-1976
148. Wyon J B and J Ef'JoOrdon(1971) The Khanna Study: Population Problems in the Rural
Punjab. Harvard University Press,pp193.
149. Yankauer, Alfred. An Approach to the Cultural Base of Infant Mortality in India,Popula-
tion Review, July 1959.