JRD Tata Oration Eleven

JRD Tata Oration Eleven


1 Pages 1-10

▲back to top


1.1 Page 1

▲back to top


1.2 Page 2

▲back to top


THEELEVENTH
JRDTATAMEMORIALORATION
Dr.Nitin Desai
on
"Demographic Dividend or Debt?"
March 26, 2010
PHD House, New Delhi
" ~OUND,,~,
..,0
°4-
.J
~
~..
"~
~:=,. ~
POPULATIONFOUNDATIONOF INDIA
New Delhi

1.3 Page 3

▲back to top


Preface
PopulationFoundationof India(PFI)wasestablishedin 1970by
a groupof enlighteneds,ociallycommittedand philanthropically
inclinedindustrialistsled by Mr.J.R.DT. ataand Dr.BharatRam.
Formerlkynownas FamilyPlanningFoundationit, wasrenamedas
PopulatioFnoundatioonf India(PFIi)n 1993.Theinstitution'svision
is to supplemenatndcomplemengtovernmentse'ffortsandgalva-
nizevoluntaryactionto supporat ctivitiesaimedataddressinpgopu-
lationissuesandconcernisn India.
CurrentlyP, Fl'sactivitiesareimplementewdithina widercanvasof
populationstabilizationandsustainabldeevelopmenItn. this can-
vas,populationstabilizationis no longerseenasthe solefunction
of familyplanningr;atheri,t is seenasthefunctionof overalsl ocial
developmenPt.FIe, mphasizinaggender-sensitiavendrights-based
approachc, ollaboratews ith central,state and localgovernment
institutionsfor effectivepolicyplanningandformulationW. iththe
sameperspectiviet s, upportosrganization-sbothgovernmentalnd
non-governmen-tailn programmethsatfocusonReproductivaend
ChildHealth(RCH)F, amilyPlanningA, dolescenRt eproductivaend
SexuaHl ealth(ARSH)H, IV/AIDSand UrbanHealth.PFl'sresearch
alsocoverscorporateorganization-saspartof theircorporateso-
cialresponsibili(tCy SRi)ntheseareasthathaveasignificanbtearing
on India'sfutureasa powerfunl ation.
Asa part of its advocacyprogrammeP, opulationFoundationof India
instituteda lectureseriesin 1990" Encountewr ith PopulationCrisis,"
inviting important International and Indian celebritiesto deliver
DemogDraivpidhoeircDnedb.t?

1.4 Page 4

▲back to top


lecturesoncea yearto focuson criticalissuesrelatedto population
and developmentand to carrythe debateforward.
Since 1995, the serieswas re-christenedas "JRDTata Memorial
Oration", in memory of the founder Board Chairman of the
Foundationa, ndweredeliveredby Mr.RamakrishnaHegdef,ollowed
by Mr.ChandrasekhaDr.r.NajmaHeptullah,Mr.I K Gujral,Dr.Nafis
Sadik,Mr.K C Pant,Mr.DigvijaySingh,Dr.ManmohanSinghand Mr.
JamshedJ Irani.
ThisyearweinvitedDr.NitinDesait,o delivertheeleventhJRDTata
MemoriaOl rationon "DemographiDc ividendor Debt?"Dr Nitin
Desawi asin the PlanningCommissio(n1973-88)andlaterin the
Ministryof Financeasthe ChiefEconomiA~dviser(1988-90).In
the UN,wherehe wasthe UnderSecretarGy eneraflor Economic
and SociaAl ffairs,his majorwork wasthe organizationof a se-
riesof globalsummitsn, otablythe RioEarthSummit(1992),the
CopenhageSnocialDevelopmenStummit(1995),the Monterrey
Financeand DevelopmenStummit(2002)and the Johannesburg
SustainablDeevelopmenStummi(t2002). Sincehis retiremenht e
hasbeeninvolvedin a varietyof publicpolicyactivitiesboth na-
tionallyandinternationallyH.eisa membeor f theNationaSl ecurity
AdvisoryBoardandthePrimeMinister'sCounciol nClimateChange.
Heisa DistinguisheFdellowofTERaI ndisanHonorarFyellowof the
LondonSchoool f Economics.
WehopethatthisOrationwill stimulatetheGovernmenatndnon-
governmentaolrganizationtos comeforwardthrougha coordinated
andintegratedapproachto achievebetterresultsin populationand
developmenetfforts.It is alsoexpectedthat it will providethe nec-
essarythrustto makethevariouscomponentosf goodgovernance
workcohesively.
.New Delhi
June,2010
DemographDicividendor Debt?
Mr.A R Nanda
ExecutivDe irector

1.5 Page 5

▲back to top


EleventhJRDTata Memorial Oration
OpeningRemarksby
Mr Hari ShankarSinghania,
ChairpersonP, FIGoverningBoard
DrNitin Desai,Member,NationalSecurityAdvisoryBoard&ThePrime
Minister's Council on Climate Change,Shri B G Deshmukh,Vice-
Chairman, PFI Governing Board, Members, Governing Board,
PopulationFoundationof India,ShriA R Nanda,ExecutiveDirector,
PFI, DistinguishedGuestsL, adiesand Gentlemen,
It is myprivilegeto welcomeall of you,especiallyDr Nitin Desai,
for beingwith ustodayat the EleventhJRDTataMemoriaOl ration.
ThisMemoriaOl rationisanimportanet ventin thePFICalendafror
threereasonsT.heorationprovidesanopportunityfor PFIto payits
tributesto JRDTataoneof theco-founderosf the Foundationand
equallyimportantlythe orationis givenbydistinguishesdpeakers.
Thethird reasonis that that this yearthe PopulationFoundation
of Indiahasturned40.Thisorationmarksfortyyearsof relentless
effortsto achieveour FoundeBr oardChairpersoMn r.JRDTata's
visionof populationstabilizationfor growthand developmenint
the country.
Weareparticularlypleasedto havewith ustodayDr Nitin Desai,
aneminenet conomiswt ith manyfeathersto hiscap.Hewill share
with ustodayhisthoughtsonthecruciailssuesof populationin his
lectureon "DemographiDcividendor Debt?".Thisis an extremely
relevanst ubjecitntoday'scontextW. eareindebtedto himto have
acceptedourrequestto deliverthisoration.
DemogDraivpidhoeicrDnedb.t?

1.6 Page 6

▲back to top


Dr Nitin Desaiwas in the PlanningCommission(1973-88)and later
in the Ministry of Financeas the Chief EconomicAdviser (1988-
90). In the UN, where he was the Under SecretaryGeneralfor
Economicand SocialAffairs, his major work was the organization
of a seriesof global summits,notablythe RioEarthSummit(1992),
the CopenhagenSocialDevelopmenSt ummit(1995),the Monterrey
Financeand DevelopmentSummit (2002) and the Johannesburg
SustainableDevelopmenSt ummit(2002). Sincehisretirementhehas
beeninvolvedin a varietyof public policyactivitiesboth nationally
and internationally.Heisa memberof the NationalSecurityAdvisory
Boardand the PrimeMinister'sCouncilon ClimateChange.He is a
DistinguishedFellowofTERIand isan HonoraryFellowof the London
Schoolof Economics.
Aswe all know,in 1952,Indiawasthe first countryin the world
to launcha nationalprogrammemphasizinfgamilyplanningfor
populationstabilization.Sincethen,the IndianFamilyplanning
programmehas gone throughseveralphasesf,rom population
controlto humancentredsustainabldeevelopmenatndrecognition
of the needfor comprehensivreeproductivehealth care. The
TotalFertilityRate(TFRw) hichwas5.2in 1971declinedto 2.6 in
2008.It is likelyto fall to the replacemenlet velof 2.1 by 2026.
Theworkingagepopulation(15-59yearsd) eclinedduring1961-71
andthereafteirt hasbeenincreasincgontinuouslAy.sperthe latest
projectionbyRegistraGr enerabl,ytheyear2026Indiawillbehaving
23percenot fthetotalpopulationintheagegroupof upto 14years,
64 percenwt ill beintheworkingagegroupof 15-59yearsand12
percenat bove60yearsI.ndiais on itswayto achievethestatusof
a globaleconomipcower~housWei.ththebackingof a largepoolof
.ScientistsE,ngineerTse, chnicianasndskilledworkmenaswellasour
continuedeffortsfor increasinogurcapabilitieisnthisdirectionw, e
DemographDicividendor Debt?

1.7 Page 7

▲back to top


cannowat leastdreamrealisticalltyhat we shallbeableto bring
betterlivingstandardasndqualityof livingto ourcitizensinthenear
future. Oneof theweakesltinkssofar hasbeenour rapidgrowth
of populationw, hichwill continueto be a challengeto us,yet if
harnessepdroperlythiswill emergeasanassetW. ehaveto try how
to achievtehisfrombothendsJ. RDTatawasamandeeplycommitted
to nationadlevelopmeJnRt.D- ashewaspopularlcyalled- made
signalcontributiontso the industriagl rowthof India,civilaviation
andscience& technologyE.quallyJ,RD'csoncernfor andcontribution
to thesocialissuess,uchaspovertyu,nemploymeannt dpopulation
stabilizationareno less,andprobablymorenoteworthyD. uringhis
longlife,JRDpromotedandfosteredseveracl ausesH. ealongwith
someindustrialistlsike late Dr.BharaRt amjirecognisewd ay back
in the latesixtiest,hat Governmentianlputsandeffortsin thearea
of populationstabilizationhaveto be stimulateds, upportedand
strengthenebdynon-governmenteaflfortsW. henMr JRDTatawas
ourBoardChairmana,sapartof Foundationa'sdvocacpyrogramme,
we hadinstitutedthe lectureseriesin 1990undera differentitle
viz. "Encounterwith PopulationCrisis"inviting important
internationaal ndnationalcelebritietso deliverlectureson critical
. issuesrelatedto population.Theinauguralecturewasdelivered
by Dr NormanEBorlaugN, obelLaureateandFatherof the Green
RevolutionT.hiswasfollowedby lecturesbyeminentpersonalities
like Dr M S SwaminathanD,rAshokMitra,DrAbid Hussainand
Mr.VasanSt athe.In the SilverJubileeYearof the Foundationin
1995,thislectureserieswasrenamedasthe" JRDTataMemorial
Oration" in memoryof the co-foundeor f the Foundation.The
firstof theseorationswasdeliveredbyMr RamakrishnHaegdeand
followedbyMrChandraShekhaDr,rNajmaHeptullaM, r I KGujral,
DrNafisSadikM, rKC PantM, r.DigvijaSyinghD, rManmohanSingh
andMr SomnathChatterjeeandMr.J.J.Irani.TheFamilyPlanning
DemogDraivpidhoeircDnedb.t?

1.8 Page 8

▲back to top


Foundationp,recursotro the PopulationFoundationof India,was
formedin 1970.Laterin 1993it wasrechristeneads Population
Foundationof India.Thiswas thought necessartyo reflectthe
widerscopeof the institution'sactivitiesandenlargethe canvas.
It is importanthatwe rededicatoeurselvetso thecauseof human
welfarethroughFamilyPlanningR, eproductivaend ChildHealth
servicesandotherpopulationprogrammeiss,suesthat havebeen
closeto our heartsinceits inceptionL. etmeonceagainwelcome
youallto thisyear'sTataMemoriaOl rationbyDrNitinDesaiI.would
nowrequesDt rNitinDesatio presenttheoration.
Thankyou.
.
DemographDicividendor Debt?

1.9 Page 9

▲back to top


DEMOGRAPHICDIVIDENDOR DEBT?
Dr. Nitin Desai
OpeningRemarks
Letmebeginfirstbythankingthe PopulatioFnoundatiofnor inviting
meto delivertheJRDTataMemoriaOl ration.It isa speciapl rivilege
for measI beganmyworkinglife in Indiain theTataorganization
when I joinedTataEconomicConsultancSyervicesa, divisionof
TataSonsi,n 1970.ThatiswhereI wasinductedintowhat I have
nowdoneforfourdecadews hichisto bringto bearanalyticaal nd
academitchinkingontoday'spolicyproblems.
JRDTatawasoneof themakersof modernIndia,a factrecognized
in theawardof the BharatRatnato himin 1992. Hewasa brave
and honestIndianwho spokehis mindclearlyon what seemed
right withoutregardto the fashionof the day. Hesoundedthe
warningbellson populationgrowthlongbeforetheyhadrungin the
corridorsof powerandfollowedit upwith manyinitiativeslikethe
supporftortheInternationaInl stituteof PopulatioSncienceasndthe
establishmenotf this Foundatio(noriginallyasthe FamilyPlanning
Foundatioonf India).Hiscommitmentot thisissuewasrecognized
bythe UnitedNationswhenhewasgiventhe UNPopulatioAnward
for 1992.
To be askedto deliveran orationto commemoratethe contribution
of sucha great manis a rarehonourwhich I valuegreatly.
Letme at this stagealsopaymy tributeto his collaboratoar nd
successoarschairof this FoundationD,r.BharatRamw, howe lost
recentlyH: etoowascastinthesamemouldof acaptainof industry
whosawthat hisresponsibilitieassa citizenextendedwell beyond
DemogDraivpidhoeicrDnedb.t?

1.10 Page 10

▲back to top


the managemenotf businessesI.n this Foundationand in many
othershetoowasanexemplatrhatthe industrialistosf todayshould
emulate.
TheFoundationis truly fortunateto haveas its Chairmantoday Shri
HariShankarSinghania.Hewasthe internationalfaceof Indianand
globalbusinesswhenIwasinthe UNandinthat capacityplayeda big
rolein makingthe UNmoremindfulof the contributionthat business
could maketo its purposes.Hetoo, like his illustriouspredecessors,
embodiesthe idealof socialresponsibilityand leadershipandcarries
forward the legacyof the man whose memorywe commemorate
today.
ThePopulatioFnoundatiointselfdeserveaswordof commendation
becauseit haspioneeredso muchboth in demographiacnalysis
andpopulationpolicies.Itsreportsm, eetingsandprojectss,pread
throughthecountryhaveplayeda seminarlolein theevolutionof
demographtihcinkingandfamilywelfarepoliciesin India.
I amalsoconsciouosf the eminenceof thosewho havepreceded
meas speakersin this seriesI. lacktheir eminenceandcanonly
hopethatwhat I haveto offermaybeof somevalueasa pieceof
analysis.
I have chosenas my theme an assessmenotf the so called
demographidcividendbecausesomuchis nowbeingsaidaboutit
in discussionasboutgrowthprospectsM. yconclusionwsill bemore
guardedbut not entirelypessimisticif,I mayanticipatethe endof
mytalk rightnow.
Demographyand Development
TheMalthusianargumentlinkingpopulationgrowthanddevelopment
.recognisedearlyon in Indianplanningandambitiousfamilyplanning
programmewas institutedat an earlystage.
DemographDicividendor Debt?

2 Pages 11-20

▲back to top


2.1 Page 11

▲back to top


Thetheoreticabl asisfor a modernversionof Malthusianargument
that populationgrowthis detrimentaflor developmenrtestson a
varietyof factorslike:
. The impactof risingnumbersof youngpersonson savings
throughthedemandosn householdbudgetsandpublicbudgets
for healthnutritionandeducation;
. Womenbeingcaughtupinchildrearinghavelesstimefor other
. work;
Thepressuroen foodandwagegoodsfroma risingpopulation
andthe lowerlevelof surplusfood for sustainingthe urbanI
industriawl orkforce;
. Thepressureosn livingspaceleadingfor instanceto slumsiri
. urbanareas;
Theimpactof multiplepregnancieosnwomen'shealth;
. Thepoornutritionfor childrenbecauseof the numbersharing
whatthefamilycanafford.
ThemodernMalthusianargumenct anbe summarizeadsdrawing
outtheimplicationosf a risingchilddependencryatio.
Theideaof a demographicdividendis a twist to this argumentwhen
the dependencyratiostartsfalling. It isa productof thedemographic
transitionwhich takesplacein most modernsocietiesand typically
hasthe following stages:
. an initialdeclinein infantmortalityandchildsurvivawl ith low
costand affordablepublichealthmeasure(svaccinationc,lean
waters, anitationw) hichraisesthebirthrateandcreatesa bulge
at thebaseofthepopulationpyramid;
. a laterdeclinein deathratesin higheragegroupsanda decline
in fertilityrateswhichreducetshe rateof newadditionsat the
baseofthepyramidandtherateof withdrawaal t higherages;
DemogDraivpidhoeicrDnedb.t?

2.2 Page 12

▲back to top


. this meansthat the populationbulgecreatedbythe higherbirth
rate in the first phasemovesup the populationpyramidand in
due courseleadsto a bulge in the middle,working age groups,
the socalleddemographicdividendphase;
. a laterstagewhenthe bulgemovesinto the olderagegroupand
the proportionof retiredpersonsin the populationgoesup and
the old-agedependencyratio startsrising.
Theincreasein the proportionof personsin the working age group
.canaffectgrowth prospectsin severalways:
Workingpeopletypicallyare net saversunlikeretiredpeoplewho
are typicallynet dis-saversand this raisesthe rate of savingsin
the economy.
. Thelowerdependencyratio can reducethe burdenof education
expenditures,though this may well be counter balanced by
risingdemandsfor vocationaland highereducationof the larger
working population.
. Thelower birth ratesand dependencyratio mayeasethe burden
of maternaal ndchildhealthexpenditures' .
. Therisingnumbersof youngworkersmaybemorewilling to take
on newoccupationsand to movewherework is available.
. Butallthisassumesthattheeconomyisableto generateproductive
work for the risingnumbersin the working agegroup. '
Thelinks betweenthe demographicdividendand growth havebeen
examinedby researcherbsy lookingat the experienceof developing
countries.Themainexamplegiven in supportis the accelerationof
growth in Eastand SouthEastAsia and the main counterexample
is the absenceof any such correlationin Latin Americawhen it
went through a period of rising proportionof personsof working
age.ii A recentstudyby KSJamesiii(whichalsosummarizesvarious
internationalstudies) looked at the argument by examiningthe
.experienceof the Statesin Indiaandconcludesthat empiricalanalysis
shows "the positiveimpact of the working age group population
DemographDicividendor Debt?

2.3 Page 13

▲back to top


boom on economicgrowth... despitethe fact that the educational
achievementsand health conditions of the people are far from
adequateandemploymenct reationis belowthe requiredleveL"
Thisargumennt ow hasbeengivenwide currencyin Indiaand is
offeredaspartof anexplanatiofnor whythecurrentphaseof high
growthwill continuefor a few decades.Mypurposeis to explore
this argumenat nd seewhetherthe expectedchangesin India's
populationsizeandstructurewill createa supplysidepotentiaal nd
thepolicymeasurersequiredfor realizingthis.
The DemographicDividendin India
An assessmenotf the prospectfsor a demographidcividendhas
to workwith someprojectionosf populationovera relativelylong
periodof time.A varietyof suchprojectionasreavailableandthree
of themiVaresummarizebdelow:
Table1
AlternatePopulationProjectionsfor India2001-2051
Inmillions
Sources:
1. PopulationProjectionfsor IndiaandStatesR, egistrar-Geneoraf Ilndia,NewDelhi,May
2006
2. TheFuturePopulationof India:A long-range DemographicView, PopulationFoundation
of India,New Delhi,August 2007, ScenarioB
3. World Population Prospects:The 2006 Revision and The 2008 Revision, Population
Division,DESA,United Nations.(AccessedMarch 19,2009 at http://esa.un.org)
DemogDraivpidhoeircDnedb.t?

2.4 Page 14

▲back to top


Theprojectiondso notdifferverymuchupto 2030/01asthemajor
factorsdetermininpgopulationgrowthinthistimeframef,orinstance
the numberof womenin the reproductivaegegroup,is subjecto
only smalldifferences.Forthe longerterm the two projections
reportedheredo differbecauseof thedifferentassumptionasbout
fertility.Butthedifferencedsonotaltertheassessmeonfttheimpact
of the demographidcividendverygreatly. All threeprojections
areusedin this paperd, ependingon the pointwhichneedsto be
substantiated.
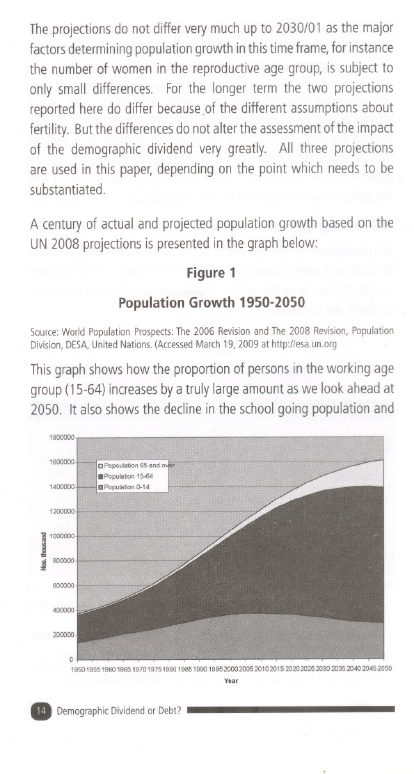
A centuryof actualandprojectedpopulationgrowthbasedon the
UN2008projectioniss presenteidnthegraphbelow:
Figure1
PopulationGrowth1950-2050
Source:World Population Prospects:The 2006 Revisionand The 2008 Revision,Population
Division,DESA,United Nations.(AccessedMarch 19, 2009 at http://esa.un.org
Thisgraphshowshow the proportionof personsin the working age
group(15-64)increasesbya truly largeamountaswe look aheadat
2050. It alsoshowsthe declinein the schoolgoing populationand
1800000
1200000
)1000000
i 600000
600000
400000
200000
.
0
195019551960 19651970 19751980 19851990 199520002005 20102015 202020252030 20352040 20452050
Year
DemographDicividendor Debt?

2.5 Page 15

▲back to top


the risein the numberof persons65 andaboveaswe getto mid
centuryA. llofthesearedimensionthsathavesignificanitmplications
for growthprospects.
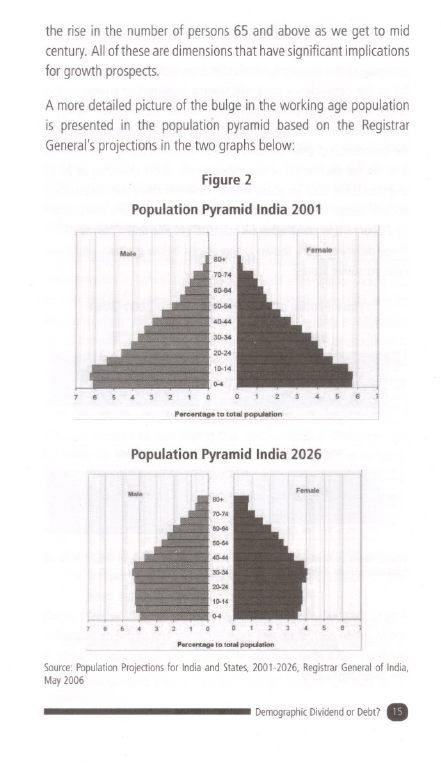
A moredetailedpictureof thebulgeintheworkingagepopulation
is presentedin the populationpyramidbasedon the Registrar
General'psrojectionisnthetwo graphsbelow:
Figure2
PopulationPyramidIndia 2001
-
-80+
F."""
70-74
60-64
50-54
4D-44
30-34
20-24
10-14
D-4
76 54 3 2 10
0
45 8
P8r!.nt~"IOI,,!~ ~n~~.
Population Pyramid India 2026
-
-80+
F-
71).74
6G-M
-50-64
»34
20-24
10-14
0-4
7 6 54 3 2 10
01 23458~
Percont- to 1010p1opWltlon
Source:Population Projedions for India and States.2001-2026. RegistrarGeneral of India,
May 2006
DemogDraivpidhoeircDnedb.t?

2.6 Page 16

▲back to top


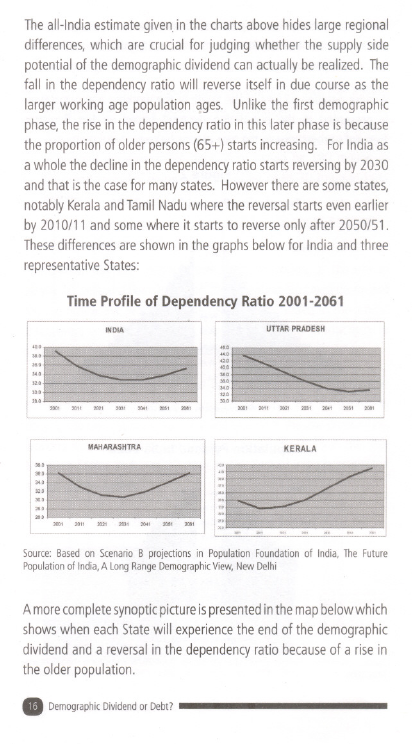
Theall-Indiaestimategivenin the chartsabovehideslargeregional
differences,which are crucialfor judging whether the supplyside
potentialof the demographicdividendcan actuallybe realized.The
fall in the dependencyratio will reverseitself in due courseas the
largerworking age populationages. Unlikethe first demographic
phase,the risein the dependencyratio in this later phaseis because
the proportionof olderpersons(65+) startsincreasing. ForIndiaas
a wholethe declinein the dependencyratio startsreversingby 2030
andthat isthe casefor manystates. Howevertherearesomestates,
notablyKeralaandTamilNaduwherethe reversasl tartsevenearlier
by 2010/11and somewhere it startsto reverseonly after 2050/51.
Thesedifferencesareshownin the graphsbelowfor Indiaand three
representativeStates:
TimeProfileof DependencyRatio2001-2061
INDIA
40.0
".0
"0
"0
32.0
30.0
2"
UTTARPRADESH
.".,0.,
42'
".0..0
360
".0
32.'
3D.'
MAHARASHTRA
".0
"0
".0
32'
30'
28'
26.0
Source:Basedon ScenarioB projectionsin PopulationFoundationof India,TheFuture
Populatioonf IndiaA, LongRangeDemographViciew,NewDelhi
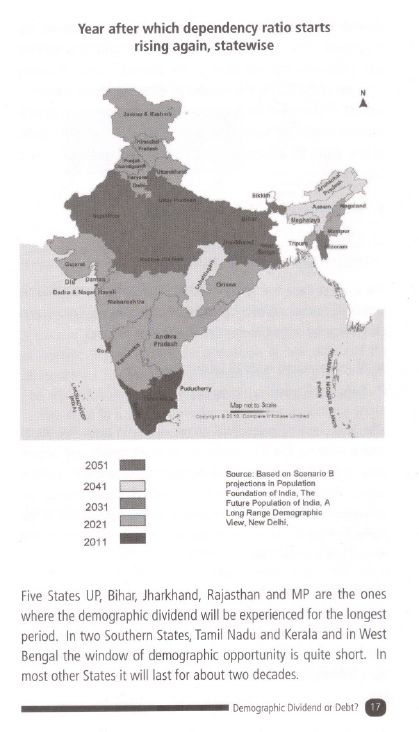
A morecompletesynopticpictureispresentedinthe mapbelowwhich
showswhen eachStatewill experiencethe end of the demographic
.dividendanda reversalin the dependencyratio becauseof a risein
the older population.
DemographDicividendor Debt?

2.7 Page 17

▲back to top


Yearafter whichdependencyratio starts
risingagain,statewise
INt.
-2051
2041
-2031
2021
-2011
Source: Based on Scenario B
projections in Population
Foundation of India, The
Future Population of India, A
Long Range Demographic
View, New Delhi,
FiveStates UP, Bihar, Jharkhand, Rajasthan and MP are the ones
where the demographic dividend will be experienced for the longest
period. In two Southern States, TamilNadu and Keralaand in West
Bengal the window of demographic opportunity is quite short. In
most other States it will last for about two decades.
DemogDriavpidoheDricnedb. t?

2.8 Page 18

▲back to top


Anotherway of lookingat this regionaldifferenceis to assessthe
magnitudeof the dividend,as measuredby the growth in working
age population that will arise in the different States. Focusing
attentiononthefive NorthernStatesU, P,Bihar,JharkhandR, ajasthan
and Mp,their sharein the growth in working agepopulationandthe
youngerpart of the work force would be as follows on the basis
of the statewide projectionsof the PopulationFoundationin its
ScenarioB
. Sharein growthin 15-64AgePopulation:
2011to2031:
56.7%
2031 to 2051:
91.6%
Theshareof thesefive Statesin the youngerpart of the work force,
accordingto the projectionspresentedbythe NationalCommission
on Enterprisesin the UnorganisedSectorVis asfollows
. Sharein growth in 15-29 LabourForce:
2006-07to 2016-17: 76.3%
Thedemographidcividendwill accruemainlyin thesefive States
and translatingthis into resultsin termsof growthwill require
policiesthatchangeradicalltyheprospectfsordevelopmenint these
States.Argumenttshat defendhighgrowthon the groundsof the
demographidcividendmustbejudgedby their plausibilityin the
contextof the economiconditionsandgovernancesystemtshat
prevaiiln thesefiveStates.
Thefocuson the demographidcividendmaydivertattention.from
the fact that the taskof containingpopulationgrowthis not yet
over,particularlyin thefive NorthernStateswherethe bulkof the
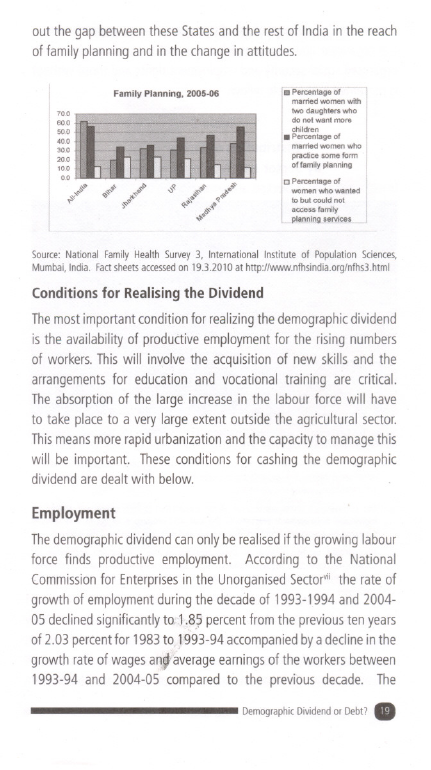
.demographidcividendwill accrue.Thechartbelowpresentsome
datafromthe2004-05NationaFlamilHy ealthSurvewyhichbrings
DemographDicividendor Debt?

2.9 Page 19

▲back to top


out the gap betweentheseStatesand the rest of India in the reach
of family planningand in the changein attitudes.
70.0
60.0
50.0
40.0
30.0
20.0
100
0.0
~"
~~<'
Family Planning, 2005.06
,}
5>b
~l' "f,',,~.."
","- ;s-"" ii'
-iP,,- ,,-1'
~ i§'~"
~"
.p,j,;;entageO.f...
married women with
two daughters who
do not want more
children
. Percentage of
married women who
practice some form
of family planning
0 Percentage of
women who wanted
.~:~~~~:L j
Source: National Family Health Survey 3, International Institute of Population Sciences,
Mumbai, India. Factsheetsaccessedon 19.3.2010 at hnp:/Iwww.nfhsindia.org/nfhs3.html
Conditionsfor Realisingthe Dividend
Themostimportantconditionfor realizingthe demographicdividend
is the availabilityof productiveemploymentfor the rising numbers
of workers.Thiswill involve the acquisitionof new skills and the
arrangementsfor education and vocational training are critical.
The absorptionof the large increasein the labour force will have
to take placeto a very large extent outsidethe agriculturalsector.
Thismeansmorerapidurbanizationandthe capacityto managethis
will be important. Theseconditionsfor cashingthe demographic
dividendaredealtwith below.
Employment
Thedemographdicividendcanonlyberealisedif thegrowinglabour
forcefinds productiveemployment.Accordingto the National
Commissiofnor Enterpriseins the UnorganiseSdectorvtihi e rateof
growthof employmendturingthedecadeof 1993-1994and2004-
05declinedsignificantltyo 1.8.?percenftromtheprevioutsenyears
of 2.03percenftor 1983to 1993-94accompaniebdyadeclineinthe
growthrateofwagesan/averageearningsof theworkersbetween
1993-94and 2004-05comparedto the previousdecade. The
DemogDraivpidhoeicrDnedb.t?

2.10 Page 20

▲back to top


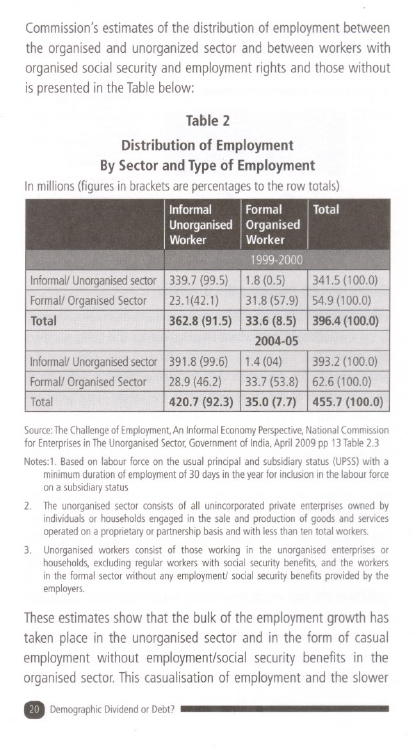
Commission'sestimatesof the distributionof employmentbetween
the organisedand unorganizedsector and betweenworkers with
organisedsocialsecurityand employmentrightsand thosewithout
is presentedin theTablebelow:
Table2
Distributionof Employment
BySectorandTypeof Employment
Inmillion(sfigureisnbrackeatsrepercentagteostherowtotals)
Informal
Formal Total
Unorganised Organised
Worker
Worker
InformalU/ norganisesdector 339.7 (99.5) 1.8(0.5) 341.5 (100.0)
Formal/OrganisedSector 23.1(42.1) 31.8(57.9) 54.9 (100.0)
,8J~1..5) 33.6 (8.5) 39604(100.0)
2004-05
1.4(04) 393.2(100.0)
33.7(53.8) 62.6(100.0)
455..7(100.0)
SourceT: heChallengeof EmploymentA, n InformalEconomyPerspectiveN, ational Commission
for Enterprisesin The UnorganisedSector,Governmentof India,April 2009 pp 13 Table2.3
Notes:1. Basedon labour force on the usual principal and subsidiarystatus (UPSS)with a
minimum duration of employmentof 30 daysin the year for inclusionin the labour force
on a subsidiarystatus
2. The unorganised sector consists of all unincorporated private enterprises owned by
individuals or householdsengaged in the sale and production of goods and services
operatedon a proprietaryor partnershipbasisand with lessthan ten total workers.
3. Unorganised workers consist of those working in the unorganised enterprises or
households,excluding regular workers with social security benefits, and the workers
in the formal sector without any employment! social security benefits provided by the
employers.
Theseestimatesshow that the bulk of the employmentgrowth has
taken place in the unorganisedsector and in the form of casual
.employmentwithout employment/socialsecurity benefits in the
organisedsector.Thiscasualisationof employmentand the slower
DemographDicividendor Debt?

3 Pages 21-30

▲back to top


3.1 Page 21

▲back to top


growth in wagesis explicableonceone recognisesthat the growth
in the labour force is running currentlyat around 2% plus. Part
of the explanationmust also lie in the way labour laws work to
discourageformalemploymentcontracts.
It is possiblethatthegrowthin employmenmt ayhavebeenhigher
in recentyearswhenthe growthrate accelerateadnd anecdotal
evidencewould seemto suggestthat labour shortagesare
beingexperienceidn places.Whetherthis reflectshigheroverall
employmengtrowthor deficiencieisn the educationand training
systemisa mootquestion.
A greatdealof the casuael mploymenint cludesmakework type
arrangemenitns farmsandsmallhouseholdenterprisesA. dditions
to thisdisguisedunemploymecnat nnotconstitutea contributionto
thedemographdicividendandwhatisneededisqualityemployment
whichprovidesgenuinefull timeworkandwherethe productivitiys
sufficientto payalivingwageT. hescaleoftheemploymencthallenge
canonlybeassessebdyaddingto thegrowthinthelabourforcet,he
'surpluslabourt'hat needsto beabsorbedinproductivework.
A roughattemptat quantifyingthis'surpluslabour'challengecan
be madeon the basisof the estimatespreparedby the National
Commissioonn Enterpriseins the UnorganiseSdectoron the basis
the2004-05NSsvaiini disgiveninthecalculationpresentebdelow:
. Theworkforceisof theorderof 455million.ix
. Non-agriculturaelmploymenwt asof the orderof 200 million,
140 millionin the unorganisesdectorand 60 millionin the
organisedsectori,n roundnumbers!
. Somepart of the reportedemploymenitn unorganisednon
agriculturael nterprisesp,articularlyin householdindustryis
reallydisguisedunemploymenAt.round15%of theworkersin
the unorganisendonagriculturasl ector,roughly20 millionin
DemogDriavpidoheDricnedb. t?

3.2 Page 22

▲back to top


absolutenumbear reunpaidfamilyworkers.Forthepurposeosf
thisillustrativcealculatiofnull-timeworkwithadequatearnings
outsideagricultureisassumetdo be180millionin 2005.
. In 2005:thetotal croppedareain agriculturewas190 million
hectarews ithavalueaddedof: Rs5.5trillionx;
. Assuminfgull-timeemploymenotn: epersonperhectarefulltime
equivalenet mploymenint agriculturewouldbe 190millionin
2005with impliedearningsof theorderof Rs30 thousandper
worker
. Thisyieldssurplusor low productivitylabourin 2005of 85 million
in the work force:455 million.
Theannualadditionsto the labourforce are running at the rate of
nearly10 milliona year.Realisingthe demographicdividendmeans
finding productivework for thesenew workersaddedto the labour
force everyyear plus absorbingthe backlogof low productivityor
surplusworkersoverthe nextdecadeor two.
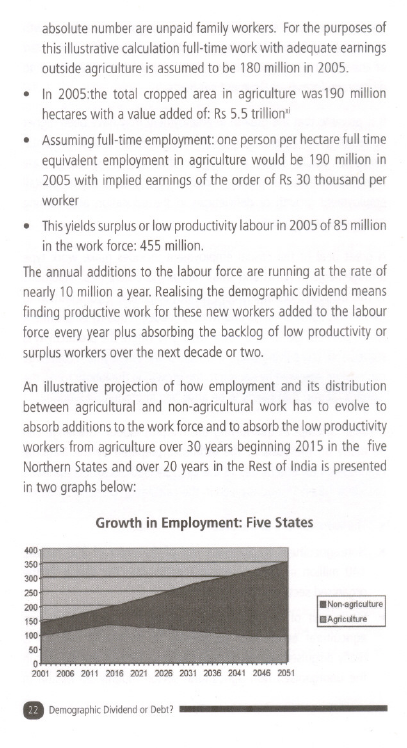
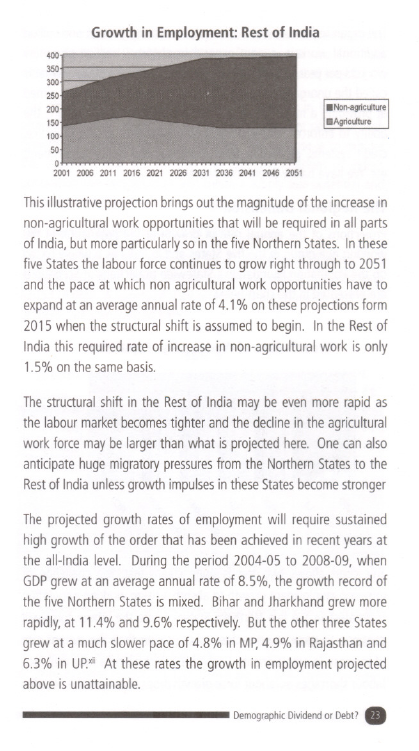
An illustrativeprojectionof howemploymenatnd its distribution
betweenagriculturaal nd non-agriculturawlork hasto evolveto
absorbadditionsto theworkforceandto absorbthelowproductivity
workersfromagricultureover30 yearsbeginning2015in the five
NorthernStatesandover20yearsin the Restof Indiais presented
intwo graphsbelow:
Growthin EmploymentF:iveStates
400
350
300
250
200
150
100
.50
0
2001 2006 2011 2016 2021 2026 2031 2036 2041 2046 2051
DemographDicividendor Debt?

3.3 Page 23

▲back to top


Growthin EmploymentR: estof India
400
350
300
250
200
150
100
50
0
2001 2006 2011 2016 2021 2026 2031 2036 2041 2046 2051
Thisillustrativeprojectionbringsoutthemagnitudoef theincreasein
non-agriculturwalorkopportunitietshatwill berequiredin all parts
of India,butmoreparticularlsyointhefiveNorthernStates.Inthese
fiveStatesthelabourforcecontinuetso growrightthroughto 2051
andthe paceat whichnonagriculturawl orkopportunitiehsaveto
expandatanaverageannuarlateof4.1% ontheseprojectionfsorm
2015whenthestructuraslhiftis assumetdo begin. Inthe Restof
Indiathis requiredrateof increasein non-agriculturwalork is only
1.5%onthesamebasis.
Thestructuralshift in the Restof India may be evenmore rapid as
the labourmarketbecomestighter andthe declinein the agricultural
work forcemaybe largerthan what is projectedhere. Onecan also
anticipatehugemigratorypressuresfrom the NorthernStatesto the
Restof Indiaunlessgrowthimpulsesin theseStatesbecomestronger
Theprojectedgrowthratesof employmenwt ill requiresustained
highgrowthof theorderthat hasbeenachievedin recenyt earsat
the all-Indialevel. Duringthe period2004-05to 2008-09,when
GDPgrewat anaverageannualrateof 8.5%,thegrowthrecordof
thefiveNorthernStatesis mixed.BiharandJharkhangdrewmore
rapidlya, t 11.4%and9.6%respectivelyB.uttheotherthreeStates
grewat a muchslowerpaceof 4.8%in MP4, .9%in Rajasthaannd
6.3% in UP!iiAt theseratesthe growthin employmenptrojected
aboveisunattainable.
DemogDriavpidoheDricnedb. t?

3.4 Page 24

▲back to top


Theorganisedsector,whichcurrentlyabsorbsonlyaboutone million
additional workers,cannot expandto absorb 9 million plus new
workersperyearandthe bulkof the growthwill takeplacein what is
calledthe unorganizedsector.Thiswill requirea majoreffort aimed
at providinga morefirm legalbasisfor land rightsand tenure,the
ability to enforcecontractsand securepayments,accessto justice,
credit systems,protectionfrom municipaland police harassment,
etc.We havebarelybegunthis process.
The RegionalDimension
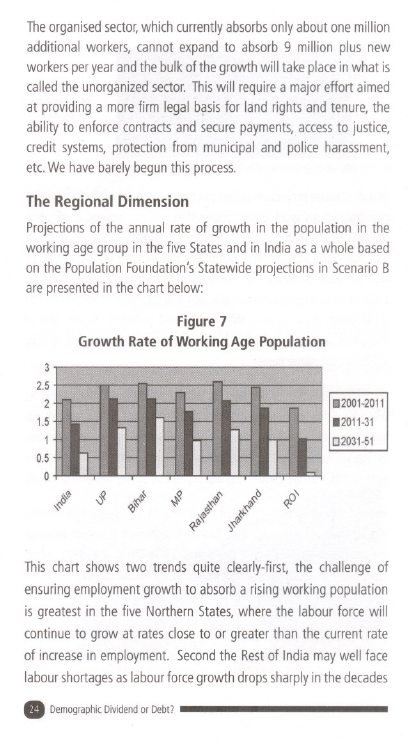
Projectionosf the annualrateof growthin the populationin the
workingagegroupin thefiveStatesandin Indiaasa wholebased
onthe PopulatioFnoundationS'statewideprojectionisn ScenarioB
arepresenteidn the chartbelow:
Figure7
GrowthRateof WorkingAge Population
3
2.5
2
1.5
1
0.5
0
,~&~
\\:J«
rb
«J~'
.# ~f :f~
.~!f ~~
~0'
Q;-~~ 'f~
Thischartshowstwo trendsquite clearly-first,he challengeof
ensuringemploymengtrowthto absorba risingworkingpopulation
is greatesitn thefive NorthernStatesw, herethe labourforcewill
continueto growat ratescloseto or greaterthanthe currentrate
.of increaseinemploymentS. econdtheRestof Indiamaywellface
labourshortageasslabourforcegrowthdropssharplyinthedecades
DemographDicividendor Debt?

3.5 Page 25

▲back to top


aheadto a nearzerolevelbeyond2031andthe scaleof labour
migrationfromtheNorthernStatesto otherpartsof Indiamaywell
haveto increaseT.hisis simplya furtherelaborationof the point
madeearlierthat the demographidcividendwill accruemainlyin
theseNorthernStatesandthatiswhereit will haveto berealised.
Theshareof thefive Northernstates,Up,Bihar,JharkhandR, ajasthan
and MadhyaPradeshin the increasein the 15-64age groupwill be
about 56% in the nexttwo decadesand 91%.in the decadesafter.
Onecouldalsoarguethat theyprobablyhavea higherthan national
averagesharein the currentbacklogof surpluslabour,the 85 million
in zeroor low productivitywork that was indicatedearlier.Theyalso
havea higherthan averageproportionof peoplein poverty.Realising
the demographicdividendwill requirethat up to two-thirdsor so of
the new qualityemploymentwill haveto be generatedin thesefour
states. Eitherthat or scaleof inter-regionalmigrationwill run into
levelsthat maybe impossiblepoliticallyand socially.
Theimpetusfor growthinthe Northcancomefromthe risingdemand
for goods and serviceswithin the country providedtransport and
communicationinvestmentsaredirectedat connectingtheseregions
to the booming South and West. Either these Statesare better
connectedwith the partsof the countrywhere growth impulsesare
strongeror largescalemigrationfromtheseStatesto otherpartswill
haveto take place.
Thekeyliesin markeltogisticst-ransportb,ankingt,radingchannels,
informationA. transporpt olicyaimedat strengthenincgonnectivity
of thehighpopulationgrowthareasto othersr,educingmovement
barriersm, ovemenatndtransactioncostscanplayamajorrole.Our
poorlyimplementehdighwayprogrammeth, e lackof an effective
DemogDriavpidoheDricnedb. t?

3.6 Page 26

▲back to top


payments system for SMEs,informational barriers, the lack of
trust and confidencebetween buyersin the South and West and
suppliersinthe Northstandin thewayof the transmissionof growth
impulsesT. heseneedto be correctedif the demographicdividendis
to be realised.Thereare other deficiencieslike poor power supply,
inefficientadministrationand the lack of law and orderwhich also
needto be corrected.
Inter-regionaml igrationwill take place. Migration,urbanisation
andoccupationaslhiftstakepeopleawayfromtraditionasl upport
structures.Sociallydiverseurbanareaswill requirea tolerance.
Willregionaal ndsectarianpoliticspreventhis? Orwill a booming
economyhelp to foster a cultureof toleranceand respectfor
diversity?
Socialsecuritysystemswill alsobe required.Long-distancemigrants
cannot resort to the expedient of returning to their village to
cope with the ups and downs of businesscycles. Someform of
unemploymentinsurancewill be required.A growingpopulationof
olderpersonss, eparatedfrom childrenwho mayhavemovedto new
opportunitiesin a boomingeconomyw, ill needpensionsand other
support. Sustaininglabourmobilitywill requirethe establishmentof
a systemof socialsecurityfor whichwe areill preparedasof now.
Educationand Training
Theprojectednumbersim, plya labourforcedistributionbetween
agricultureandnon-agricultutrheatwillshiftfromthepresen6t 0:40
splitto roughlya 20:80split.Thatis thescaleof the occupational
mobilityrequired.Thissortof occupationaslhiftrequiresa labour
.forcewhichhasundergonseomedegreeof vocationatlraining.The
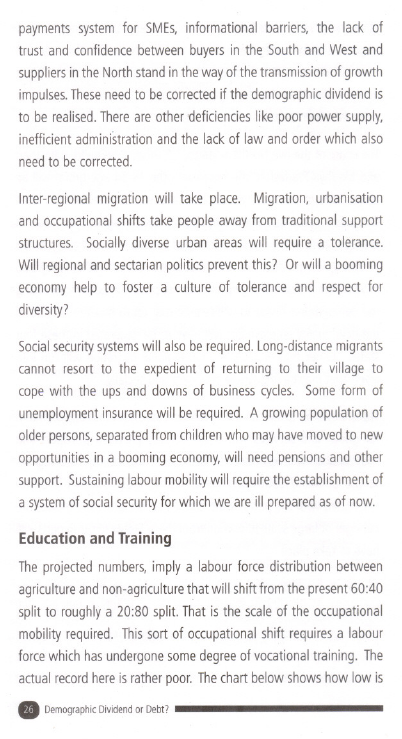
actualrecordhereis ratherpoor.Thechartbelowshowshowlow is
DemographDicividendor Debt?

3.7 Page 27

▲back to top


the proportionof evenyoungworkerswith formallyacquiredor even
informallyacquiredskills:
Figure8
Percentageof Populationwith SkillsinAgeGroup15-29,
by Residence2,004-05
10
~
0"~..8
'"0 6
.cg""2.;>24
0
Ruml
IIIFormal Skill
Urban
. Informal Skill
Source:Basedon unit leveldata of NSS61st Round2004 - 2005, Employment-Unemployment
Surveyreported in National Commissionfor Enterprisesin the Unorganised Sector(NCEUS),
(2009), Skill Formationand EmploymentAssurancein the UnorganisedSector,Governmentof
India, New Delhi,pg 17 Fig 3.5
Internationaclomparisionwsith otherdevelopingcountriesshow
how largea gaphasto be coveredif we areto benefitfromthe
demographdicividend.Inthelateninetiesthepercentagoef young
workers(20-24yearsold) who had receivedformaltrainingwas
22.4%in Botswana2,8.1% in Colombia3,6.1% in Mauritiusand
27.6%in MexicoE. venthe urbanfiguresfor Indiaarewell below
thisleveLx;;;
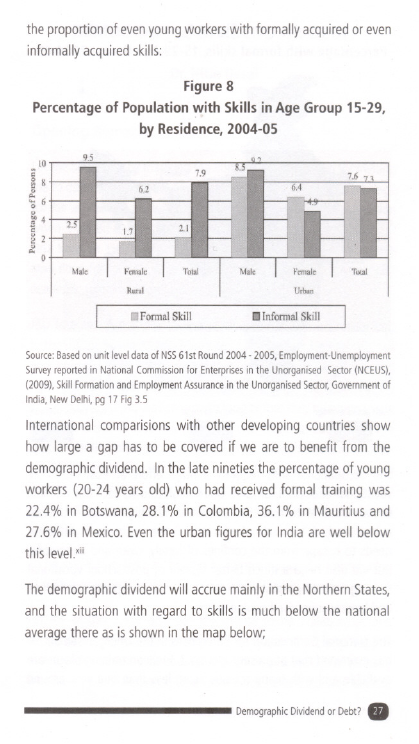
Thedemographicdividendwill accruemainlyin the NorthernStates,
and the situation with regardto skills is much below the national
averagethereas is shownin the mapbelow;
DemogDraivpidhoeircDnedb.t?

3.8 Page 28

▲back to top


Figure9
Percentagewith formalskills,15-29AgeGroup,2004-05
.N\\
-Well aboveaverage
Around average
-Well below average
Theoccupationaslhift requiresa hugeeffort at post-secondary
vocationael ducationa,n areaquiteneglectedsofar. Butthis will
notworkunlessthequalityofelementarayndhighschooel ducation
is improvedA. highschooel ducationis the minimuma youngster
needsto escapefromthe confinesof family,casteandgeography.
Butwe.alsoneeda muchbettersystemof post-schoovlocational
trainingthanthepresenctombinatioonf poorlyrunpublicinstitutions
andlooselysupervisepdrivateshops.
TheNationalCommissionfor Enterprisesin the UnorganisedSector
.hasestimatedthat at presentaround2.5 milliontraining placesare
availableand with manycoursesbeing lessthan one year around
DemographDicividendor Debt?

3.9 Page 29

▲back to top


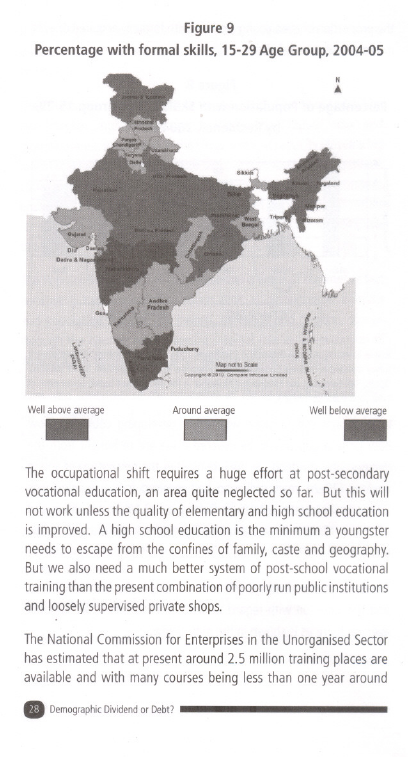
5 million peoplecan be trained per year.In orderto provideformal
skill trainingto half the labourforce,the goal recommendedby the
Commissionc,onsiderableexpansionof training would be required.
TheCommissionestimatedthat duringthe EleventhPlan,the annual
trainingcapacitywould needto go up to 12.5million(upfrom about
5 millioncurrently)A. furtherincreaseto 18millionwould be required
duringthe 12th Planandto 25 millionduringthe 13th Plan.If these
targetsareachievedt,hen bythe endof the 13thPlanabouta decade
awayaroundhalfthetotallabourforcewouldhaveformalskillsx.w
Therearehopefulsignsthat the matteris receivingseriousattention
with the constitutionof PrimeMinister'sNational Councilon Skill
Development,the National Skill DevelopmentCoordinationBoard
underthe PlanningCommissiona, ndthe NationalSkillDevelopment
CorporationunderMinistryof Finance.But onceagain it i9s worth
emphasizingthat much of this effort will have to be in the five
NorthernSateswherethe necessarypreconditionsin the form of an
effectiveschoolsystemis not yet in place.
Urbanisation
Thedemographidcividendcannotbe realizedin agricultureand
traditionalhouseholdindustry. Some200 millionpeopleor so
will haveto shift from their traditionalfamily occupationsa;n
occupationaslhiftof this orderwill implya massivechangein the
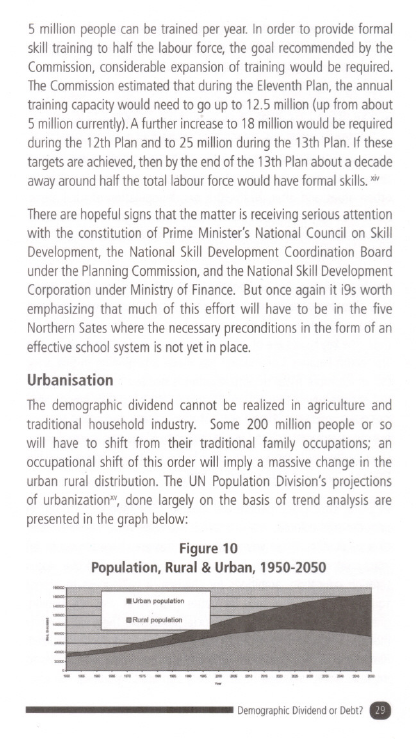
urbanruraldistributionT. heUN PopulationDivision'sprojections
of urbanizationXdVon, elargelyon the basisof trendanalysisare
presenteidn the graphbelow:
Figure10
PopulationR, ural& Urban,1950-2050
---------------------
DemogDriavpidoheDricnedb. t?

3.10 Page 30

▲back to top


Theabsolutesizeof the ruralpopulationwill start decliningby
2025-30andby2050it will be 125millionlessthannow. Urban
populationwill grow continuouslyand be 525 millionlargerin
2050.Actuallyurbanizatioins understatebdecausoef a conservative
census classification:Unpublishedcalculation by the late
ProfV. isariaxsVuiggestthat includingvillageswith populationmore
than 5000 (13376with 113millionpeople)to 1991censusurban
nos.wouldraisepercentagefrom 25.7%to 39 %. Evenon the
censusdefinitionpracticallayllof thepopulationincreasewill bein
urbanareasandafter,2025-30a netdepopulationof ruralareas.
Numberismplyverysubstantiarul ralto urbanmigrationT.hepaceof
urbanizatiomn aybeevenmorerapidif theestimateosfoccupational
shiftarecorrect.
Thefocusof planningand politicsmustshift from ruralto an urban
bias. Thedemographicdividendwill bewon or lost in our citiesand
towns,particularlyin North India,and we are quite unpreparedfor
that. Thekeyissuesareof urbangovernanceand urbanfinance.The
ThirteenthFinanceCommissionhas madea beginningin this area;
but muchmorefiscaldecentralisationis neededto allow this third
tier of governanceto functioneffectively.We needfully empowered
city governmentsin chargenot just of municipaland socialservices
but alsotransportandlandusein the urbanfringeand law andorder.
Directlyelectedmayorscould providethe political entrepreneurship
that our citiesand towns needso badly.
In place after place people are makingtheir own cities,often in
unauthorizedcolonieslike Dharavin Mumbai,while plannerscater
to a smallelite. Theseyoungurbancentresare characterizedby an
immigrantmentalitywith high savings,a desireto improvestatus
through education,ambitionsfor children,a willingnessto accept
squalor as even that may be better than what was left behind,
ghettoisationfor reassurancaendsocialprotection.Therewill bemany
moresuchpeoplemadecitiesasthe demographicdividendis realized.
.Plannersmust learnto work with theseentrepreneuriaml igrantsto
improvewater,drainageh, ealth,safetyand housingquality.
DemographDicividendor Debt?

4 Pages 31-40

▲back to top


4.1 Page 31

▲back to top


Therapidscaleof urbanizationasmillionsmigrateto citiesin search
of productivework will poseenvironmentacl oncernsvia the impact
of a cityon energyandwaterdemandandwastegeneration.A city's
energyrequirementsare largerthan the rural alternativebecauseof
the needfor transportoverlongerdistancesfor work and leisure,the
more enclosedhousingmodeand lifestyle.Water requirementsare
largerbecauseof the housingandsanitationmode,transmissionloss
and perhapsalsolifestyle.Thehighervolumeof wastegenerationis
mainlybecauseof lifestyledifferences.
We needto reconsidetrhe form of citiesand moveawayfrom
the modelof largepolycentritcransportintensivecitieslike Delhi.
Compacct itieswith highdensitiesreducepressureon agricultural
land,involveshortertraveldistanceasndcanbewalkingandcycling
friendly. Thereare hugesocialbenefitsfrom proximityof work,
residenceand leisure.Thegreaterlocalizationof servicesw, ork
placesandbusinesserseducesinfrastructurceost. Highandwell
distributeddensitieswill alsoallowaffordablepublictransporat nd
helpto containhighinfrastructurceosts.
Concluding Remarks
Thedemographicdividendis a supplysidepotentialin that working
peoplecan be an assetfor growth and development.But to realise
this potential the economymust grow in a mannerthat generates
productivework opportunitiesat the scalerequiredto absorbthe
growth in the work forceand the educationand vocationaltraining
systemmust provide them with the skills requiredto use these
opportunities.Thedemographicdividendalsogenerallyinvolveslarge
changesin the sectoralstructureof the economyand the rural-urban
mix.It almostcertainlywill involvelargescalemigrationfrom ruralto
urbanareasand,possiblyinter-regionaml igrationwithin the country.
Themajorchallengfeor realizingthisdemographdicividendin India
is perhapsnotsomuchtheoveralgl rowthrateoftheeconomyT. he
acceleratioonf growthin recentyearsseemsto be sustainableat
leastfor sometime,mainlybecauseof the highsavingsrateand
the corporateentrepreneuridayl namismthat hasbeenunleashed
DemogDraivpidhoeircDnedb.t?

4.2 Page 32

▲back to top


bythe liberalisatioonf the regulatorysystem.Thebigchallengeat
theall-Indialevelisnowto unleashasimilardynamisminthepublic
sectorproviderosf infrastructuraendserviceWs. eneeda 1991type
of reformin the wayin whichour publicsectoris managedand
run becauserealizingthe demographidcividendrequiresan order
of magnitudechangein educationandvocationatlraining. It also
poseshugechallengefsor urbandevelopmentB. othof theseare
areaswherewe havebarelybegunthe processof reform. Money
is beingthrownat the problemb; ut the underlyingstructuresfor
planningandaccountabilitryemainunchanged.
Thereformof publicsectormanagemenhtasto take placein a
politicalenvironmenwt herecoalitioncompulsionhsavecometo
dominatepublicpolicy. Thepoliticsof patronagehasacquired
greaterimportancaendthishasbecomeabarrierto thereformsthat
we needineducationandvocationatlrainingT. hegrowthof money
powerin politicsalsoconstrainspolicy,for instancein stopping
measuretso empowercity administrationosr in a morerational
policyonurbanlandmarkets.
This challengeof reform is even more acute in the five Northern
States,Up,Bihar,Jharkhand,Rajasthanand MadhyaPradeshwhere
the bulk of the demographicdividendwill be realisedoverthe next
decadesT. heseStateshavealsonot shownthe growth performance
that hasdriventheWestandthe Southof the countrythough there
aresomewelcomesignsof changenow. If theseStatescontinueto
lagbehindthe restof thecountrythenthedemographicdividendmay
well becomea demographictrap with a largedisaffectedpopulation
of unemployedyouthturning to differentvarietiesof extremismand
violence.That is why extendingthe growth impulsesthat haveled
to doubledigit growth in the Westand the Southto the rest of the
countrymustbecomea centralgoal of publicpolicy.
Hencea summaryprescriptionfor realizingthe demographic
dividendis-radicarlootandbranchreformof thepublicsectorand
.rapidgrowthintheNorthernStatesasa centraal imof development
policy.
DemographDicividendor Debt?

4.3 Page 33

▲back to top


; CoaleA, J andEdgarM Hoove(r1958)P: opulatioGnrowthand Economic
DevelopmenintLowIncomeCountriesA:CaseStudyof India'sProspectPs,rinceton
UniversitPy ressP, rinceton.
ii ChandrasekhCaPr,,JayatGi hoshandAnamitraRoychwdhu(2ry006)':The
DemographDicividendandYoungIndia'sEconomicFuture',Economi&c Political
WeeklyD, ecembe9r, pp 5055-64.
iii JameKsS(2008)'G: lorifyinMgalthus:CurrDenetbatoen'DemograpDhiicvidend'
in India',Economi&c PoliticaWl eekly,June21,pp63-69.
iv Thethreeprojectionasrethefollowing:
1. PopulationProjectionfsor Indiaand States,Registrar-Geneoraf lIndia,New
Delhi,May2006
2. TheFuturePopulationof India:A Long-rangDe emographViciew,Population
Foundatioonf India,NewDelhiA, ugust2007,ScenarioB
3. World PopulationProspectsT:he 2006 Revisionand The 2008 Revision,
PopulatioDn ivisionD, ESAU, nitedNations(.AccesseMd arch19,2009at http://
esa.un.org)
v TheChallengoef Employment,IAnnformaEl conomPyerspectivNea, tional
Commissiofnor Enterpriseins TheUnorganiseSdectorG, overnmenotf India,April
2009
vi NationaFlamilHy ealthSurvey3,InternationIanlstituteof PopulatioSnciences,
Mumbai,India. Factsheetsaccesseodn 19.3.2010at http://www.nfhsindia.org/
nfhs3.html
~i TheChallengoef Employment,IAnnformaEl conomPyerspectivNea, tional
Commissiofnor Enterpriseins TheUnorganiseSdectorG, overnmenotf India,April
2009
~ii ReporotnConditionosfWorkandPromotioonfLivelihooidnstheUnorganised
SectorN, ationaCl ommissiofonr EnterpriseinsTheUnorganiseSdectorG, overnment
of India,Septembe2r007
ix TheChallengoef EmploymeAntn, InformaEl conomPyerspectivNea, tional
Commissionfor Enterpriseisn The UnorganisedSectorG, overnmenot f India,
April2009Table2.3 pg 13whichis a slightmodificationof Table1.1in Report
on Conditionsof WorkandPromotionof Livelihoodisn the UnorganiseSdector,
NationalCommissiofnor Enterpriseisn TheUnorganiseSdectorG, overnmenotf
India,Septembe2r007,pg4.
x ReporotnConditionosfWorkandPromotioonf LivelihooidnstheUnorganised
SectorN, ationaCl ommissiofonr EnterpriseinsTheUnorganiseSdectorG, overnment
of India,Septembe2r007pg3 andTable1.1pg.4
DemogDraivpidhoeircDnedb.t?

4.4 Page 34

▲back to top


xi AgriculturalStatisticsat a Glance2009, MinistryofAgricultureandsCooperation,
Governmentof India
xii Basedon constant price data on State DomesticProductreported in Handbook
on Statisticson IndianEconomy2,008-09T, able5. Accesseodn the RBIwebsite
on11April2010
xiii SkillFormationandEmploymenAtssurancien the UnorganiseSdectorNational
CommissiofonrEnterpriseinstheUnorganiseSdecto(rNCEUS(2),009)G, overnment
of India,NewDelhiT, able3.9pg.37.
xvi SkillFormationandEmploymeAntssurancien the UnorganiseSdectorNational
CommissiofonrEnterpriseinstheUnorganiseSdecto(rNCEUS()2,009)G, overnment
of India,NewDelhi,pg.38.
xv PopulationDivisionof the Departmenotf Economicand SociaAl ffairsof the
UnitedNationsSecretariaWt, orldPopulationProspectsT:he2006 Revisionand
WorldUrbanizatioPnrospectTsh: e2007Revisionh,ttp://esa.un.org/unAupc.cessed
March19,2009
xvi Tim Dyson," India's DemographiTc ransitionand its Consequencefsor
DevelopmentT",hirdLecturein the GoldenJubileeSeriesI,nstituteof Economic
Growth,NewDelhi,2008,pg 11 citingPraveeVnisaria,"Urbanisationin India",
UnpublisheMd S.,lEG2, 000
.
DemographDicividendor Debt?

4.5 Page 35

▲back to top


~