Youth in Bihar and Jharkhand - A Situation Analysis

Youth in Bihar and Jharkhand - A Situation Analysis


1 Pages 1-10

▲back to top


1.1 Page 1

▲back to top


POPULATION FOUNDATION OF INDIA
B-28, Qutab Institutional Area, New Delhi- 110016
Tel.: +91-11-43894100, Fax: +91-11-43894199
Website : www.populationfoundation.in

1.2 Page 2

▲back to top


Youth in Bihar and Jharkhand
A Situational Analysis
Population Foundation of India

1.3 Page 3

▲back to top


1.4 Page 4

▲back to top


CONTENTS
Foreword
Executive Summary
9
I Introduction
12
II Socio-demographic Profile of Youth in Bihar and Jharkhand
19
2.1 Background Characteristics
2.2 Literacy and Educational Attainment
2.3 Exposure to Media
2.4 Employment
2.5 Marital Status
III Knowledge and Awareness among Youth in Bihar and Jharkhand
23
Knowledge of Family Planning Methods
Knowledge of HIV/AIDS
Comprehensive Knowledge of HIV/AIDS
IV Attitudes and Behaviours of Youth in Bihar and Jharkhand
25
4.1 Ideal Number of Children
4.2 Use of Contraception
4.3 Quality of Care
4.4 Unmet Need
4.5 Gender Roles
4.6 Fertility Performance
4.7 Initiation of Childbearing
4.8 Use of Tobacco and Alcohol
4.9 Initiation of Sexual Activity
V Nutrition and Health Status of Youth in Bihar and Jharkhand
29
5.1 Maternal Health Care
5.2 Ante-natal Care
5.3 Delivery Care
5.4 Health Problems during Pregnancy
5.5 Post-natal Care
5.6 Nutritional Status
5.7 Male Involvement
5.8 Prevalence of Anemia
5.9 Domestic Violence
References
33
Appendix : Tables for Jharkhand and Bihar
34

1.5 Page 5

▲back to top


1.6 Page 6

▲back to top


Foreword
As per the 2001 Census of India, youth (15–24 years) account for 195 million out of a total
population of 1029 million of India. Every fifth person in the country is a youth. As per the
projection made by the Registrar General, by 2011 the youth population is expected to grow to 240
million. This segment constitutes a large and vulnerable section of the country’s total population.
Their access to health services remains poor.
In order to provide better health services to the youth, availability of relevant information is
essential. Unfortunately, availability of data on youth in India is insufficient and this is a major
obstacle in the development of specifically targeted intervention strategies.
In an attempt to address this gap, Population Foundation of India undertook an exercise where-in
available data from the National Family Health Survey (NFHS) has been analysed for the youth
population (15–24 years) and desegregated by sex and place of residence. The exercise is restricted
to the two states of Bihar and Jharkhand, and for the country as a whole.
We hope this publication will address the long felt need for suitable data by policymakers, programme
managers, health administrators, health care professionals and civil society organisations working
on adolescents and young people.

1.7 Page 7

▲back to top


1.8 Page 8

▲back to top


Youth in Bihar and Jharkhand: A Situational Analysis | 7
Fact Sheet for Youth (15-24 years)
in Bihar, Jharkhand and India
Indicator
School attendance (15–17 years)
Males
Females
Media exposure (percentage regularly exposed to media)
Males
Females
Employment of youth
Males
Females
Percentage of youth ever married
Males
Females
Awareness of emergency contraceptives
Males
Females
Contraceptive prevalence rate
Unmet need for contraception
Three or more ANC visits
Use of tobacco
Males(15–24 years)
Young Males(15–19 years)
Institutional delivery
Anemia among youth
Males
Females
Youth who are abnormally thin
Males
Females
Bihar
33.6
48.4
24.0
79
47
63
22
27.3
67.1
11.4
3.4
13
31
21
48
25
23
33
67
48
50
Jharkhand
36.9
48.9
26.7
74
46
61
52
26.9
64.5
6.4
4.5
15
33
39
42
21
20
36
68
52
47
Source: National Family Health Survey, 2005-06
India
41.3
48.8
34.4
90
74
64
34
18.7
52.1
15.2
8.2
28
23
58
39
21
41
27
54
43
40

1.9 Page 9

▲back to top


1.10 Page 10

▲back to top


Youth in Bihar and Jharkhand: A Situational Analysis | 9
Ex ecut i v e S um mar y
Youth is defined as females and males in
the age group of 15–24 years. This report
provides a profile of the youth population
of Bihar and Jharkhand with a special focus
on their knowledge, attitudes and behaviour
related to reproductive health and nutrition.
Raw data available from the National Family
Health Survey III (NFHS-3), 2005–2006, for
the state of Bihar and Jharkhand has been
used. NFHS-3 covered women (15-49 years)
and men (15-54 years). The data in this report
has been reanalysed for the youth population
(15-24 years) for both sexes. The analysis is
presented separately for females and males
in the age groups of 15–19 years and 20–24
years by marital status. The findings are also
presented by place of residence, wherever
relevant. The universe of the reanalysis is based
on 2,330 youth from Jharkhand and 2,690
youth from Bihar. This study has an important
limitation that needs to be noted. The NFHS-3
questionnaire was designed to provide data on
population, health, and nutrition indicators for
females and males in all reproductive ages; it
was not designed to get information on youth
per se.
Indicators pertaining to youth such as school
attendance rate, media exposure, fertility,
awareness about family planning methods,
domestic violence, substance abuse, maternal
health care, nutritional status and anemia are
discussed in this report. Some of the key
findings related to the above indicators follow:
Among the two states, school attendance
among 15–17 year olds is higher in
Jharkhand (36.9 %) than in Bihar (33.6 %).
For both the states, the average is lower
than the national average (41.3%). There
are rural-urban differentials with respect
to school attendance rates among boys and
girls. Boys are more likely to be admitted in
schools than the girls.
A majority of young females from
Jharkhand and Bihar do not have regular
exposure to any media. Media exposure is
much higher among males than females.
Differentials among states with respect
to urbanisation, higher education, age at
marriage and the availability of work are
important factors for the large variation
in the proportion of youth employed. In
addition, socio-cultural factors are likely
to affect state-specific employment rates
for females. Over 60 per cent of the males
are employed both in Jharkhand and
Bihar, whereas only half the females are
employed in Bihar, and even less – 25 per
cent – in Jharkhand. There are substantial
differences in the employment of males
and females in these two states and in the
country as a whole.
• At the national level, one in every five
females aged 15–17 years was married,
whereas in the 15–24 years age group
slightly more than half of the females were

2 Pages 11-20

▲back to top


2.1 Page 11

▲back to top


10 | Youth in Bihar and Jharkhand: A Situational Analysis
found married. Similarly, one in every 17
(6%) males aged 15–24 years has been ever
married. More than 80 per cent of males
aged 15–24 years have never married. In
Bihar and Jharkhand, more than one fifth
of females, aged 15–17 years, were married.
The proportion of females aged 15–17
years who were married is particularly
high in Bihar (38%) and Jharkhand (36%).
More than one in ten males in the same age
group (10%) in Bihar and Jharkhand were
married.
In Bihar and Jharkhand, a sizeable
proportion of females were married but
had not started living with their male
counterparts. The same holds true for
young males in Bihar.
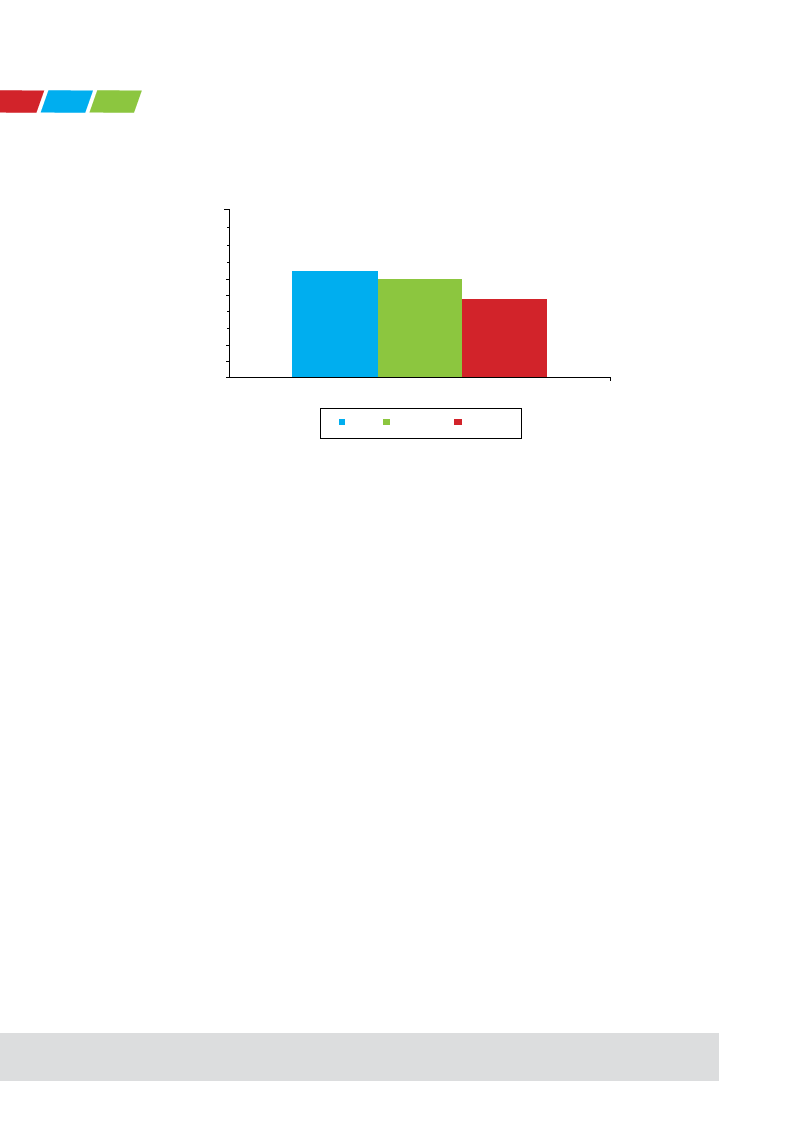
The proportion of girls married by 18 years
of age is more than 50 per cent in both the
states. The figure in both the states (Bihar
- 64% and Jharkhand – 60%) is more than
the national average (47%).
In Jharkhand, 55 per cent of young females
had not heard about IUDs. In both the
states as well as for the country as a whole,
males were less aware about the two female
spacing methods (pill and IUD) than
females. There is a gender differential with
respect to awareness about IUDs. In Bihar,
67 per cent of female youth were aware of
IUDs, whereas the corresponding figure
for male youth was only 36 per cent. In
Jharkhand however, the figures were 45.1
per cent for females and 29.5 per cent for
males. The awareness about emergency
contraception was quite low for both the
sexes in both the states.
In both Bihar and Jharkhand, more than 50
per cent of the Total Fertility Rate (TFR)
is accounted by the fertility of females
aged 15–24 years. The contribution is
relatively higher in Jharkhand than Bihar,
but it is lower than the national average.
One fourth or more adolescent girls aged
15–19 years in Jharkhand and Bihar have
already initiated childbearing. In both the
states more than 45 per cent of females
aged 15-24 years have already initiated
child bearing, which is higher than the
national average. This has a significant
impact on the Total Fertility Rate (TFR) in
both the states.
Among currently-married youth in these
two states, contraceptive prevalence
rate does not vary substantially. The
contraceptive prevalence rate for these two
states is lower than the national average.
The prevalence of spousal/sexual violence
is higher in Bihar (52 %) than Jharkhand
(37%). For both the states, the figure is
higher than the national average.
More males than females agree with at least
one reason for wife beating in Bihar and
India. For Jharkhand, the figure is slightly
higher for females. In both the states and
for the country, more ever-married females
and males agree with at least one reason for
wife beating than never-married females
and males.
There is variation in tobacco use and
consumption of alcohol. Tobacco use
among males is higher in Bihar (48%) than
Jharkhand (42%), and for both the states,
it is more than the national average (39%).
Alcohol consumption among young males
is also higher in Bihar (25%) than Jharkhand
(21%). The figure for Bihar is more than
the national average (21%).

2.2 Page 12

▲back to top


Youth in Bihar and Jharkhand: A Situational Analysis | 11
The proportion of young females who
have received three or more ante-natal
checkups varies across the two states. The
state of Bihar has the lowest percentage
(21%) in the country, while for Jharkhand
the figure is slightly better (39%). In both
the states, the figure is much below the
national average (58%).
There is some variation among the states in
the proportion of youth who are abnormally
thin. In Bihar, the proportion of females
(50%) is more than the males (48%). But for
Jharkhand and for India, the reverse is true.
For both males and females in the two states,
the figure is much higher than the national
average (males 43% and females 40%).
There is wide variation by sex with respect
to the prevalence of anemia in the two
states. While two thirds of female youth
in Bihar (67%) and Jharkhand (68%) are
anemic, one third of males are so (Bihar
- 33%, Jharkhand - 36%). The figures are
higher for both the states, than the national
average (males – 27%, females - 54%).

2.3 Page 13

▲back to top


12 | Youth in Bihar and Jharkhand: A Situational Analysis
I . Int r o d u cti on
As per the 2001 Census of India, population
aged 15–24 years accounts for 195 million
of the 1,029 million of India’s population.
In other words, every fifth person in India
belongs to the 15–24 year age group. This
population is the focus of this report and is
identified by the United Nations Population
Fund (United Nations, 2009) as youth or the
youth population. By 2011, this age group is
expected to grow to 240 million (Office of
the Registrar General, 2006) and account
for a slightly higher proportion of the total
population than in 2001.
The youth of any nation are critical for
its continued economic development and
demographic evolution. The youth population,
which typically constitutes the cohort entering
the country‘s labour force, is expected to bring
in freshly learned and updated skills that will
help renew and improve the country‘s human
capital. The youth also represent the age group
that forms the basis of demographic renewal,
as these young people begin child bearing.
With declining fertility and a large population
base, India is in a unique phase of its
demographic transition. The transition has led
to significant changes in the rate of population
growth, and also, more importantly, in its age
structure. The population growth rate, which
was over two per cent from 1971–2001,
declined to 1.6 per cent in 2007, and is expected
to fall further to less than one per cent by 2016.
The recent transition to lower fertility has led
to a reduction in the proportion of population
below age 15, and hence, to a lower dependency
burden. Of the total projected increase of 371
million in India‘s population between 2001 and
2026, 83 per cent of the increase will be in the
working age group of 15–59 years (Office of
the Registrar General, 2006). This increase in
the share of the population in working ages
represents a potential demographic dividend
for economic growth in the form of increased
productivity of the nation‘s population as a
whole.
The population projection carried out by
UNFPA (2009) shows that by 2011, in both
Bihar and Jharkhand, 22 per cent of the total
population will be youth. There is also inter-
district variation among the states with respect
to the youth population. The skills, knowledge,
attitudes, behaviours and human resource
capacity of the youth are essential factors
that influence whether, and how well, the
demographic dividend is successfully exploited
and converted into sustained increases in
productivity and economic growth.
Further, the large and increasing relative share
and absolute numbers of youth in India makes
it even more necessary that the nation ensures
that they become a vibrant, constructive force
that can address social and economic issues and
contribute to sustained and just governance
and nation building. In recognition of the
important role for youth in nation building, the
preamble of the National Youth Policy, 2003,
reiterates the commitment of the entire nation
to the composite and all-round development

2.4 Page 14

▲back to top


Youth in Bihar and Jharkhand: A Situational Analysis | 13
Table: 1
Projected youth population (15–24 years) by 2011 in Bihar and Jharkhand
State/Districts
Bihar
Persons
21.9
2011
Male
22.4
Araria
21.1
21.6
Aurangabad
22.8
22.4
Banka
21.0
21.8
Begusarai
22.9
23.4
Bhagalpur
22.5
24.1
Bhojpur
23.1
23.8
Buxar
22.4
22.8
Darbhanga
22.1
22.5
Gaya
23.2
22.7
Gopalganj
21.5
21.6
Jamui
22.6
22.8
Jehanabad
22.7
22.2
Kaimur (Bhabua)
21.3
21.5
Katihar
21.2
22.1
Khagaria
21.9
22.6
Kishanganj
21.9
22.6
Lakhisarai
22.2
22.3
Madhepura
21.1
21.0
Madhubani
21.1
21.3
Munger
23.3
24.8
Muzaffarpur
21.8
115.7
Nalanda
22.6
22.6
Nawada
22.7
22.3
Pashchim Champaran
20.8
21.4
Patna
23.8
24.6
Purba Champaran
20.8
21.4
Female
21.4
20.5
23.3
20.2
22.3
20.7
22.3
21.9
21.6
23.7
21.3
22.5
23.3
21.1
20.2
21.2
21.1
22.0
21.2
20.9
21.6
20.8
22.6
23.1
20.2
22.9
20.2

2.5 Page 15

▲back to top


14 | Youth in Bihar and Jharkhand: A Situational Analysis
State/Districts
Purnia
Rohtas
Saharsa
Samastipur
Saran
Sheikhpura
Sheohar
Sitamarhi
Siwan
Supaul
Vaishali
SouJhrcaer:kUhNaFnPdA, 2009
Bokaro
Chatra
Deoghar
Dhanbad
Dumka
Garhwa
Giridih
Godda
Gumla
Hazaribag
Kodarma
Lohardaga
Pakur
Palamu
Paschimi Singhbhum
Purbi Singhbhum
Source: UNFPA, 2009
Persons
21.2
22.6
22.0
21.7
21.6
22.4
20.3
20.6
22.1
21.4
21.6
21.8
23.6
21.2
21.7
24.5
20.6
19.7
20.7
20.1
20.2
23.1
21.3
21.0
20.6
20.9
21.5
21.9
2011
Male
21.8
22.8
21.8
22.1
22.7
22.5
20.9
21.5
22.0
21.2
22.8
22.0
24.4
20.9
22.0
25.3
20.7
19.5
20.5
20.5
19.9
23.5
21.1
20.9
20.2
21.0
21.5
21.9
Female
20.6
22.3
22.2
21.4
20.5
22.4
19.6
19.7
22.1
21.5
20.3
21.6
22.7
21.5
21.4
23.5
20.6
19.9
20.9
19.6
20.5
22.6
21.4
21.0
20.9
20.9
21.6
21.8

2.6 Page 16

▲back to top


Youth in Bihar and Jharkhand: A Situational Analysis | 15
of the young sons and daughters of India and
seeks to establish an all-India perspective to
fulfil their legitimate aspirations so that they
are all strong of heart and strong of body
and mind in successfully accomplishing the
challenging tasks of national reconstruction
and social changes that lie ahead. (National
Youth Policy, 2003).The thrust of the policy
is youth empowerment in different spheres of
national life.
In India, youth constitute 18.5 per cent of the
total population. The corresponding figures
for Bihar and Jharkhand are 16.3 and 17.3 per
cent respectively. There are rural-urban and sex
differentials with respect to the youth population
across all the states and union territories.
TABLE:2
Proportion of youth (15–24 years) by sex and place of residence in India and States, 2001
Country/States
Person
Total %
Males Females
Person
Rural %
Males Females
Urban %
Person Males Females
India
18.5
18.9
18.1
17.8
18.1
17.4
20.5
20.9
20.1
Jammu & Kashmir
20.2
20.0
20.3
19.9
19.8
20.0
21.0
20.7
21.4
Himachal Pradesh
20.0
20.1
19.8
19.8
19.8
19.7
21.7
22.5
20.7
Punjab
20.2
20.5
19.8
19.7
20.0
19.4
21.1
21.5
20.6
Chandigarh
21.9
22.8
20.7
23.9
26.2
20.3
21.7
22.4
20.7
Uttarakhand
19.7
19.9
19.6
19.2
19.1
19.3
21.3
22.1
20.5
Haryana
20.0
20.7
19.2
19.7
20.6
18.8
20.6
21.1
20.1
Delhi
20.6
21.5
19.6
20.1
21.1
18.9
20.7
21.5
19.7
Rajasthan
18.2
18.6
17.7
17.5
17.9
17.1
20.6
21.1
20.0
Uttar Pradesh
17.7
18.3
17.1
16.9
17.4
16.4
20.9
21.6
20.0
Bihar
16.3
16.7
15.9
15.9
16.3
15.6
19.5
20.4
18.4
Sikkim
22.0
21.6
22.4
21.7
21.3
22.1
24.7
24.6
24.8
Arunachal Pradesh
17.9
17.6
18.3
17.2
17.0
17.5
20.6
20.0
21.2
Nagaland
24.0
23.9
24.0
24.1
24.2
23.9
23.6
22.8
24.5
Manipur
21.3
20.9
21.7
21.4
21.1
21.8
20.9
20.5
21.2
Mizoram
21.7
21.4
22.0
20.1
20.0
20.3
23.2
22.9
23.6
Tripura
19.2
18.9
19.6
19.1
18.9
19.4
19.6
18.9
20.3
Meghalaya
19.2
18.8
19.6
18.3
18.0
18.6
23.1
22.4
23.8
Assam
18.5
18.4
18.7
18.3
18.2
18.4
19.9
19.5
20.4

2.7 Page 17

▲back to top


16 | Youth in Bihar and Jharkhand: A Situational Analysis
Country/States
Person
West Bengal
18.4
Jharkhand
17.3
Orissa
18.3
Chhattisgarh
17.3
Madhya Pradesh
18.0
Gujarat
19.8
Daman & Diu
26.9
D&N Haveli
21.3
Maharashtra
19.0
Andhra Pradesh
19.1
Karnataka
19.4
Goa
19.9
Lakshadweep
19.6
Kerala
18.8
Tamil Nadu
19.3
Puducherry
20.1
A&N Islands
21.7
Source: Census of India, 2001
Total %
Males Females
18.5
18.3
17.6
16.9
18.0
18.5
17.6
17.1
18.7
17.4
20.1
19.5
31.1
21.0
23.1
19.2
20.0
18.1
19.3
18.8
20.0
18.8
20.6
19.2
19.2
20.0
18.9
18.6
19.3
19.4
20.0
20.1
21.8
21.6
Person
18.1
16.2
17.8
16.6
17.2
19.0
30.0
20.8
17.9
18.2
18.6
20.3
19.8
18.9
18.9
20.3
21.3
Rural %
Males Females
18.2
17.9
16.4
16.0
17.5
18.2
16.8
16.4
17.8
16.6
19.1
18.9
35.2
21.3
22.5
18.9
18.8
16.9
18.6
17.8
19.3
17.8
20.8
19.8
19.5
20.2
19.1
18.7
19.0
18.8
20.4
20.2
21.2
21.4
Urban %
Person Males Females
19.1
19.0
19.1
20.9
21.5
20.3
20.8
20.9
20.7
20.3
20.6
19.9
20.4
21.1
19.6
21.1
21.7
20.5
21.3
22.0
20.6
23.0
25.0
20.3
20.7
21.5
19.7
21.5
21.4
21.6
21.2
21.5
20.8
19.5
20.3
18.7
19.3
18.9
19.7
18.4
18.5
18.3
19.9
19.6
20.1
19.9
19.8
20.1
22.5
23.0
22.0
The youth represent a period when sexual
activity typically begins and family formation
and child bearing is initiated. Too early an age
at marriage can hinder healthy and responsible
family life and parenthood. It is recommended
that marriage and family formation be initiated
after the legal age at marriage, and, preferably,
after completion of education and the
attainment of economic independence. For
females in particular, an early age at marriage
not only hinders the completion of education
and the acquisition of marketable professional
skills, but also pushes them into motherhood at
ages when their bodies are not mature enough
to safely bear children. Although, in India the
legal minimum age at marriage for girls and
boys is 18 years and 21 years respectively, a
sizeable proportion of females and males
marry at much younger ages.
Reproductive and sexual health is an important
component of the overall health of the adult
population, but is particularly cogent for
the youth population. Youth is a period of
life when heightened emotions, a sense of

2.8 Page 18

▲back to top


Youth in Bihar and Jharkhand: A Situational Analysis | 17
invulnerability, and an intensively heightened
sex drive often leads to high-risk taking and
sexual experimentation. Despite the resulting
need for information on sex, and sexual
and reproductive health, youth, particularly
unmarried youth, face many social barriers to
obtaining accurate and complete information
on these subjects. As a result, many youth enter
marriage without even a basic knowledge about
sex and reproduction, let alone the knowledge
necessary to negotiate a safe and healthy sexual
and reproductive life. While limited access to
information on sex and sexual health is often
more of a barrier for girls than for boys, even
boys lack accurate and pertinent information
on sexual health issues. As a result, many
preventable reproductive health problems,
including unwanted teenage pregnancies and
sexually transmitted diseases (STD), persist.
Some research suggests that youth account
for a high proportion of new STD infections
(Sahni, 2005). The emerging trends in new
HIV cases in India show that nearly two-fifths
of new infections are reported among people
below 25 years of age (NACO, 2004).
In addition, the life-cycle approach adopted by
the Reproductive and Child Health Programme
of the Government of India recognises that the
health status during any phase of life impinges
upon the health status in the next phase. Thus,
although the reproductive and sexual health
issues that concern females and males may
differ, good health during the adolescent years
provides the foundation for good health during
the reproductive years for both the sexes.
Ensuring reproductive and sexual health for
the youth population is particularly challenging
in India. As noted, a large proportion of
marriages are still taking place during adolescent
years, a period when the body and mind are
not mature enough for parenthood. The fact
that females and males married at a young age
are less likely to be educated and are more
likely to have had only limited exposure to any
communication media also puts young parents
at a further disadvantage. As a result, young
couples often lack even minimal information
on contraception and the need for birth spacing
with dire consequences for infant and child
health and survival, as well as the survival of
mothers. Further, ignorance or misinformation
on sex related matters can put sexually active
youth at a higher risk of sexually transmitted
infections, including HIV.
Even during late adolescence, the bodies
of boys and girls continue to mature, with
most still gaining height. Proper nutrition, in
the form of a balanced diet rich in nutrients,
including iron, is key to the health of youth.
Not only are malnourished youth unlikely to
contribute to the economic growth of the
nation, but their malnourishment can also
threaten the health of the next generation.
A large percentage of female youth in India
have either already initiated childbearing or
are only a few years away from it. Thus, the
extra nutritional demands of pregnancy and
breastfeeding are already here, or not too far
in the future, for them. Of particular concern
are the high rates of iron-deficiency anemia
among adolescent females after menarche. For
all of these reasons, the nutritional status of
youth should be of big concern.
Substance abuse is another issue of serious
concern among youth. Drug use, smoking
and irresponsible alcohol consumption are
common problems associated with the youth.
Substance abuse has many negative effects
on the health of youth as well as on their
educational attainment and productivity.

2.9 Page 19

▲back to top


18 | Youth in Bihar and Jharkhand: A Situational Analysis
Data, Methods and Limitations
This report provides a profile of the youth
population of Bihar and Jharkhand with a
special focus on their knowledge, attitudes
and behaviours related to reproductive health
and nutrition. The raw data available from the
National Family Health Survey III (NFHS-3),
2005–2006 for the state of Bihar and Jharkhand
has been used. Under NFHS-3, women (15-49
years) and men (15-54 years) were covered.
The data has been reanalysed for the youth
population (15-24 years) for both sexes. The
complete analysis is presented separately for
females and males in the age groups of 15–
19 years and 20–24 years by marital status.
The findings are also presented by place of
residence, wherever relevant in the entire
report. The universe of the reanalysis is based
on 2,330 youth from Jharkhand and 2,690
youth from Bihar.
This study has an important limitation.
The NFHS-3 questionnaire was designed
to provide data on population, health, and
nutrition indicators for females and males in
all reproductive ages; it was not designed to get
information on youth per se .

2.10 Page 20

▲back to top


Youth in Bihar and Jharkhand: A Situational Analysis | 19
i i . socio - de mo gr aphi c pr of il e
of youth in bihar and jharkhand
The health, nutrition and demographic situation
of youth varies by their own characteristics,
such as age, marital status, religion and caste, as
well as the characteristics of their households,
such as the type of family and wealth status.
In addition, education and media exposure are
important catalysts for health and demographic
change. Information about education and
employment of youth is also critical in
assessing the stock of human resources in
the population. This section provides the
demographic and socioeconomic profile of
the youth interviewed in NFHS-3 and also
explores in detail their mass media exposure,
marriage patterns and employment.
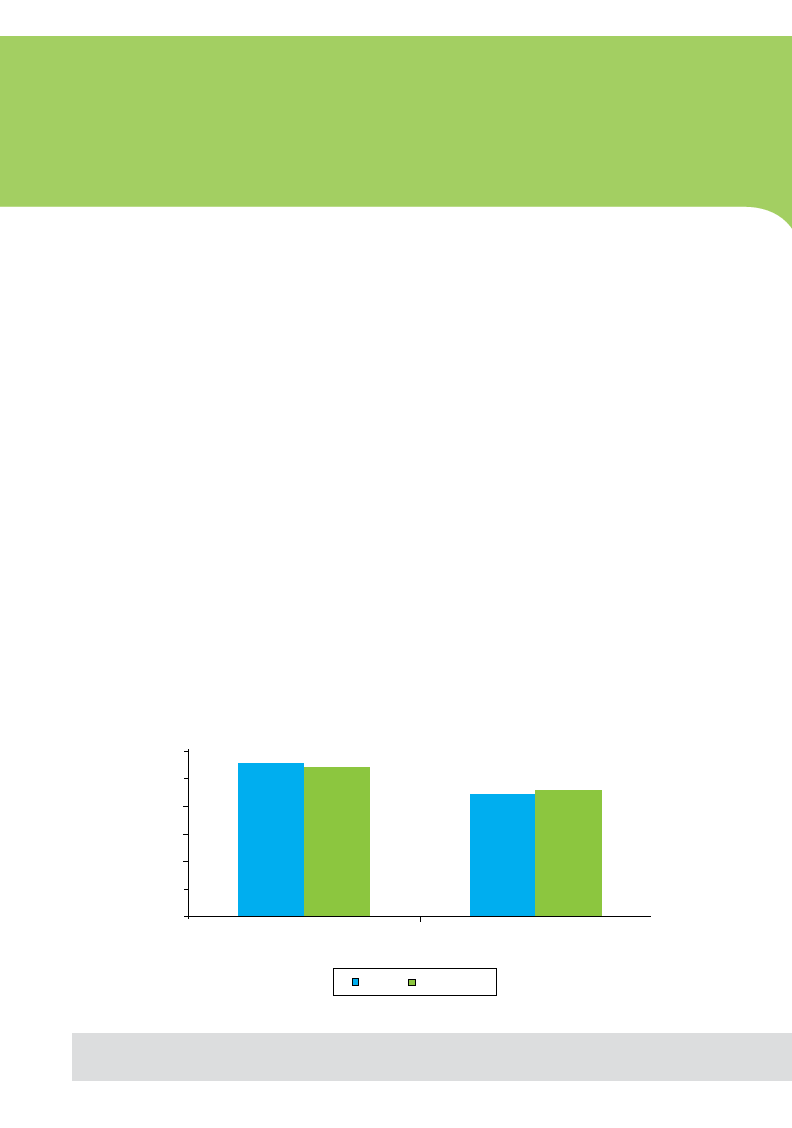
Jharkhand shows that in Jharkhand 54.5 per
cent of the total youth population belong to
the age group of 15-19 years, whereas the
remaining 45.5 per cent are between 20-24
years. The corresponding figures for Bihar are
56 per cent and 44 per cent respectively. There
exists a differential with respect to gender and
place of residence for the two states under
study. A total of 2,330 youth were covered
under the survey in Jharkhand. The gender-
wise break up shows that 1,123 were males and
1,207 were females. Similarly, a total of 2,690
youth were from the state of Bihar. Among
them 1,147 were males and 1,543 were females
(Appendix: Tables 1a & 1b).
2.1 Background Characteristics
The distribution of household population by
age, sex and place of residence in Bihar and
2.2 Literacy and Educational Attainment
Among the two states, the school attendance
rate of the youth population (15-17 years) is
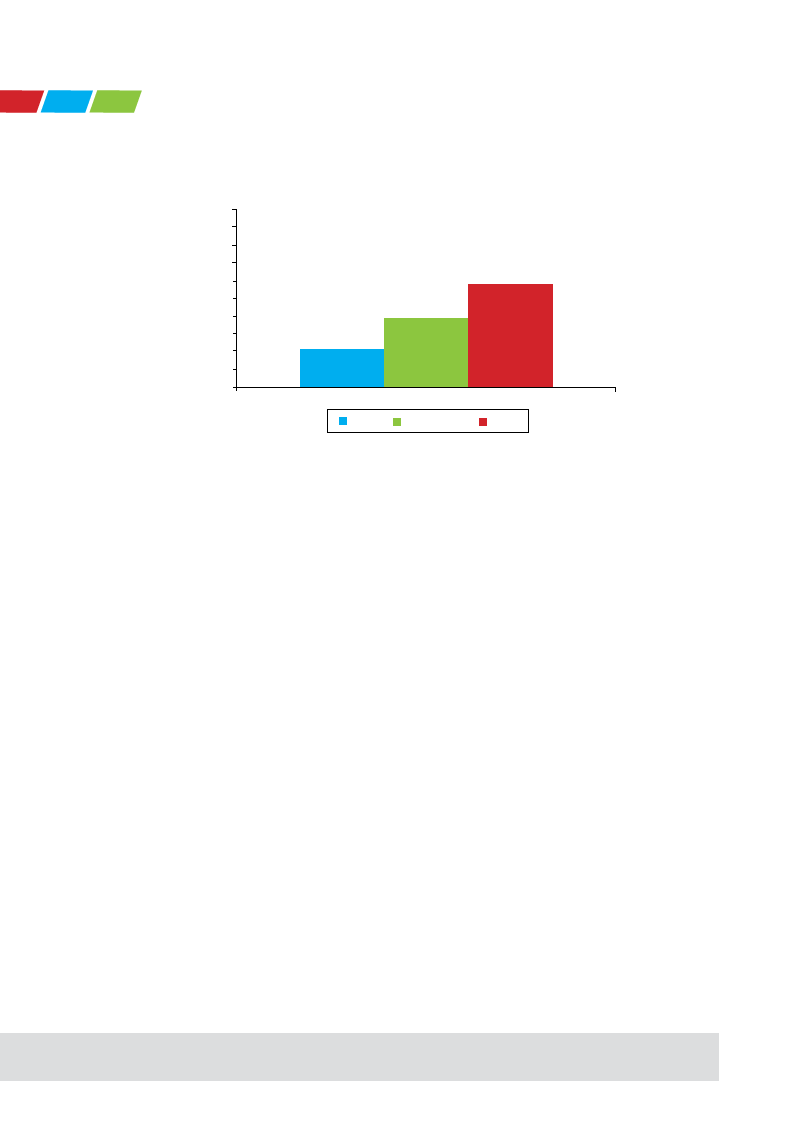
GRAPH 1:
Youth population in Bihar and Jharkhand, 2005–2006
60
55.9
54.5
50
40
30
20
10
0
15-19 years
44.1
45.5
20-24 years
Bihar Jharkhand

3 Pages 21-30

▲back to top


3.1 Page 21

▲back to top


20 | Youth in Bihar and Jharkhand: A Situational Analysis
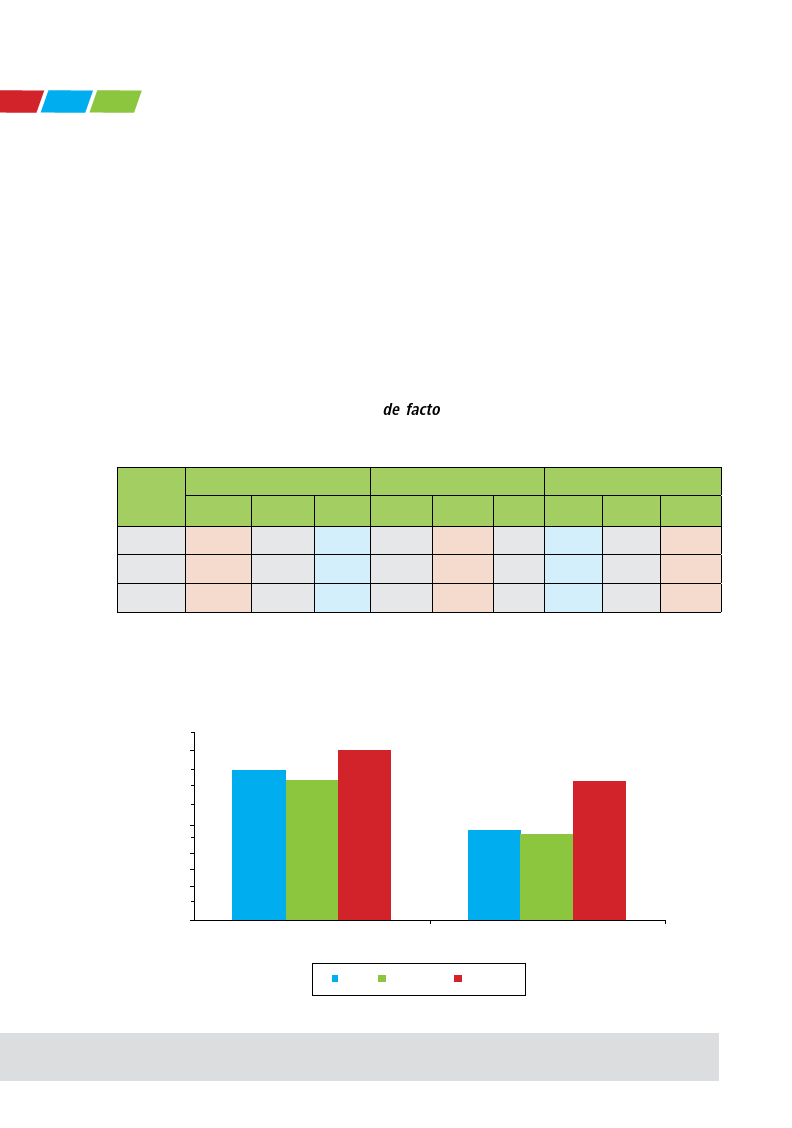
higher in Jharkhand (37%) than Bihar (34%).
The school attendance rates in both the states
are lower than the national average (41%).
There is also a differential by place of residence
and sex. For male and urban youth the school
attendance rate is higher than females and rural
youth.
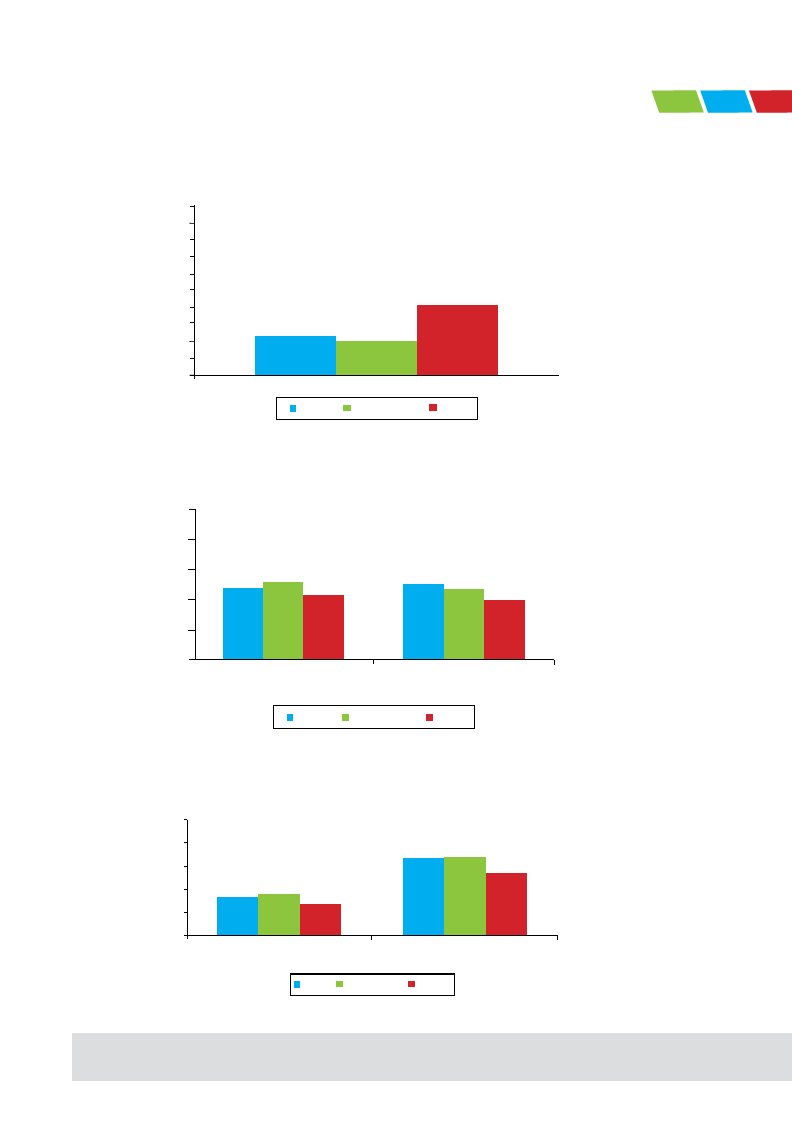
2.3 Exposure to Media
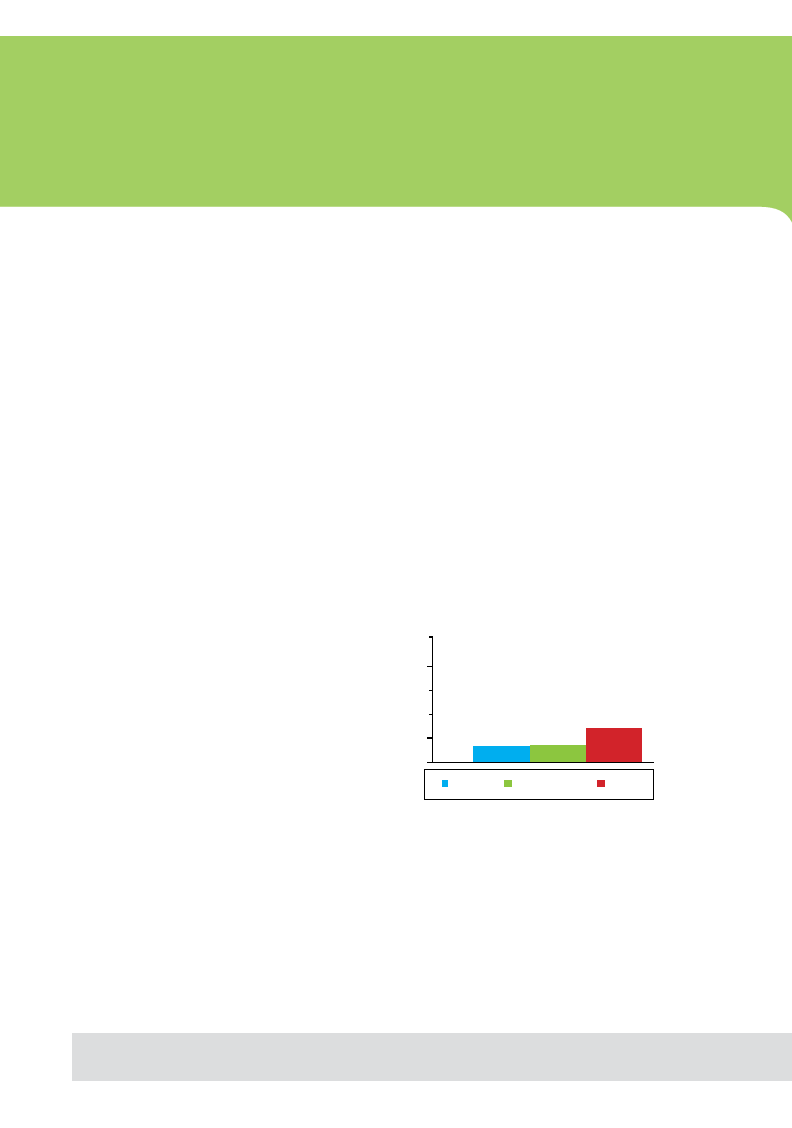
The mass media exposure among youth is
higher for Bihar than Jharkhand for both the
sexes. For both males and females, the figure
is below the national average. Males have an
advantage over females with respect to mass
media exposure for both the states.
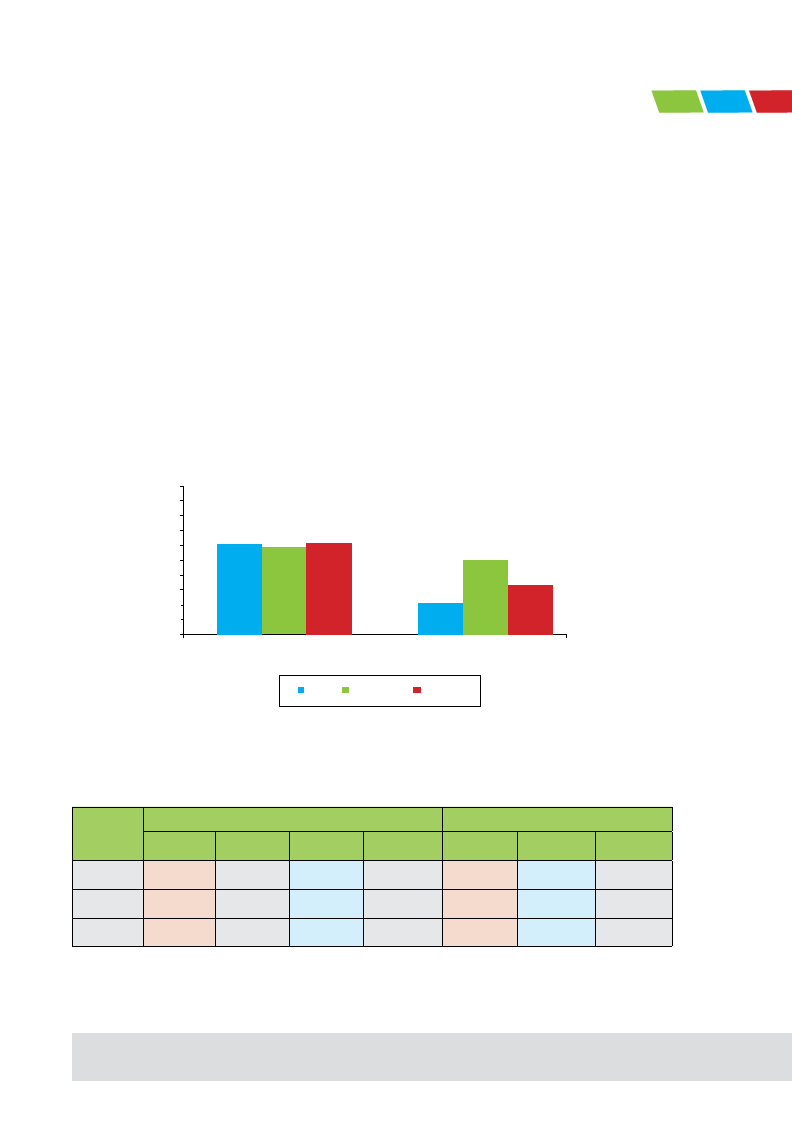
2.4 Employment
In both the states, males have an advantage
over females in employment. More males
are employed in Bihar (63%) than Jharkhand
(61%). However, the employment for male
youth is lower than the national average (64%)
TABLE:3
School attendance: Percentage of the de facto household population aged 15-17 years
attending school in the 2005-2006 academic year by urban-rural residence in Bihar,
Jharkhand and India, 2005-06
State
Urban
Females Males
Total
Rural
Females Males
Total
Total Females Males
Total
Bihar
55.8
Jharkhand 50.0
India
50.5
56.8
56.3
18.5
45.6
28.4 24.0
48.4
33.6
57.7
53.8
19.5
45.4
31.0 26.7
48.9
36.9
52.1
51.3
27.7
47.1
36.7 34.4
48.8
41.3
GRAPH 2:
Mass media exposure among the youth in Bihar, Jharkhand and India, 2005- 2006 (Percentage
regularly exposed to media)
90
100
90
79
74
80
70
60
50
40
30
20
10
0
74
47
46
Men
Women
Bihar Jharkhand India

3.2 Page 22

▲back to top


Youth in Bihar and Jharkhand: A Situational Analysis | 21
in both the states. The situation for females is
just the reverse. Jharkhand (52%) outscores
Bihar (22%) in case of employment of female
youth. The figure for Jharkhand is higher than
the national average (34%).
2.5 Marital Status
The marital status of the household population
in these two states varies by age, sex and place
of residence. The proportion of currently-
married youth is higher (43.8%) for Bihar
than Jharkhand (40.7%). In the case of never-
married, Jharkhand (58.3%) outscores Bihar
(52.6%). The ever-married youth population
varies by sex. There is also variation across the
states. Both the states have a higher average
than the national figure. Among males and
females, the proportion is higher for females
than males. In Bihar and Jharkhand more than
one fifth of the females aged 15-17 years were
married. The proportion of females aged 15-
17 years who were married is higher in Bihar
(38%) than in Jharkhand (36%) (Appendix:
Tables 2a & 2b).
GRAPH 3:
Employment of youth in Bihar, Jharkhand and India, 2005-2006 ( Percent employed in the
last 12 months)
100
90
80
70
63 61 64
60
50
40
30
20
10
0
Men
52
34
22
Women
Bihar Jharkhand India
TABLE 4:
Marital status: Percentage of females and males aged 15-24 years who are ever-married
(includes married, but gauna not performed), by age in Bihar, Jharkhand and India, 2005-
2006
State
Females
Males
15–17 years 18–19 years 20–24 years 15–24 years 15–20 years 21–24 years 15–24 years
Bihar
38.0
69.4
89.0
67.1
14.5
53.7
27.3
Jharkhand
36.1
64.4
83.8
64.5
12.5
54.0
26.9
India
19.0
47.5
75.7
52.1
7.4
38.2
18.7

3.3 Page 23

▲back to top


22 | Youth in Bihar and Jharkhand: A Situational Analysis
GRAPH 4:
Percentage of female youth married by 18 years of age in Bihar, Jharkhand and India,
2005-2006
100
90
80
64
60
70
60
47.4
50
40
30
20
10
0
Bihar Jharkhand India

3.4 Page 24

▲back to top


Youth in Bihar and Jharkhand: A Situational Analysis | 23
i i i . k no w l e d ge and awar eness
a mong yo ut h i n B ihar a n d
Jharkhand
This section discusses the level of knowledge
of youth on key issues of family welfare
and health. The specific topics discussed are
knowledge of family planning methods and
HIV/AIDS. The age between 15–24 years is
when most females and males enter marital
unions and begin sexual activity. During this
period, it is important for them to have accurate
information on these issues.
3.1 Knowledge of Family Planning
Methods
The knowledge of family planning methods
is a precondition for their use. Knowledge of
different family planning methods, especially
spacing methods, is essential for providing
young couples with the means to delay or
avoid a pregnancy. Knowledge about condoms
is also important for the practice of safe sex,
and knowledge of emergency contraception is
essential for avoiding an unwanted pregnancy
after unprotected sex.
Knowledge regarding family planning methods
is high in both the states. Knowledge about
modern methods is higher than traditional
methods among both male and female youth in
both the states. With regards to awareness of
modern spacing methods, in Jharkhand 55 per
cent of females have not heard about IUDs.
In both the states as well as for the country
as a whole, males are less aware than females
of pills and IUDs, the two spacing methods
for females. There is a gender differential
with respect to awareness about IUDs. The
awareness about emergency contraception is
quite low for both the sexes. In both the states,
a major medium of exposure to family planning
methods was television, wall paintings and
hoardings. Exposure among males is found to
be higher than females for all the media.
3.2 Knowledge of HIV/AIDS
The knowledge of HIV/AIDS and sexual
behaviour among youth is important because
the period between sexual initiation and
marriage is for many young people a time
of sexual experimentation that may involve
high-risk behaviours. This issue has special
TABLE 5:
Awareness of modern spacing methods: Percentage of females and males aged 15-24 years who
are aware of specific modern spacing methods in Bihar, Jharkhand and India, 2005-2006
State
Bihar
Females
Males
Pill
IUD
Condom
Emergency
Contraception
Pill
IUD
Condom
Emergency
Contraception
92.7 67.0
72.3
3.4
76.9 36.0 92.6
11.4
Jharkhand
75.6 45.1
59.2
4.5
74.2 29.5 86.5
6.4
India
82.8 87.9 71.3
8.2
78.4 36.8 93.4
15.2

3.5 Page 25

▲back to top


24 | Youth in Bihar and Jharkhand: A Situational Analysis
importance as nearly two-fifths of the new
HIV infections in India are reported among
people below 25 years of age (NACO, 2004).
An equally important concern is the narrowing
gender gap in new infections, suggesting an
urgent need to address the issues and concerns
of the youth.
Knowledge of AIDS is higher among young
persons aged 15–24 years than older persons
aged 25–49 years. Knowledge of HIV
transmission and prevention is crucial for young
people, particularly if they engage in casual sex
or other risky behaviours. At the national level,
about two-thirds of young females are aware
of AIDS, but in Jharkhand and Bihar less
than half of females have heard of AIDS. In
Jharkhand, only 40 per cent females and 71 per
cent of males are aware of AIDS. In Bihar, only
44 per cent females, but 82 per cent of males
have heard of AIDS. In both the states for
both males and females, the knowledge about
HIV/AIDS varies by age, place of residence
and education. The level of knowledge is
higher in urban areas as compared to rural
areas. Major sources of information are radio,
television, newspaper and discussions among
peers. Knowledge of male youth is found to
be higher than female youth in both the states
(Appendix: Tables 25a & 25b).
3.3 Comprehensive Knowledge of HIV/AIDS
Comprehensive knowledge about HIV/AIDS is
very low. Comprehensive knowledge means that
youth know that a healthy looking person can
have HIV/AIDS, that it cannot be transmitted
through mosquito bites or by sharing food, and
that condom use and having only one faithful,
uninfected partner can help prevent HIV/
AIDS. Almost two-thirds of young males and
half of young females know that HIV infection
can be transmitted from a mother to her baby.
Although awareness of AIDS is widespread
among males, most of them do not have a
comprehensive knowledge of it. In Jharkhand,
14 per cent males and 30 per cent females
have a comprehensive knowledge about HIV/
AIDS. The corresponding figures for Bihar
are 13 per cent and 27 per cent respectively. In
both the states, more male youth were aware
of transmission of HIV/AIDS from mother
to child than female youth. It also varies by
place of residence and education (Appendix:
Tables 27a & 27b).

3.6 Page 26

▲back to top


Youth in Bihar and Jharkhand: A Situational Analysis | 25
IV. atti t u d es and b eh avi ours
of Youth in Bihar and jharkhand
A study of youth attitudes toward demographic
and health issues provides an insight into their
motivations and the context for behaviour.
Knowing the attitudes of youth is particularly
important for at least two reasons – youth are
either already making, or will soon be making,
fertility related decisions that will be key to
demographic change in the nation and because,
today’s youth are tomorrow‘s adults, and their
attitudes will have an important influence
on what constitutes acceptable behaviour in
tomorrow’s world.
This section, therefore, explores attitudes
of youth on key demographic and health-
related topics: the ideal number of children,
use of contraception, acceptance of persons
living with HIV/AIDS, teaching of family life
education in school and gender roles.
4.1 The Ideal Number of Children
As most of the youth are just initiating
childbearing or will soon be doing so, the family
size they consider to be ideal will influence the
future level of fertility in the country. NFHS-3
data show that youth in India, both females and
males, desire small families. Two children is the
most preferred family size in both Bihar and
Jharkhand. After a two-child family, most male
and female youth prefer three children followed
by one child in both the states (Appendix:
Tables 4a & 4b).
4.2 Use of Contraception
Ever-use of contraception is found to be
higher in Jharkhand (27%) than in Bihar
(20%). Ever-use of contraception among
female youth is found to be higher in urban
areas than in rural areas in both the states.
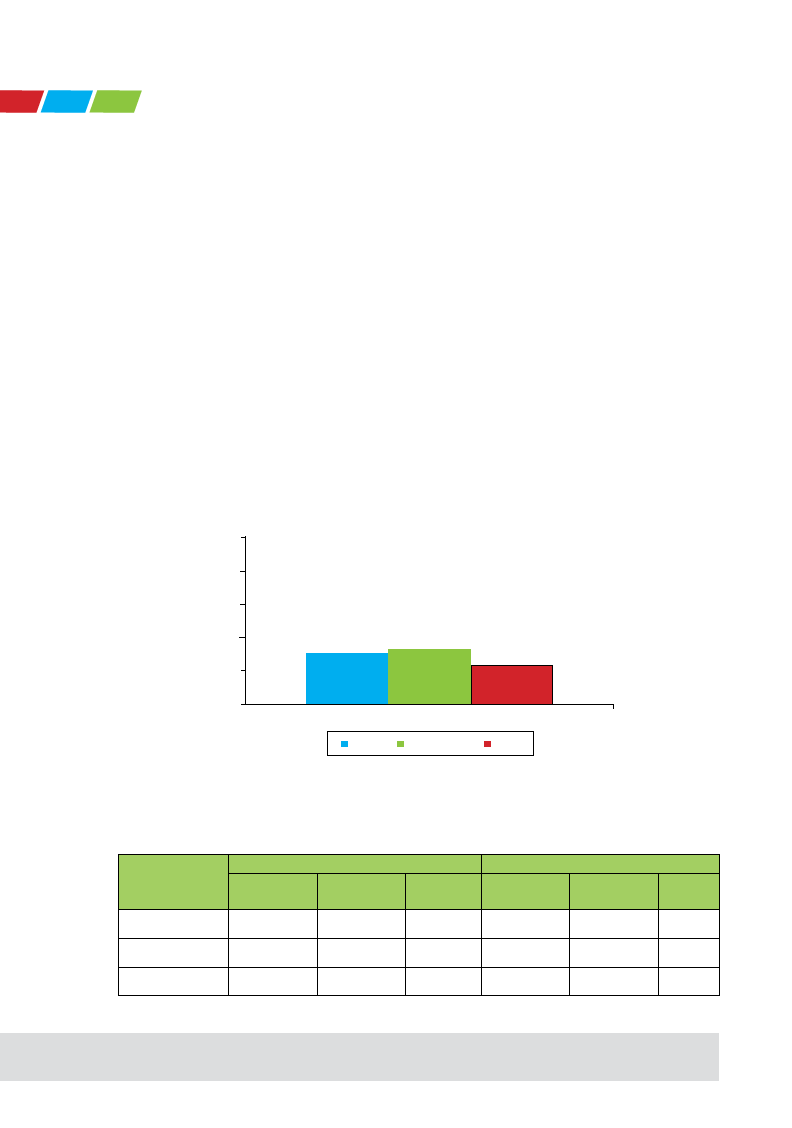
Among the two states, the contraceptive
prevalence rate (CPR) is higher for Jharkhand
(15%) than Bihar (13%).The CPR for both the
states is lower than the national average (28%).
For modern methods, the CPR for Jharkhand
(12%) is higher than Bihar (9%).The most
commonly used family planning methods in
the two states are female sterilisation, pill and
condom. Contraceptive use also varies by place
of residence (Appendix: Tables 14a &14b).
GRAPH 5:
Contraceptive prevalence among female
youth in Bihar, Jharkhand and India, 2005-
2006 (Percentage of currently married
females aged 15-24 years)
100
80
60
40
28
13
15
20
0
Bihar
Jharkhand
India
4.3 Quality of Care
More (9%) female youth were informed about
the side effects of sterilisation in Jharkhand
than in Bihar (3%) before they chose to accept
it. All 24 per cent of female youth in Bihar
were informed about the availability of other
methods before accepting sterilisation; the figure
for Jharkhand was 10 per cent. (Appendix: Tables
16a & 16b).

3.7 Page 27

▲back to top


26 | Youth in Bihar and Jharkhand: A Situational Analysis
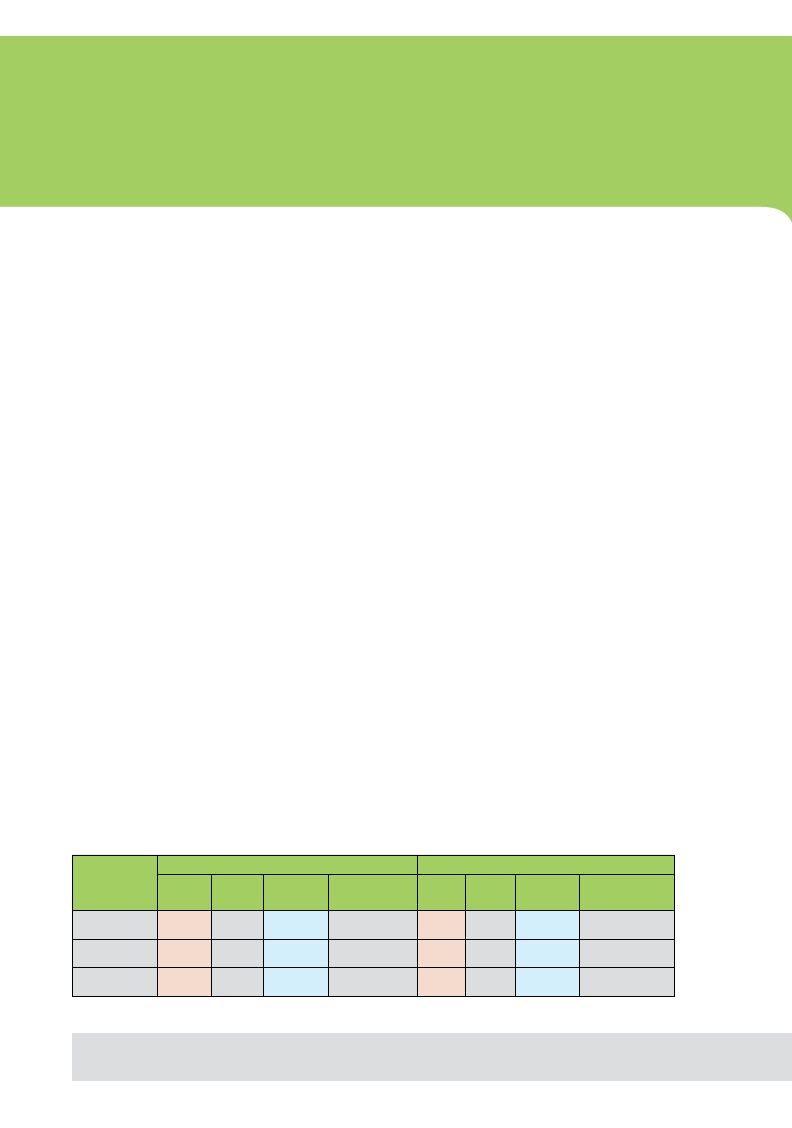
4.4 Unmet Need
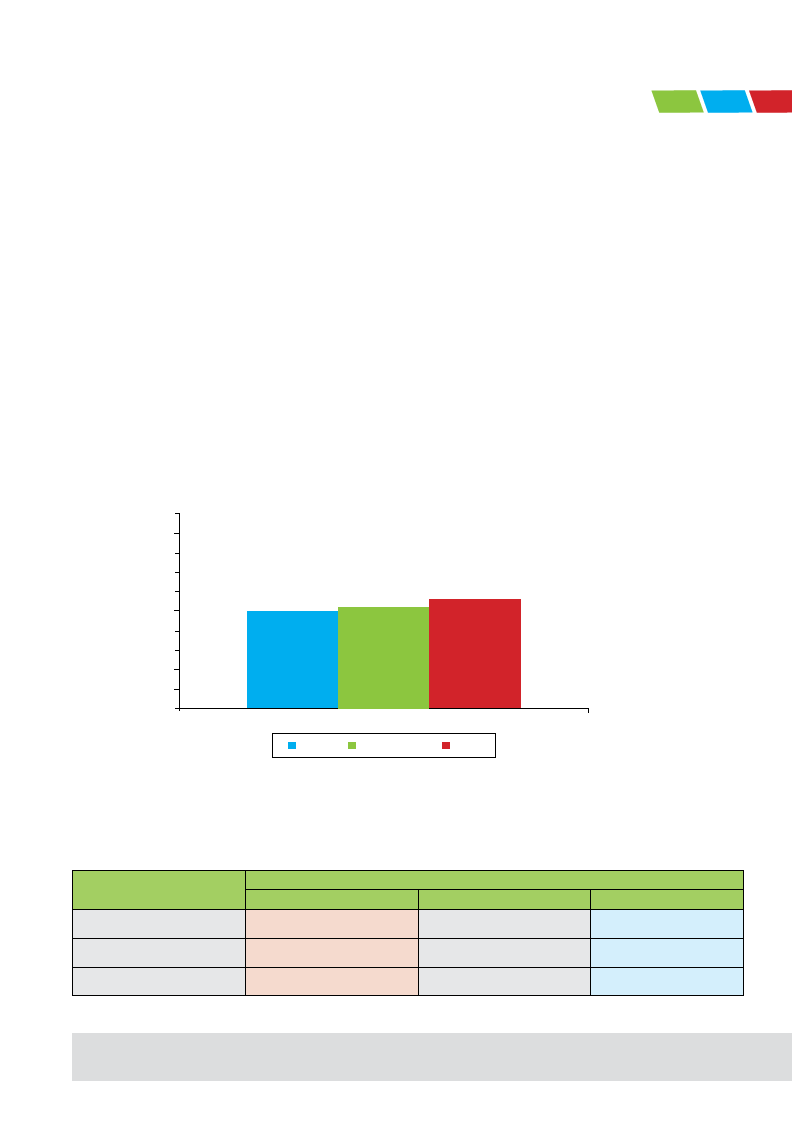
The unmet need for contraception is higher
in Jharkhand (33%) than in Bihar (31%).
The figure for both the states is higher than
the national average (23%). Unmet need also
varies by place of residence and is higher in
rural areas than urban areas (Appendix: Tables
19a & 19b).
4.5 Gender Roles
In Bihar 57 per cent of females and 63 per
cent of males agree on at least one reason for
wife beating. The corresponding figures for
Jharkhand are 51 and 42 per cent. The figures
for Bihar are more than the national average,
whereas Jharkhand scores below the national
average.
Youth Behaviour
This section focuses on reported demographic
and health-related behaviours of the youth.
First, it examines youth behaviour related to
reproduction, in particular, fertility and their
use of contraception. This is followed by a
discussion on sexual initiation and behaviour
related to high-risk sex among youth. Finally,
data is presented on the use of tobacco and
alcohol by youth, which are two lifestyle choices
that have consequences on health.
GRAPH 6:
Unmet need among females aged 15-24 years - Bihar, Jharkhand and India, 2005-2006
100
80
60
31
33
40
23
20
0
Bihar Jharkhand India
TABLE 6:
Acceptance of wife beating: Percentage of females and males 15-24 years who agree on at least
one reason for wife beating by marital status in Bihar, Jharkhand and India, 2005-2006
State
Bihar
Never
Married
48.9
Females
Ever
Married
60.9
Total
56.6
Never
Married
59.0
Males
Ever
Married
76.6
Total
63.3
Jharkhand
45.3
54.2
50.9
42.0
43.2
42.3
India
49.0
56.4
52.8
54.8
60.0
55.7

3.8 Page 28

▲back to top


Youth in Bihar and Jharkhand: A Situational Analysis | 27
4.6 Fertility Performance
The period of youth is a time when individuals
are expected to acquire knowledge and skills
necessary in becoming responsible adults who
are adequately prepared for the demands of
family formation, successful employment
and informed citizenship. However, for most
females in India, the period of youth is when
childbearing activity is at its peak. In the states
of Bihar and Jharkhand half or more of total
fertility rate (TFR) is accounted for by the
fertility of female youth. The figures for both
the states are below the national average.
4.7 Initiation of Childbearing
A direct indicator of early childbearing is
the proportion of youth who have initiated
childbearing, i.e. they have had a child or are
pregnant with their first child. One-fourth
or more adolescent girls aged 15-19 years in
Jharkhand and Bihar have already initiated
childbearing. The percentage is slightly higher
for Jharkhand (27.5%) than Bihar (25%).
Initiation of child bearing by background
characteristics in both the states shows that
childbearing increases gradually with each single
year of age from 15-17 years. Early initiation
GRAPH 7:
Percentage of Total Fertility achieved by age 25 years
in Bihar, Jharkhand and India, 2005-2006
100
90
80
70
50
52
56
60
50
40
30
20
10
0
Bihar Jharkhand
India
TABLE 7:
Initiation of childbearing: Percentage of females 15-24 years who have begun childbearing
by age in Bihar, Jharkhand and India, 2005-2006
State
Bihar
15–19 years
25.0
Percentage by age
20–24 years
79.1
15–24 years
47.8
Jharkhand
27.5
75.6
49.9
India
16.0
65.0
39.4

3.9 Page 29

▲back to top


28 | Youth in Bihar and Jharkhand: A Situational Analysis
of childbearing is more common in rural than
in urban areas, and declines sharply with the
wealth index. Initiation of childbearing is
higher in case of illiterate females than literate
females.
4.8 Use of Tobacco and Alcohol
Substance abuse is an important issue related
to youth health worldwide. In NFHS-3,
data on tobacco consumption and alcohol
consumption by females and males was
collected. According to Mishra et al (2005), if
the current consumption of tobacco trends
persists, tobacco related deaths will be around
10 million per year by 2030. While cigarettes
are the dominant form of tobacco use in much
of the world, oral use of smokeless tobacco
(chewing or applying to the teeth or gums) and
smoking of bidis are the dominant forms of
tobacco consumption.
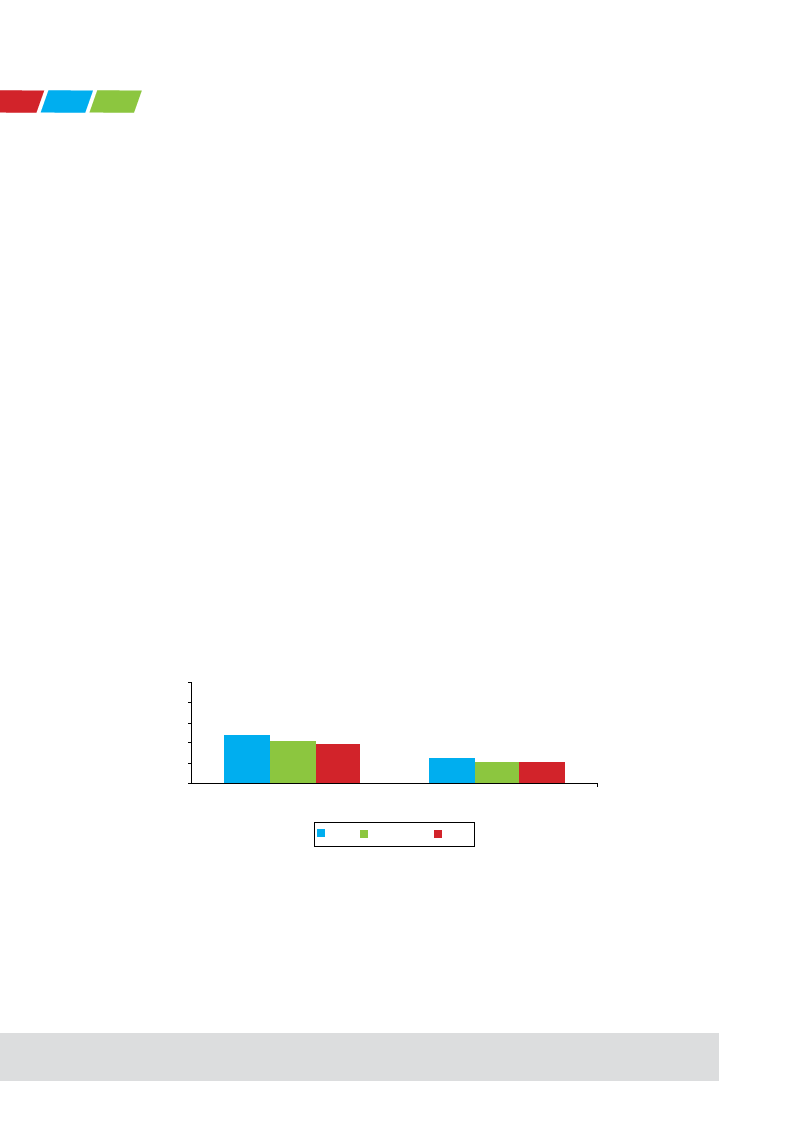
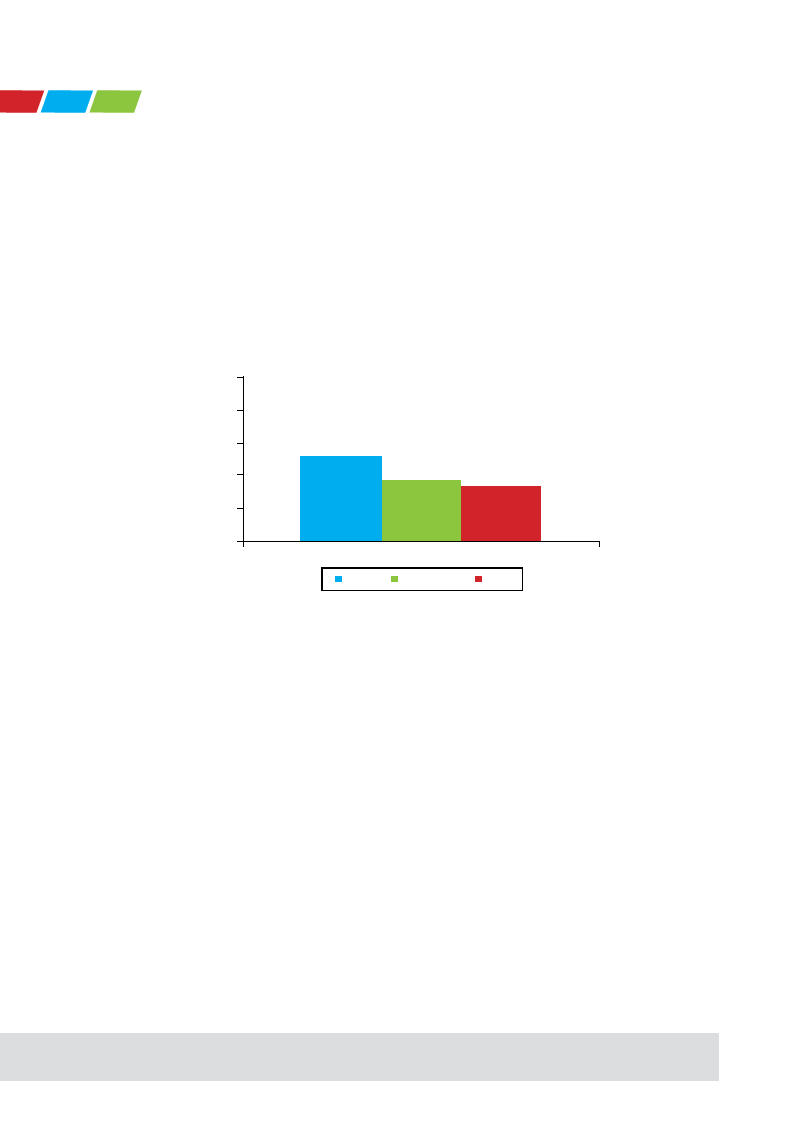
Both use of tobacco and alcohol (48% and
25%) among males and young males is higher
in Bihar than Jharkhand (42% and 21%). In
consumption of both the substances, the figures
for Bihar and Jharkhand are higher than the
national average. There is a gender differential
with respect to the use of tobacco and alcohol.
In both the states more male youth are using
tobacco and alcohol as compared to females.
The use of substances is slightly higher for
urban areas than rural areas.
4.9 Initiation of Sexual Activity
About 17 per cent of female youth and three
per cent of male youth had their first sexual
intercourse by 15 years of age in Bihar. The
corresponding figures for Jharkhand are 18 and
two per cent respectively (Appendix: Tables 20a
& 20b). The use of condom for the first sexual
intercourse also shows a gender differential.
In both the states more male youth used the
condom for the first sexual intercourse than
female youth (Appendix: Tables 21a & 21b).
GRAPH 8:
Use of tobacco/alcohol among males in Bihar, Jharkhand and India
100
80
60
48
42
39
40
20
0
Men (15-24 years)
25 21
21
Young Men (15-19 years)
Bihar Jharkhand India

3.10 Page 30

▲back to top


Youth in Bihar and Jharkhand: A Situational Analysis | 29
V. nut r i t i on and h ealth
S tatu s of yo ut h i n bihar
and jharkhand
In this final section, selected indicators of
young people’s access to maternal health care
services, youth health and nutritional status,
and the extent to which female youth are
subjected to domestic violence, are discussed.
An examination of if youth are utilising
maternal health care services, such as ante-
natal and delivery care, is important for several
reasons. Key among them is that youth fertility
accounts for a major proportion of all fertility
and very young mothers are at higher risk of
adverse health outcomes than older females
whose bodies are fully developed. The section
also presents data on often ignored aspect of
physical, sexual and maternal health of females
− violence.
Indicators of youth health examined in
this section include prevalence of sexually
transmitted diseases, HIV, diabetes, asthma and
tuberculosis. Indicators of nutritional status
include measures based on the body mass
index (BMI) of youth calculated from weight
measurement taken as part of NFHS-3 and on
the anemia status of youth.
5.1 Maternal Health Care
India’s Health and Family Welfare Programme
has recognised as its key objectives, the need to
provide services that enable a safe and healthy
pregnancy and delivery, and ensure the health
and survival of the mother and her newborn. In
order to meet these objectives, every pregnancy
needs to be monitored by health personnel
for signs of complications starting in the first
trimester, the delivery to take place under
the supervision of a health professional and
preferably in a health institution, and the health
of the woman and the newborn to be checked
by a health professional very soon after the birth.
Elements of antenatal care (ANC) include three
or more antenatal checkups, protection against
tetanus, and iron supplementation. Although
risks of pregnancy-related complications and
of adverse health outcomes, including maternal
and infant mortality, exist for all females, the
risks tend to be higher for pregnancies among
adolescents whose bodies have yet to fully
mature. In addition, a large proportion of
births to youth are first births, which also carry
a higher risk of mortality than most second or
third order births.
5.2 Antenatal Care
Whether young women receive ANC varies
greatly by the state they are in. Less than one
in every three youth received three or more
ANC visits during their last delivery in the
past five years in Bihar. This variation among
youth is similar to the variation by state among
all females in reproductive ages. Percentage
of youth who received any ANC is found to
be higher in Jharkhand (60%) as against Bihar
(41%). There exists a rural-urban differential
with respect to the utilisation of ANC care in
both the states under study (Appendix: Tables
9a & 9b).
5.3 Delivery Care
In Jharkhand and Bihar, less than one in
four births takes place in a health facility.

4 Pages 31-40

▲back to top


4.1 Page 31

▲back to top


30 | Youth in Bihar and Jharkhand: A Situational Analysis
GRAPH 9:
Three or more antenatal care visits among youth in Bihar, Jharkhand and India, 2005-2006
Percentage for the last births in the past five years
100
90
80
70
58
60
50
39
40
21
30
20
10
0
Bihar Jharkhand India
Institutional delivery is higher in Bihar (22.2%)
than in Jharkhand (16%). Both the states’
figures are below the national average (41%).
More deliveries (33.8%) were assisted by health
personnel in Bihar as compared to Jharkhand
(23%).There exists a rural-urban differential
with respect to place of delivery and delivery
assistance by skilled health personnel.
5.4 Health Problems during Pregnancy
Majority (79%) of female youth in Bihar have
faced a pregnancy complication as compared
to Jharkhand (69%). The major pregnancy
complications in both the states were excessive
fatigue, swelling in legs, body and face and
convulsions (Appendix: Tables 10a & 10b).
5.5 Post-natal Care
Deliveries with post-natal check-ups are
found to be higher in Jharkhand (21%); the
corresponding figure for Bihar is 17 per cent.
However, deliveries with post-natal check up
within two days of birth are a little higher in
Bihar (15%) as compared to Jharkhand (14%).
(Appendix: Tables 9a & 9b).
5.6 Nutritional Status
There is a large interstate variation in the
proportion of youth who are abnormally thin.
In Bihar, the proportion of females and males
who are abnormally thin is 50 per cent and
48 per cent respectively. The corresponding
figures for Jharkhand are 47 and 52 per cent.
5.7 Male Involvement
Percentage of males who were present at an
ANC visit was higher (43%) in Jharkhand than
in Bihar (17%). More male youth in Bihar were
informed by the health worker about signs of
pregnancy complication than in Jharkhand
(Appendix: Tables 11a & 11b).
5.8 Prevalence of Anemia
Iron deficiency anemia is one of the most
common forms of malnutrition in the world.
Characterised by low levels of haemoglobin, it
can have detrimental effects on an individual’s
health. Anemia is of particular concern for
female youth since it can become an underlying
cause for maternal and perinatal mortality and is
associated with an increased risk of premature

4.2 Page 32

▲back to top


Youth in Bihar and Jharkhand: A Situational Analysis | 31
GRAPH 10:
Institutional delivery among youth in Bihar, Jharkhand and India, 2005-2006
Percentage for the last births in the past five years
100
90
80
70
60
50
41
40
30
23
20
20
10
0
Bihar Jharkhand India
GRAPH 11:
Percentage of youth who are abnormally thin in Bihar, Jharkhand and India, 2005-2006
100
80
48 52
60
43
50 47
40
40
20
0
Men
Women
Bihar Jharkhand India
GRAPH 12:
Anemia among youth in Bihar, Jharkhand and India, 2005-2006
100
80
60
40
33 36 27
20
0
Men
67 68
54
Women
Bihar Jharkhand India

4.3 Page 33

▲back to top


32 | Youth in Bihar and Jharkhand: A Situational Analysis
delivery and low birth weight for children. There
is wide variation in the prevalence of anemia
among youth. The proportion of female youth
who are anemic is two-thirds in Bihar and
Jharkhand. Among young males, prevalence of
anemia is 36 per cent in Jharkhand and 32 per
cent in Bihar.
5.9 Domestic Violence
The prevalence of spousal physical or sexual
violence varies greatly by state. For Bihar it is
52 per cent, and for Jharkhand it is 37 per cent.
For both the states, the figure is higher than the
national average.
GRAPH 13:
Prevalence of spousal physical or sexual violence among youth in Bihar, Jharkhand and
India, 2005-2006
100
80
52
60
37
34
40
20
0
Bihar Jharkhand India

4.4 Page 34

▲back to top


Youth in Bihar and Jharkhand: A Situational Analysis | 33
References
1. International Institute for Population Sciences (IIPS) and Macro International (2007), National
Family Health Survey (NFHS-3), 2005–2006: India. Volume I, Mumbai: IIPS.
2. International Institute for Population Sciences (IIPS) and Macro International (2007), National
Family Health Survey (NFHS-3), 2005–2006: India. Volume-II, Mumbai: IIPS.
3. Ministry of Youth Affairs and Sports (2003), National Youth Policy, 2003.
4. Mishra,V.,D. Robert, R. Retherford, and Kirk Smith.(2005), Effects of cooking and
environmental tobacco smoke on acute respiratory infections in young Indian children.
Population and Environment, Vol. 26,No. 5,pp. 375–396.
5. National AIDS Control Organization (NACO) (2004), Annual Report 2002–2004, New Delhi:
NACO, Ministry of Health and Family Welfare, Government of India.
6. Office of the Registrar General (2006), Population Projections for India and States 2002–
2026, Report of the Technical Group on Population Projections constituted by the National
Commission on Population, Office of the Registrar General & Census Commissioner, India.
7. Sahni, A. (2005), Stresses and distresses in the youth, Health Administrator Volume XVII,
Number 1: 75–77.
8. United Nations (2009), Youth and the United Nations. Accessed at www.un.org/youth
9. United Nations Population Fund-India (2009), District Level Population Projections in Eight
Selected States of India, 2006–2016.

4.5 Page 35

▲back to top


34 | Youth in Bihar and Jharkhand: A Situational Analysis
appendix: tables for
jharkhand and bihar
TABLE 1A:
Household population by age, sex and residence
Percent distribution of the de facto household population by age, according to residence and sex, Jharkhand, 2005-06
Urban
Rural
Total
Age
Male Female Total
Male Female Total
Male Female Total
15-19
54.0
51.1
52.6
56.5
54.4
55.4
55.7
53.4
54.5
20-24
46.0
48.9
47.4
43.5
45.6
44.6
44.3
46.6
45.5
Total percent 100.0
100.0
100.0
100.0
100.0
100.0
100.0
100.0
100.0
Number
336
327
662
788
879
1,667
1,123
1,207
2,330
Note: Table is based on de facto population, i.e., persons who stayed in the household the night before the interview (including both usual resident and visitors)
TABLE 1B:
Household population by age, sex and residence
Percent distribution of the de facto household population by age, according to residence and sex, Bihar, 2005-06
Urban
Rural
Total
Age
Male Female Total
Male Female Total
Male Female Total
15-19
57.8
56.8
20-24
42.2
43.2
57.3
56.6
54.9
55.6
56.8
55.2
55.9
42.7
43.4
45.1
44.4
43.2
44.8
44.1
Total
percent
Number
100.0
263
100.0
249
100.0
512
100.0
884
100.0
1294
100.0
2178
100.0
1147
100.0
1543
100.0
2690
Note: Table is based on de facto population, i.e., persons who stayed in the household the night before the interview (including both usual resident and visitors

4.6 Page 36

▲back to top


Youth in Bihar and Jharkhand: A Situational Analysis | 35
TABLE 2A:
Marital status of the household population
Percent distribution of the household population aged 15-24 by marital status, according to age, residence and sex,
Jharkhand 2005-06
Age
15-19
20-24
Never
married
98.4
82.3
Currently
married
1.6
16.8
Marital status
Married,
gaunna not Widowed Divorced
performed
Urban
Male
0.0
0.0
NA
0.9
0.0
NA
Separated
NA
NA
Deserted
NA
NA
Total
Percent
100.0
100.0
Total
91.0
8.6
0.4
0.0
NA
NA
NA
100.0
Female
15-19
84.0
14.7
1.3
0.0
0.0
0.0
NA
100.0
20-24
40.8
58.3
0.4
0.0
0.4
0.0
NA
100.0
Total
62.9
36.1
0.9
0.2
0.0
0.0
NA
100.0
Total
15-19
91.5
7.9
0.6
0.0
0.0
0.0
NA
100.0
20-24
61.2
37.9
0.7
0.0
0.2
0.0
NA
100.0
Total
77.1
22.1
0.6
0.3
0.1
0.0
NA
100.0
Note: Table is based on de facto population, i.e., persons who stayed in the household the night before the interview (including both usual resident and visitors)
NA: Not applicable
TABLE 2A:
Marital status of the household population(Contd...)
Percent distribution of the household population aged 15-24 by marital status, according to age, residence and sex,
Jharkhand 2005-06
Age
15-19
20-24
Never
married
90.0
47.1
Currently
married
9.2
51.9
Marital status
Married,
gaunna not
performed
0.8
0.0
Widowed
Rural
Male
0.0
0.3
Divorced
0.0
0.3
Separated
0.0
0.3
Deserted
NA
NA
Total
Percent
100.0
100.0
Total
71.3
27.8
0.4
0.1
0.1
0.1
NA
100.0
Female
15-19
50.7
48.5
0.7
0.0
0.0
0.0
0.0
100.0
20-24
10.8
87.1
0.0
0.9
0.6
0.3
0.3
100.0
Total
32.5
66.1
0.4
0.4
0.3
0.1
0.1
100.0
Total
15-19
69.6
29.6
0.8
0.0
0.0
0.0
0.0
100.0
20-24
27.6
70.9
0.0
0.6
0.5
0.3
0.2
100.0
Total
50.8
48.0
0.4
0.3
0.2
0.1
0.1
100.0
Note: Table is based on de facto population, i.e., persons who stayed in the household the night before the interview (including both usual resident and visitors)
NA: Not applicable

4.7 Page 37

▲back to top


36 | Youth in Bihar and Jharkhand: A Situational Analysis
TABLE 2A:
Marital status of the household population(Contd...)
Percent distribution of the household population aged 15-24 by marital status, according to age, residence and sex,
Jharkhand 2005-06
Age
15-19
20-24
Never
married
92.4
58.0
Currently
married
7.0
41.0
Marital status
Married,
gaunna not
performed
0.6
0.3
Widowed
Total
Male
0.0
0.2
Divorced
0.0
0.2
Separated
0.0
0.2
Deserted
NA
NA
Total
Percent
100.0
100.0
Total
77.2
22.1
0.4
0.1
0.1
0.1
NA
100.0
Female
15-19
59.4
39.8
0.9
0.0
0.0
0.0
0.0
100.0
20-24
19.4
78.9
0.1
0.6
0.4
0.3
0.2
100.0
Total
40.8
58.0
0.5
0.3
0.2
0.2
0.1
100.0
Total
15-19
75.6
23.6
0.7
0.0
0.0
0.0
0.0
100.0
20-24
37.6
61.1
0.2
0.4
0.3
0.3
0.1
100.0
Total
58.3
40.7
0.5
0.2
0.2
0.1
0.1
100.0
Note: Table is based on de facto population, i.e., persons who stayed in the household the night before the interview (including both usual resident and visitors)
NA: Not applicable
TABLE 2B:
Marital status of the household population
Percent distribution of the household population aged 15-24 by marital status, according to age, residence and sex, Bihar
2005-06
Marital status
Age
Never
married
Currently
married
Married,
gaunna not
performed
Widowed
Divorced
Separated Deserted
Total
Percent
Urban
Male
15-19
96.1
2.6
1.3
0.0
NA
0.0
NA
100.0
20-24
78.4
21.6
0.0
0.0
NA
0.0
NA
100.0
Total
88.6
10.6
0.8
0.1
NA
0.1
NA
100.0
Female
15-19
81.6
16.3
2.1
0.0
0.0
0.0
NA
100.0
20-24
33.6
65.4
0.0
0.9
0.0
0.0
NA
100.0
Total
60.9
62.4
0.7
1.1
0.0
0.0
NA
100.0
Total
15-19
89.1
9.2
1.7
0.0
0.0
0.0
NA
100.0
20-24
56.6
42.9
0.0
0.5
0.0
0.0
NA
100.0
Total
75.2
23.6
1.0
0.2
0.0
0.2
NA
100.0
Note: Table is based on de facto population, i.e., persons who stayed in the household the night before the interview (including both usual resident and visitors)
NA: Not applicable

4.8 Page 38

▲back to top


Youth in Bihar and Jharkhand: A Situational Analysis | 37
TABLE 2B:
Marital status of the household population(Contd...)
Percent distribution of the household population aged 15-24 by marital status, according to age, residence and sex, Bihar
2005-06
Marital status
Age
Never
married
Currently
married
Married,
gaunna not
performed
Widowed
Divorced
Separated Deserted
Total
Percent
Rural
Male
15-19
88.8
8.2
3.0
0.0
0.0
0.0
NA
100.0
20-24
48.7
48.7
2.6
0.0
0.0
0.0
NA
100.0
Total
71.3
25.8
2.8
0.0
0.0
0.0
NA
100.0
Female
15-19
50.5
41.9
7.3
0.1
NA
0.1
0.0
100.0
20-24
7.4
90.6
0.0
0.5
NA
1.0
0.5
100.0
Total
17.6
63.9
4.0
0.3
NA
0.5
0.2
100.0
Total
15-19
66.3
28.0
5.5
0.1
0.0
0.1
0.0
100.0
20-24
23.7
74.0
1.0
0.3
0.0
0.6
0.3
100.0
Total
31.0
63.9
4.0
0.2
0.0
0.3
0.1
100.0
Note: Table is based on de facto population, i.e., persons who stayed in the household the night before the interview (including both usual resident and visitors)
NA: Not applicable
TABLE 2B:
Marital status of the household population( Contd...)
Percent distribution of the household population aged 15-24 by marital status, according to age, residence and sex, Bihar
2005-06
Age
15-19
20-24
Never
married
90.5
55.4
Currently
married
6.9
42.6
Marital status
Married,
gaunna not Widowed
performed
Divorced
Total
Male
2.6
2.0
0.0
0.0
0.0
0.0
Separated
0.0
0.0
Deserted
NA
NA
Total
Percent
100.0
100.0
Total
75.3
22.3
2.4
0.0
0.0
0.0
NA
100.0
Female
15-19
55.6
37.7
6.5
0.1
0.0
0.1
0.0
100.0
20-24
11.4
86.7
0.0
0.6
0.0
0.9
0.4
100.0
Total
35.8
59.7
3.6
0.3
0.0
0.5
0.2
100.0
Total
15-19
70.7
24.4
4.8
0.1
0.0
0.1
0.0
100.0
20-24
29.8
68.3
0.8
0.3
0.0
0.5
0.3
100.0
Total
52.6
43.8
3.0
0.2
0.0
0.3
0.1
100.0
Note: Table is based on de facto population, i.e., persons who stayed in the household the night before the interview (including both usual resident and visitors)
NA: Not applicable

4.9 Page 39

▲back to top


38 | Youth in Bihar and Jharkhand: A Situational Analysis
TABLE 3A:
Childbearing among ever-married women age 15-19
Percentage of women age 15-19 who have had a live birth or who are pregnant with their first child, and percentage
who have begun childbearing, by selected background characteristics, Jharkhand, 2005-06
Background characteristic
Percentage who:
Have had a live Are pregnant with
birth
first child
Percentage who
have begun
childbearing
Number of women
Age
15
1.6
4.9
6.5
121
16
6.5
5.1
11.6
139
17
16.4
4.2
20.6
140
18
32.1
11.3
43.4
162
19
47.5
7.4
55.0
115
Residence
Urban
Rural
9.8
2.4
12.2
171
24.5
8.2
32.7
506
Education
No education
<5 years complete
5-9 years complete
10 or more years complete
32.4
9.6
41.9
274
25.0
10.6
35.6
56
12.7
5.2
17.9
225
7.6
1.6
9.2
121
Marital status
Never married
0.0
0.0
0.0
370
Currently married
45.5
15.1
60.7
303
Widowed/divorced/separated/deserted
*
*
*
4
Religion
Hindu
Muslim
Christian
Other
22.1
6.9
29.1
490
24.2
7.7
31.8
93
*
*
*
19
11.5
3.3
14.8
72
Caste/tribe
Scheduled caste
Scheduled tribe
Other backward class
Other
23.6
10.0
33.6
95
19.5
7.0
26.6
169
22.3
6.6
28.9
306
13.8
4.1
17.8
105
Wealth index
Lowest
Second
Middle
Fourth
Highest
26.9
9.8
36.6
317
20.7
5.3
26.0
102
21.2
4.7
25.9
91
12.3
4.1
16.4
92
5.0
1.8
6.8
75
Total
20.8
6.8
27.5
677
Note: Total includes women with missing information on education, religion, and caste/tribe, who are not shown separately.
* Percentage not shown; based on fewer than 25 unweighted cases.

4.10 Page 40

▲back to top


Youth in Bihar and Jharkhand: A Situational Analysis | 39
TABLE 3B:
Childbearing among ever-married women age 15-19
Percentage of women age 15-19 who have had a live birth or who are pregnant with their first child, and percentage
who have begun childbearing, by selected background characteristics, Bihar, 2005-06
Background characteristic
Percentage who:
Have had a live Are pregnant with
birth
first child
Percentage who
have begun
childbearing
Number of women
Age
15
0.2
1.5
1.7
210
16
4.6
2.6
7.2
176
17
21.6
7.5
29.1
159
18
28.1
7.0
35.1
252
19
46.7
11.1
57.8
148
Residence
Urban
Rural
6.2
3.8
10.0
139
21.6
6.0
27.6
807
Education
No education
<5 years complete
5-9 years complete
10 or more years complete
26.3
9.0
35.3
448
20.0
7.5
27.5
71
13.1
2.3
15.4
287
9.5
1.0
10.5
139
Marital status
Never married
0.0
0.0
0.0
514
Currently married
43.0
12.6
55.6
426
Widowed/divorced/separated/deserted
*
*
*
6
Religion
Hindu
Muslim
21.7
6.1
27.8
759
9.8
4.2
13.9
186
Caste/tribe
Scheduled caste
Scheduled tribe
Other backward class
Other
30.1
6.3
36.5
173
*
*
*
5
20.8
6.8
27.6
543
6.9
2.1
8.9
221
Wealth index
Lowest
Second
Middle
Fourth
Highest
22.5
13.2
35.7
234
25.1
5.2
30.3
280
18.4
1.7
20.1
186
15.5
3.1
18.6
156
1.6
0.5
2.0
89
Total
19.3
5.7
25.0
946
Note: Total includes women from all other religions, and women with missing information on caste/tribe, who are not shown separately.
* Percentage not shown; based on fewer than 25 unweighted cases.

5 Pages 41-50

▲back to top


5.1 Page 41

▲back to top


40 | Youth in Bihar and Jharkhand: A Situational Analysis
TABLE 4A:
Fertility preferences by number of living children
Percent distribution of currently married women and men age 15-24 years by desire for children, according to number
of living children, Jharkhand, 2005-06
Desire for children
0
Desire for additional child
Wants another soon2
68.6
Wants another later3
24.2
Wants another, undecided when
4.7
Undecided
1.1
Wants no more
0.0
Sterilized4
0.0
Declared infecund
0.7
Missing
0.7
Number of living children1
1
2
3
4
Women
23.4
11.0
3.9
8.7
66.2
34.7
21.0
4.4
3.3
4.6
2.6
4.4
2.0
2.2
1.3
0.0
3.7
38.9
52.1
65.1
0.7
7.9
19.0
17.5
0.7
0.6
0.0
0.0
0.0
0.0
0.0
0.0
Total
5+
0.0
27.3
0.0
40.7
0.0
3.9
0.0
1.7
66.7
20.3
33.3
5.4
0.0
0.5
0.0
0.2
Total percent
100.0
100.0
100.0
100.0
100.0
100.0
100.0
Number of women
176
282
205
91
27
7
788
Desire for additional child
Wants another soon2
48.3
Wants another later3
47.7
Wants another, undecided when
0.0
Undecided
4.0
Wants no more
0.0
Sterilized5
0.0
Declared infecund
0.0
Total percent
100.0
Number of men
31
30.3
69.7
0.0
0.0
0.0
0.0
0.0
100.0
31
Men
16.3
20.9
0.0
0.0
62.8
0.0
0.0
100.0
15
0.0
25.0
0.0
0.0
75.0
0.0
0.0
100.0
5
(0.0)
(100.0)
(0.0)
(0.0)
(0.0)
(0.0)
(0.0)
100.0
01
*
*
*
*
*
*
*
100.0
0
32.1
50.4
0.0
1.5
15.9
0.0
0.0
100.0
83
1Includes current pregnancy of women/wife
2Wants next birth within 2 years
3Wants to delay next birth for 2 or more years
4Includes both female and male sterilization
5Includes male sterilization and men who mention in response to the question about desire for children that their wife has been sterilized
* Percentage not shown; based on fewer than 25 unweighted cases.
( ) Based on 25-49 unweighted cases.

5.2 Page 42

▲back to top


Youth in Bihar and Jharkhand: A Situational Analysis | 41
TABLE 4B:
Fertility preferences by number of living children
Percent distribution of currently married women and men age 15-24 years by desire for children, according to number
of living children, Bihar, 2005-06
Desire for children
0
Desire for additional child
Wants another soon2
Wants another later3
Wants another, undecided when
Undecided
Wants no more
Sterilized4
Declared infecund
Missing
Total percent
Number of women
67.8
25.4
5.3
1.1
0.0
0.0
0.4
0.0
100.0
264
Number of living children1
1
2
3
4
Women
19.1
69.1
5.8
2.2
3.9
0.0
0.0
0.0
100.0
362
10.7
32.9
4.0
5.8
36.0
9.3
1.3
0.0
100.0
225
5.4
20.8
3.1
3.1
48.5
19.2
0.0
0.0
100.0
130
0.0
14.6
2.4
2.4
63.4
17.1
0.0
0.0
100.0
41
5+
0.0
0.0
0.0
0.0
80.0
20.0
0.0
0.0
100.0
5
Total
27.2
41.3
4.8
2.8
18.3
5.3
0.4
0.0
100.0
1027
Desire for additional child
Wants another soon2
Wants another later3
Wants another, undecided when
Undecided
Wants no more
Sterilized5
Declared infecund
Missing
Total percent
Number of men
46.3
43.9
4.9
0.0
0.0
0.0
4.9
0.0
100.0
41
Men
35.1
54.1
5.4
0.0
5.4
0.0
0.0
0.0
100.0
37
12.5
43.8
0.0
0.0
43.8
0.0
0.0
0.0
100.0
16
0.0
0.0
0.0
0.0
100
0.0
0.0
0.0
100.0
3
0.0
0.0
0.0
0.0
100
0.0
0.0
0.0
100.0
3
0.0
0.0
0.0
0.0
0.0
0.0
0.0
0.0
100.0
0
34.0
45.0
4.0
0.0
15.0
0.0
2.0
0.0
100.0
100
1Includes current pregnancy of women/wife
2Wants next birth within 2 years
3Wants to delay next birth for 2 or more years
4Includes both female and male sterilization
5Includes male sterilization and men who mention in response to the question about desire for children that their wife has been sterilized
( ) Based on 25-49 unweighted cases.

5.3 Page 43

▲back to top


42 | Youth in Bihar and Jharkhand: A Situational Analysis
TABLE 5A:
Desire to limit childbearing
Percentage of currently married women age 15-34 years who want no more children by number of living children,
according to selected background characteristics, Jharkhand, 2005-06, and by number of living children, men age 15-34
Background
characteristic
Age
15-19
20-24
25-29
30-34
Residence
Urban
Rural
Education
No education
<5 years complete
5-9 years complete
10 or more years complete
Religion
Hindu
Muslim
Christian
Other
Caste/tribe
Scheduled caste
Scheduled tribe
Other backward class
Other
Wealth index
Lowest
Second
Middle
Fourth
Highest
Number of living sons3
0
1
2
3
4+
Number of living
daughters3
0
1
2
3
4+
Total (Women age 15-34)
Total (Men age 15-34)
1
4.9
3.8
30.4
(39.4)
18.4
8.4
7.9
*
6.1
26.9
12.9
5.9
*
(2.9)
(10.8)
7.5
6.6
24.5
8.4
(2.5)
(8.3)
(5.0)
30.4
8.8
16.0
na
na
na
16.0
8.8
na
na
na
11.0
7.8
Number of living children1
2
3
(33.3)
*
50.1
71.3
65.5
79.4
79.5
90.7
80.1
48.9
44.1
*
63.6
87.2
58.1
(55.3)
*
(64.3)
40.0
52.9
58.8
77.4
35.9
64.1
82.3
67.6
(89.8)
25.3
63.7
74.2
na
na
96.0
76.9
77.2
(90.0)
85.9
(93.5)
86.7
(69.4)
*
(68.2)
(76.5)
73.7
84.7
(88.0)
74.3
82.0
(84.8)
(91.7)
*
(34.6)
79.2
94.7
(90.9)
na
74.2
(90.9)
63.7
94.7
25.3
79.2
na
(34.6)
na
na
57.5
80.9
53.3
74.9
4+
0.0
(87.1)
88.4
91.1
(98.3)
88.4
88.4
*
(97.0)
*
91.1
88.5
*
(82.9)
(94.9)
85.4
89.5
(95.3)
88.0
91.0
(96.6)
*
*
*
89.0
95.1
98.4
(94.3)
*
100.0
93.4
92.7
72.0
89.7
(87.8)
Total2
7.5
37.1
68.8
79.3
60.7
48.1
51.4
55.9
46.1
51.4
50.8
50.7
57.7
48.1
45.1
47.8
51.9
56.8
45.5
54.9
56.3
58.1
58.0
10.0
56.6
89.3
95.6
93.6
26.5
58.1
69.9
75.5
72.0
50.7
40.8
Note: Women who have been sterilized or whose husbands have been sterilizet are considered to want no more children. Total includes women with missing information on
education, religion, and caste/tribe, who are not shown separately., na: Not applicable ,1Includes current pregnancy of women/wife., 2Includes women and men with no children,
who are not shown separately. ,3Excludes current pregnant women. *Percentage not shown; based on fewer than 25 unweighted cases.
( ) Based on 25-49 unweighted cases.

5.4 Page 44

▲back to top


Youth in Bihar and Jharkhand: A Situational Analysis | 43
TABLE 5B:
Desire to limit childbearing
Percentage of currently married women age 15-34 years who want no more children by number of living children,
according to selected background characteristics, Bihar, 2005-06, and by number of living children, men age 15-34
Background characteristic
Number of living children1
1
2
3
4+
Total2
Age
15-19
20-24
25-29
30-34
4.4
39.4
*
na
7.0
3.2
47.1
67.4
(80.0)
35.1
16.9
57.6
78.3
81.5
66.7
*
84.0
87.9
93.7
84.7
Residence
Urban
Rural
10.3
76.7
89.1
89.3
59.4
6.2
51.4
75.3
86.8
48.1
Education
No education
4.0
42.5
70.4
86.1
48.5
<5 years complete
(3.7)
(65.4)
(78.6)
(79.2)
45.2
5-9 years complete
13.5
64.3
91.9
96.8
52.1
10 or more years complete
10.7
78.5
(90.2)
(96.8)
53.6
Religion
Hindu
Muslim
7.3
59.4
80.6
91.2
51.0
3.0
30.9
56.4
72.8
41.7
Caste/tribe
Scheduled caste
Scheduled tribe
Other backward class
Other
4.6
42.7
69.4
94.2
45.0
*
*
na
*
*
4.6
54.1
79.7
88.0
49.8
16.0
66.2
74.3
75.5
52.6
Wealth index
Lowest
Second
Middle
Fourth
Highest
5.2
40.1
67.7
83.8
45.7
2.3
48.9
70.4
87.3
46.3
6.3
59.1
85.0
87.5
51.5
8.2
59.9
88.4
93.4
55.7
(17.5)
86.9
(90.2)
*
60.5
Number of living sons3
0
1
2
3
4+
5.3
13.5
*
*
3.9
11.0
63.8
66.6
78.4
49.0
na
72.7
91.7
93.6
87.4
na
na
80.8
92.9
89.1
na
na
na
92.0
92.0
Number of living daughters3
0
11.0
72.7
80.8
*
24.3
1
5.3
63.8
91.7
90.6
58.9
2
na
13.5
66.6
94.0
70.2
3
na
na
*
86.2
78.3
4+
na
na
na
75.8
75.8
Total (Women age 15-34)
Total (Men age 15-34)
6.7
55.6
77.1
87.1
49.6
12.9
55.1
83.1
88.9
47.4
Note: Women who have been sterilized or whose husbands have been sterilizet are considered to want no more children. Total includes women from all other religions, and
with missing information on caste/tribe, who are not shown separately., na: Not applicable, 1Includes current pregnancy of women/wife., 2Includes women and men with no
children, who are not shown separately. ,3Excludes current pregnant women.
*Percentage not shown; based on fewer than 25 unweighted cases. ,( ) Based on 25-49 unweighted cases.

5.5 Page 45

▲back to top


44 | Youth in Bihar and Jharkhand: A Situational Analysis
TABLE 6A:
Ideal number of children
Percent distribution of women and men age 15-24 by ideal number of children, and mean ideal number of children, by
number of living children, Jharkhand, 2005-06
Ideal number of children
0
1
2
3
4
5
6+
Non-numeric response
Total percent
Number of women
Mean ideal number
of children for2:
All women
Number
Ever married women
Number
Currently married women
Number
0
1.4
9.3
58.2
21.8
7.4
0.6
0.6
0.7
100.0
647
2.3
643
2.6
182
2.6
175
Ever-married and never married respondents
Number of living children1
1
2
3
4
Women
0.0
0.0
0.0
0.0
4.7
0.9
0.0
0.0
57.2
52.9
26.1
28.2
29.7
36.9
57.3
35.9
7.5
8.8
15.2
31.7
0.4
0.6
1.3
0.0
0.0
0.0
0.0
0.0
0.4
0.0
0.0
4.2
100.0
100.0
100.0
100.0
287
206
91
28
5+
0.0
0.0
33.3
33.3
33.3
0.0
0.0
0.0
100.0
7
2.4
2.6
2.9
3.0
3.0
285
206
91
27
7
2.4
2.6
2.9
3.0
3.0
284
206
91
26
17
2.4
2.5
2.9
3.0
3.0
281
205
91
26
7
Total
0.7
6.0
54.0
29.0
8.9
0.6
0.3
0.6
100.0
1,267
2.4
1,260
2.6
797
2.6
785
Men
0
1
2
3
4
5
6+
Non-numeric response
0.4
0.0
0.0
0.0
5.8
0.0
0.0
0.0
66.6
40.1
51.2
25.0
20.4
40.7
24.4
75.0
4.2
11.5
24.4
0.0
1.3
3.8
0.0
0.0
0.0
0.0
0.0
0.0
1.2
3.8
0.0
0.0
Total percent
100.0
100.0
100.0
100.0
Number of women
281
32
15
5
Mean ideal number
of children for2:
All men
Number
2.3
2.8
2.7
2.8
277
31
15
5
Ever married men
Number
2.3
2.8
2.7
2.8
33
31
15
5
Currently married men
Number
2.3
2.7
2.7
2.8
31
29
15
5
1Includes current pregnancy for women or wife’s current pregnancy for men.
2Means are calculated excluding respondents who gave non-numaric responses.
*Percentage not shown; based on fewer than 25 unweighted cases. , ( ) Based on 25-49 unweighted cases.
(100)
(0.0)
(0.0)
(0.0)
(0.0)
(0.0)
(0.0)
(0.0)
100.0
1
(0.0)
1
(0.0)
1
(0.0)
1
*
0.7
*
4.9
*
62.5
*
23.2
*
5.8
*
1.5
*
0.0
*
1.4
0.0
100.0
0
334
*
2.3
0
329
*
2.5
0
85
*
2.5
0
82

5.6 Page 46

▲back to top


Youth in Bihar and Jharkhand: A Situational Analysis | 45
TABLE 6B:
Ideal number of children
Percent distribution of women and men age 15-24 by ideal number of children, and mean ideal number of children, by
number of living children, Bihar, 2005-06
Ever-married and never married respondents
Ideal number of children
Number of living children1
Total
0
1
2
3
4
5+
Women
0
1
2
3
4
5
6+
Non-numeric response
Total percent
Number of women
Mean ideal number
of children for2:
All women
Number
Ever married women
Number
Currently married women
Number
0.0
2.6
51.7
33.8
10.4
0.4
0.4
0.7
100.0
269
2.4
860
2.6
270
2.6
264
0.0
2.5
51.5
34.2
8.5
1.1
0.8
1.4
100.0
365
2.6
365
2.6
365
2.6
361
0.0
1.8
55.1
32.6
9.3
0.0
1.3
0.0
100.0
227
2.5
227
2.5
227
2.5
225
Men
0.0
0.0
40.0
44.6
10.8
0.8
0.0
3.8
100.0
130
2.9
130
2.9
130
2.9
130
0.0
0.0
42.9
35.7
11.9
2.4
0.0
7.1
100.0
42
3.0
43
3.0
43
3.0
43
0.0
0.0
20.0
60.0
0
20.0
0.0
0
100.0
5
3.3
6
3.3
6
3.3
6
0.3
4.1
53.9
30.4
9.1
0.7
0.4
1.3
100.0
1,038
2.5
1,631
2.6
1,038
2.6
1029
0
1
2
3
4
5
6+
Non-numeric response
Total percent
Number of women
Mean ideal number
of children for2:
All men
Number
Ever married men
Number
Currently married men
Number
4.8
4.8
33.3
38.1
14.3
0.0
0.0
4.8
100.0
42
2.5
352
2.8
41
2.8
41
0.0
5.4
37.8
29.7
21.6
5.4
0.0
0.0
100.0
37
3.0
38
2.8
37
2.8
37
0.0
0.0
46.7
53.3
0.0
0.0
0.0
0.0
100.0
15
2.5
15
2.5
15
2.5
15
0.0
0.0
50.0
50.0
0.0
0.0
0.0
0.0
100.0
4
2.4
4
2.4
4
2.4
4
0.0
0.0
0.0
100
0.0
0.0
0.0
0.0
100.0
3
3.4
4
3.9
4
3.9
4
NA
2.0
NA
4.0
NA
36.6
NA
39.6
NA
13.9
NA
2.0
NA
0.0
NA
2.0
NA
100.0
NA
101
NA
2.5
NA
413
NA
2.7
NA
100
NA
2.7
NA
100
1Includes current pregnancy for women or wife’s current pregnancy for men.
2Means are calculated excluding respondents who gave non-numeric responses., ( ) Based on 25-49 unweighted cases.

5.7 Page 47

▲back to top


46 | Youth in Bihar and Jharkhand: A Situational Analysis
TABLE 7A:
Indicators of sex preference: Women
Mean ideal number of sons, daughters, and children of either sex for ever-married women, percentage who want more
sons than daughters, percentage of women age 15-24 who want more daughters than sons, percentage who want at least
one son, and percentage who want at least one daughter by selected background characteristics, Jharkhand, 2005-06
Background
characteristic
Mean ideal number of:
Sons
Daughters
Either
sex
Percentage
who want
more
sons than
daughters
Percentage
who want
more
daughters
than sons
Percentage
who want
at least
one sons
Percentage
who want
at least
one
daughter
Number
of
women
Age
15-19
20-24
1.0
0.8
0.5
20.6
1.2
0.9
0.5
29.3
3.0
74.3
1.4
78.1
73.5
672
76.0
587
Residence
Urban
Rural
0.8
0.7
0.5
11.5
1.2
0.9
0.5
29.2
3.2
67.3
1.9
79.2
66.7
325
77.4
933
Education
No education
1.3
0.9
0.5
34.6
<5 years complete
1.1
0.8
0.7
28.4
5-9 years complete
1.0
0.8
0.4
19.3
10 or more years
complete
0.7
0.6
0.6
6.7
0.8
80.4
2.1
72.9
4.2
79.7
2.7
60.9
78.6
573
71.6
89
78.2
367
60.1
227
Marital status
Never married
0.9
0.8
0.5
12.3
3.4
70.2
70.0
462
Currently married
1.2
0.9
0.5
32.1
1.4
79.6
77.3
784
Widowed/divorced/
separated/deserted
0.9
0.9
0.3
10.0
10.0
70.0
80.0
11
Religion
Hindu
Muslim
Christian
Other
1.1
0.8
0.5
25.0
1.2
0.9
0.6
25.5
0.9
0.8
0.5
17.6
1.2
1.0
0.4
22.8
2.0
75.4
1.4
77.5
5.9
73.6
4.4
80.2
73.7
908
77.5
183
67.8
40
79.8
123
Caste/tribe
Scheduled caste
1.1
0.9
0.5
27.7
Scheduled tribe
1.2
0.9
0.4
29.8
Other backward class 1.1
0.8
0.5
24.8
Other
0.8
0.7
0.6
12.7
2.6
74.7
72.7
3.0
82.9
81.0
1.8
76.8
75.5
2.1
64.4
64.0
Wealth index
Lowest
Second
Middle
Fourth
Highest
1.2
0.9
0.5
32.3
1.2
0.9
0.4
30.8
1.0
0.8
0.5
17.6
0.8
0.7
0.5
14.3
0.7
0.6
0.5
6.6
2.3
79.0
77.2
1.8
83.9
81.8
1.2
76.4
75.3
2.4
69.9
70.0
3.6
61.6
60.3
Total
1.1
0.8
0.5
24.6
2.2
76.1
74.7
Note: Table excludes women who gave non-numeric response to the questions on ideal number of children or ideal number of sons or daughters.
164
321
576
195
572
200
168
164
154
1,259

5.8 Page 48

▲back to top


Youth in Bihar and Jharkhand: A Situational Analysis | 47
TABLE 7B:
Indicators of sex preference: Women
Mean ideal number of sons, daughters, and children of either sex for ever-married women, percentage who want more
sons than daughters, percentage of women age 15-24 who want more daughters than sons, percentage who want at least
one son, and percentage who want at least one daughter by selected background characteristics, Bihar, 2005-06
Background
characteristic
Age
15-19
20-24
Mean ideal number of:
Sons
Daughters
Either
sex
Percentage
who want
more
sons than
daughters
Percentage
who want
more
daughters
than sons
Percentage
who want
at least
one sons
1.2
0.9
0.4
32.0
1.1
82.9
81.3
1.3
0.9
0.3
36.5
1.3
85.9
80.1
Number
of
women
936
673
Residence
Urban
Rural
0.8
0.7
0.5
15.6
2.3
70.2
69.0
258
1.3
0.9
0.3
37.4
1.0
86.8
83.0
1,352
Education
No education
1.5
1.0
0.3
45.1
1.1
90.4
87.2
803
<5 years complete
1.2
0.9
0.3
36.9
0.0
86.5
79.3
111
5-9 years complete
1.1
0.8
0.4
24.9
1.2
82.6
80.0
426
10 or more years
complete
0.8
0.6
0.5
13.0
2.2
67.0
63.3
269
Marital status
Never married
1.1
0.8
0.4
22.8
1.4
76.5
75.1
583
Currently married
1.4
0.9
0.3
40.0
1.2
88.5
83.9
1,015
Widowed/divorced/
separated/deserted (1.9)
(1.2) (0.7)
(54.5)
(0.0)
(100)
(100)
11
Religion
Hindu
Muslim
1.2
0.9
0.3
32.2
1.4
84.1
80.5
1,317
1.5
1.0
0.4
41.7
0.3
84.2
82.1
291
Caste/tribe
Scheduled caste
1.4
1.0
0.2
41.9
0.7
90.4
86.7
270
Scheduled tribe
*
*
*
*
*
*
*
9
Other backward class 1.3
0.9
0.3
36.0
1.3
84.8
82.0
948
Other
1.0
0.9
0.4
23.0
1.6
77.8
73.4
379
Wealth index
Lowest
Second
Middle
Fourth
Highest
1.4
1.0
0.3
42.1
0.2
86.8
83.1
409
1.5
1.0
0.2
42.1
1.5
90.9
88.1
462
1.2
0.8
0.4
32.2
0.7
83.4
79.0
295
1.1
0.8
0.3
24.5
0.7
82.2
78.1
269
0.7
0.7
0.5
10.3
4.0
64.6
63.2
175
Total
1.3
0.9
0.3
33.9
1.2
84.1
80.8
1,610
Note: Table excludes women who gave non-numeric response to the questions on ideal number of children or ideal number of sons or daughters. Total includes 3 women
belonging to other religions and 8 women with missing information on caste/tribe, which are not shown separately.
( ) Based on 25-49 unweighted cases.

5.9 Page 49

▲back to top


48 | Youth in Bihar and Jharkhand: A Situational Analysis
TABLE 8A:
Indicators of sex preference: Men
Mean ideal number of sons, daughters, and children of either sex for ever-married men, percentage who want more sons
than daughters, percentage of men age 15-24 who want more daughters than sons, percentage who want at least one
son, and percentage who want at least one daughter by selected background characteristics, Jharkhand, 2005-06
Background
characteristic
Mean ideal number of:
Sons Daughters
Either
sex
Percentage Percentage
who want who want
more
more
sons than daughters
daughters than sons
Percentage
who want
at least
one sons
Percentage
who want
at least
one
daughter
Number
of
men
Age
15-19
20-24
0.9
0.8
0.7
16.9
2.7
0.9
0.8
0.6
16.7
4.8
68.1
66.6
183
68.7
69.5
146
Residence
Urban
0.8
Rural
1.0
Education
No education
1.3
<5 years complete
0.9
5-9 years complete
1.0
10 or more years complete 0.6
Marital status
Never married
0.8
Currently married
1.0
Widowed/divorced/
separated/deserted
1.0
Religion
Hindu
0.8
Muslim
1.0
Christian
*
Other
(1.3)
Caste/tribe
Scheduled caste
1.0
Scheduled tribe
1.2
Other backward class
0.8
Other
0.8
Wealth index
Lowest
1.1
Second
1.0
Middle
0.8
Fourth
0.6
Highest
0.7
Total
0.9
0.7
0.5
0.8
0.7
1.0
0.4
0.8
0.8
0.8
0.7
0.6
0.7
0.7
0.7
0.9
0.5
1.0
1.0
0.7
0.7
0.9
0.9
*
*
(1.3) (0.1)
0.7
0.6
1.1
0.2
0.7
0.9
0.7
1.5
1.0
0.5
0.7
0.8
0.7
0.7
0.6
0.9
0.7
0.5
0.8
0.7
9.0
20.7
33.1
13.5
19.4
5.6
14.6
24.1
0.0
15.6
226
*
(16.7)
28.7
18.7
14.7
11.5
22.5
29.2
10.7
9.0
2.7
16.8
1.9
4.5
5.6
7.1
3.1
2.3
3.6
3.9
0.0
2.0
7.1
*
(16.7)
0.0
9.7
2.8
0.0
6.1
2.1
1.6
2.2
2.7
3.6
70.0
69.0
110
68.6
68.0
220
80.2
81.0
66
68.0
68.0
27
71.0
68.0
120
59.0
61.0
116
66.0
65.1
244
77.0
77.5
82
67.0
66.0
4
67.0
66.0
259
62.3
65.1
44
*
*
4
(94.4)
(94.4)
22
69.0
62.1
40
90.0
91.6
76
60.0
59.6
163
64.1
64.1
49
77.0
77.0
120
67.2
65.2
59
68.0
66.3
43
54.0
55.0
55
65.3
65.3
53
68.4
68.0
329
Note: Table excludes men who gave non-numeric response to the questions on ideal number of children or ideal number of sons or daughters. Total includes 1 women
belonging to Sikh and 1 women with missing information on religion and caste/tribe, which are not shown separately.
*Percentage not shown; based on fewer than 25 un weighted cases.
( ) Based on 25-49 un weighted cases.

5.10 Page 50

▲back to top


Youth in Bihar and Jharkhand: A Situational Analysis | 49
TABLE 8B:
Indicators of sex preference: Men
Mean ideal number of sons, daughters, and children of either sex for ever-married men, percentage who want more sons
than daughters, percentage of men age 15-24 who want more daughters than sons, percentage who want at least one
son, and percentage who want at least one daughter by selected background characteristics, Bihar, 2005-06
Mean ideal number of:
Background characteristic
Sons
Daughters
Either
sex
Percentage
who want
more
sons than
daughters
Percentage
who want
more
daughters
than sons
Percentage
who want
at least
one sons
Percentage
who want
at least
one
daughter
Number
of
men
Age
15-19
1.1
20-24
1.2
Residence
Urban
0.8
Rural
1.2
Education
No education
1.3
<5 years complete
1.6
5-9 years complete
1.2
10 or more years complete 0.7
Marital status
Never married
1.0
Currently married
1.4
Widowed/divorced/
separated/deserted
--
Religion
Hindu
1.1
Muslim
1.4
Caste/tribe
Scheduled caste
1.3
Scheduled tribe
*
Other backward class
1.1
Other
1.0
Wealth index
Lowest
1.5
Second
1.3
Middle
1.1
Fourth
0.9
Highest
0.7
Total
1.1
0.7 0.7
29.6
0.8 0.6
32.6
0.7 0.7
18.2
0.7 0.6
35.2
0.7 0.8
47.9
0.6 0.7
56.3
0.8 0.5
34.1
0.7 0.7
11.6
0.7 0.7
26.9
0.8 0.6
43.9
--
--
--
0.7 0.7
30.8
1.0 0.6
33.1
0.6 0.6
40.0
*
*
*
0.7 0.7
30.3
0.7 0.6
23.2
0.6 0.8
52.3
0.8 0.4
37.1
0.7 0.8
28.7
0.7 0.6
23.4
0.6 0.8
9.2
0.7 0.6
31.0
1.8
68.0
3.4
70.2
4.0
61.0
2.0
71.4
0
69.9
0
74.5
3.0
75.6
3.4
60.8
2.3
67.5
2.0
73.5
--
--
1.9
68.0
4.5
75.6
0.0
68.8
*
*
2.9
69.3
2.5
67.1
0
71.9
3.4
76.7
2.1
67.0
4.7
67.2
1.5
56.9
2.4
68.9
58.7
225
65.7
178
57.6
100
63.2
304
56.2
73
54.2
48
69.6
135
60.1
148
60.7
305
65.7
98
--
--
60.4
359
72.7
44
53.8
80
*
4
65.5
239
59.8
81
55.4
65
66.4
116
64.9
94
62.5
64
53.8
65
61.9
404
Note: Table excludes men who gave non-numeric response to the questions on ideal number of children or ideal number of sons or daughters.
*Percentage not shown; based on fewer than 25 unweighted cases.

6 Pages 51-60

▲back to top


6.1 Page 51

▲back to top


50 | Youth in Bihar and Jharkhand: A Situational Analysis
TABLE 9A:
Maternal care indicators
Maternal care indicators for births during the five years preceding the survey among women age 15-24, by residence,
Jharkhand, 2005-06
Indicator
Percentage who received ANC
Percentage who received at least three ANC visits
Percentage who received recommended types of antenatal care1
Percentage of birth delivered in health facilities
Percentage of delivery assisted by health personnel2
Percentage of delivery with a post-natal check up3,4
Percentage of delivery with a post natal check up within two days of birth3
Urban
75.2
62.1
20.1
52.9
59.8
46.5
44.2
Residence
Rural
50.1
21.7
3.5
11.2
12.6
9.6
9.8
Total
60.0
32.6
8.4
15.6
22.5
21.0
14.2
1For the last live birth in the five years preceding the survey, mother received three or more antenatal check-ups (with the first check-up within the first trimester of pregnancy),
received two or more tetanus toxoid injections, and took iron and folic acid tablets or syrup for three or more months.
2 Doctor, auxiliary nurse midwife, nurse, midwife, lady health visitor, or other health personnel.
3Based on the last live birth in the five years preceding the survey.
4Postnatal check-ups are checks on the woman’s health within 42 days of the birth.
TABLE 9B:
Maternal care indicators
Maternal care indicators for births during the five years preceding the survey among women age 15-24, by residence,
Bihar, 2005-06
Indicator
Percentage who received ANC
Percentage who received at least three ANC visits
Percentage who received recommended types of antenatal care1
Percentage of birth delivered in health facilities
Percentage of delivery assisted by health personnel2
Percentage of delivery with a post-natal check up3,4
Percentage of delivery with a post natal check up within two days of birth3
Urban
52.9
32.4
14.7
44.9
57.4
25.0
23.2
Residence
Rural
39.6
19.5
4.0
19.7
31.2
15.5
13.9
Total
40.9
20.7
5.1
22.2
33.8
16.5
14.8
1For the last live birth in the five years preceding the survey, mother received three or more antenatal check-ups (with the first check-up within the first trimester of pregnancy),
received two or more tetanus toxoid injections, and took iron and folic acid tablets or syrup for three or more months.
2 Doctor, auxiliary nurse midwife, nurse, midwife, lady health visitor, or other health personnel.
3Based on the last live birth in the five years preceding the survey.
4Postnatal check-ups are checks on the woman’s health within 42 days of the birth.

6.2 Page 52

▲back to top


Youth in Bihar and Jharkhand: A Situational Analysis | 51
TABLE 10A:
Health problems during pregnancy
Among women age 15-24 who had a live birth in the five years preceding the survey, percentage who had experienced
specific health problems during pregnancy for the most recent birth, by residence, Jharkhand, 2005-06
Problem during pregnancy
Difficulty with vision during daylight
Night blindness
Convulsion not from fever
Swelling on legs, body and face
Excessive fatigue
Vaginal bleeding
Urban
5.2
8.4
11.2
31.0
49.8
3.4
Residence
Rural
11.4
24.1
21.3
29.8
65.7
4.0
Total
7.2
20.3
16.5
25.4
56.9
3.9
Any pregnancy complication
62.5
71.5
68.9
TABLE 10B:
Health problems during pregnancy
Among women age 15-24 who had a live birth in the five years preceding the survey, percentage who had experienced
specific health problems during pregnancy for the most recent birth, by residence, Bihar, 2005-06
Problem during pregnancy
Difficulty with vision during daylight
Night blindness
Convulsion not from fever
Swelling on legs, body and face
Excessive fatigue
Vaginal bleeding
Any pregnancy complication
Number of women
Urban
4.4
5.9
23.5
32.4
75.0
10.3
82.4
68
Residence
Rural
9.4
15.2
20.6
29.2
71.0
2.7
78.6
625
Total
8.9
14.3
20.9
29.5
71.4
3.5
78.9
693

6.3 Page 53

▲back to top


52 | Youth in Bihar and Jharkhand: A Situational Analysis
TABLE 11A:
Male involvement in maternal care
Among men age 15-24 whose youngest living child was age 0-35 months, percentage for whom the youngest child’s
mother received antenatal care, percentage who were present during at least one antenatal care visit, percentage who
were told by a health provider or worker at any time during the pregnancy about specific signs of pregnancy complications,
percentage to whom a health provider or worker spoke about specific aspects of maternal care at any time during the
pregnancy, percentage who did not think ANC care is necessary, and percentage whose youngest child was delivered in
a health facility, and among men with a child age 0-35 months whose youngest living child was not delivered in a health
facility, percentage who were given specific home delivery related information, by residence, Jharkhand, 2005-06
Antenatal/delivery care and information
Urban
Residence
Rural
Total
Percentage of men for whom the youngest child’s mother received antenatal care
Percentage of men who were present at any antenatal care visit
Percentage who were told by a health provider or health worker
about the following signs of pregnancy complications:
Vaginal bleeding
Convulsion
Prolonged labour
Percentage ever told what to do if mother had any pregnancy complication
Percentage of men who did not think ANC care is necessary
Percentage whose youngest child was delivered in a health facility
Percentage to whom a health provider or worker spoke about
the following aspects of maternal care:
The importance of delivering in a health facility
The importance of proper nutrition for the mother during pregnancy
Family planning or delaying his next child
Number of men with a child age 0-35 months
Among men whose last child age 0-35 months was not
delivered in a health facility, percentage who were told the
importance of:
Breastfeeding the baby immediately after birth
Keeping the baby warm immediately after birth
Cleanliness at the time of delivery
Using a new or unused blade to cut the cord
Number of men whose last child age 0-35 months was not
delivered in a health institution
( ) Based on 25-49 unweighted cases.
*Percentage not shown; based on fewer than 25 unweighted cases.
(90.0)
(80.0)
(0.0)
(10.0)
(10.0)
(20.0)
(10.0)
(50.0)
(10.0)
(30.0)
(10.0)
7
*
*
*
*
4
38.5
47.8
34.6
42.8
11.5
9.5
11.5
11.3
3.8
5.0
23.1
22.5
26.9
23.9
19.2
24.8
23.1
20.7
30.8
30.6
23.1
20.7
32
39
38.1
33.5
38.1
33.5
52.4
48.5
71.4
65.3
26
30

6.4 Page 54

▲back to top


Youth in Bihar and Jharkhand: A Situational Analysis | 53
TABLE 11B:
Male involvement in maternal care
Among men age 15-24 whose youngest living child was age 0-35 months, percentage for whom the youngest child’s
mother received antenatal care, percentage who were present during at least one antenatal care visit, percentage who
were told by a health provider or worker at any time during the pregnancy about specific signs of pregnancy complications,
percentage to whom a health provider or worker spoke about specific aspects of maternal care at any time during the
pregnancy, percentage who did not think ANC care is necessary, and percentage whose youngest child was delivered in
a health facility, and among men with a child age 0-35 months whose youngest living child was not delivered in a health
facility, percentage who were given specific home delivery related information, by residence, Bihar, 2005-06
Antenatal/delivery care and information
Urban
Residence
Rural
Total
Percentage of men for whom the youngest child’s mother received
antenatal care
(57.1)
26.7
28.6
Percentage of men who were present at any antenatal care visit
(28.6)
16.7
17.4
Percentage who were told by a health provider or health worker about
the following signs of pregnancy complications:
Vaginal bleeding
(57.1)
10.0
13.0
Convulsion
(57.1)
10.0
13.0
Prolonged labour
(57.1)
16.7
19.3
Percentage ever told what to do if mother had any pregnancy
(57.1)
10.0
13.0
complication
Percentage of men who did not think ANC care is necessary
Percentage whose youngest child was delivered in a health facility
(28.6)
40.0
39.3
(14.3)
26.7
25.9
Percentage to whom a health provider or worker spoke about
the following aspects of maternal care:
The importance of delivering in a health facility
The importance of proper nutrition for the mother during pregnancy
Family planning or delaying his next child
(57.1)
(71.4)
(42.9)
20.0
26.7
6.7
22.4
29.5
9.0
Number of men with a child age 0-35 months
Among men whose last child age 0-35 months was not
delivered in a health facility, percentage who were told the
importance of:
Breastfeeding the baby immediately after birth
Keeping the baby warm immediately after birth
Cleanliness at the time of delivery
Using a new or unused blade to cut the cord
Number of men whose last child age 0-35 months was not
delivered in a health institution
( ) Based on 25-49 unweighted cases.
*Percentage not shown; based on fewer than 25 unweighted cases.
3
47
50
*
9.1
14.6
*
13.6
18.8
*
36.4
39.8
*
40.9
44.1
3
34
37

6.5 Page 55

▲back to top


54 | Youth in Bihar and Jharkhand: A Situational Analysis
TABLE 12A:
Knowledge of contraceptive methods
Percentage of all women and men age 15-24, currently married women and men, and never married women and men who
know any contraceptive method, by specific method and residence, Jharkhand, 2005-06
Method
Any method
Any modern method
Female sterilization
Male sterilization
Pill
IUD
Injectables
Condom/Nirodh
Female condom
Emergency contraception
Other modern method
Pill, IUD, and condom1
Any traditional method
Rhythm
Withdrawal
Folk method
Number of respondents
Any method
Any modern method
Female sterilization
Male sterilization
Pill
IUD
Injectables
Condom/Nirodh
Female condom
Emergency contraception
Other modern method
Pill, IUD, and condom1
Any traditional method
Rhythm
Withdrawal
Folk method
Number of respondents
Any method
Any modern method
Female sterilization
Male sterilization
Pill
IUD
Injectables
Condom/Nirodh
Female condom
Emergency contraception
Other modern method
Pill, IUD, and condom1
Any traditional method
Rhythm
Withdrawal
Folk method
Number of respondents
1All three methods.
All
women
98.8
98.8
96.5
85.9
95.2
79.9
59.4
89.0
9.9
6.4
0.1
77.3
52.2
45.4
37.9
2.0
562
90.6
89.7
86.1
58.7
70.4
38.6
30.9
50.2
3.8
5.3
0.0
31.9
44.6
28.2
28.9
10.2
1,628
92.7
92.0
88.8
65.7
76.8
49.2
38.2
60.2
5.4
5.6
0.0
43.5
46.6
32.6
31.2
8.1
2,191
Women
Currently
married
women
Never married
women
Urban
99.4
97.7
99.4
97.7
98.0
94.2
93.3
73.7
96.1
93.8
88.6
65.6
68.0
45.1
92.5
83.4
11.0
8.1
9.6
1.6
0.2
0.0
86.8
62.0
73.3
18.2
64.6
14.3
58.0
5.8
2.6
0.6
341
214
Rural
94.2
77.3
93.1
76.9
89.9
71.9
64.0
38.4
74.4
57.0
42.3
25.6
34.0
19.4
53.4
40.5
3.7
5.0
6.3
1.7
0.0
0.0
35.4
19.4
52.8
12.4
33.7
7.9
35.2
3.7
11.8
3.3
1,291
288
Total
95.3
86.0
94.4
85.7
91.6
81.4
70.1
53.5
78.9
72.7
52.0
42.6
41.1
30.4
61.6
58.8
5.2
6.3
7.0
1.6
0.0
0.0
46.1
37.6
57.1
14.9
40.1
10.6
40.0
4.6
9.9
2.2
1,632
502
All men
98.1
98.1
89.9
85.5
85.5
55.3
54.7
96.9
22.6
6.9
0.0
54.7
14.5
10.7
6.9
1.9
112
90.1
90.1
69.1
57.5
68.5
16.6
29.3
81.2
9.9
6.1
0.0
15.5
18.2
8.8
13.3
0.0
222
92.7
92.7
76.0
66.8
74.2
29.5
37.8
86.4
14.2
6.4
0.0
28.6
17.0
9.5
11.1
0.6
334
Men
Currently Never married
married men
men
100.0
97.9
100.0
97.9
100.0
89.0
92.3
84.9
84.6
85.6
69.2
54.1
53.8
54.8
100.0
96.6
30.8
21.9
7.7
6.8
0.0
0.0
69.2
53.4
38.5
12.3
23.1
9.6
23.1
5.5
7.7
1.4
10
102
88.3
90.7
88.3
90.7
68.3
69.5
61.7
55.1
65.0
70.3
20.0
14.4
30.0
28.8
80.0
82.2
8.3
10.2
8.3
5.1
0.0
0.0
23.3
13.6
13.3
14.4
15.0
5.9
0.0
11.0
0.0
0.0
74
145
89.6
93.7
89.6
93.7
71.8
77.6
65.0
67.5
67.2
76.7
25.4
30.9
32.6
39.6
82.2
88.2
10.8
15.0
8.3
5.8
0.0
0.0
23.9
30.1
25.0
13.5
14.4
7.4
15.9
8.7
0.8
0.6
83
247

6.6 Page 56

▲back to top


Youth in Bihar and Jharkhand: A Situational Analysis | 55
TABLE 12B:
Knowledge of contraceptive methods
Percentage of all women and men age 15-24, currently married women and men, and never married women and men who
know any contraceptive method, by specific method and residence, Bihar, 2005-06
Method
Any method
Any modern method
Female sterilization
Male sterilization
Pill
IUD
Injectables
Condom/Nirodh
Female condom
Emergency contraception
Other modern method
Pill, IUD, and condom1
Any traditional method
Rhythm
Withdrawal
Folk method
Number of respondents
Any method
Any modern method
Female sterilization
Male sterilization
Pill
IUD
Injectables
Condom/Nirodh
Female condom
Emergency contraception
Other modern method
Pill, IUD, and condom1
Any traditional method
Rhythm
Withdrawal
Folk method
Number of respondents
Any method
Any modern method
Female sterilization
Male sterilization
Pill
IUD
Injectables
Condom/Nirodh
Female condom
Emergency contraception
Other modern method
Pill, IUD, and condom1
Any traditional method
Rhythm
Withdrawal
Folk method
Number of respondents
All
women
99.2
99.2
98.5
85.4
95.4
79.2
63.3
85.3
13.1
9.6
0.0
74.1
46.7
35.4
24.2
9.7
260
99.2
99.2
99.1
85.2
92.2
64.7
55.2
69.8
3.5
2.2
0.1
54.5
45.2
26.3
28.1
11.5
1,371
99.2
99.2
99.0
85.2
92.7
67.0
56.5
72.3
5.0
3.4
0.1
57.6
45.5
27.8
27.5
11.2
1.631
Women
Currently
Never married
married women
women
100.0
100.0
100.0
88.7
96.2
84.0
67.3
83.2
10.4
11.3
0.0
Urban
98.7
98.7
97.4
82.9
94.7
76.2
60.5
86.8
14.5
8.6
0.0
78.3
71.7
76.4
26.3
56.1
20.4
50.9
5.9
14.2
6.6
106
100.0
100.0
100.0
87.9
95.0
70.7
60.9
75.3
3.8
2.4
0.1
152
Rural
97.5
97.5
97.3
79.5
86.5
53.0
43.8
59.6
3.2
1.8
0.0
All men
99.0
99.0
95.0
90.1
87.1
39.6
35.0
97.0
14.9
12.9
0.0
44.4
31.7
16.8
27.7
1.0
101
97.1
97.1
91.6
80.7
73.6
34.9
42.4
91.0
15.4
10.9
0.0
60.5
43.3
33.8
60.6
13.2
31.4
36.3
5.7
16.8
40.0
3.2
27.7
13.5
7.5
1.6
923
438
312
Total
100.0
100.0
100.0
87.9
95.1
72.1
61.6
76.1
4.5
3.3
0.1
62.3
62.2
38.3
41.1
13.6
1,029
97.8
97.6
97.8
97.6
97.3
92.5
80.4
83.0
88.6
76.9
58.9
34.9
48.1
92.5
66.6
93.4
6.1
15.3
3.6
11.4
0.0
0.0
50.6
35.2
16.6
19.1
9.5
25.3
3.9
35.0
7.3
1.5
590
412
Men
Currently
married men
100.0
100.0
100.0
90.0
90.0
40.0
20.0
100
10.0
0.0
0.0
40.0
50.0
20.2
40.4
0.0
10
97.8
97.8
94.4
90.0
78.9
36.7
46.7
94.4
15.6
17.8
0.0
36.7
43.3
32.6
27.8
3.3
90
98.0
98.0
95.0
90.0
80.0
37.0
44.0
95.0
15.0
16.0
0.0
37.0
44.0
31.3
29.0
3.0
100
Never married
men
98.9
98.9
95.6
90.1
86.8
39.6
37.4
96.7
15.4
13.2
0.0
39.6
29.7
16.5
26.4
1.1
91
96.4
96.4
90.1
77.0
71.2
34.2
32.1
89.6
15.3
8.6
0.0
32.9
27.1
14.9
24.4
0.9
222
97.1
97.1
91.7
80.8
75.7
35.8
33.7
91.7
15.3
19.9
0.0
34.8
27.9
15.3
25.0
1.0
331
1All three methods.

6.7 Page 57

▲back to top


56 | Youth in Bihar and Jharkhand: A Situational Analysis
TABLE 13A:
Ever use of contraception
Percentage of currently married women age 15-24 who have ever used any contraceptive method currently by specific
method, according to age and residence, Jharkhand, 2005-06
Method
Any method
Any modern method
Female sterilization
Male sterilization
Pill
IUD
Injectables
Condom/Nirodh
Other modern method
Any traditional method
Rhythm
Withdrawal
Folk method
Number of respondents
Any method
Any modern method
Female sterilization
Male sterilization
Pill
IUD
Injectables
Condom/Nirodh
Other modern method
Any traditional method
Rhythm
Withdrawal
Folk method
Number of respondents
Any method
Any modern method
Female sterilization
Male sterilization
Pill
IUD
Injectables
Condom/Nirodh
Other modern method
Any traditional method
Rhythm
Withdrawal
Folk method
Number of respondents
15-19
(15.9)
(15.9)
(0.0)
(0.0)
(4.5)
(0.0)
(0.0)
(13.6)
(0.0)
(0.0)
(0.0)
(0.0)
(0.0)
31
13.1
7.9
0.0
0.0
2.2
0.4
0.0
5.7
0.0
7.0
4.4
3.9
0.0
273
13.4
8.7
0.0
0.0
2.4
0.4
0.0
6.5
0.0
6.3
3.9
3.5
0.0
303
Urban
Rural
Total
Age
20-24
56.2
46.6
10.3
0.0
17.8
3.4
0.7
27.4
0.0
19.2
12.3
10.3
0.7
101
29.2
23.9
8.1
0.3
12.4
0.9
0.0
7.8
0.0
9.0
5.0
5.9
0.6
384
34.8
28.7
8.5
0.2
13.5
1.5
0.1
11.9
0.0
11.1
6.5
6.8
0.6
485
Total
46.8
39.5
7.9
0.0
14.7
2.6
0.5
24.2
0.0
14.7
9.5
7.9
0.5
132
22.5
17.2
4.7
0.2
8.2
0.7
0.0
6.9
0.0
8.2
4.7
5.1
0.4
656
26.6
21.0
5.3
0.2
1.0
1.0
0.1
9.8
0.0
9.3
5.5
5.6
0.4
788
( ) Based on 25-49 unweighted cases.

6.8 Page 58

▲back to top


Youth in Bihar and Jharkhand: A Situational Analysis | 57
TABLE 13B:
Ever use of contraception
Percentage of currently married women age 15-24 who have ever used any contraceptive method currently by specific
method, according to age and residence, Bihar, 2005-06
Method
15-19
Age
20-24
Total
Urban
Any method
(16.7)
37.8
33.0
Any modern method
(8.3)
24.4
20.8
Female sterilization
(0.0)
4.9
3.8
Male sterilization
(0.0)
0.0
0.0
Pill
(0.0)
8.5
6.6
IUD
(0.0)
1.2
0.9
Injectables
(0.0)
0.0
0.0
Condom/Nirodh
(4.2)
14.8
12.4
Other modern method
(0.0)
0.0
0.0
Any traditional method
(8.3)
18.3
16.0
Rhythm
(8.0)
15.9
14.0
Withdrawal
(4.0)
3.7
3.8
Folk method
(0.0)
0.0
0.0
Number of respondents
24
82
106
Rural
Any method
8.6
26.0
18.5
Any modern method
4.7
19.6
13.1
Female sterilization
0.0
9.2
5.2
Male sterilization
0.0
0.2
0.1
Pill
1.0
6.1
6.1
IUD
0.0
1.1
0.7
Injectables
0.0
0.6
0.3
Condom/Nirodh
4.2
5.8
5.1
Other modern me
0.0
0.0
0.0
Any traditional method
4.5
8.2
6.6
Rhythm
3.5
5.0
4.3
Withdrawal
1.7
3.3
2.6
Folk method
0.0
0.6
0.3
Number of respondents
401
522
923
Any method
Any modern method
Female sterilization
Male sterilization
Pill
IUD
Injectables
Condom/Nirodh
Other modern method
Any traditional method
Rhythm
Withdrawal
Folk method
Number of respondents
Total
9.2
27.6
5.1
20.3
0.1
8.8
0.0
0.2
1.1
6.4
0.1
1.1
0.0
0.5
4.2
7.1
0.0
0.0
4.8
9.6
3.6
6.5
1.8
3.3
0.0
0.5
426
603
20.0
14.0
5.2
0.1
4.2
0.6
0.3
5.9
0.0
7.6
3.5
1.9
0.3
1,029
( ) Based on 25-49 unweighted cases.

6.9 Page 59

▲back to top


58 | Youth in Bihar and Jharkhand: A Situational Analysis
TABLE 14A:
Current use of contraception by residence
Percent distribution of currently married women and men age 15-24 by contraceptive method currently used, according
to residence, Jharkhand, 2005-06
Method
Any method
Any modern method
Female sterilization
Male sterilization
Pill
IUD
Condom/Nirodh
Other modern method
Any traditional method
Rhythm
Withdrawal
Folk method
Not using
Total
Number of women
Urban
35.8
27.9
7.9
0.0
6.3
0.0
13.7
0.0
7.9
4.2
3.7
0.0
64.2
100.0
132
Women
Residence
Rural
11.4
9.3
4.7
0.2
2.4
0.2
1.8
0.0
2.2
1.1
0.9
0.2
88.6
100.0
656
Total
15.5
12.4
5.3
0.2
3.0
0.2
3.8
0.0
3.1
1.6
1.4
0.2
84.5
100.0
788
Any method
Any modern method
Female sterilization
Male sterilization
Pill
IUD
Condom/Nirodh
Other modern method
Any traditional method
Rhythm
Withdrawal
Folk method
Not using
Total
Number of men
23.1
23.1
0..0
1.0
7.1
0.0
23.1
1.0
0.0
0.0
00
0.0
76.9
100.0
9
Men
3.3
3.3
1.7
0.0
0.0
0.0
1.7
0.0
0.0
0.0
0.0
0.0
96.7
100.0
74
5.5
5.5
1.5
0.0
4.0
0.0
0.0
0.0
0.0
0.0
0.0
0.0
94.5
100.0
83
Note: If more than one method is used, only the most effective method is considered in this tabulation

6.10 Page 60

▲back to top


Youth in Bihar and Jharkhand: A Situational Analysis | 59
TABLE 14B:
Current use of contraception by residence
Percent distribution of currently married women and men age 15-24 by contraceptive method currently used, according
to residence, Bihar, 2005-06
Modern method
Any method
Any modern method
Female sterilization
Male sterilization
Pill
IUD
Injectables
Condom/Nirodh
Other modern method
Any traditional method
Rhythm
Withdrawal
Folk method
Not using
Total
Number of women
Urban
19.2
12.3
4.6
0.0
1.9
0.8
0.0
5.0
0.0
6.9
5.8
1.2
0.0
80.8
100.0
86
Women
Residence
Rural
11.8
9.0
5.2
0.1
1.0
0.3
0.0
2.2
0.0
2.8
1.6
1.2
0.0
88.2
100.0
923
Total
12.6
9.3
5.2
0.1
1.1
0.3
0.0
2.5
0.0
3.3
2.1
1.2
0.0
87.4
100.0
1,029
Any method
Any modern method
Female sterilization
Male sterilization
Pill
IUD
Injectables
Condom/Nirodh
Other modern method
Any traditional method
Rhythm
Withdrawal
Folk method
Not using
Total
Number of women
Men
0.0
3.4
0.0
1.7
0.0
0.0
0.0
0.0
0.0
0.0
0.0
0.0
0.0
0.0
0.0
1.7
0.0
0.0
0.0
1.7
0.0
1.7
0.0
0.0
100.0
100.0
10
0.0
0.0
96.6
100.0
90
3.1
1.6
0.0
0.0
0.0
0.0
0.0
1.6
0.0
1.6
1.6
0.0
0.0
96.9
100.0
100
Note: If more than one method is used, only the most effective method is considered in this tabulation

7 Pages 61-70

▲back to top


7.1 Page 61

▲back to top


60 | Youth in Bihar and Jharkhand: A Situational Analysis
TABLE 15A:
Source of modern contraceptive methods
Percent distribution of current users age 15-24 years of modern contraceptive methods by most recent source of the
method, according to specific method, Jharkhand, 2005-06
Most recent source of method Female
sterilization
Contraceptive method
Male
Pill
IUD
sterilization
Condom
All modern
methods1
Public medical sector
Government/ municipal hospital
33.6
Government dispensary
1.7
CHC/ Rural hospital/ PHC
29.7
Sub-centre/ ANM
2.9
Camp
4.6
Anganwadi/ ICDS Centre
0.0
Other public medical sector
0.0
NGO or trust hospital/clinic
0.0
*
*
0.0
*
0.0
*
2.8
*
0.0
*
0.0
*
2.8
*
0.0
*
0.0
*
*
2.3
16.1
*
0.0
0.7
*
2.3
13.9
*
0.0
1.2
*
0.0
1.9
*
4.0
1.9
*
0.0
0.0
*
0.0
0.0
Private medical sector
Private hospital
21.8
Private doctor/clinic
5.8
Vaidya/ Hakim/ Homeopath
0.0
Pharmacy/ Drugstore
0.0
Other private medical
0.0
Other source
0.0
Shop
0.0
Husband
0.0
Friend/Relative
0.0
Other
0.0
*
*
0.0
*
9.7
*
0.0
*
41.3
*
32.8
*
*
7.7
*
2.8
*
0.0
*
0.0
*
*
0.0
9.2
*
0.0
6.1
*
0.0
0.0
*
44.4
23.8
*
17.2
13.4
*
*
2.3
2.6
*
19.5
6.7
*
0.0
1.2
*
4.0
1.2
Do not know/missing
Total percent
0.7
100.0
*
100.0
1.7
100.0
*
100.0
4.0
100.0
1.2
100.0
Number of users
41
1
25
1
30
98
Note: All information in this table is based on women's reports. Table includes all users of modern contraceptive methods regardless of their marital status.
CHC = Community health centre; PHC = Primary health centre; ANM = Auxiliary nurse midwife;
NGO = Nongovernmental organization
* Percentage not shown; based on fewer than 25 unweighted cases.
1Includes users of injectables, who are not shown separately.

7.2 Page 62

▲back to top


Youth in Bihar and Jharkhand: A Situational Analysis | 61
TABLE 15B:
Source of modern contraceptive methods
Percent distribution of current users age 15-24 years of modern contraceptive methods by most recent source of the
method, according to specific method, Bihar, 2005-06
Most recent source of method Female
sterilization
Public medical sector
51.1
Government/ municipal hospital
38.9
Government dispensary
0.6
CHC/ Rural hospital/ PHC
6.3
Sub-centre/ ANM
0.0
Government mobile clinic
0.1
Camp
4.6
Other public medical sector
0.6
Contraceptive method
Male
Pill
IUD
sterilization
*
(0.0)
*
*
(0.0)
*
*
(0.0)
*
*
(0.0)
*
*
(0.0)
*
*
(0.0)
*
*
(0.0)
*
*
(0.0)
*
Condom
12.2
5.3
1.6
0.0
5.3
0.0
0.0
0.0
All modern
methods1
32.4
24.7
0.4
2.9
1.4
0.1
2.9
0
NGO or trust hospital/clinic
0.0
*
(0.0)
*
0.0
0.0
Private medical sector
48.2
Private hospital
22.5
Private doctor/clinic
25.7
Pharmacy/ Drugstore
0.0
Other private medical
0.0
*
57.7
*
(3.5)
*
(27.1)
*
(27.1)
*
(0.0)
*
*
0.0
22.7
*
5.3
14.1
*
43.4
15.1
*
5.3
10.0
Other source
Shop
Husband
Friend/Relative
Other
0.4
*
29.8
*
0.0
*
(0.0)
*
0.0
0.0
0.0
*
(18.0)
*
28.5
10.0
0.0
*
(11.8)
*
0.0
1.4
0.4
*
(0.0)
*
5.3
1.4
Do not know/missing
0.0
*
(11.8)
*
0.0
1.4
Total percent
100.0
100.0
100.0
100.0
100.0
100.0
Number of users
53
1
12
4
26
96
Note: All information in this table is based on women's reports. Table includes all users of modern contraceptive methods regardless of their marital status.
CHC = Community health centre; PHC = Primary health centre; ANM = Auxiliary nurse midwife;
NGO = Nongovernmental organization
( ) Based on 25-49 unweighted cases.
* Percentage not shown; based on fewer than 25 unweighted cases.
1Includes users of injectables, who are not shown separately.

7.3 Page 63

▲back to top


62 | Youth in Bihar and Jharkhand: A Situational Analysis
TABLE 16A:
Informed choice
Among women who are current users of selected modern contraceptive methods who started the last episode of use
within the five years preceding the survey, the percentage who were informed about possible side effects or problems of
that method, the percentage who were informed about what to do if they experienced side effects, and the percentage
who were informed about other methods they could use, by method and initial source of method, Jharkhand, 2005-06
Method/Source
Percentage who were
informed about side
effects or problems of
method used
Percentage who were
informed about what
to do if experienced
side effects
Percentage who were
informed by a health
or family planning
worker about other
methods that could
be used
Number of women
Method
Female sterilization1
8.8
5.9
9.3
41
Pill
5.0
2.9
18.7
24
IUD
0.0
0.0
0.0
1
Initial source of
method2
Public medical sector
11.7
6.1
8.4
31
Private medical sector
3.6
3.6
15.0
33
Total
7.3
4.7
12.5
66
Note: Table includes only the contraceptive methods separately shown and excludes users who obtained their method from friends/relatives. Total includes women who
reported the initial source of the method as nongovernmental organization, who are not shown separately.
1Among women who were sterilized in the five years preceding the survey.
2Source at start of current episode of use.
TABLE 16B:
Informed choice
Among women who are current users of selected modern contraceptive methods who started the last episode of use
within the five years preceding the survey, the percentage who were informed about possible side effects or problems of
that method, the percentage who were informed about what to do if they experienced side effects, and the percentage
who were informed about other methods they could use, by method and initial source of method, Bihar, 2005-06
Method/Source
Percentage who were
informed about side
effects or problems of
method used
Percentage who were
informed about what
to do if experienced
side effects
Percentage who were
informed by a health
or family planning
worker about other
methods that could
be used
Number of women
Method
Female sterilization1
2.7
Pill
*
IUD
*
*
23.7
52
*
*
7
*
*
4
Initial source of
method2
Public medical sector
11.0
5.5
22.0
25
Private medical sector
3.7
3.7
31.6
37
Total
6.7
4.4
27.7
62
Note: Table includes only the contraceptive methods separately shown and excludes users who obtained their method from friends/relatives. Total includes women who
reported the initial source of the method as nongovernmental organization, who are not shown separately.
* Percentage not shown; based on fewer than 25 unweighted cases.
1Among women who were sterilized in the five years preceding the survey.
2Source at start of current episode of use.

7.4 Page 64

▲back to top


Youth in Bihar and Jharkhand: A Situational Analysis | 63
TABLE 17A:
Exposure to family planning messages
Percentage of women and men age 15-24 who heard or saw a family planning message on radio, television, in a newspaper
or magazine, or on a wall painting or hoarding in the past few months, according to residence, Jharkhand, 2005-06
Exposure to mass media
Radio
Television
News Paper or magazine
Wall painting and hoarding
None of these media sources
Number of respondents
Urban
17.3
78.9
35.8
42.4
15.8
326
Women
Rural
16.6
18.4
7.8
18.6
64.7
941
Total
16.8
33.9
15.0
24.7
52.1
1,267
Urban
27.0
75.5
52.8
51.6
-
112
Men
Rural
31.5
22.1
22.7
42.0
-
222
Total
30.0
39.9
32.7
45.2
-
334
TABLE 17B:
Exposure to family planning messages
Percentage of women and men age 15-24 who heard or saw a family planning message on radio, television, in a newspaper
or magazine, or on a wall painting or hoarding in the past few months, according to residence, Bihar, 2005-06
Exposure to mass media
Radio
Television
News Paper or magazine
Wall painting and hoarding
None of these media sources
Urban
39.8
68.7
39.0
34.4
21.6
Women
Rural
45.3
20.0
10.8
14.2
50.0
Total
44.4
27.7
15.3
17.4
45.5
Urban
55.4
65.3
57.4
63.4
-
Men
Rural
64.1
31.8
33.3
37.3
-
Total
62.0
40.0
33.3
37.3
-
Number of respondents
259
1,371
1,630
101
312
413
TABLE 18A:
Men’s contraception-related perceptions and knowledge
Percentage of men age 15-24 who agree with two specific statements about women and contraception and say that a
woman who is breastfeeding cannot become pregnant, and percent distribution of men according to their belief about
the efficacy of condoms in preventing pregnancy, by residence, Jharkhand, 2005-06
Perception and knowledge about contraception
Percentage of men who agree:
Contraception is women’s business and a man should not worry about it
Women who use contraception may become promiscuous
A woman who is breast feeding can not become pregnant
Percentage of men who say that if a male condom is used
correctly, it protects against pregnancy:
Most of the time
Sometimes
Not at all
Don’t know/unsure
Total
Number of men
Urban
12.6
8.2
29.6
70.4
12.6
1.3
15.7
100.0
112
Residence
Rural
13.8
19.9
28.7
60.2
5.0
3.3
31.5
100.0
222
Total
13.4
16.0
29.0
63.6
7.5
2.6
26.2
100.0
334

7.5 Page 65

▲back to top


64 | Youth in Bihar and Jharkhand: A Situational Analysis
TABLE 18B:
Men’s contraception-related perceptions and knowledge
Percentage of men age 15-24 who agree with two specific statements about women and contraception and say that a
woman who is breastfeeding cannot become pregnant, and percent distribution of men according to their belief about
the efficacy of condoms in preventing pregnancy, by residence, Bihar, 2005-06
Perception and knowledge about contraception
Percentage of men who agree:
Contraception is women’s business and a man should not worry about it
Women who use contraception may become promiscuous
A woman who is breast feeding can not become pregnant
Urban
54.5
23.8
44.6
Residence
Rural
44.9
28.3
40.7
Total
47.2
27.2
41.6
Percentage of men who say that if a male condom is used
correctly, it protects against pregnancy:
Most of the time
Sometimes
Not at all
Don’t know/unsure
Total
Number of men
63.0
21.0
1.0
15.0
100.0
100
52.2
17.9
4.5
25.3
100.0
313
54.9
18.8
3.6
22.8
100.0
413
TABLE 19A:
Need for family planning among currently married women
Percentage of currently married women age 15-24 with unmet need for family planning, by residence, Jharkhand, 2005-06
Unmet need for family
planning
Urban
Residence
Rural
Total
For spacing
18.9
For limiting
7.9
Total
26.8
Number of women
132
26.9
25.5
7.3
7.4
34.1
32.9
656
788
TABLE 19B:
Need for family planning among currently married women
Percentage of currently married women age 15-24 with unmet need for family planning, by residence, Bihar, 2005-06
Unmet need for family
planning
Urban
Residence
Rural
Total
For spacing
18.7
For limiting
12.1
Total
30.2
Number of women
106
25.8
25.0
5.5
6.2
31.3
31.2
923
1,029

7.6 Page 66

▲back to top


Youth in Bihar and Jharkhand: A Situational Analysis | 65
TABLE 20A:
Age at first sexual intercourse
Percentage of women age 15-24 and men age 15-24 who had first sexual intercourse by specific exact ages, percentage
who never had intercourse, according to current age, Jharkhand, 2005-06
Current age
15
Percentage who had first sexual intercourse
by exact age:
18
20
21
22
Percentage
who never Number of
25
had sexual respondents
intercourse
Women
15-19
20-24
17.5
NA
NA
NA
NA
NA
54.4
19.5
56.8
72.6
NA
NA
NA
15.4
Total (15-24)
18.4
48.2
57.8
60.6
61.1
61.7
22.5
677
590
1,267
Men
15-19
20-24
1.3
NA
NA
NA
NA
NA
83.4
186
3.3
16.7
35.4
NA
NA
NA
44.5
148
Total (15-24)
2.2
14.4
25.0
27.8
31.4
33.9
66.1
334
NA = Not applicable due to censoring
TABLE 20B:
Age at first sexual intercourse
Percentage of women age 15-24 and men age 15-24 who had first sexual intercourse by specific exact ages, percentage
who never had intercourse, according to current age, Bihar, 2005-06
Current age
Percentage who had first sexual intercourse
by exact age:
15
18
20
21
22
Women
Percentage
who never
had sexual
intercourse
Number of
respondents
15-19
20-24
16.6
41.4
45.7
45.7
45.7
54.2
946
17.7
58.7
78.3
84.2
85.8
11.1
685
Total (15-24)
17.1
48.7
59.4
61.9
62.5
36.1
1,631
Men
15-19
20-24
3.1
7.9
13.6
13.6
13.6
86.5
228
3.8
14.6
34.6
43.5
50.0
44.3
185
Total (15-24)
3.4
10.9
23.0
26.9
29.9
6734
413
NA = Not applicable due to censoring

7.7 Page 67

▲back to top


66 | Youth in Bihar and Jharkhand: A Situational Analysis
TABLE 21A:
Condom use at first sexual intercourse among youth
Among women and men age 15-24 who have ever had sexual intercourse, percentage who used a condom the first time
they had sexual intercourse, by selected characteristics, Jharkhand, 2005-06
Characteristic
Women age 15-24
Percentage who used
a condom at first
sexual intercourse
Number of women
who have ever had
sexual intercourse
Men age 15-24
Percentage who used Number of men who
a condom at first have ever had sexual
sexual intercourse
intercourse
Age
15-19
20-24
Residence
Urban
Rural
Total
2.4
309
(11.5)
31
2.2
499
6.6
82
2.1
133
2.3
674
2.3
808
*
16
3.8
97
7.6
113
* Percentage not shown; based on fewer than 25 unweighted cases.
( ) Based on 25-49 unweighted cases.
TABLE 21B:
Condom use at first sexual intercourse among youth
Among women and men age 15-24 who have ever had sexual intercourse, percentage who used a condom the first time
they had sexual intercourse, by selected characteristics, Bihar, 2005-06
Characteristic
Age
15-19
20-24
Women age 15-24
Percentage who used
a condom at first
sexual intercourse
Number of women
who have ever had
sexual intercourse
Men age 15-24
Percentage who used Number of men who
a condom at first have ever had sexual
sexual intercourse
intercourse
1.4
434
(6.9)
31
0.7
609
10.2
103
Residence
Urban
Rural
3.8
109
0.6
934
*
19
6.8
115
Total
0.9
1,043
8.5
133
* Percentage not shown; based on fewer than 25 unweighted cases.
( ) Based on 25-49 unweighted cases.

7.8 Page 68

▲back to top


Youth in Bihar and Jharkhand: A Situational Analysis | 67
TABLE 22A:
Attitudes toward family life education in school: Women
Percentage of women age 15-24 who agree that specific topics on family life education should be taught in school to
girls and to boys, and percent distribution of those who agree that a specific topic should be taught in school by the age
at which they believe that the topic should first be taught in school, Jharkhand, 2005-06
Topic should be taught in school
Moral
values
Topics
Changes
in boys’
bodies
at
puberty
Changes in
girls’ bodies
at puberty
including
menstruation
Sex and
sexual
behaviour
Contra-
ception
HIV/
AIDS
Condom
use to avoid
sexually
transmitted
diseases
Percentage who say that the topic
should be taught in school to girls 99.2
Number of women
1,267
Age at which topic should be first
taught in school to girls
<10 years
83.4
10-12 years
12.8
13-15 years
1.9
16 years or older
0.9
Do not know/missing
1.1
Total
100.0
Number who say that topic should be
taught in school to girls
1,256
59.2
1,267
21.7
36.4
29.0
10.3
2.6
100.0
750
89.1
1,267
60.7
1,267
66.8 80.7
1,267 1,267
67.9
1,267
12.6
47.3
32.6
6.5
1.0
100.0
1,128
8.6
29.9
38.6
20.7
2.2
100.0
8.3
9.0
23.7 29.1
36.7 37.0
29.3 22.6
2.0
2.3
100.0 100.0
768
846 1022
7.2
21.2
39.1
30.2
2.3
100.0
866
Percentage who say that the topic
should be taught in school to
boys
98.8
Number of women
1,267
Age at which topic should be first
taught in school to boys
<10 years
83.9
10-12 years
12.7
13-15 years
2.0
16 years or older
0.5
Do not know/missing
1.0
Total
100.0
Number who say that topic should be
taught in school to boys
1,252
77.0
1,267
24.8
36.3
26.8
9.3
2.7
100.0
976
46.4
1,267
58.8
1,267
58.3 80.7
1,267 1,267
67.2
1,267
13.9
34.9
31.6
15.5
4.0
100.0
588
10.6
30.0
35.1
22.2
2.2
100.0
6.5 11.4
25.3 27.4
34.9 34.2
30.3 24.7
3.0
2.2
100.0 100.0
745
738 1,023
8.6
20.2
34.7
33.8
2.6
100.0
851

7.9 Page 69

▲back to top


68 | Youth in Bihar and Jharkhand: A Situational Analysis
TABLE 22B:
Attitudes toward family life education in school: Women
Percentage of women age 15-24 who agree that specific topics on family life education should be taught in school to
girls and to boys, and percent distribution of those who agree that a specific topic should be taught in school by the age
at which they believe that the topic should first be taught in school, Bihar, 2005-06
Topic should be taught in school
Topics
Moral
values
Changes
in boys’
bodies
at
puberty
Changes in
girls’ bodies
at puberty
including
menstruation
Sex and
sexual
behaviour
Contra-
ception
HIV/
AIDS
Condom
use to avoid
sexually
transmitted
diseases
Percentage who say that the topic
should be taught in school to girls 97.5
Number of women
1,631
Age at which topic should be first taught
in school to girls
<10 years
84.8
10-12 years
12.1
13-15 years
2.3
16 years or older
0.1
Do not know/missing
0.7
Total
100.0
Number who say that topic should be
taught in school to girls
1.590
58.1
1,631
11.0
50.0
30.3
5.4
3.4
100.0
947
76.6
1,631
50.1
1,631
48.3 45.2
1,631 1,631
5.6
52.8
36.5
3.2
1.9
100.0
1,248
1.1
9.3
51.2
32.4
5.9
100.0
0.7 2.3
7.2 11.3
37.8 30.5
49.7 47.2
4.6 8.6
100.0 100.0
818
787 738
40.7
1,631
0.5
5.2
25.1
56.9
12.2
100.0
664
Percentage who say that the topic
should be taught in school to boys 97.9
Number of women
1,631
Age at which topic should be first taught
in school to boys
<10 years
84.7
10-12 years
12.2
13-15 years
1.7
16 years or older
0.4
Do not know/missing
0.9
Total
100.0
Number who say that topic should be
taught in school to boys
1,596
68.8
1,631
10.4
43.5
33.2
7.6
5.3
100.0
1,123
46.4
1,631
44.4
1,631
41.1 45.3
1,631 1,631
3.7
34.2
45.9
10.0
6.2
100.0
756
0.2
10.1
43.4
39.6
6.6
100.0
0.2 3.1
6.0 11.6
34.8 28.1
53.9 46.3
5.1 10.8
100.0 100.0
717
670 738
40.1
1,631
0.3
5.0
20.9
61.9
11.8
100.0
653

7.10 Page 70

▲back to top


Youth in Bihar and Jharkhand: A Situational Analysis | 69
Table 23a
Attitudes toward family life education in school: Men
Percentage of men age 15-24 who agree that specific topics on family life education should be taught in school to girls and
to boys, and percent distribution of those who agree that a specific topic should be taught in school by the age at which
they believe that the topic should first be taught in school, Jharkhand, 2005-06
Topic should be taught in
school
Percentage who say that the
topic should be taught in
school to girls
Moral
values
Changes
in boys’
bodies at
puberty
Changes in
girls’ bodies
at puberty
including
menstruation
Topics
Sex and
sexual
behaviour
Contra-
ception
HIV/
AIDS
Condom
use to avoid
sexually
transmitted
diseases
99.3
74.9
72.1
52.5
54.0 66.4
57.8
Number of men
334
334
334
334
334 334
334
Age at which topic should be first
taught in school to girls
<10 years
90.9
24.3
3.9
10-12 years
6.5
25.8
28.9
13-15 years
1.9
40.6
54.9
16 years or older
0.4
9.3
12.4
Do not know/missing
0.4
0.0
0.0
1.4
1.8 7.0
1.0
17.7
10.4 17.3
6.3
41.1
40.8 43.2
39.8
39.7
47.1 32.0
52.3
0.0
0.0 0.6
0.6
Total
100.0
100.0
100.0
100.0 100.0 100.0
100.0
Number who say that topic should
be taught in school to girls
331
250
241
175
180 222
193
Percentage who say that the
topic should be taught in
school to boys
99.3
80.0
61.9
57.8
53.2 69.2
59.2
Number of men
334
334
334
334
334 334
334
Age at which topic should be first
taught in school to boys
<10 years
93.1
20.2
3.6
10-12 years
5.0
29.3
27.6
13-15 years
1.5
38.2
48.3
16 years or older
0.4
12.3
19.3
Do not know/missing
0.0
0.0
1.2
1.3
0.7 7.0
3.1
15.7
9.6 17.3
8.3
44.2
41.5 40.0
36.3
38.8
48.2 35.2
51.7
0.0
0.0 0.5
0.6
Total
100.0
100.0
100.0
100.0 100.0 100.0
100.0
Number who say that topic should
be taught in school to boys
331
267
206
193
178 231
198

8 Pages 71-80

▲back to top


8.1 Page 71

▲back to top


70 | Youth in Bihar and Jharkhand: A Situational Analysis
Table 23b
Attitudes toward family life education in school: Men
Percentage of men age 15-24 who agree that specific topics on family life education should be taught in school to girls and
to boys, and percent distribution of those who agree that a specific topic should be taught in school by the age at which
they believe that the topic should first be taught in school, Bihar, 2005-06
Topic should be taught in
school
Percentage who say that the
topic should be taught in school
to girls
Moral
values
Changes
in boys’
bodies
at
puberty
Changes in
girls’ bodies
at puberty
including
menstruation
Topics
Sex and
sexual
behaviour
Contra-
ception
HIV/
AIDS
Condom
use to avoid
sexually
transmitted
diseases
99.6
73.7
82.5
63.4
62.9 80.4
69.8
Number of men
413
413
413
413
413 413
413
Age at which topic should be first
taught in school to girls
<10 years
87.4
19.4
10.9
10-12 years
7.1
45.1
44.5
13-15 years
3.9
25.9
32.0
16 years or older
1.2
6.6
10.2
Do not know/missing
0.4
3.0
2.3
7.1
6.9 13.6
12.2
25.9
25.8 27.7
22.8
33.8
31.2 33.3
28.0
29.9
34.8 22.8
33.5
3.2
1.3
2.6
3.4
Total
100.0
100.0
100.0
100.0 100.0 100.0
100.0
Number who say that topic should be
taught in school to girls
411
304
341
262
259 332
288
Percentage who say that the
topic should be taught in school
to boys
100.0
91.6
67.7
63.4
60.2 81.4
71.6
Number of men
413
413
413
413
413 413
413
Age at which topic should be first
taught in school to boys
<10 years
90.3
26.0
9.6
10-12 years
6.1
38.7
39.4
13-15 years
2.3
23.4
30.4
16 years or older
1.1
8.5
16.1
Do not know/missing
0.2
3.4
4.6
10.4
8.8 10.6
8.5
23.0
17.4 25.7
20.7
30.6
33.5 36.3
34.9
31.1
38.9 22.6
32.9
4.9
1.4
2.8
3.3
Total
100.0
100.0
100.0
100.0 100.0 100.0
100.0
Number who say that topic should be
taught in school to boys
413
378
279
262
248 347
295

8.2 Page 72

▲back to top


Youth in Bihar and Jharkhand: A Situational Analysis | 71
Table 24a
Attitudes toward negotiating sex with husband
Percentage of women and men age 15-24 who believe that, if a husband has a sexually transmitted disease, his wife is
justified in refusing to have sexual intercourse with him or (for men) asking that they use a condom, by background char-
acteristics, Jharkhand, 2005-06
Background characteristic
Women
Wife is
justified in
refusing to
have sex
Number
of
women
Age
15-19
20-24
84.8
574
88.6
523
Wife is
justified in
refusing to
have sex
Men
Wife is justified
in asking that
they use a
condom
Wife is justified
in refusing
sex or asking
that they use a
condom
Number
of men
78.5
70.4
88.4
87.3
82.4
186
91.1
148
Residence
Urban
Rural
90.6
295
87.4
91.2
85.2
802
80.7
71.3
93.1
112
82.9
222
Education
No education
83.3
483
68.6
62.0
<5 years complete
88.6
79
73.1
59.6
5-9 years complete
89.9
332
86.6
76.0
10 or more years complete
88.7
202
89.6
93.4
70.4
67
73.1
27
88.2
123
96.5
116
Wealth index
Lowest
Second
Middle
Fourth
Highest
83.2
481
74.8
62.8
87.3
175
79.9
74.9
90.7
154
92.3
87.9
92.1
151
94.2
92.0
88.1
136
85.7
93.5
75.8
122
85.3
59
95.1
43
95.5
55
94.8
54
Total
86.6
1,097
82.9
77.9
86.3
334

8.3 Page 73

▲back to top


72 | Youth in Bihar and Jharkhand: A Situational Analysis
Table 24b
Attitudes toward negotiating sex with husband
Percentage of women and men age 15-24 who believe that, if a husband has a sexually transmitted
disease, his wife is justified in refusing to have sexual intercourse with him or (for men) asking that
they use a condom, by background characteristics, Bihar, 2005-06
Background characteristic
Age
15-19
20-24
Women
Wife is
justified in
refusing to
have sex
Number
of women
Men
Wife is
justified in
refusing to
have sex
Wife is justified
in asking that
they use a
condom
Wife is justified
in refusing
sex or asking
that they use a
condom
Number
of men
77.8
946
76.8
74.5
89.0
685
88.8
84.6
82.0
228
91.5
185
Residence
Urban
Rural
87.7
260
85.1
86.1
81.5
1,371
81.1
76.6
91.1
101
84.6
312
Education
No education
80.8
<5 years complete
74.8
5-9 years complete
84.0
10 or more years complete
88.6
814
71.7
64.9
115
70.0
73.5
430
84.7
74.6
272
89.9
92.6
72.7
77
79.6
49
87.6
137
94.6
149
Wealth index
Lowest
Second
Middle
Fourth
Highest
80.1
412
69.1
69.1
80.2
470
77.1
69.5
82.2
303
88.7
84.5
86.3
271
89.2
86.2
89.1
174
89.2
90.9
73.5
68
80.5
118
91.8
97
93.8
65
93.8
65
Total
82.5
1,631
82.2
79.0
86.3
413

8.4 Page 74

▲back to top


Youth in Bihar and Jharkhand: A Situational Analysis | 73
Table 25a
Knowledge of AIDS
Percentage of women and men age 15-24 who have heard about AIDS and among those who have heard about AIDS, per-
centage who received information from specific sources by selected background characteristics, Jharkhand, 2005-06
Background
characteristic
Age
15-19
20-24
Perce-
ntage
who have
heard
about
AIDS
39.5
39.8
Number
of
respon-
dents
677
590
Among those who have heard about AIDS, percentage who received information Number
from:
of respon-
Radio
Tele-
vision
Cinema
News
paper/
mag-
azine
Poster/
hoar-
ding
Health
worker
Friend/
relative
School Other
teacher source
dents
who have
heard of
AIDS
Women
21.7 77.6
0.8
29.4
8.3
6.7
24.3 16.4 2.1
268
23.0 78.9
1.6
24.8
9.2 10.0
20.1
3.0 5.6
235
Residence
Urban
81.4
326 15.7 95.0
1.3
34.6
13.4
3.9
18.1
Rural
25.2
941 29.6 59.3
1.0
19.1
3.5 13.1
27.1
12.8 3.9
265
7.0 3.5
237
Education
No education
10.3
579 17.5 62.8
0.0
0.0
0.0
7.5
34.3
<5 years
0.0 5.5
60
complete
21.8
90 (15.7) (44.2)
(0.0)
(0.0)
(0.0) (25.4) (30.5)
5-9 years
(0.0) (6.1)
20
complete
54.4
369 25.5 71.7
0.3
16.6
3.7
9.3
27.8
10 or more
9.8 3.1
201
years complete
97.3
228 21.0 91.0
2.3
46.4
16.4
6.0
13.6
14.0 3.4
222
Total
Age
15-19
20-24
39.7
1,267 22.3 78.2
1.2
27.3
8.7
8.2 22.3 10.1 3.7
502
Men
72.8
186
45.2 70.1
3.4
42.5
20.0
8.3
26.6
18.4 4.4
135
67.8
148
44.0 67.2
7.2
47.7
15.5
1.4
30.5
3.5 13.8
101
Residence
Urban
91.2
112
31.0 93.1
5.5
60.0
26.2
2.8
17.2
11.0
Rural
60.2
222
55.0 50.5
4.6
33.0
11.9
7.3
36.7
12.8 6.2
102
10.4
134
Education
No education
28.5
67 (49.5) (38.5)
(0.0)
(3.7)
(3.7) (0.0) (45.9) (0.0) (19.3)
19
<5 years
complete
27.6
27
*
*
*
*
*
*
*
*
*
8
5-9 years
complete
76.8
123
42.9 56.0
7.4
35.7
11.7
6.7
27.0
12.1 6.5
94
10 or more
years complete
98.3
116
42.9 84.7
4.1
60.2
27.0
5.5
25.1
14.9 8.7
115
Total
70.6
334
44.7 68.9
5.0
44.7
18.1
5.4 28.3 12.1 8.4
236
Total includes 1 woman with missing information on education, who is not shown separately. ( ) Based on 25-49 unweighted cases. * Percentage not shown; based on fewer
than 25 unweighted cases.

8.5 Page 75

▲back to top


74 | Youth in Bihar and Jharkhand: A Situational Analysis
Table 25b
Knowledge of AIDS
Percentage of women and men age 15-24 who have heard about AIDS and among those who have heard about AIDS, per-
centage who received information from specific sources by selected background characteristics, Bihar, 2005-06
Background
characteristic
Age
15-19
20-24
Residence
Urban
Rural
Education
No education
<5 years
complete
5-9 years
complete
10 or more
years complete
Percen-
tage
who
have
heard
about
AIDS
Number
of
respon-
dents
Among those who have heard about AIDS, percentage who received information from:
Radio
Tele-
vision
Cinema
News
paper/
maga-
zine
Poster/
hoar-
ding
Health
worker
Friend/
relative
School
teacher
Other
source
Number
of respo-
ndents
who
have
heard of
AIDS
Women
42.4
946
60.3
59.4 4.8
25.0
8.5
3.5 37.1
11.9
8.6
400
46.9
685
65.9
58.3 4.7
23.6
9.2
8.6 39.2
4.2
25.6
321
78.1
260
39.1
86.7 7.9
35.6 17.7
4.9 25.6
13.3
8.4
202
37.9 1,371
72.1
48.0 3.5
20.0
5.4
6.2 43.0
6.7
19.3
519
19.3
841
59.9
22.3 0.0
0.0
0.6
6.4 45.2
0.0
28.7
157
30.4
115
62.9
33.3 0.0
11.4
0.0 13.9 61.1
0.0
25.7
35
63.0
430
63.8
60.1 4.1
18.5
6.3
4.8 40.4
11.4
10.0
271
95.2
271
63.6
83.3 18.9
46.9 17.8
5.8 27.9
11.6
13.6
258
Total
Age
15-19
20-24
44.3 1,631
62.8
58.9 4.8
24.4
8.8
5.8 38.1
8.5 16.2
721
Men
81.7
228
70.1
56.7 5.4
51.4 22.0
9.8 41.7
11.3
3.9
186
83.8
185
73.6
62.3 11.5
50.3 25.7 13.2 35.4
4.2 11.9
155
Residence
Urban
Rural
95.0
101
60.4
75.2 19.8
56.4 32.7 10.9 32.7
14.9
5.0
61
78.8
312
58.7
40.4 2.6
37.3 15.4
9.0 31.8
3.9
8.4
183
Education
No education 56.6
76
34.2
19.7 2.6
2.6
1.3
5.3 27.6
0.0 10.4
43
<5 years
complete
68.0
50
42.0
12.2 4.0 12.2
0.0
8.0 30.0
0.0 20.4
34
5-9 years
complete
86.1
137
58.7
48.2 5.1
40.6 18.2
3.6 29.9
8.0
4.4
118
10 or
more years
complete
98.0
149
78.0
76.5 11.4
73.8 36.2 17.4 36.9
11.4
4.1
146
Total
82.8
412
59.2
48.9 6.8
42.1 19.4
9.5 32.0
6.8
7.5
341

8.6 Page 76

▲back to top


Youth in Bihar and Jharkhand: A Situational Analysis | 75
Table 26a
Knowledge of HIV prevention methods
Percentage of women and men age 15-24 who, in response to prompted questions, say that people can reduce the risk of
getting HIV/AIDS by using condoms every time they have sexual intercourse, by having one uninfected sex partner who has
no other partners, and by abstaining from sexual intercourse, by background characteristics, Jharkhand, 2005-06
Background
characteristic
Percentage who say that HIV/AIDS can be prevented by:
Women
Men
Using
condom1
Limiting
sexual
inter-
course
to one
uninfected
partner2
Using
condom
and limiting
sexual
intercourse
to one
uninfected
partner1,2
Abstaining
from
sexual
inter-
course
Number
of
women
Using
condom1
Limiting
sexual
intercourse
to one
uninfected
partner2
Using
condom
and
limiting
sexual
intercourse
to one
uninfected
partner1,2
Abstai-
ning from
sexual
inter-
course
Number
of
men
Age
15-19
20-24
28.1
34.0
29.1
36.0
26.0
29.5
677
57.2
27.7
29.9
590
63.2
64.0
54.4
56.5
186
62.4
59.4
60.4
148
Residence
Urban
Rural
59.5
74.4
17.8
21.3
57.8
60.9
326
85.5
16.1
19.0
941
47.0
88.1
83.6
81.8
112
50.8
43.1
46.4
222
Education
No education
6.6
8.2
<5 years complete 17.1
15.5
5-9 years
complete
36.4
47.3
10 or more years
complete
76.0
90.4
6.0
6.4
579
26.7
14.2
13.4
90
9.6
33.9
38.7
369
61.1
73.0
80.5
228
89.5
23.0
9.6
24.9
67
18.6
57.5
14.1
27
66.6
87.2
60.9
123
93.4
87.2
84.9
116
Total
28.6
34.9
26.8
29.7 1,267
59.9
63.3
56.7
58.2
334
Total includes 1 woman with missing information on education, who is not shown separately.
1Using condoms every time they have sexual intercourse.
2Partner who has no other partners.

8.7 Page 77

▲back to top


76 | Youth in Bihar and Jharkhand: A Situational Analysis
Table 26b
Knowledge of HIV prevention methods
Percentage of women and men age 15-24 years who, in response to prompted questions, say that people can reduce the
risk of getting HIV/AIDS by using condoms every time they have sexual intercourse, by having one uninfected sex partner
who has no other partners, and by abstaining from sexual intercourse, by background characteristics, Bihar, 2005-06
Background
characteristic
Age
15-19
20-24
Using
con-
dom1
Percentage who say that HIV/AIDS can be prevented by:
Women
Men
Limiting
sexual
inter-
course
to one
unin-
fected
partner2
Using
condom
and
limiting
sexual
inter-
course to
one un-
infected
partner1,2
Abstain-
ing from
sexual
inter-
course
Number
of Using
women con-
dom1
Limiting
sexual
inter-
course
to one
unin-
fected
partner2
Using
condom
and
Ab-
limiting staining
sexual from
inter- sexual
course to inter-
one un- course
infected
partner1,2
Number
of men
22.6 31.5
20.6
25.5
946 65.9 72.8
62.3
64.7
228
29.7 36.5
27.1
30.2
685 66.5 75.6
63.8
59.6
185
Residence
Urban
Rural
47.3 60.8
44.2
21.5 28.4
19.4
55.0
260 81.2 85.1
76.2
74.3
101
22.3 1,371 61.2 70.7
58.7
58.7
311
Education
No education
9.1 13.6
8.0
9.3
814 37.7 43.4
32.9
32.9
76
<5 years complete 13.9 17.4
10.4
16.5
115 48.0 60.0
48.0
46.9
49
5-9 years complete 33.3 45.8
30.0
37.2
430 66.4 75.2
61.3
66.7
138
10 or more years 68.0 81.2
64.2
71.6
271 86.6 93.3
84.7
78.5
149
complete
Total
25.6 33.6
23.3
27.5 2,751 66.1 74.0
63.0 62.4
413
1Using condoms every time they have sexual intercourse.
2Partner who has no other partners.

8.8 Page 78

▲back to top


Youth in Bihar and Jharkhand: A Situational Analysis | 77
Table 27a
Comprehensive knowledge about HIV/AIDS
Percentage of women and men age 15-24 who, in response to prompted questions, correctly reject misconceptions about
HIV/AIDS transmission or prevention and who say that a healthy-looking person can have HIV/AIDS, and percentage who
have a comprehensive knowledge about HIV/AIDS, by background characteristics, Jharkhand, 2005-06
Background
characteristic
Age
15-19
20-24
Residence
Urban
Rural
Education
No education
<5 years complete
5-9 years complete
10 or more years
complete
Percentage of women who say that:
HIV/AIDS can
not be
transmitted
by mosquito
bites
HIV/
AIDS can
not be
transmitted
by hugging
someone
who has
AIDS
A person
can not
become
infected
by sharing
food with
a person
who has
AIDS
HIV/AIDS
can not be
transmitted
by any
of the
specified
methods
Women
25.8
27.9
26.1
19.6
25.7
29.6
28.5
20.4
57.4
62.3
61.0
47.5
14.8
17.1
15.6
10.4
3.1
5.3
4.4
1.4
7.3
14.0
15.5
5.2
33.8
37.3
35.0
25.0
77.4
79.9
77.3
64.5
Who reject
all three
miscon-
ceptions
and know
how to
prevent
HIV/AIDS
14.8
16.8
39.2
7.6
0.9
5.2
19.2
51.6
Who say
that a
healthy
looking
person
can have
HIV/AIDS
28.6
29.5
63.1
17.2
6.1
15.3
36.1
81.1
Healthy
looking
person
can have
HIV/AIDS
and
reject
the two
most
common
Compre-
hensive
know-
ledge
about
HIV/
AIDS
miscon-
ceptions
16.6
13.0
17.3
15.1
43.1
36.9
7.8
6.1
0.7
0.7
4.4
4.4
19.6
16.4
58.6
47.6
Number
of
respon-
dents
677
590
326
941
579
90
369
228
Total
25.6
Age
15-19
52.5
20-24
46.2
Residence
Urban
70.4
Rural
39.2
Education
No education
15.2
<5 years complete
11.5
5-9 years complete
47.9
10 or more years
80.3
complete
28.7
27.2
19.9
15.7
29.0
16.9 14.0 1,267
Men
56.0
52.0
56.3
50.8
79.9
78.0
44.2
38.1
16.2
12.6
23.1
18.6
58.3
51.2
84.5
81.8
39.1
31.1
48.0
32.3
28.1
186
41.4
37.6
51.4
33.0
31.7
148
62.9
56.6
79.9
59.1
54.7
112
28.7
22.7
34.3
19.3
17.1
222
9.4
5.8
17.3
7.6
5.8
67
7.1
2.6
9.6
2.6
2.6
27
36.7
29.0
49.1
27.0
23.8
123
69.3
63.0
77.9
60.1
56.0
116
Total
49.7
56.1
51.5
40.2
34.0
49.5
32.3 29.7
334
Total includes 1 woman with missing information on education, who is not shown separately.
1Respondents who know how to prevent HIV/AIDS say that the use of a condom for every act of sexual intercourse and having just one uninfected faithful partner can reduce
the chance of getting HIV/AIDS. 2Two most common misconceptions in NFHS-3: HIV/AIDS can be transmitted by mosquito bites and by sharing food.
3Respondents with comprehensive knowledge say that the use of a condom for every act of sexual intercourse and having just one uninfected faithful partner can reduce the
chance of getting HIV/AIDS, say that a healthy-looking person can have HIV/AIDS, and reject the two most common misconceptions in NFHS-3.

8.9 Page 79

▲back to top


78 | Youth in Bihar and Jharkhand: A Situational Analysis
Table 27b
Comprehensive knowledge about HIV/AIDS
Percentage of women and men age 15-24 years who, in response to prompted questions, correctly reject misconceptions
about HIV/AIDS transmission or prevention and who say that a healthy-looking person can have HIV/AIDS, and percentage
who have a comprehensive knowledge about HIV/AIDS, by background characteristics, Bihar, 2005-06
Background
characteristic
Percentage of women who say that:
HIV/AIDS
cannot be
transmitted
by
mosquito
bites
HIV/AIDS
cannot be
transmitted
by hugging
someone
who has
AIDS
A person
cannot
become
infected
by sharing
food with
a person
who has
AIDS
HIV/AIDS
cannot be
transmitted
by any
of the
specified
methods
Women
Who
reject Who say
all three that a
misconc- healthy
eptions looking
and know person
how to can have
prevent HIV/AIDS
HIV/AIDS
Healthy
looking
person can
have HIV/
AIDS and
reject the
two most
common
miscon-
ceptions
Compre-
hensive
know-
ledge
about
HIV/
AIDS
Number
of
respon-
dents
Age
15-19
20-24
Residence
Urban
Rural
Education
No education
30.8
31.8
30.7
24.0
14.1
30.0
20.4
12.8
946
32.5
35.3
33.0
26.3
19.0
31.7
21.2
15.8
685
63.1
65.4
62.9
53.7
34.7
61.9
47.1
30.1
259
25.5
27.1
25.7
19.5
12.6
24.8
15.8
11.0 1,371
10.3
10.4
10.8
6.6
3.7
10.8
4.1
2.3
815
<5 years complete
15.7
19.1
15.7
7.8
4.3
17.4
4.3
2.6
115
5-9 years complete
43.3
47.0
43.3
33.3
19.5
40.5
26.7
16.5
430
10 or more years
83.1
complete
85.6
82.7
74.2
53.5
80.4
68.0
50.2
271
Total
Age
15-19
20-24
25-29
30-34
Residence
Urban
Rural
Education
No education
<5 years
complete
28.4
30.7
28.7
22.1
14.8
28.2
18.0
12.9 1,631
Men
53.7
59.7
55.3
38.0
31.3
51.1
28.8
24.3
228
41.0
58.3
54.3
34.1
31.5
58.4
31.7
29.6
185
49.8
65.9
62.9
44.3
41.1
67.1
40.7
38.6
164
40.1
51.1
42.2
28.2
25.7
61.8
24.7
24.1
158
62.4
77.2
72.3
54.5
45.5
70.3
47.5
41.6
101
43.3
53.2
49.4
30.4
26.9
49.4
24.4
21.6
311
22.4
36.8
34.2
18.2
14.3
29.9
15.6
11.8
76
28.0
28.0
22.0
6.1
4.0
26.0
0.0
0.0
50
5-9 years
complete
51.1
58.7
53.6
34.8
28.4
52.6
29.0
23.4
137
10 or more years
65.1
complete
81.2
77.3
57.0
52.7
78.5
48.7
46.0
150
Total
48.0
59.1
54.8
36.3
31.4
54.4
30.3
26.7
413
1Respondents who know how to prevent HIV/AIDS say that the use of a condom for every act of sexual intercourse and having just one
uninfected faithful partner can reduce the chance of getting HIV/AIDS.
2Two most common misconceptions in NFHS-3: HIV/AIDS can be transmitted by mosquito bites and by sharing food.
3Respondents with comprehensive knowledge say that the use of a condom for every act of sexual intercourse and having just one uninfected
faithful partner can reduce the chance of getting HIV/AIDS, say that a healthy-looking person can have HIV/AIDS, and reject the two most
common misconceptions in NFHS-3.

8.10 Page 80

▲back to top


Youth in Bihar and Jharkhand: A Situational Analysis | 79
Table 28 a
Knowledge of prevention of HIV transmission from a mother to her baby
Percentage of women and men age 15-24 years who know that HIV/AIDS can be transmitted from a mother to her baby and
that the risk of HIV transmission from an infected mother to her baby can be reduced by the mother taking special drugs ,
by background characteristics, Jharkhand, 2005-06
Background characteristic
Age
15-19
20-24
Women
HIV/AIDS
can be
transmitted
from a mother
to her baby
HIV/AIDS can be
transmitted from
a mother to her
baby and the risk
of transmission
can be reduced
by the mother
taking special
drugs
29.2
15.2
31.8
16.5
Number
of
women
677
590
Men
HIV/AIDS can
be
transmitted
from a
mother
to her baby
HIV/AIDS can be
transmitted from
a mother to her
baby and the risk
of transmission
can be reduced
by the mother
taking special
drugs
Number
of men
49.6
22.4
186
45.5
15.3
148
Residence
Urban
Rural
60.1
26.2
326
69.2
24.5
112
20.1
12.2
941
37.0
16.6
222
Education
No education
7.3
<5 years complete
14.2
5-9 years complete
39.8
10 or more years complete
80.1
2.8
579
9.7
6.3
90
7.1
23.2
369
50.4
40.5
228
76.5
0.0
67
7.1
27
17.4
123
35.1
116
Regular media exposure1
Yes
54.0
No
11.6
28.0
561
58.4
6.0
706
23.7
24.2
232
7.9
102
Total
30.4
15.8
1,267
47.8
Total includes 1 woman with missing information on education, who is not shown separately.
1Exposure to radio, television, or newspapers/magazines at least once a week.
19.2
334

9 Pages 81-90

▲back to top


9.1 Page 81

▲back to top


80 | Youth in Bihar and Jharkhand: A Situational Analysis
Table 28b
Knowledge of prevention of HIV transmission from a mother to her baby
Percentage of women and men age 15-24 years who know that HIV/AIDS can be transmitted from a mother to her baby and
that the risk of HIV transmission from an infected mother to her baby can be reduced by the mother taking special drugs,
by background characteristics, Bihar, 2005-06
Background characteristic
Age
15-19
20-24
Women
HIV/AIDS
can be
transmitted
from a
mother to
her baby
HIV/AIDS can
be transmitted
from a mother
to her baby
and the risk of
transmission
can be reduced
by the mother
taking special
drugs
Number
of
women
30.1
10.6
946
36.0
12.1
685
Men
HIV/AIDS
can be
transmitted
from a
mother to
her baby
HIV/AIDS can be
transmitted from
a mother to her
baby and the risk
of transmission
can be reduced
by the mother
taking special
drugs
Number
of men
60.3
21.2
228
62.7
23.8
185
Residence
Urban
Rural
61.2
25.1
260
71.3
24.8
101
27.1
8.6
1,371
58.2
21.5
312
Education
No education
12.3
<5 years complete
15.8
5-9 years complete
44.4
10 or more years complete
81.5
Regular media exposure1
Yes
51.1
No
16.4
2.9
884
30.3
3.5
114
46.0
12.3
430
66.4
37.9
271
77.9
19.1
758
68.6
4.4
872
38.1
7.9
76
14.0
50
24.8
137
30.2
149
26.9
316
8.2
98
Total
32.5
11.2
1Exposure to radio, television, or newspapers/magazines at least once a week.
1,631
61.4
22.5
413

9.2 Page 82

▲back to top


Youth in Bihar and Jharkhand: A Situational Analysis | 81
Table 29a
Prevalence of tuberculosis
Number of persons (age below 35 years) per 100,000 usual household residents suffering from any tuberculosis and medi-
cally treated tuberculosis, by age, sex, and main type of cooking fuel, according to residence, Jharkhand, 2005-06
Characteristic
Age
<20
20-24
25-29
30-34
Number of persons per 100,000 suffering from:
Tuberculosis1
Medically treated tuberculosis
Urban
291
291
661
661
242
242
872
872
Number of usual
residents
1,450
319
290
242
Sex
Female
Male
312
312
1,123
477
477
1,177
Cooking fuel
Solid fuel2
Other fuel
547
547
1,539
92
92
761
Total
Age
<20
20-24
25-29
30-34
397
397
Rural
115
115
154
154
641
641
1,081
901
2,300
5,110
762
730
650
Sex
Female
Male
187
187
3,764
336
302
3,488
Cooking fuel
Solid fuel2
Other fuel
244
2,273
228
2,273
7,196
52
Total
Age
<20
20-24
25-29
30-34
258
242
Total
153
153
303
303
528
528
1,024
893
7,252
6,560
1,081
1,020
891
Sex
Female
Male
216
216
4,888
371
346
4,665
Cooking fuel
Solid fuel2
Other fuel
297
284
8,735
230
230
813
Total
292
279
9,553
Note: Total includes usual residents with missing information on cooking fuel, and residents for whom the type of cooking fuel was not specified, who are
not shown separately.
1Includes medically treated tuberculosis.
2Includes coal, lignite, charcoal, wood, straw/shrubs/grass, agricultural crop waste, and dung cakes.

9.3 Page 83

▲back to top


82 | Youth in Bihar and Jharkhand: A Situational Analysis
Table 29b
Prevalence of tuberculosis
Number of persons (age below 25 years) per 100,000 usual household residents suffering from any tuberculosis and
medically treated tuberculosis, by age, sex, and main type of cooking fuel, according to residence, Bihar, 2005-06
Characteristic
Age
<20
20-24
Number of persons per 100,000 suffering from:
Tuberculosis1
Medically treated
tuberculosis
Urban
100
100
0
0
Sex
Female
Male
145
145
0
0
Cooking fuel
Solid fuel2
Other fuel
120
120
0
0
Total
Age
<20
20-24
120
120
Rural
490
471
1,013
868
Sex
Female
Male
446
399
650
650
Cooking fuel
Solid fuel2
Other fuel
557
535
0
0
Total
Age
<20
20-24
474
453
Total
434
417
827
709
Sex
Female
Male
404
344
567
568
Cooking fuel
Solid fuel2
Other fuel
516
482
0
0
Total
480
452
1Includes medically treated tuberculosis.
2Includes coal, lignite, charcoal, wood, straw/shrubs/grass, agricultural crop waste, and dung cakes.
Number of usual
residents
1,231
213
686
758
832
609
1,444
7,306
951
4,260
3,997
8,073
184
8,257
8,537
1,164
4,954
4,756
8,904
793
9,701

9.4 Page 84

▲back to top


Youth in Bihar and Jharkhand: A Situational Analysis | 83
Table 30a
Tobacco and alcohol use by women and men
Percentage of women and men age 15-24 years by their use of tobacco and alcohol, percent distribution of those who
smoke cigarettes or bidis by number of cigarettes/bidis smoked in the 24 hours preceding the survey, and among those
who drink alcohol, the frequency of alcohol consumption, by residence, Jharkhand, 2005-06
Tobacco/alcohol use
Use of tobacco/alcohol
Smokes cigarettes or bidis
Smokes cigars or pipe
Chews paan masala, gutkha, or other tobacco
Uses snuff
Other
Does not use tobacco
Drinks alcohol
Women
Urban Rural
Total
0.0
0.1
0.1
0.0
0.0
0.0
1.9
4.9
4.2
0.0
0.0
0.0
0.4
0.3
0.3
97.7
94.8
95.5
0.2
5.4
4.1
Urban
Men
Rural
16.4
18.8
0.0
0.0
20.1
40.3
0.0
0.6
0.0
0.0
69.8
52.5
15.1
23.8
Total
18.0
0.0
33.6
0.4
0.0
58.3
20.9
Number of respondents
326
941 1,267
112
222
334
Number of cigarettes/bidis smoked in the past 24 hours
0
na
*
* (34.6)
44.1
41.2
1-4
na 100.0 100.0 (42.3)
38.2
39.5
5-9
na
*
*
(3.8)
5.9
5.3
10 or more
na
*
* (19.2)
11.8
14.0
Missing
na
*
*
(0.0)
0.0
0.0
Total
na 100.0 100.0 100.0 100.0 100.0
Number of cigarette/bidi smokers
na
1
1
18
42
60
Among those who drink alcohol, frequency of drinking
Almost every day
*
14.0
13.8
(4.2)
11.6
9.8
About once a week
*
37.2
36.7
(8.3)
18.6
16.1
Less than once a week
*
46.5
47.2 (87.5)
69.8
74.1
Missing
100.0
2.3
2.3
(0.0)
0.0
0.0
Total
100.0 100.0 100.0 100.0 100.0 100.0
Number of respondents who drink alcohol
na: Not available
( ) Based on 25-49 unweighted cases.
* Percentage not shown; based on fewer than 25 unweighted cases.
1
51
52
17
53
70

9.5 Page 85

▲back to top


84 | Youth in Bihar and Jharkhand: A Situational Analysis
Table 30b
Tobacco and alcohol use by women and men
Percentage of women and men age 15-24 years by their use of tobacco and alcohol, percent distribution of those who
smoke cigarettes or bidis by number of cigarettes/bidis smoked in the 24 hours preceding the survey, and among those who
drink alcohol, the frequency of alcohol consumption, by residence, Bihar, 2005-06
Tobacco/alcohol use
Use of tobacco/alcohol
Smokes cigarettes or bidis
Smokes cigars or pipe
Chews paan masala, gutkha, or other tobacco
Uses snuff
Other
Does not use tobacco
Drinks alcohol
Urban
Women
Rural
Total
0.4
0.3
0.3
0.0
0.1
0.1
0.4
1.3
1.2
0.0
0.1
0.1
0.0
0.0
0.0
99.2
98.2
98.3
0.0
0.2
0.2
Urban
18.8
0.0
33.7
0.0
0.0
60.0
18.8
Men
Rural
19.9
0.0
45.2
0.6
0.0
49.4
26.9
Total
19.6
0.0
42.4
0.5
0.0
51.9
24.9
Number of respondents
260
1371
1631
101
312
413
Number of cigarettes/bidis smoked in the past 24
hours
0
*
1-4
0.4
5-9
*
10 or more
*
Missing
*
Total
100.0
Number of cigarette/bidi smokers
1
Among those who drink alcohol, frequency of
drinking
Almost every day
na
About once a week
na
Less than once a week
na
Missing
na
Total
na
Number of respondents who drink alcohol
na
na: Not available
( ) Based on 25-49 unweighted cases.
* Percentage not shown; based on fewer than 25 unweighted cases.
0.0
0.0
0.2
0.0
0.0
100.0
4
na
na
0.2
na
100.0
3
0.0
0.1
0.2
0.0
0.0
100.0
5
na
*
0.2
*
100.0
3
(5.9)
(10.9)
(2.0)
(0.0)
(81.2)
100.0
19
(0.0)
(2.0)
(15.8)
(82.2)
100.0
18
9.9
8.3
1.0
10.6
80.1
100.0
61
0.6
7.1
19.2
73.1
100.0
84
9.0
9.0
1.2
0.5
80.4
100.0
80
0.5
5.8
18.4
75.3
100.0
102

9.6 Page 86

▲back to top


Youth in Bihar and Jharkhand: A Situational Analysis | 85
Table 31a
Health problems
Number of women and men age 15-34 years per 100,000 who reported that they have diabetes, asthma, or goitre or any
other thyroid disorders, by background characteristics, Jharkhand, 2005-06
Background characteristic
Age
15-19
20-24
25-29
30-34
Number of women per 100,000
who have:
Diabetes
Asthma
Goitre
or other
thyroid
disorder
0
103
528
118
926
926
148
401
507
677
2,295
1,464
Number
of
women
677
590
470
454
Number of men per 100,000
who have:
Diabetes
Asthma
Goitre
or other
thyroid
disorder
378
378
378
0
828
0
0
847
0
518
518
0
Number
of men
186
148
145
136
Residence
Urban
Rural
370
741
247
562
722
722
361
194
146
878
1,024
1,628
0
585
0
420
Education
No education
261
1,230
1,315
1,178
0
0
0
135
<5 years complete
0
0
0
141
0
0
0
64
5-9 years complete
138
651
375
503
0
1,520
0
208
10 or more years complete
189
189
189
367
676
338
338
208
Wealth index
Lowest
Second
Middle
Fourth
Highest
227
1,246
1,019
1,052
0
981
0
250
209
775
1,073
333
0
672
0
105
0
525
0
265
0
0
0
79
260
260
1,153
267
802
802
802
88
253
253
253
275
752
0
0
93
Total
204
843
825 2,191
229
628
114
614
Total includes 1 woman with missing information on education, who is not shown separately.

9.7 Page 87

▲back to top


86 | Youth in Bihar and Jharkhand: A Situational Analysis
Table 31b
Health problems
Number of women and men age 15-34 years per 100,000 who reported that they have diabetes, asthma, or goitre or any
other thyroid disorders, by background characteristics, Bihar, 2005-06
Background characteristic
Age
15-19
20-24
25-29
30-34
Number of women per 100,000
who have:
Diabetes
Asthma
Goitre
or other
thyroid
disorder
43
666
192
2,341
439
927
1,036
1,853
336
1,069
345
1,229
Number
of
women
946
685
637
484
Number of men per 100,000
who have:
Diabetes
Asthma
Goitre
or other
thyroid
disorder
0
0
0
0
1,085
0
943
277
0
0
1,272
983
Number
of men
228
185
164
158
Residence
Urban
Rural
834
1,205
463
441
0
794
0
172
599
898
719
2,310
275
551
275
563
Education
No education
737
805
533
1,558
0
1,320
0
152
<5 years complete
2,091
807
1,614
171
0
0
0
81
5-9 years complete
136
896
529
600
0
731
0
212
10 or more years complete
388
1,603
1,044
422
535
314
535
290
Wealth index
Lowest
Second
Middle
Fourth
Highest
775
445
388
714
0
2,452
0
126
902
1,053
1,193
812
0
223
760
204
368
819
84
487
0
0
0
160
363
1,503
706
450
0
0
0
118
425
1,242
905
289
1,228
721
0
126
Total
637
947
678 2,751
211
608
211
735

9.8 Page 88

▲back to top


Youth in Bihar and Jharkhand: A Situational Analysis | 87
Table 32a
Nutritional status of adults
Percentage of women and men age 15-24 years with specific body mass index (BMI) levels, by background characteristics,
Jharkhand, 2005-06
Background
characteristic
<18.5
(total
thin)
Body mass index (BMI) in kg/m2
Women1
Men
<17.0 25.0
(mode- (overw-
rately/ eight
severely or
thin) obese)
30.0
(obese)
Number
of
women
<18.5
(total
thin)
<17.0 25.0
(mode- (overw-
rately/ eight
severely or
thin) obese)
30.0
(obese)
Number
of men
Age
15-19
20-24
47.8 19.1
1.2
0.0
565 60.4 27.9
1.2
0.0
176
47.2 20.0
2.0
0.3
479 41.1 12.1
2.2
0.0
129
Residence
Urban
Rural
40.6 16.8
4.1
0.5
285 49.3 20.9
4.7
0.0
104
50.1 20.6
0.6
0.0
759 53.7 21.3
0.0
0.0
201
Education
No education
52.3 21.6
0.0
0.0
449 42.2 19.8
0.0
0.0
58
<5 years complete 55.4 11.4
0.0
0.0
69 74.5 44.7
0.0
0.0
25
5-9 years complete 47.0 20.6
1.8
0.0
314 65.5 25.7
0.0
0.0
113
10 or more years
complete
35.3 16.2
5.2
0.7
211 38.6 12.0
4.5
0.0
109
Wealth index
Lowest
Second
Middle
Fourth
Highest
50.8 20.3
0.0
0.0
465 58.8 25.4
0.0
0.0
109
50.5 16.7
1.5
0.0
160 49.8 21.1
0.0
0.0
53
53.2 27.4
1.7
0.0
136 54.2 10.2
0.0
0.0
39
47.7 20.4
0.5
0.0
141 53.5 23.8
0.0
0.0
53
27.6 11.7
7.8
1.0
142 37.5 18.1
9.7
0.0
51
Total
47.5 19.5
1.6
0.1 1,044 52.2 21.2
1.6
0.0
305
1Excludes pregnant women and women with a birth in the preceding 2 months. Total includes 1 woman with missing information on education, which is not shown
separately.

9.9 Page 89

▲back to top


88 | Youth in Bihar and Jharkhand: A Situational Analysis
Table 32b
Nutritional status of adults
Percentage of women and men age 15-24 years with specific body mass index (BMI) levels, by background characteristics,
Bihar, 2005-06
Background char-
acteristic
Age
15-19
20-24
<18.5
(total
thin)
Body mass index (BMI) in kg/m2
Women1
Men
<17.0
(mod-
erately/
severely
thin)
25.0
(over-
weight
or
obese)
Number
30.0 of
(obese) women
<18.5
(total
thin)
<17.0
(mod-
erately/
severely
thin)
25.0
(over-
weight
or
obese)
30.0
Number
of men
(obese)
52.0
20.1
1.3
0.0
827 61.6 31.7 0.7
0.0
220
47.2
16.9
1.9
0.1
515 31.6
8.4 2.8
0.0
179
Residence
Urban
Rural
46.0
22.2
2.2
0.2
219 50.5 19.9 1.9
0.0
98
50.9
18.2
1.4
0.0 1,122 47.4 21.6 1.5
0.0
301
Education
No education
52.6
18.2
0.1
0.1
626 36.8 10.4 0.0
0.0
75
<5 years complete 55.0
18.0
0.0
0.0
94 47.6 30.7 0.0
0.0
45
5-9 years complete 50.0
19.3
3.0
0.0
372 59.2 30.2 1.5
0.0
133
10 or more years
complete
42.2
20.4
3.2
0.0
250 44.1 15.6 3.1
0.0
146
Wealth index
Lowest
Second
Middle
Fourth
Highest
53.8
19.8
0.0
0.0
316 52.4 29.7 0.0
0.0
66
53.6
19.6
0.4
0.0
369 46.8 17.3 1.3
0.0
115
48.8
17.1
2.2
0.2
266 50.4 25.8 0.5
0.0
93
49.9
20.6
1.6
0.0
231 50.9 22.3 5.1
0.0
60
37.1
16.0
5.8
0.0
160 40.5 11.9 2.1
0.0
65
Total
50.1 18.9 1.5
0.0 1,341 48.2 21.2 1.6
0.0
399
1Excludes pregnant women and women with a birth in the preceding two months.

9.10 Page 90

▲back to top


Youth in Bihar and Jharkhand: A Situational Analysis | 89
Table 33a
Prevalence of anaemia in adults
Percentage of women and men age 15-24 years with anaemia, by background characteristics, Jharkhand, 2005-06
Background
characteristic
Age
15-19
20-24
Mild
(10.0-
11.9 g/
dl)1
Women
Moderate
(7.0-9.9
g/dl)
Severe
(<7.0 g/
dl)
Any
anaemia
(<12.0 g/
dl)2
Number
of
women
Mild
(12.0-
12.9 g/
dl)
Men
Moderate
(9.0-11.9
g/dl)
Severe
(<9.0 g/
dl)
Any
anaemia
(<13.0 g/
dl)
Number
of men
48.6
17.8
0.8
67.2
628
19.8
21.4
47.7
20.0
1.6
69.3
554
13.6
13.4
0.0
41.3
173
1.0
28.0
127
Residence
Urban
Rural
44.4
12.4
0.7
58.0
296
13.3
9.8
49.5
21.0
1.3
72.5
886
19.1
22.2
0.0
20.5
100
0.6
40.6
199
Education
No education
49.7
22.7
2.0
74.0
543
23.4
22.5
<5 years complete
49.3
21.0
0.0
70.0
85
19.9
32.6
5-9 years complete
47.1
17.7
0.3
64.5
346
18.0
19.6
10 or more years
complete
45.7
9.7
0.9
57.8
207
12.2
10.6
0.0
44.3
58
5.0
51.0
25
0.0
35.5
112
0.0
21.0
105
Wealth index
Lowest
Second
Middle
Fourth
Highest
51.2
22.0
1.4
76.2
545
19.3
24.3
50.5
15.9
2.5
69.7
187
20.1
23.4
40.8
23.6
0.0
63.3
157
24.4
24.4
44.4
15.7
0.9
59.8
153
13.0
6.7
45.8
8.5
0.0
53.0
140
7.4
4.4
1.1
45.3
109
0.0
38.0
53
0.0
38.1
39
0.0
19.5
50
0.0
11.1
48
Total
48.2
18.8
1.2
68.8 1182 17.2
18.1
0.4
34.3
299
Note: Prevalence of anaemia, based on haemoglobin levels is adjusted for altitude and for smoking status, if known, using the CDC formula (Center for Disease Control (CDC).
1998. Recommendations to prevent and control iron deficiency in the United States. Morbidity and Mortality Weekly Report 47 (RR-3): 1-29). Haemoglobin levels shown in
grams per decilitre (g/dl). Total includes women with missing information on education, who are not shown separately.
1For pregnant women the value is 10.0-10.9 g/dl.
2For pregnant women the value is <11.0 g/dl.

10 Pages 91-100

▲back to top


10.1 Page 91

▲back to top


90 | Youth in Bihar and Jharkhand: A Situational Analysis
Table 33b
Prevalence of anaemia in adults
Percentage of women and men age 15-24 years with anaemia, by background characteristics, Bihar, 2005-06
Background
characteristic
Age
15-19
20-24
Mild
(10.0-
11.9
g/dl)1
Women
Moderate Severe
(7.0-9.9 (<7.0
g/dl)
g/dl)
Any
anaemia
(<12.0
g/dl)2
Number
of
women
Mild
(12.0-
12.9
g/dl)
Men
Moderate
(9.0-11.9
g/dl)
Severe
(<9.0
g/dl)
Any
anaemia
(<13.0
g/dl)
Number
of men
49.4
15.9
48.0
17.9
1.1
66.4
902
27.9
10.3
0.8
66.7
648
15.6
7.7
2.1
40.4
219
0.9
24.1
175
Residence
Urban
Rural
48.5
16.2
1.2
65.9
245
20.3
9.7
48.9
16.9
1.0
66.8 1,305
23.2
8.9
0.0
28.5
99
2.1
32.3
295
Education
No education
<5 years complete
5-9 years complete
10 or more years
complete
48.5
19.3
52.0
17.8
49.7
13.6
46.9
13.9
1.1
68.2
761
25.5
10.9
2.4
72.2
113
25.2
12.4
0.3
63.6
412
23.7
6.8
1.2
62.0
264
18.8
9.3
0.0
42.3
75
10.4
40.0
45
0.0
27.3
131
1.1
26.1
143
Wealth index
Lowest
Second
Middle
Fourth
Highest
48.4
20.3
49.3
17.0
47.8
18.2
50.9
12.4
47.0
12.5
1.9
70.6
379
34.4
9.9
1.0
67.3
449
19.0
6.9
0.3
66.3
290
23.9
11.5
0.8
64.1
265
18.7
14.0
0.2
59.7
167
18.1
4.2
0.0
41.6
63
2.8
28.7
112
3.3
33.4
93
0.0
35.3
61
0.0
19.3
65
Total
48.8
16.8
1.0
66.6 1,550
22.4
9.1
1.6
31.4
393
Note: Prevalence of anaemia, based on hemoglobin levels is adjusted for altitude and for smoking status, if known, using the CDC formula (Centers for Disease Control
(CDC). 1998. Recommendations to prevent and control iron deficiency in the United States. Morbidity and Mortality Weekly Report 47 (RR-3): 1-29). Hemoglobin levels
shown in grams per deciliter (g/dl).
1For pregnant women the value is 10.0-10.9 g/dl.
2For pregnant women the value is <11.0 g/dl.

10.2 Page 92

▲back to top


Youth in Bihar and Jharkhand: A Situational Analysis | 91
Table 34a
Women's and men's food consumption
Percent distribution of women and men age 15--24 years by frequency of consumption of specific foods, Jharkhand, 2005-06
Type of food
Milk or curd
Pulses or beans
Dark green, leafy vegetables
Fruits
Eggs
Fish
Chicken or meat
Fish or chicken or meat
Milk or curd
Pulses or beans
Dark green, leafy vegetables
Fruits
Eggs
Fish
Chicken or meat
Fish or chicken or meat
Daily
15.3
50.4
47.4
4.5
1.2
0.4
0.2
0.5
24.7
58.7
72.6
4.1
3.3
0.2
0.4
0.6
Frequency of consumption
Weekly Occasionally
Women
8.0
43.8
34.0
14.9
39.6
12.9
21.1
69.6
18.7
63.1
19.0
68.4
16.3
71.1
22.7
67.2
Men
14.1
43.3
34.0
6.9
22.6
4.6
26.1
66.6
36.1
50.7
33.2
59.9
25.9
68.0
36.5
58.5
Never
32.9
0.8
0.1
4.9
17.0
12.2
12.4
9.6
17.9
0.4
0.2
3.3
9.9
6.7
5.7
4.4
Total
100.0
100.0
100.0
100.0
100.0
100.0
100.0
100.0
100.0
100.0
100.0
100.0
100.0
100.0
100.0
100.0
Number of
respondents
1,267
1,267
1,267
1,267
1,267
1,267
1,267
1,267
334
334
334
334
334
334
334
334
Table 34b
Women's and men's food consumption
Percent distribution of women and men age 15-24 years by frequency of consumption of specific foods, Bihar, 2005-06
Type of food
Milk or curd
Pulses or beans
Dark green, leafy vegetables
Fruits
Eggs
Fish
Chicken or meat
Fish or chicken or meat
Milk or curd
Pulses or beans
Dark green, leafy vegetables
Fruits
Eggs
Fish
Chicken or meat
Fish or chicken or meat
Daily
35.0
77.2
83.9
9.6
1.8
1.3
0.4
1.3
48.5
75.2
64.4
8.9
5.4
2.4
1.9
2.9
Frequency of consumption
Weekly Occasionally
Women
23.8
37.1
18.8
3.9
12.7
3.2
27.5
60.3
21.5
50.2
17.9
61.8
12.9
64.5
19.6
61.1
Men
21.9
26.3
20.2
4.6
28.1
7.5
24.4
65.1
22.4
54.5
23.5
60.1
17.6
63.5
26.2
58.8
Never
4.0
0.1
0.1
2.6
26.4
19.0
22.2
18.0
3.2
0.0
0.0
1.6
17.6
14.0
16.9
12.1
Total
Number of
respondents
100.0
100.0
100.0
100.0
100.0
100.0
100.0
100.0
100.0
100.0
100.0
100.0
100.0
100.0
100.0
100.0
1,631
1,631
1,631
1,631
1,631
1,631
1,631
1,631
413
413
413
413
413
413
413
413

10.3 Page 93

▲back to top