Population Health %26 Social Development in Bihar Jharkhand Orissa West Bengal District profile

Population Health %26 Social Development in Bihar Jharkhand Orissa West Bengal District profile


1 Pages 1-10

▲back to top


1.1 Page 1

▲back to top


Population,
Health &
SOCIAL
DEVELOPMENT
in Bihar, Jharkhand, Orissa
and West Bengal
POPULATION FOUNDATION OF INDIA
NEW DELHI

1.2 Page 2

▲back to top


Population,
Health & Social Development
in Bihar, Jharkhand, Orissa and West Bengal
POPULATION FOUNDATION OF INDIA
NEW DELHI

1.3 Page 3

▲back to top


© Population Foundation of India
Maps: Registrar General, India
February, 2010
Overall Guidance:
A. R. Nanda
Contributors:
Almas Ali
Lalitendu Jagatdeb
Nihar Ranjan Mishra
Lopamudra Paul
Shailendra Singh Negi
Chandni Malik
Designed and Produced By FACET DESIGN
D-9, Defence Colony, New Delhi-24
Tel. 011-24616720

1.4 Page 4

▲back to top


Population, Health & Social Development in Bihar, Jharkhand, Orissa and West bengal
Foreword
Population Foundation of India(PFI),established in the year 1970,has now entered in to the 40th year of its
existence. Since its inception ,PFI has dedicated itself to the cause of human welfare through Family Planning,
Reproductive and Child Health(RCH) services and other population programmes within a wider canvas of
population stabilization and sustainable development.
PFI’s efforts in the 40th year, will be to undertake intensive advocacy efforts to promote rights-based and
gender-sensitive strategies to achieve population stabilization. A series of events and activities are being
organized across the country over a year to commemorate the 40th year. Three regional conferences planned
to be held across the year will throw up region specific priorities, issues and recommended strategies which
will be disseminated in a National Conference.
The first regional(Eastern) conference is held in Bhubaneswar, Orissa with the objectives of getting a
clear perspective on the demographic and health transition process in Bihar, Jharkhand, Orissa and West
Bengal, to draw attention to the reproductive health issues particularly among young people(10 – 24yrs)
and effective strategies to address them and to recapitulate initiatives by the State Governments and civil
society on population and health issues with a focus on youth. With these objectives in view , the document
“Population, Health and Social Development in Bihar, Jharkhand, Orissa and West Bengal”, has been prepared.
The document contains state and district profiles with data on population, health and social development
issues of the four states, and an analysis of demographic and health transition on way in this region.
This publication is an endeavour to help policy makers, planners, programme managers, NGOs,
academicians and researchers to use this information. We hope this publication will be useful in meeting
this intended purpose.
February, 2010
New Delhi
A R Nanda
Executive Director
Population Foundation of India
| iii

1.5 Page 5

▲back to top


1.6 Page 6

▲back to top


Population, Health & Social Development in Bihar, Jharkhand, Orissa and West bengal
CONTENTS
Key Note Address
DEMOGRAPHIC AND HEALTH TRANSITION IN THE STATES OF
BIHAR, JHARKHAND, ORISSA AND WEST BENGAL
—Almas Ali
—Nihar Ranjan Mishra
BIHAR
State at a glance
Districts at a glance
JHARKHAND
State at a glance
Districts at a glance
ORISSA
State at a glance
Districts at a glance
WEST BENGAL
State at a glance
Districts at a glance
REFERENCES
GLOSSARY
....... 33
........ 35
........ 37
....... 113
........ 115
........ 117
....... 155
........ 157
........ 159
....... 221
........ 223
........ 225
....... 262
....... 263
|v

1.7 Page 7

▲back to top


1.8 Page 8

▲back to top


Population, Health & Social Development in Bihar, Jharkhand, Orissa and West bengal
Abbreviation
ANC
ART
ASFR
CBR
CDR
CHC
CMR
CPR
CSR
DLHS
EAG
GFR
HDI
ICD
ICDS
ICTC
IFA
IIPS
IMR
LEB
MCCD
MMR
MoHFW
NACO
NFHS
NHP
Ante Natal Care
Anti Retroviral Therapy
Age Specific Fertility Rate
Crude Birth Rate
Crude Death Rate
Community Health Centre
Child Mortality Rate
Contraceptive Prevalence Rate
Child Sex Ratio
District Level Household Survey
Empowered Action Group
General Fertility Rate
Human Development Index
International Classification of Disease
Integrated Child Development Services
Integrated Counselling and Testing Centre
Iron Folic Acid
International Institute for Population Sciences
Infant Mortality Rate
Life Expectancy at Birth
Medical Certification of Cause of Death
Maternal Mortality Ratio
Ministry of Health and Family Welfare
National AIDS Control Organization
National Family Health Survey
National Health Policy
| vii

1.9 Page 9

▲back to top


Population Foundation of India
NRHM
National Rural Health Mission
NPP
National Population Policy
PFI
Population Foundation of India
PHC
Primary Health Centre
PPTCTC
Prevention of Parent to Child Transmission Centre
PRB
Population Reference Bureau
RCH
Reproductive and Child Health
RGI
Registrar General of India
RMRC
Regional Medical Research Centre
SC
Sub Centre
SCD
Survey of Cause of Death
SRB
Sex Ratio at Birth
SRH
Sexual and Reproductive Health
SRS
Sample Registration System
SSD
Special Survey of Deaths
SDI
Social Development Index
STD
Sexually Transmitted Diseases
TFR
Total Fertility Rate
VCTC Voluntary Counselling and Testing Centres
VHSCVillage Health Sanitation Committee
viii |

1.10 Page 10

▲back to top


KEY NOTE
FOR the CONFERENCE

2 Pages 11-20

▲back to top


2.1 Page 11

▲back to top


Population Foundation of India
Position of Bihar, Jharkhand, Orissa and
West Bengal in India
INDIA
|

2.2 Page 12

▲back to top


Population, Health & Social Development in Bihar, Jharkhand, Orissa and West bengal
KEY NOTE
Demographic and Health Transition
in the States of Bihar, Jharkhand, Orissa
and West Bengal
Dr Almas Ali*
Nihar Ranjan Mishra**
Introduction
The theory of demographic transition is usually presented in terms of three stages of demographic
evolution:
• First stage is high birth rate and high death rate (high balance)
•Second stage is high birth rate and low death rate (high rate of natural increase) and
•Third stage is low birth rate and low death rate (low balance).
The first stage of demographic evolution is when high birth rate and high fertility is accompanied by high
death rate. In the second stage, high birth rate and high fertility continues. However, few factors (like medical
breakthrough and advancement of health technology) lead to a steep fall in the mortality rate resulting
in a high natural growth. With the advancement of economic and material progress, education, women’s
empowerment and availability of contraceptives, birth rates start declining slowly at first and rapidly thereafter,
and soon a stage is reached (that is, the third stage) where birth and death rates are equal once again (low
balance). This cycle of change, which occurs in any population, is known as “demographic transition”.
In demographic parlance, India has gone through the first phase of demographic transition (high birth and death
rates) during the earlier part of the twentieth century. Starting with a population base of about 36 crores at the time
of Independence, the country is in the midst of demographic transition and is currently passing through the second
phase of demographic transition (high birth and declining /low death rates) which is expected to be completed by
the year 2030. While most developed countries underwent this phase before their population stabilized. India seems
to be taking little longer to achieve the transition. Fertility transition in India has been relatively slow and shows wide
inter state variation, while Kerala and Tamil Nadu achieved below replacement levels of fertility (TFR of 2.1) in 1998
and 2000 respectively. With the current trends states of Uttar Pradesh, Madhya Pradesh, Bihar and Rajasthan are
expected to achieve the same in the year 2027 (UP) 2025 (MP) and 2021 (both Bihar and Rajasthan).
India is a country of striking demographic diversity.As mentioned above India is in the midst of demographic
transition and different states are at different stages. Substantial differences are visible within states in
achievement of basic demographic indices.
Along with demographic transition health or epidemiological transition also occurs. Health or
epidemiological transition could be influenced by three factors. First this could be due to changes in
the age structure of the population consequent to demographic transition. Second, altered disease pattern
could be consequent to changes in resistance and exposure potentials to disease causing organisms or life
styles. Third, introduction of new health interventions (e.g. immunization), increased access to safe water and
improved socio economic status.
* Senior Advisor, Population Foundation of India
** Programme Officer (Monitoring & Evaluation), Population Foundation of India
|

2.3 Page 13

▲back to top


Population Foundation of India
Like many other developing countries, India has a large burden contributed by diseases which predominate
in the pre-transition period, including communicable/ infectious disease, maternal and peri-natal disorders
and nutritional deficiencies.
The focus of the paper is on the four Eastern States of India namely-Bihar, Jharkhand, Orissa
and West Bengal which constitutes around 12.75 percent of the total land area of the country and has 22.1
percent of it’s total population according to Census, 2001.The states of Bihar, Jharkhand, Orissa and West
Bengal, located in the eastern region of the country are among the Empowered Action Group (EAG) states
(except perhaps West Bengal) of India and lag behind in social and health indicators. Paradoxically these are
the very states facing conflict situations which also have negative/ adverse impact on health indicators.
As per the projection made by RGI, 2006 West Bengal (achieved TFR of 2.1 in 2003) and Orissa (expected to achieve
TFR of 2.1 in near future).However, Jharkhand is yet to achieve TFR of 2.1 by the year 2018.The situation on the fertility
front for the state of Bihar is still grim and is expected to achieve replacement level of fertility only by the year 2021.In
other words the state of Bihar is far behind the other three eastern states in achieving fertility transition.
Table-1: Year by Which Replacement Level of Fertility (Total Fertility Rate of 2.1)
will be Achieved.
India and Major States
India
Andhra Pradesh
Assam
Bihar
Chhattisgarh
Delhi
Gujarat
Haryana
Himachal Pradesh
Jammu & Kashmir
Jharkhand
Karnataka
Kerala
Madhya Pradesh
Maharashtra
Orissa
Punjab
Rajasthan
Uttar Pradesh
Uttarakhand
Tamil Nadu
West Bengal
North East
(Excl. Assam)
Year by which projected TFR will be 2.1
2015
Achieved in 2002
2019
2021
2022
Achieved in 2001
2012
2012
Achieved in 2002
NA
2018
Achieved in 2005
Achieved in 1998
2025
2009
2010
Achieved in 2006
2021
2027
2022
Achieved in 2000
Achieved in 2003
Achieved in 2005
Source: The Technical Group on Population Projection, RGI, 2006
|

2.4 Page 14

▲back to top


Population, Health & Social Development in Bihar, Jharkhand, Orissa and West bengal
Design of the paper
This paper is divided into four parts. The first section deals with the demographic transition in the states of
eastern region. The second section deals with heath transition in the same region. The third section is relatively
short one which highlights and identifies issues, concerns and challenges relating to demography and health
in this region. The last or the concluding section is also short and precise in which an attempt is made to chart
out a way forward, looking at the future needs of the states of the eastern region.
1. Demographic Transition in Bihar, Jharkhand, Orissa and West Bengal
States in India are experiencing the phenomenon of demographic transition, the routes of transition being
determined largely by local living conditions. Changes in the natural increase of population, has been brought
about primarily by decline in mortality rather than a big increase in fertility. The eastern state like West Bengal
is no exception to this process.
I. Population Dynamics
According to 2001 Census, India’s population was 1,028,436 (102.9 crores). Viewed globally, India
constitutes 16.9 percent of world’s total population and 2.4 percent of the global land area. Currently (2010)
India’s population is estimated at 117.6 crores.
(a) Population size and population density
As per the 2001 Census, the population of Bihar is 82 million, followed by West Bengal (80 million), Orissa
(36 million) and Jharkhand (26 million). As per the current (2010) projection the estimated population of
Bihar is 96 million, West Bengal is 88 million, Orissa 40 million and Jharkhand is 31 million. The density
of population was 881 per sq. km for Bihar, 338 per sq. km 338 in Jharkhand, 236 per sq km in Orissa,
903 per sq. km in West Bengal. The highest population density was for the state of Bihar followed by West
Bengal, Jharkhand and lowest being Orissa.
Table-2: Population from 1971/ 81 to 2001 and 2010 in Bihar, Jharkhand Orissa,
West Bengal and India (Population Figures in 000’s).
State/Country
Population
1971
1981
1991
2001
2010 (Projected)
Bihar
56353
69914
64530
82998
96389
Jharkhand
-
-
21843
26945
31040
Orissa
21944
26370
31659
36804
40389
West Bengal
44312
54580
68077
80176
88669
India
548159
683329
846421
1028737
1176742
Source: Census of India-1971, 1981, 1991, 2001 and RGI Projected Figure.
(b) Decadal growth rate and average Annual Exponential Growth rate
The highest decline in decadal growth rate was in West Bengal i.e., 5.4 percent points , followed by
Orissa (3.9 percent points).In contrast Bihar has registered an increase of 4.5 percent points in the dec-
adal growth rate during the last decade (1991-2001).The other two major states registered increase are
Haryana (1.02 percent points) and a slight increase in Uttar Pradesh (0.24 percent points).As in case of
decadal growth rate, similar trend was observed in the case of average annual exponential growth rate
in Bihar, The average annual exponential growth rate rose from 2.11(1981-91) to 2.51(1991-2001).In
the states of Orissa and West Bengal a declining trend was observed for the average annual exponential
growth rate.
|

2.5 Page 15

▲back to top


Population Foundation of India
Table-3: Decadal Growth Rate and Average Annual Exponential Growth Rate,
1971-81, 1981-91, 1991-2001
State/Country
Decadal Growth Rate
Average annual exponential growth rate
1971-81
1981-91 1991-2001
1981-91
1991-2001
Bihar
24.16
23.38
28.62
2.11
2.51
Jharkhand
23.79
24.03
23.36
-
2.09
Orissa
20.16
20.06
16.25
1.83
1.51
West Bengal
23.17
24.73
17.77
2.21
1.64
India
24.66
23.86
21.53
2.14
1.93
Source: Census of India-1971, 1981, 1991, 2001.
(c) Age structure
With change in population size there is shift in age structure. With decline in fertility there is a decline in
young age population and the elderly population not rising commensurately to offset this fall, it is often
said that the countries enjoy ‘Demographic Bonus’ during the course of demographic transition. Out of
these four eastern states Bihar and Jharkhand is the only exception to this effect.
Table-4: Population Distribution (in percentage), 2001
State/
Country
Population
(0-6 years)
Adolescents
(10-19
years)
Young
People
(10-24
years)
Working
Age
Population
(15-59
years)
Women in
Reproductive
Age Group
(15-44 years)
Elderly
Population
(60 and more
years)
Bihar
20.2
22.0
29.7
51.1
41.7
6.6
Jharkhand
18.4
22.4
30.4
54.3
43.7
5.9
Orissa
14.6
21.1
29.8
58.4
47.3
8.8
West Bengal
14.2
21.4
30.2
59.5
47.9
7.5
India
15.9
21.9
30.7
57.1
46.2
7.3
Source: Computed from age data, Census 2001
Analyzing the age structure of the population in these four states it was observed that population (0-6
years) constitutes the highest proportion (20.2 percent) of the state’s total population for Bihar. In case of
Jharkhand, Orissa and West Bengal the corresponding figures are 18.4, 14.6 and 14.2 percent respectively.
The population in the age group of (0-6 years) is a proxy indicator for fertility. Concentration of population in
this age group implies that the fertility transition in Bihar is much slower than the other three states. Because
of fertility decline the states of West Bengal and Orissa already started experiencing the phenomenon of
population ageing. There is substantial increase in the elderly Population (60 and more years) in these two
states.
|

2.6 Page 16

▲back to top


Population, Health & Social Development in Bihar, Jharkhand, Orissa and West bengal
Figure 1: Age and Sex Pyramid for Bihar, Jharkhand, Orissa and West Bengal, 2001
BIHAR
Jharkhand
orissa
west bengal
(d) Sex Ratio
There is an improvement in overall sex ratio (i.e. number of females per thousand males) from 927 in 1991
to 933 in Census 2001 at the national level. The figures of sex ratio for 1991 and 2001 for the states of
Bihar, Jharkhand, Orissa and West Bengal have been furnished below:
Table 5: Sex Ratio in Bihar, Jharkhand, Orissa, West Bengal and India
Country/ States
Year
1991
2001
India
927
933
Bihar
907
919
Jharkhand
922
941
Orissa
971
972
West Bengal
917
934
Source: Census of India, 1991 and 2001
Absolute Change
+6
+12
+19
+1
+17
|

2.7 Page 17

▲back to top


Population Foundation of India
It is seen from the above table that the highest increase was observed in the state of Jharkhand (19) fol-
lowed by West Bengal (17) and Bihar (12). There is only a marginal improvement in case in Orissa.
(d) i. Child Sex Ratio (CSR)
As mentioned above, while there is a marginal improvement in overall sex ratio, what is most alarming
is the decline of Child Sex Ratio (CSR) that is, the sex ratio of children in the age group of 0 -6 years. The
Child Sex Ratio (girls per 1000 boys) shows a negative trend and causes serious concern not only among
demographers, but also among policy makers and planners. Census 2001 showed a decline of 18 points
from 945 in 1991 to 927.
Table 6: Child Sex Ratio
Country/ States
India
Bihar
Jharkhand
Orissa
West Bengal
Year
1991
2001
945
927
953
942
979
965
967
953
967
960
Absolute Change
-18
-11
-14
-14
-7
Source: Census of India, 1991 and 2001
The above table shows that among the four eastern states, the highest decline was found both in the
states of Orissa (14 points) and Jharkhand (14 points) and lowest decline was in West Bengal (7 points)
(d) ii. Sex Ratio at Birth (SRB)
The Sample Registration System (SRS) provides data on sex ratio at birth for the bigger states of India
since 1998.The above figure portrays the sex ratio at birth for Bihar, Orissa, West Bengal and India by three
year moving average. From the above figure it was observed that, in all the three eastern states except
Jharkhand (data is not available) are having the sex ratio at birth more than the national figure. In between
2001-2003 barring Orissa, the sex ratio at birth declined in Bihar and West Bengal. In all the three states
the sex ratio at birth showed an increasing trend in between 2004-06.In between 2005-07, the sex ratio
at birth recorded a fall in Orissa, where as in Bihar and West Bengal, it increased.
Figure: 2 Sex Ratio at Birth (SRB) in Bihar, Orissa and West Bengal
|
980
960
940
920
900
880
860
840
820
800
1998-2000
1999-2001
2000-2002
2001-2003
2002-2004
2003-2005
India
Bihar
Orissa
West Bengal
2004-2006
2005-2007

2.8 Page 18

▲back to top


Population, Health & Social Development in Bihar, Jharkhand, Orissa and West bengal
II. Fertility Transition:
Before the Sample Registration System (SRS) was introduced by the Registrar General, India information on
fertility levels and trends consisted mainly of indirect estimates prepared by various demographers using age
and sex distribution from the census data. Since 1971, SRS has been providing for estimating fertility measures
and is considered to be most accurate and reliable. The fertility indicators used for analysis are: Crude Birth Rate
(CBR), General Fertility Rate (GFR), Age Specific Fertility Rate (ASFR) and Total Fertility Rate (TFR).
Table-7: Crude Birth Rate (CBR) in Bihar, Jharkhand, Orissa and West Bengal
State
CBR
1971
1981
1991 2001 2008
Bihar
-
39.1
30.7
31.2 28.9
Jharkhand
-
-
-
-
25.8
Orissa
34.6
33.1
28.8
23.5 21.4
West Bengal
-
33.2
27.0
20.6 17.5
India
36.9
33.9
29.5
25.4 22.8
Difference
1971-2008
-
-
13.2
-
14.1
Source: Sample Registration System
CBR at all India level declined from 36.9 in 1971 to 22.8 in 2008.In all the four eastern states the CBR
declined in between 1971 and 2008.The difference in CBR was found to be highest (15.7) in case of West
Bengal, followed by Orissa (11.7) and Bihar recorded the least decline (10.2) among these four states, which
is lower than the all India level (11.1).Barring Bihar, in case of the other three eastern states the decline is
higher than the all India level. As per SRS, 2007 the GFR for India is 89.5 .The corresponding figures for Bihar,
Jharkhand, Orissa and West Bengal are 128.9, 106.4, 79.7 and 66.3 respectively.
Figure-3: Crude Birth Rate (CBR) in Bihar, Orissa and West Bengal
(a) Age Pattern of Fertility:
The age pattern of childbearing in these states has undergone a change during twentieth century, with fer-
tility limitations being increasingly common at relatively old ages. Though fall in fertility has been observed
among women in all ages between 1981 and 2006. As per SRS,2007 in these four eastern states, the
contribution to fertility decline has mostly from women in the age group (20-24 years) as well as (25-29
|

2.9 Page 19

▲back to top


Population Foundation of India
years).In case of Bihar and Jharkhand the contribution is much more in the late reproductive years (40-44
years) and (45-49 years). Overall, during the past 13 years, since NFHS-1(1992-93), there has been contin-
uous fertility decline among the five states (Punjab, Maharashtra, Chhattisgarh, Gujarat, and Orissa). Out
of these four eastern states, barring Bihar and Jharkhand, there is a continuous fertility decline in Orissa
and West Bengal in between three consecutive National Family Health Surveys. The trend in between three
successive National Family Health Surveys suggests a clear slowdown in fertility decline in the seven years
between NFHS-2 and NFHS-3 compared with earlier period between NFHS-1 and NFHS-2. This slowdown
in fertility decline is mainly due to plateauing of fertility in rural areas. Three Successive rounds of National
Family Health Survey (NFHS), recording a rapid fall in fertility in Orissa and West Bengal during the nineties
and early twentieth century. The fall in fertility in West Bengal during the 1990s , higher than the national
decline, also document lesser contribution by younger women (15-29) than by older women(30-44) to
overall decline in fertility. Both SRS and NFHS report almost no childbearing among women in age group
45-49 in West Bengal. West Bengal and Orissa have reached the replacement level of fertility, i e, around
two children per woman. The urban areas of these two states already reached below replace­ment level
of fertility.
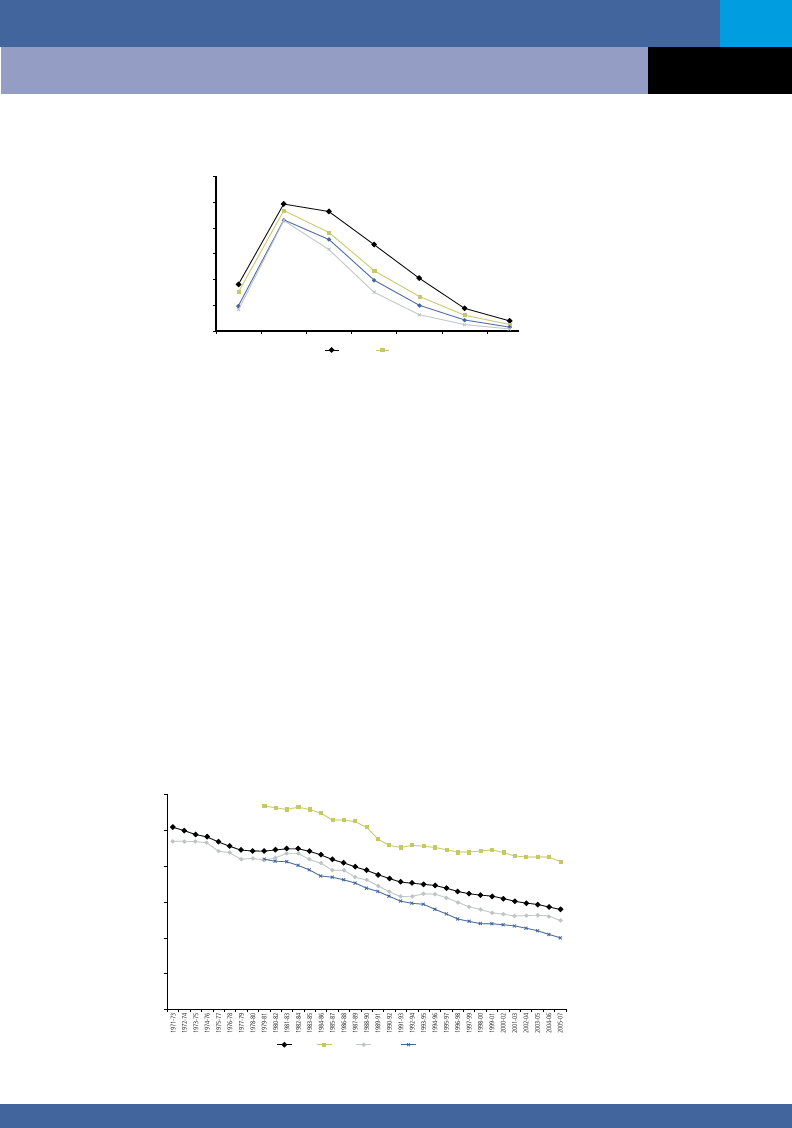
Figure 4: Age Specific Fertility Rate (ASFR) Bihar, Jharkhand, Orissa, West Bengal and India
Age Specific Fertility Rate in Bihar
300
250
200
150
100
50
Age Specific Fertility Rate in Jharkhand
250
200
150
100
50
0
15-19
20-24
1981
25-29
1991
30-34
35-39
2001
40-44
2007
45-49
0
15-19
20-24
25-29
2007
30-34
35-39
40-44
Age Specific Fertility Rate in Orissa
300
250
200
150
100
50
0
15-19
20-24
1981
25-29
1991
30-34
35-39
2001
40-44
2007
45-49
Age Specific Fertility Rate in West Bengal
250
200
150
100
50
0
15-19
20-24
1981
25-29
1991
30-34
35-39
2001
40-44
2007
45-49
10 |

2.10 Page 20

▲back to top


Population, Health & Social Development in Bihar, Jharkhand, Orissa and West bengal
Age Specific Fertility Rate in India
300
250
200
150
100
50
0
15-19
20-24
25-29
30-34
35-39
1981
1991
40-44
45-49
The age specific fertility rate (ASFR), for the four states shows that the greatest fall in fertility occurred
after 20 years of age. This may be because of fertility regulation with in marriage through the adoption of
contraception.
(b) Levels and Trends:
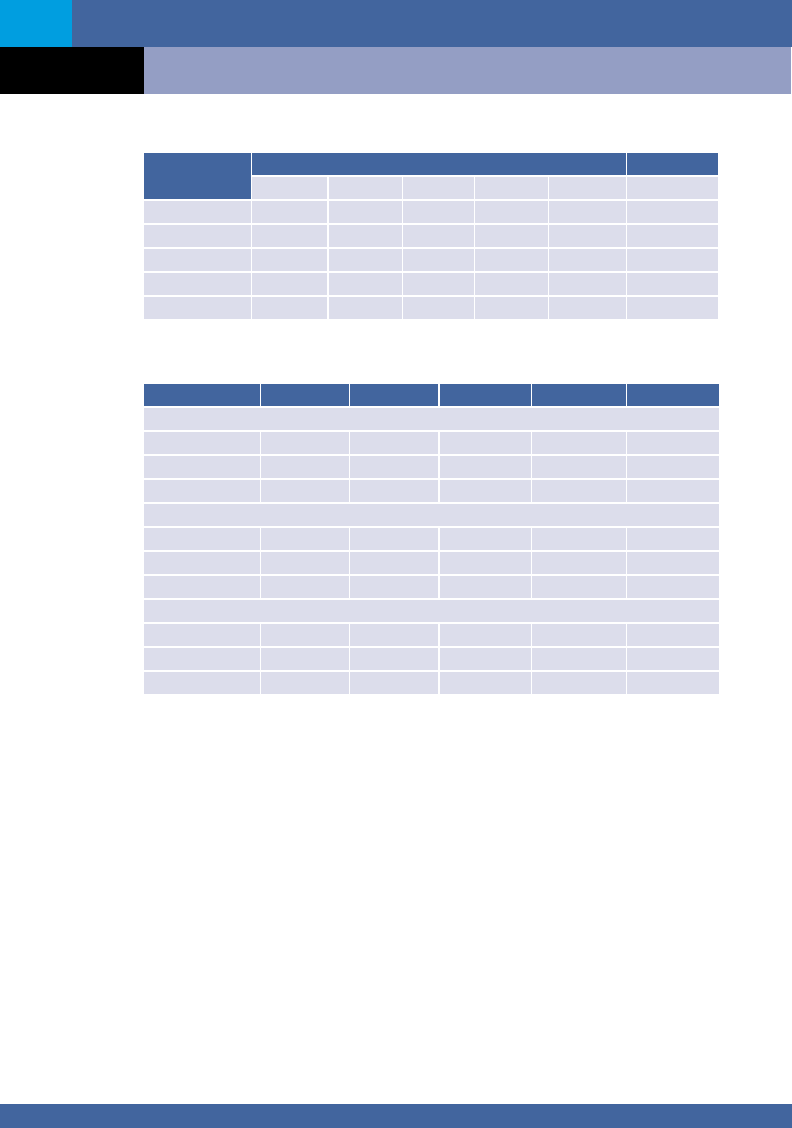
Fertility has been consistently declining in these four eastern states as indicated by trends in total fertility
rate (TFR) since the beginning of the 1970s for the major Indian states. Though the Southern states are
ahead in fertility transition and have total fertility rates lower than the eastern counterparts, West Bengal
is an example that blurs this east-south divide. The pace of fertility decline is very fast in West Bengal as
compared to the other states like Orissa, Bihar and Jharkhand. The Total Fertility Rate (TFR) remains a
concern for the state of Bihar and Jharkhand among these four eastern states. Substantial fertility decline
in West Bengal and Orissa despite some of the key social indicators such as gender inequality, socio-eco-
nomic backwardness and relatively higher infant mortality rate is mainly due to the effective implementa-
tion of the family welfare programme, female literacy, health care delivery and economic prosperity of the
households. The rural-urban fertility differential shows that in the two states of West Bengal and Orissa,
the urban fertility declined too much and it attained below replacement level fertility resulting further
decline in fertility. In West Bengal and Orissa the urban fertility reached near replacement level, but the
fertility in rural areas still above replacement level (NFHS-3, 2005-06).
Figure 5: Trends in TFR in Bihar, Orissa, West Bengal and India,1971-2007
6.0
5.0
4.0
3.0
2.0
1.0
0.0
India
Bihar
Orissa
West Bengal
| 11

3 Pages 21-30

▲back to top


3.1 Page 21

▲back to top


Population Foundation of India
Table-8: Fertility Decline
State
Bihar
Jharkhand
Orissa
West Bengal
India
1971
-
-
4.7
-
5.2
1981
5.7
-
4.3
4.2
4.5
TFR
1991
4.4
-
3.3
3.2
3.6
2001
4.4
-
2.6
2.4
3.1
2007
3.9
3.2
2.4
1.9
2.7
Decline
1971-2007
2.3
2.5
Source: SRS, Registrar General, India
Table-9: Fertility by Residence and State
Place of Residence
Bihar
Jharkhand
Orissa
NFHS-I (1992-93)
Total
Rural
Urban
Total
-
-
2.92
-
-
3.00
-
-
2.53
NFHS-II (1998-99)
3.70
2.76
2.46
Rural
3.82
2.72
2.50
Urban
2.61
2.95
2.19
NFHS-III (2005-06)
Total
4.00
3.31
2.37
Rural
Urban
4.22
3.69
2.48
2.87
2.32
1.89
West Bengal
2.92
3.25
2.14
2.29
2.49
1.69
2.27
2.54
1.59
India
3.39
3.67
2.70
2.85
3.07
2.27
2.98
2.06
Source: NFHS
(c) Replacement Level Fertility:
With the advent of fertility decline in the Eastern states, it is an opportune moment to look around the
replacement level fertility in these states. Since achievement of replacement-level fertility is crucial for the
long-term objective of ‘Stable population’ by 2045 in India and the medium term objective of reducing
the Total Fertility Rate (TFR) to replacement level by 2010, as laid down in the National Population Policy
2000(NPP), it is the need of the hour to examine the position of these four states in relation to the national
target of fertility decline. As per the RGI projections West Bengal (2000) and Orissa (2010) reached the
replacement level of fertility. Bihar and Jharkhand both yet to achieve replacement level fertility. As per the
projection Bihar will achieve the same by the year 2021 and Jharkhand will achieve the same by the year
2018.While the country as a whole will achieve the replacement level fertility also by 2015.In this regard
there is a need to examine the rural-urban differential in fertility for Bihar and Jharkhand. As majority of
the population still lives in rural set up, the prospects of population stabilization in near future depends
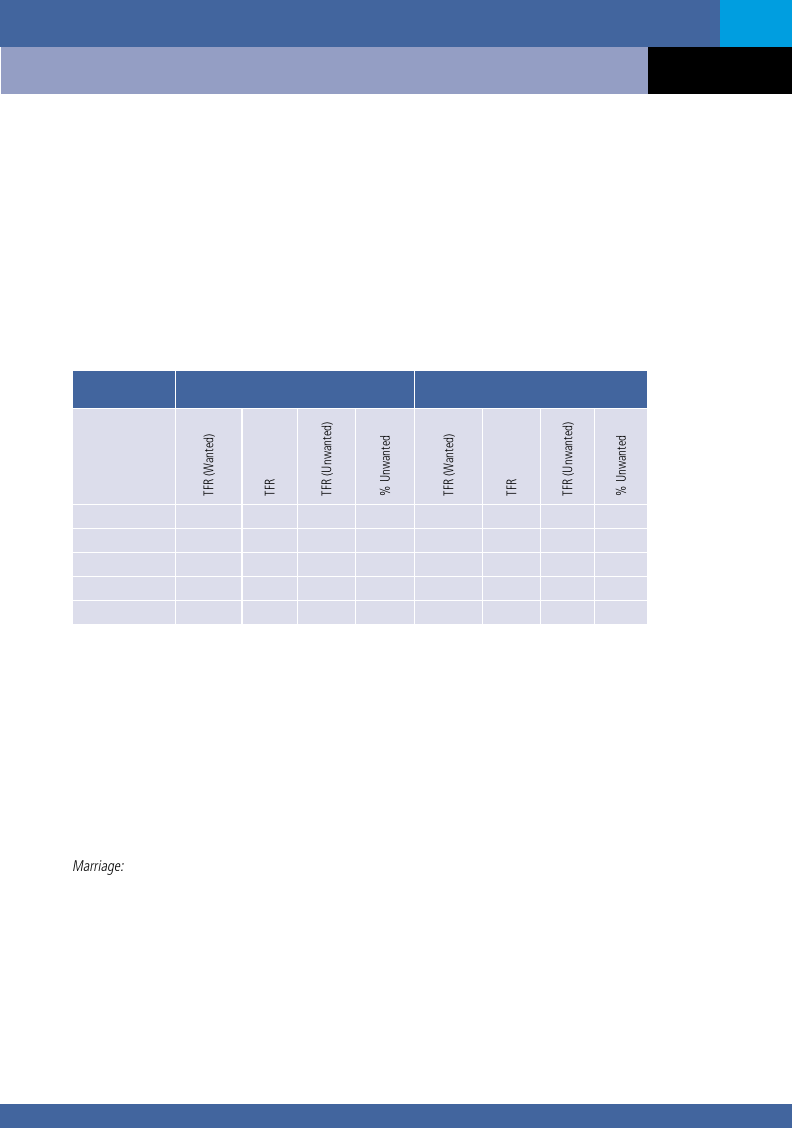
on the success of the efforts in rural areas. In all these four eastern states there is a decline in percentage
share of unwanted fertility rate to total fertility rate in between the two successive National Family Health
Surveys. Still in these states more than 25 percent of fertility are unwanted which can have averted to have
an impact on the Total Fertility Rate (TFR)
12 |

3.2 Page 22

▲back to top


Population, Health & Social Development in Bihar, Jharkhand, Orissa and West bengal
Till the large unmet needs for health and family welfare services are met, proposing any punitive measures
is clearly irrational. The two child norm policy is seen as being implemented in an environment where
women and the marginalized do not have adequate access to health care and is in fact an infringement of
reproductive rights because it tends to penalise women who anyway have little control over reproductive
decision making.
Given the crucial importance of population momentum (which in a way assures further population
growth in near future), no matter what we introduce – “two child norm” or even a “one child norm” to
pressurize people to go for less than two children / one child may simply be barking up the wrong tree.
This may be neither relevant nor particularly effective in bringing down the absolute number or the size of
population.
Table-10: Wanted and Un-wanted Fertility in Bihar, Jharkhand, Orissa and West Bengal
State
NFHS-III (2005-06)
NFHS-II (1998-99)
India
Bihar
Jharkhand
Orissa
West Bengal
1.9
2.7
0.8
30
2.13
2.85
0.7
25
2.4
4.0
1.6
40
2.58
3.49
0.9
-
2.1
3.3
1.2
36
-
-
-
26
1.8
2.4
0.6
25
1.90
2.46
0.5
23
1.7
2.3
0.6
26
1.78
2.29
0.5
22
Source: NFHS
(d) Proximate Determinants of Fertility:
The important among the proximate variables which can be relatively easily measured in surveys are
marriage, use of contraception, breastfeeding and use of abortion. Various policy interventions have at-
tempted to influence these factors. The minimum legal age for marriage in women is 18 years in India.
India’s family planning programme that was launched in the early 1950s has made contraceptive methods
widely and freely available through health facilities. Data available from the two National Family Health
Surveys conducted in the 1990s enable to estimate the contribution of these variables in the overall total
fertility and although the interval between the two surveys was only a little over six years, the changes in
the share of each of the variables over this period is also captured (Visaria,1999).
Marriage:
Higher age at marriage and large proportion of women remaining single have some effect on depressing
fertility compared to low age at marriage and marriage being universal for women. Other things being equal,
this would imply that women in Bihar and Jharkhand stay in marriage for longer period since they enter
marriage early and thereby are exposed to greater risk of pregnancy resulting in high fertility compared to
women in West Bengal and Orissa. This is very much reflected in the total fertility of these states as Bihar
and Jharkhand is yet to achieve replacement level of fertility where as West Bengal and Orissa have already
achieved the same. Among the four eastern states, the female median age at marriage is found to be highest
in Orissa (17.6 years) and lowest in Bihar (14.7 years). For males, the median age at marriage is found to be
highest in West Bengal (24.1 years) and lowest in Bihar (20.1 years).
| 13

3.3 Page 23

▲back to top


Population Foundation of India
Post-Partum Amenorrhoea:
In India breastfeeding is prolonged (around 25 months) and the estimated duration of breastfeeding
does not vary much. Longer duration of breastfeeding extends the period of postpartum amenorrhea thereby
increasing the inter-birth interval.
Abortion:
Induced abortion has been legal in India since 1972.But no reliable estimates of the number of abortions
exist, in part because many women attend private clinics for this service. The incidence of induced abortion
reported in demographic surveys is under reported. According to NFHS and other survey data only 1 or 2
percent of all pregnancies end in an induced abortion. But, some micro level studies suggest that the figure in
some parts of the country may be as high as 9 to 14 percent (Ganatra et al. 2001). It is likely that the current
incidence of abortion is high and on the increase, especially in the South, but data deficiencies mean that it is
difficult to assess the influence of induced abortion on fertility trends.
Contraception:
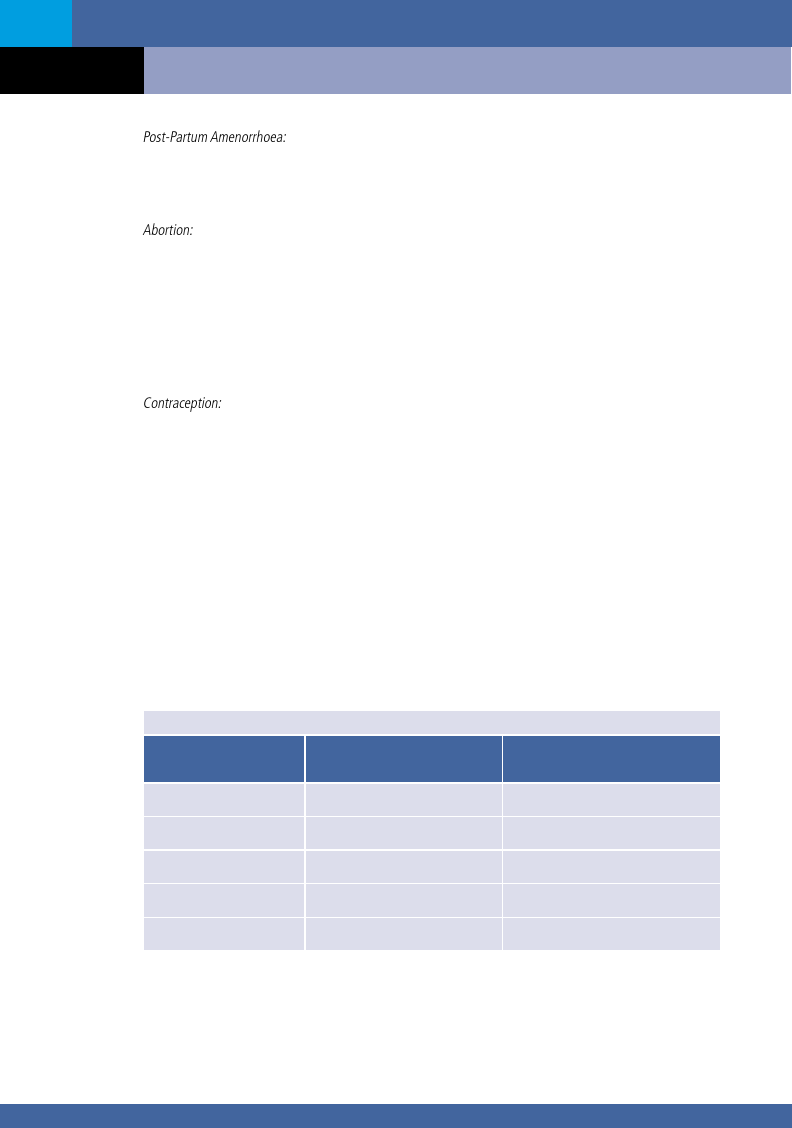
The fertility transition has been achieved overwhelmingly through increase in the use of modern
contraceptive methods, primarily female sterilization in these four states. The Contraceptive Prevalence
Rate (CPR) in these four states ranged in between 71 percent in West Bengal and low of 34 percent in
Bihar as per the NFHS-3(2005-06).The unmet need for contraception has declined in these four states,
but in case of Bihar the decline is minimal in between the last two National Family Health Surveys
(22.8 to 24.5).Among these four states, the use of modern contraceptives is lower than the national
average(48.5) for Bihar(28.9) and Jharkhand(31.1).Though, the use of contraception is higher in west
Bengal a major(21.3 percent) is from the traditional methods. Data from successive rounds of NFHS
shows, there is a consistent increase in the contraceptive prevalence rate in all the four eastern states.
The NFHS-3 data shows that out of the four eastern states, the use of contraception among youth(15-24
years) is found to be highest in West Bengal(54 percent) followed by Orissa(19 percent),Jharkhand(15
percent) and Bihar is having the lowest(13 percent).
Table-11: Contraceptive Prevalence Rate (CPR) and Unmet need for Contraception in
Bihar, Jharkhand, Orissa, West Bengal and India
NFHS-III (2005-06)
State/Country
Contraceptive Prevalence Rate
(CPR)-Any Method
Contraceptive Prevalence Rate
(CPR)- Any modern method
Bihar
34.1
28.9
Jharkhand
35.7
31.1
Orissa
50.7
44.7
West Bengal
71.2
49.9
India
56.3
48.5
Source: IIPS and Macro-international, 2007
14 |

3.4 Page 24

▲back to top


Population, Health & Social Development in Bihar, Jharkhand, Orissa and West bengal
State/Country
Bihar
Jharkhand
Orissa
West Bengal
India
State/Country
Bihar
Jharkhand
Orissa
West Bengal
India
NFHS-II (1998-99)
Contraceptive Prevalence Rate
(CPR)-Any Method
23.5
27.6
46.8
66.6
48.2
NFHS-I (1992-93)
Contraceptive Prevalence Rate
(CPR)-Any Method
23.1
-
36.3
57.7
40.7
Contraceptive Prevalence Rate
(CPR)- Any modern method
21.6
24.9
40.3
47.3
42.8
Contraceptive Prevalence Rate
(CPR)- Any modern method
21.6
-
34.7
37.6
36.5
Source: IIPS, 1993 and 1999
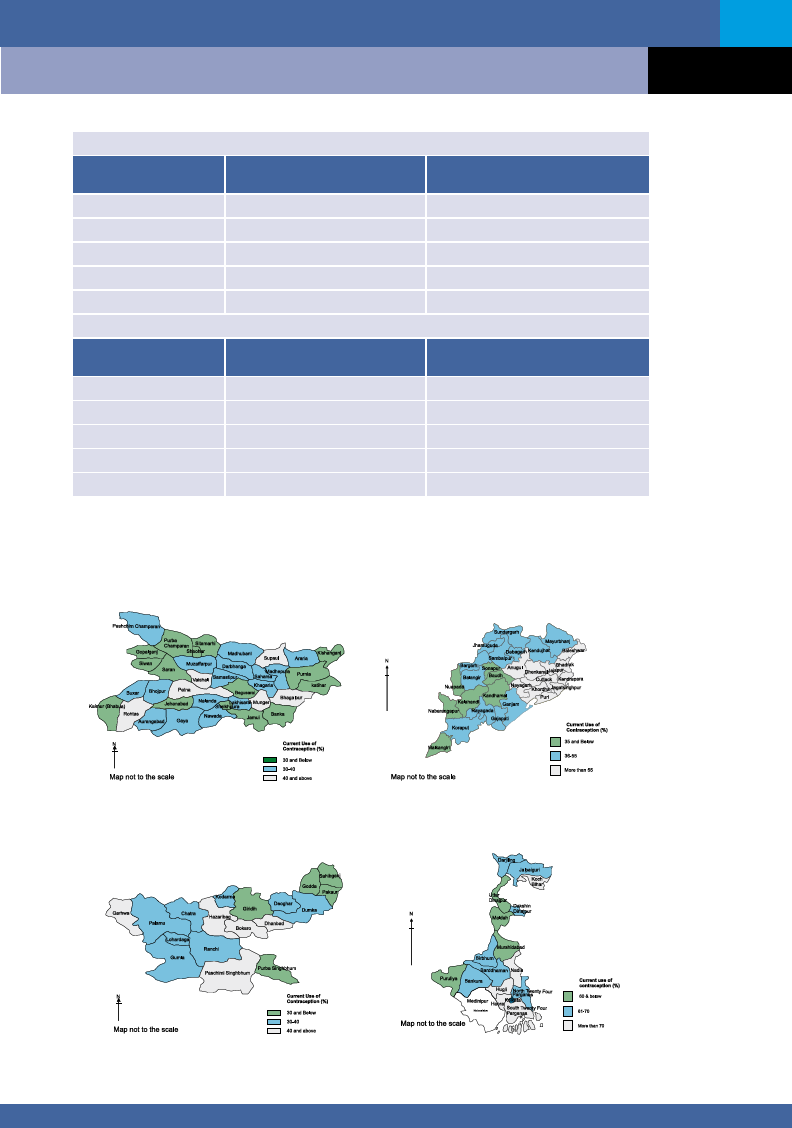
Map 1: District wise Contraceptive Prevalence Rate (CPR) any Methods in Bihar, Jharkhand,
Orissa and West Bengal, DLHS-3, 2007-08.
Bihar
Orissa
Jharkhand
West Bengal
| 15

3.5 Page 25

▲back to top


Population Foundation of India
Out of the four eastern states, barring West Bengal, the unmet need for contraception is higher than the
national average in the remaining three states. Jharkhand (23.1) is having the highest unmet need followed
by Bihar (22.8). In order to achieve replacement level fertility the unmet need for contraception is to be met.
Which will have substantial impact on reducing the un- wanted fertility in Bihar and Jharkhand. The unmet
need for limiting methods is higher than the spacing methods in Bihar, Jharkhand, Orissa as well as for India.
In two states (Bihar and Jharkhand) there is large unmet need both for spacing and limiting methods. In Bihar,
there is more demand for limiting methods, where as Jharkhand there is more demand for spacing methods.
The goal of attaining replacement level of fertility in Bihar and Jharkhand will largely depend on meeting the
unmet needs of contraception. The unmet need is consistently declining across these four eastern states as well
as for the country, which is clearly visible from the three rounds of National Family Health Survey. The states like
Bihar (31 percent) and Jharkhand (33 percent) are having more unmet need for contraception among youth
than West Bengal (15 percent) and Orissa (28 percent).
Table 12: Unmet Need for Contraception
State/Country
Bihar
Jharkhand
Orissa
West Bengal
India
Spacing
10.7
11.3
6.8
4.0
6.2
NFHS-III (2005-06)
Limiting
12.1
11.9
8.1
4.0
6.6
NFHS-II (1998-99)
State/Country
Bihar
Jharkhand
Orissa
West Bengal
India
Spacing
12.6
-
8.7
6.3
8.3
Limiting
11.9
-
6.8
5.5
7.5
NFHS-I (1992-93)
State/Country
Spacing
Limiting
Bihar
14.4
10.6
Jharkhand
-
-
Orissa
12.7
9.7
West Bengal
9.4
8.0
India
11.0
8.5
Source: IIPS, 1993; IIPS and ORC macro, 2000; IIPS and macro international, 2007
Unmet Need for Contraception
22.8
23.2
14.9
8.0
12.8
Unmet Need for Contraception
24.5
-
15.5
11.8
15.8
Unmet Need for Contraception
25.1
-
22.4
17.4
19.5
Table-13: Median age at first birth for women aged 25-49 years
States/Country
Bihar
Jharkhand
Orissa
West Bengal
India
Source: NFHS
NFHS-I
-
-
19.1
18.6
19.4
NFHS-II
18.9
18.7
19.6
19.2
19.2
NFHS-III
18.7
18.9
20.0
19.0
19.8
16 |

3.6 Page 26

▲back to top


Population, Health & Social Development in Bihar, Jharkhand, Orissa and West bengal
The age at which women start childbearing is an important demographic determinant of fertility. A higher
median age at first birth is an indicator of lower fertility. The table shows the median age at first birth for
the four Eastern states and India. There is a consistent increase in median age at first birth for Orissa and
Jharkhand in between NFHS-2 and 3. There is also rural-urban differential in median age at first birth. The
urban areas recorded higher median age at first birth than the rural areas.
As a result of socio-economic development and family planning interventions, the country recorded a
significant decline in fertility, fairly widespread across the different regions in the post-independence era. Yet
regional variations have played a significant role in the onset and speed of fertility transition in the country.
The states in the Eastern region such as Bihar, Jharkhand, Orissa and West Bengal has undergone through
substantial transformation in its fertility trend.
III. Mortality transition:
Among the components of population change, mortality has historically played an important role in
determining the growth of population. During the first and second stage of demographic transition, it is
mortality, which starts declining first, initially slowly and then rapidly, contributing to a gradually rising rate
of population growth as fertility decline generally starts with a time lag. Reduction in overall mortality is an
important objective of planning since the first five-year plan.
The National Population Policy 2000 (NPP, 2000), National Health Policy 2002 (NHP, 2002), RCH-2 (2005)
and National Rural Health Mission (NRHM, 2005) have simultaneously reinforced the need of reduction in
mortality particularly maternal and infant (including neonatal) mortality.
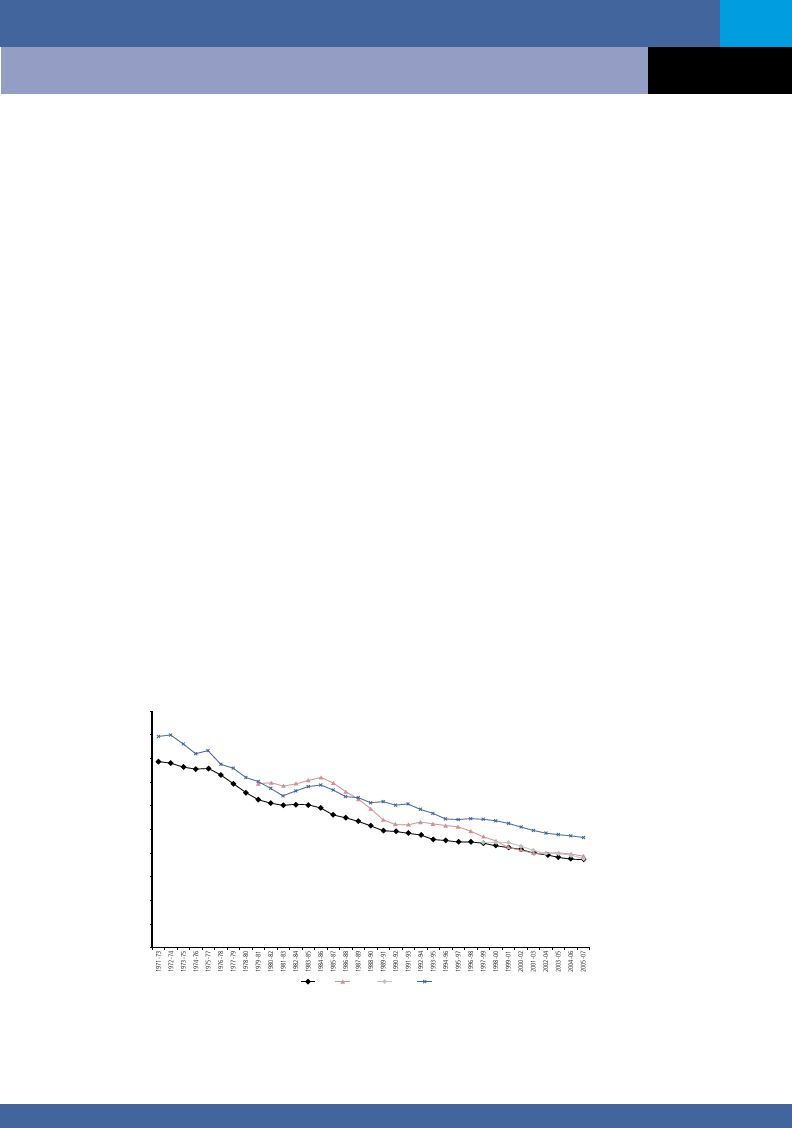
a. Crude Death Rate (CDR):
In the last thirty five years, the CDR at all India level declined from 14.9 in 1971 to 5.9 in 2007, i.e., 9.0
points decline during the period 1971-2007.Similarly, CDR for Bihar, Orissa and West Bengal declined
from 13.9, 13.1, 11.0 in 1981 to 6.0,9.0 and 6.2 in 2007. As seen from the table that the declining trend
in CDR has been fairly steady in three states (Bihar, Orissa and West Bengal
Fig. 6 Trends in Crude Death Rate in Bihar, Orissa West Bengal and India
20.0
18.0
16.0
14.0
12.0
10.0
8.0
6.0
4.0
2.0
0.0
India Bihar
Orissa
West Bengal
| 17

3.7 Page 27

▲back to top


Population Foundation of India
Table-14: Crude Death Rate (CDR) in Bihar, Jharkhand, Orissa, West Bengal
Crude Death Rate(CDR)
State
1971
1981
1991
2001
2008
Bihar
-
13.9
9.8
8.2
6.0
Jharkhand
-
-
-
-
7.1
Orissa
15.4
13.1
12.8
10.4
9.0
West Bengal
-
11.0
8.3
7.0
6.2
India
14.9
12.5
9.8
8.4
5.9
Decline
(1971-2007)
-
-
6.4
-
9.0
Source: SRS
The reduction in mortality is an integral part of demographic transition in these states and immensely
contributed to increase in life expectancy at birth.
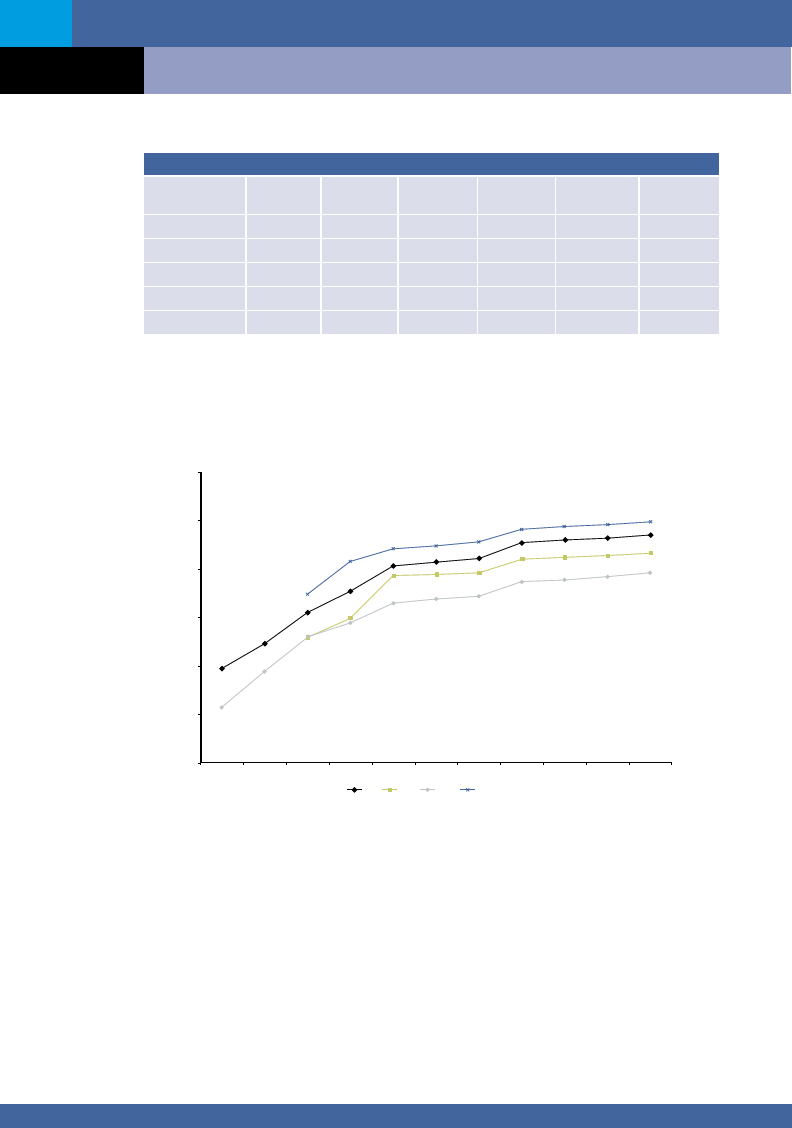
Figure No. 7: Life expectancy at birth in Bihar, Orissa, West Bengal and India
70
65
60
55
50
45
40
1970-75
1976-80
1981-85
1986-90
1991-95
1992-96
1993-97
1999-03
India Bihar
Orissa
West Bengal
2000-04
2001-05
2002-06
The SRS based abridged life tables provides the Life Expectancy at Birth (LEB) for the bigger states in India.
The above figure shows the LEB for the states; Bihar, Orissa, West Bengal and for the country as a whole. For
the states like Bihar and West Bengal, the data was available from 1981 onwards. It can be inferred from the
above figure that, Bihar and Orissa are having LEB below than the national figure. The state of West Bengal is
having higher values than the national figure. West Bengal is having higher LEB followed by Bihar and Orissa.
In between 1986-90, all the three states showed an increasing trend. The increase was found to be highest
in Bihar.
b Infant Mortality Rate (IMR):
Infant Mortality Rate (IMR) is considered to be one of the most sensitive indicators of health and develop-
ment, the table below presents the data for IMR for Bihar, Jharkhand, Orissa and West Bengal and India
for the period 1971-2008.
18 |

3.8 Page 28

▲back to top


Population, Health & Social Development in Bihar, Jharkhand, Orissa and West bengal
Table-15: Infant Mortality Rate (IMR)
State
1971
Infant Mortality Rate (IMR)
1981
1991
2001
2008
Decline
1971-2008
Bihar
-
118
69
62
56
-
Jharkhand
-
-
-
-
46
-
Orissa
127
135
124
91
69
58
West Bengal
-
91
71
51
35
-
India
129
110
73
66
53
76
Source: SRS
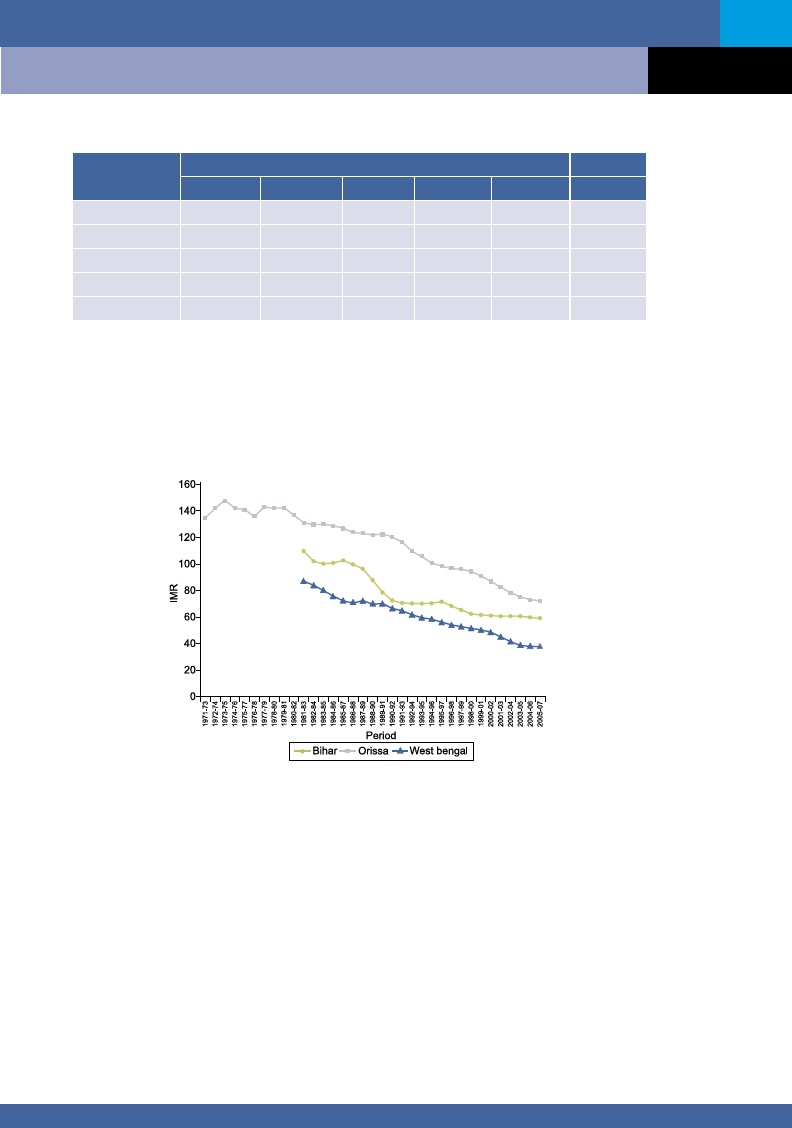
As seen from the table during the decade 1971-81 IMR has increased from 127 to 135 in Orissa, and
declined from 129-110 at the National Level. However during the decade 1981-91 Bihar, Orissa and West
Bengal showed a dramatic decline in IMR .In short IMR at all India level during the period 1971-2008 declined
from 129 to 53. Similarly, the decline in Orissa was from 127 to 69.
Figure 8: Trends in Infant Mortality Rate (IMR) in Bihar, Orissa and West Bengal
In early 1970s except the state of Orissa a declining trend in IMR was observed for the country. This decline
may be attributed to advancements made in the field of medicine, improvements in public health, availability
of immunization services and the general improvement in the living conditions. The pace of decine somewhat
slowed during late seventies in Orissa. Again the decline picked momentum in the eighties. The pace of mor-
tality decline is very fast in West Bengal as compared to the other three states. In case of the other three states
the pace mortality decline stagnated in early seventies, eighties and mid nineties as there was no reduction in
mortality trends. As there was also an increase in neo-natal mortality during these periods.
c. Maternal Mortality Ratio (MMR)
Maternal Mortality Ratio is defined as the number of maternal deaths (during pregnancy, child birth and
puerperal period) per 100,000 lakh life births. As per the latest estimates of maternal mortality ratio by
RGI, 2004- MMR for India stands at 254 per one lakh life births. The MMR figures for Bihar (including
Jharkhand) is 312, Orissa is 303 and West Bengal is141, the lowest among all the four eastern states.
| 19

3.9 Page 29

▲back to top


Population Foundation of India
d. Nutritional Status:
Malnutrition still continues to be one of the most leading problems in the states of this region and its
manifestations and consequences are diverse and alarming. The level of malnutrition in this region is also
quite high.
The table below presents data on the nutritional status of children in the four eastern states of Bihar,
Jharkhand, Orissa and West Bengal and India. The proportion of children who are stunted increased steadily
in between NFHS-2 to NFHS-3, where as proportion of underweight children increased in Bihar from 54.4
percent to 55.9 percent.
Nutritional Status of Children
Table 16: Weight-for-age (underweight)
State/Country
Under-Weight (Weight-for-age) Children
NFHS-I (1992-93)
NFHS-II (1998-99)
NFHS-III (2005-06)
Bihar
62.6
54.4
55.9
Jharkhand
-
-
56.5
Orissa
53.3
54.4
40.7
West Bengal
56.8
48.7
38.7
India
53.4
47.0
42.5
Source: National Family Health Survey
Table 16a: Height-for-age (stunting)
State/Country
Stunting(Height-for-age) Children
NFHS-I (1992-93)
NFHS-II (1998-99)
NFHS-III (2005-06)
Bihar
60.9
53.7
55.6
Jharkhand
-
-
49.8
Orissa
48.2
44.0
45.0
West Bengal
-
41.5
44.6
India
52.0
45.5
48.0
Source: National Family Health Survey
Table 16b: Weight-for-height (wasting)
State/Country
Wasting(Weight-for-height) Children
NFHS-I (1992-93)
NFHS-II (1998-99)
NFHS-III (2005-06)
Bihar
21.8
21.0
27.1
Jharkhand
-
-
32.3
Orissa
21.3
24.3
19.5
West Bengal
-
13.6
16.9
India
17.5
15.5
19.8
Source: National Family Health Survey
20 |

3.10 Page 30

▲back to top


Population, Health & Social Development in Bihar, Jharkhand, Orissa and West bengal
Table-17: Prevalence of anaemia among children (6-59 months) and women (15-49 years)
State/Country
Bihar
Any Anaemia
(Children)
78.0
Any Anaemia
(Women)
67.4
Jharkhand
70.3
69.5
Orissa
65.0
61.2
West Bengal
61.0
63.2
India
69.5
55.3
Source: NFHS-3 (2005-06)
The Anaemia level for women (69.5 percent) in Jharkhand and children (78.0 percent) in case of Bihar is
highest among these four states. In case of Bihar and Jharkhand the Anaemia level among children is higher
than the national average.
2. Health Transition in the Eastern States of India
Morbidity is an important indicator of the health status and quality of life. However, in India, one knows
very little about the actual and total morbidity load, in the local community and at the national level. In the
absence of appropriate national level epidemiological studies, there are two major sources of information
on the morbidity load; first, household studies and sample surveys which give information on the reported
morbidity; second incidence reporting under disease control programmes and hospital statistics. Obviously
both of them have serious limitation in informing us about the actual and total morbidity load.
There are two ongoing schemes for monitoring causes of death: survey of cause of death (SCD), which
provides information on ten broad categories of causes based on lay reporting in rural areas, and physician-
certified medical certification of cause of death (MCCD) in larger hospitals using the ICD-9 protocol. Started
in 1960 as the Model Registration System and renamed in 1982, the SCD aimed to collect data on cause
of death from 2500 selected primary health centres (PHCs), covering 4 PHCs per million rural population.
However, by 1994, only 1731 units were reporting causes of death under the SCD.
In 1998, the Registrar General of India suspended this scheme. A new verbal autopsy scheme based on
the SRS has been piloted from 1999.
Survey of “Causes of Death” had been merged with the Sample Registration System (SRS) from 1999, thus
encompassing both rural and urban areas. Since then, a system of Verbal Autopsy under the domain of SRS
has been in operation. In order to effect improvement in the system, the Office of the Registrar General, India
(ORGI) in collaboration with the Centre of Global Health Research (CGHR), University of Toronto has been
trying to establish a reliable system to measure the causes of death in the country.
The Special Survey of Deaths (SSD), undertaken in 2001-2003, has been carried out under the domain of
Sample Registration System (SRS), which covered over 6,645 small areas (sample units) in all the States and
Union Territories. The causes of death have been determined using an advanced form of Verbal Autopsy called
the “RHIME” or Representative, Re-sampled, Routine method. The SRS field staff that have been Evaluation
extensively for collection of the symptoms, signs and key circumstances leading to death using a two-page
structured from with a brief narrative in local language, have undertaken the survey. A random sample of
about 5-10% of the units have been resurveyed by an independent team to ensure the quality of field
work, completeness and accuracy. The assignment of causes of death has been done through a medical
evaluation by two independent trained physicians who have examined the field report using a web based
system developed specifically for the study.
| 21

4 Pages 31-40

▲back to top


4.1 Page 31

▲back to top


Population Foundation of India
Latest available Report on “Causes of Death in India 2001 and 2003” gives top 10 causes of death
region wise. The regions are divided into 6 categories viz: North, North East, East, Central, West and South.
Fortunately enough, the East region also comprises of the states of Bihar, Jharkhand, Orissa and West Bengal
which are similar to our focus states for the regional conference.
The table below (table-18) furnishes Top 10 causes of death (all ages as %) for the East region (i.e Bihar,
Jharkhand, Orissa and West Bengal)
Table 18:
Rank Cause of Death
1 Cardiovascular diseases
Male
19.5
Female
17.0
Person
18.3
2 Diarrhoeal diseases
9.0
12.0
10.4
3 Respiratory diseases
7.4
6.8
7.1
4 Perinatal conditions
5 Respiratory Infections
7.4
6.7
7.0
5.8
7.4
6.6
6 Senility
5.1
7.2
6.1
7 Tuberculosis
6.5
4.2
5.4
8 Malaria
5.0
5.7
5.3
9 Unintentional injuries: Other
10 Symptoms signs and ill defined condition
5.1
4.6
4.9
4.8
4.8
4.8
As observed from the above table;
•The highest proportion of deaths due to diarrhoeal diseases is observed in Eastern Region (10.4%)
•There is significantly higher proportion of all death due to communicable, maternal, perinatal and nutri-
tional condition in this region.
•Rural areas of this region report more deaths due to the above mentioned conditions (i.e communicable,
maternal, peri natal and nutritional condition).
• Perinatal conditions are responsible for 7% of deaths in the Eastern Region.
•The proportion of death attributable to tuberculosis in eastern region is 5.4 percent.
•In the eastern region deaths due to malaria are notably higher at 6% of deaths due to all causes.
No doubt the leading cause of death in this region is Cardiovascular diseases (18.3%), followed by
diarrhoeal diseases, Respiratory diseases, (namely Chronic Obstructive Pulmonary disease (COPD), Peri-natal
conditions (7.1) Respiratory Infections (6.6%) like acute pneumonia, tuberculosis (5.4%).
The above table also provides information breakup by sex. Notable differences by gender are not seen
except for diarrhoeal diseases with 12% of female deaths against 9% of male deaths.
Despite a projected decline in the overall burden, infectious and parasitic disorders will continue to
predominate the disease burden in the Eastern Region for the next 20-25 years.
National Family Health Survey (NFHS)
The National Family Health Survey (NFHS-3,2005-06) also provides morbidity pattern for Tuberculosis and
other life style morbidities like diabetes, asthma etc. In addition to this it also gives substance use such as
smoking bidi/cigarettes, chewing tobacco/gutkha and drinking of alcohol etc.
22 |

4.2 Page 32

▲back to top


Population, Health & Social Development in Bihar, Jharkhand, Orissa and West bengal
Table 19: Number of persons per 100,000 usual household residents suffering from any tuber-
culosis and medically treated tuberculosis, 2005-06
State
India
Bihar
Jharkhand
Orissa
West Bengal
Source: NFHS-3, 2005-06
Tuberculosis
445
797
659
418
605
Number of persons per 100,000 suffering from
Medically
Treated Tuberculosis
418
735
598
371
577
The above table depicts the prevalence of Tuberculosis in the four eastern states under study. Except
Orissa, in all the three states, number of persons suffering from Tb and medically treated Tb is higher than the
national figure. It is highest in Bihar followed by Jharkhand and West Bengal.
Table 20: Number of women and men age 15-49 per 100, 000 who reported that they have
diabetes, asthma, or goiter or any other thyroid disorders, 2005-06
State
Number of women per100,000
Diabetes
Asthma
Goitre or
Other
Thyroid disorder
India
881
1696
949
Bihar
1024
1696
853
Jharkhand
652
1291
858
Orissa
556
2533
362
West Bengal
1641
3304
1626
Source: NFHS-3, 2005-06
Number of Men per100,000
Diabetes Asthma
Goitre or
Other
Thyroid disorder
1051
1627
383
940
981
273
629
407
74
1179
1592
122
2323
4365
667
The above table provides health problems such as Diabetes, Asthma and Goitre or other Thyroid problems
for the four eastern states and for the country. The data available from NFHS-3 is being presented by sex. In case
of all the three health related disorders, West Bengal is having the highest figure among all the four eastern
states for women and men. The figure is also higher than the national figure. In all the four states as well as for
the country, Goitre or other Thyroid disorder is found to be more prevalent among women than men.
Table 21: Percentage of women and men age 15-49 who use any kind of tobacco, who smoke
cigarettes or bidis, and who drink alcohol, 2005-06
State
Women
Men
Who use
Any kind of
tobacco
Who smoke
Cigarettes/
Bidis
Who
Drink
alcohol
Who use
Any kind of
tobacco
Who smoke
Cigarettes/
Bidis
Who
Drink
alcohol
India
10.8
1.4
2.2
57.0
Bihar
8.0
4.9
1.0
66.5
Jharkhand
11.6
0.6
9.9
61.7
Orissa
31.4
0.3
7.3
68.8
West Bengal
15.6
1.3
1.7
70.2
Source: NFHS-3, 2005-06
32.7
31.9
29.0
34.9
19.4
38.9
27.1
39.6
50.1
34.0
The above table depicts the consumption of substances by sex (both men and women (15-49 years)) for all
the four eastern states and for the country as a whole. It can be clearly seen that consumption of substances
| 23

4.3 Page 33

▲back to top


Population Foundation of India
is more in case of men than women. For men, West Bengal is having the higher percentage (70.2 percent) for
tobacco consumption and smoking of cigarettes/ bidis (50.1 percent).These figures are substantially higher
than the national value. Interestingly, in case of Orissa, the consumption of alcohol among men is found to be
highest (39.6 percent), followed by Jharkhand (38.9 percent) and Bihar (34.9 percent). In all the four states
for men, the consumption of alcohol, is found to be more than the national average.
For women, the tobacco consumption is found to be highest (31.4 percent) in Orissa followed by West
Bengal (15.6 percent).Except Bihar, all the other three states are having figure above than the national
average. Interestingly, smoking of cigarettes is higher (4.9 percent) in case of Bihar, followed by West Bengal
(1.3 percent).Orissa is having the lowest figure(0.3 percent).Only Bihar is having the value above than the
national average out of the four eastern states. Alcohol consumption among women is found to be highest in
Jharkhand followed by Orissa. These two states are having value more than the national average.
Table A: Malaria cases and deaths – Bihar, Jharkhand, Orissa, West Bengal and India: 2001-2007
Country/
States
Bihar
2001
2002
2003
2004
2005
Malaria
cases
Pf cases
Malaria
cases
Pf Malaria Pf
cases cases cases
Malaria
cases
Pf cases
Malaria
cases
Pf
cases
4108 1027 3683 1705 2652 1080 1872 333 2733 427
2006
2007 (up to may)
Malaria
cases
Pf cases
Malaria
cases
Pf cases
2700 929
258
79
Jharkhand 130784 63471 126589 52892 118902 37482 143722 44238 193144 51676 189687 47177 47415 10123
Orissa
454541 379432 473223 393547 421323 350619 416732 351737 396573 342692 375907 327972 99302 86125
West Bengal 145053 42596 194421 60726 233802 76864 220871 60264 185964 41365 375907 327972 24332 6386
India
20854 1005236 18414229 897446 1869403 857101 1915363 890152 1817093 805699 1669333 756655 328474 163703
Table B: Kala-azar cases and deaths – Bihar, Jharkhand, Orissa, West Bengal and India: 2001-2007
Country/
States
Bihar
Jharkhand
Orissa
West Bengal
India
2001
2002
2003
2004
2005
2006
2007 (up to
may)
Cases Death Cases Death
10327 204 9684 160
589
-
758
-
-
-
-
-
1238
4
1592
5
12239 213 12140 168
Cases Death Cases Death Cases Death Cases
13960 187 17324 107 23383 124 29711
2607
5
4028 14 6578 12 7508
-
-
-
-
-
-
-
1487
7
2876 24 2706 15 1843
18214 210 24340 156 31217 157 39178
Death Cases
162 14272
11 1984
-
-
10 1023
187 17304
Death
64
6
-
7
79
Table C: Japanese encephalitis cases and deaths – Bihar, Jharkhand, Orissa, West Bengal and India: 2001-2007
Country/
States
2001
2002
2003
2004
2005
2006
2007 (up to July)
Cases Death Cases Death Cases Death Cases Death Cases Death Cases Death Cases Death
Bihar
48
11
8
1
6
2
85
28
192
64
21
3
-
-
Jharkhand
-
-
-
-
-
-
-
-
-
-
-
-
-
-
Orissa
-
-
-
-
-
-
-
-
-
-
-
-
-
-
West Bengal 119
21
301 105
2
1
3
1
12
6
-
-
-
-
India
2061 479 1765 466 2568 707 1714 376 6727 1682 2832 658
391
92
24 |

4.4 Page 34

▲back to top


Population, Health & Social Development in Bihar, Jharkhand, Orissa and West bengal
Table C:Dengue cases and deaths – Bihar, Jharkhand, Orissa, West Bengal and India:
For the last three years i.e 2005-2007 upto July
Country/States
2005
2006
2007 (up to May)
Cases
Death
Cases
Death
Cases
Death
Bihar
0
0
4
0
0
0
Jharkhand
-
-
-
-
-
-
Orissa
-
-
-
-
-
-
West Bengal
6375
34
1230
8
27
0
India
11985
157
12317
184
536
6
Source: MoHFW
Out of the above morbidities, malaria contributes significantly to the total morbidity in eastern region. The
number of malaria cases is high in Orissa and low in Bihar. In the tribal areas of eastern region problem of
genetic diseases like sickle cell disease (both sickle-cell trait (HbAS) and sickle-cell anaemia (HbSS), Glucose-
6-Phospate De-Hydrogenase (G-6-PD) deficiency and other Haemoglobinopathies are prevalent. In the tribal
regions these disorders are being aggravated by high level of inbreeding particularly in some of the primitive
tribes of this region due to customary consanguinity. This is based on findings reported by various researchers
and reputed research organizations like Regional Medical Research Centre (RMRC), Bhubaneswar and also on
author’s own earlier field work experience in tribal areas of this region (Orissa, Jharkhand and West Bengal)
spanning over three decades. Interestingly enough the tribal areas of this region particularly Orissa and
Jharkhand happen to be the areas of mining operations and having adverse health impact on the habitat of
tribal population. In this region, environmental pollution, the problem of flourosis is also prevalent in some
parts of Orissa. Similarly, the state of West Bengal is facing the problem of arsenic contamination, which is a
matter of great concern.
An estimated 2.31 million people in India are living with HIV(Annual Sentinel surveillance, NACO,2007).
Although the proportion of people living with HIV is lower than previously estimated, India’s epidemic continues
to affect large number of people and continues to be concentrated among high risk and vulnerable segments
of the population groups. In six high prevalence states (Andhra Pradesh, Maharashtra, Karnataka, Tamil Nadu,
Manipur and Nagaland) almost two third of the total HIV burden is concentrated. The epidemic shows a rising
trend in low prevalence states such as Bihar, Orissa and West Bengal. As a whole, with an estimated prevalence
of 0.34 percent, HIV/AIDS is one of the most serious health challenges, the country is facing today.
Integration/convergence of HIV/AIDS and Sexual & Reproductive Health (SRH) is an area of concern. An
assessment on the options and challenges for integrating HIV and SRH was conducted by PATH in 2006-07.
The assessment findings highlighted key gaps between policies and programme practice.
3 Issues, concerns and challenges: Demographic and Health
All the states of the eastern region namely Bihar, Jharkhand, Orissa and West Bengal (to some extent)
are experiencing the classical health problems of under development and social deprivation viz: nutritional
deficiencies and communicable diseases. The problems in these states are not necessarily and primarily one
of specific diseases calling for specific interventions along vertical lines, but a broad horizontal problem of
poverty, under development and social deprivation. Therefore diseases and health in the states of this region
should be looked at in the context of social needs and related to health and social inequalities. We have not
dealt deliberately on the strategies to address the state specific demographic and health challenges as these
topics will be discussed in detail in separate state specific key notes to be delivered..
The health and population scenario in these states of the eastern region, while presenting daunting
challenges, also opens up windows of opportunities, The overarching challenge faced by the states of this
| 25

4.5 Page 35

▲back to top


Population Foundation of India
region is to improve the health and nutrition status of the poor, especially women, To attend these goals
there is an urgent need to focus attention systematically addressing the issue of access quality and financing.
Providing basic human needs and entailments – food shelter and safe water is also a major challenge. One
of the important challenge facing health sector reforms today is to approach the health delivery system
from below (decentralized/bottom up planning) and explore how services can reach the needy – there by
integrating gender and social equity issues into health sector reforms of the state in the eastern region. In fact
ensuring equity in health still remains the biggest challenge in this region.
Demographic Challenges
Fortunately enough in these four states excepting Bihar and perhaps to some extent Jharkhand, the other
two states (West Bengal and Orissa) are in relatively better of in the areas of fertility reduction. West Bengal
has already reached the TFR of 2.1 in the year 2003 and Orissa will be reaching soon.
One of the major challenges for the states of Bihar and Jharkhand is in the population front and fertility reduction.
Which will help them to achieve population stabilization in the forseable future. The issue of population stabilization
needs a gender-balanced and rights-based approach rather than a top-down authoritarian approach.
Strategies for achieving population stabilization should include impairing socio economic indicators such
as addressing the needs of maternal care, child health and contraceptive services, education of girls, ensuring
a minimum age at marriage of girls, reducing infant mortality and maternal mortality through better health
care and immunization, nutrition support to women and children.
A multipronged approach is required for population stabilization such as – strong campaign for delaying
age at marriage after 18 years, in delaying age at first pregnancy, in ensuring institutional delivery and meeting
the unmet demand for contraception.
Till the large unmet needs for health and family welfare services are met, proposing any punitive measures
is clearly irrational. The two child norm policy is seen as being implemented in an environment where
women and the marginalized do not have adequate access to health care and is in fact an infringement of
reproductive rights because it tends to penalise women who anyway have little control over reproductive
decision making.
What is not clearly required are counter productive punitive measures. Also given the age structure of the
population in these states (Bihar & Jharkhand) there is an inbuilt momentum which coercive measures can
do nothing.
Population Foundation of India (PFI) and Population Reference Bureau (PRB) projected the population of all
the states and UTs till the year 2101.The table below, shows the projected figure for all the four eastern states
and for the country. The two scenario’s differ from each other in terms of assumption of Total Fertility Rate
(TFR). In Scenario A, the ultimate fertility level is 2.1 children and, in Scenario B, 1.85 children. Under Scenario-
A, Bihar will stabilize with a TFR of 2.1 in between 2081-86 and under scenario-B, it will be in 2061-66.
The Eastern region is at a stage of demographic transition and is indeed in the midst of a process where
it faces the window of opportunity created by the demographic dividend. During the first three decades of
post independence (i.e 1951-1981) development while mortality rates fell significantly the fertility rate remain
more or less stagnant and this increased the population of young people (10-24 years) significantly. Therefore,
in this region investing in young people equitably in their education, nutrition, skill, employment, and health
assumes urgency and importance. Clearly a failure to do so will have long term repercussion on individual
lives, security, demography, health systems, economy and development of this conflict ridden/affected region
of Eastern India. According to NFHS-3, there exists gender differential with respect to employment and
mass media exposure among youth in these eastern states. Out of the four states, the percentage of youth
population is highest in Orissa and West Bengal (18.3 percent) followed by Jharkhand (17.3 percent) and
26 |

4.6 Page 36

▲back to top


Population, Health & Social Development in Bihar, Jharkhand, Orissa and West bengal
Bihar (16.3 percent). All these states are having proportion of youth population below the national average
(18.5 percent).
Out of the 1029 million people in India, 286 million are now living in urban settlements. The net addition
to the urban population during 1991-2001 has been of 67 million people. The urban proportion to total
population in the country now stands at 27.8 percent compared to 25.7 percent in 1991.The urban population
of the Indian republic of 25.9 million in 1901-just 10.8 percent of the total population-has increased
monotonically over time to 286.1 million in 2001 accounting for 27.8 percent of the country’s population
India is witnessing rapid urbanization with an estimated about 300 million people living in towns and cities.
The urban population, which was 28 per cent in 2001, is expected to increase to 38 per cent by 2026.The
increase in urbanization; in other way is having an incremental effect on slum population. In India, about 100
million people are living in slums or slum like conditions characterized by overcrowding, poor hygiene and
sanitation etc. It is therefore, the health of the urban poor is poorer than the rural population. The eastern
states in India are no exception to this phenomenon. Due to the above the health of the urban poor is a matter
of concern and needs urgent attention.
Health Challenges
National Rural Health Mission ( NRHM) under the Ministry of Health and Family Welfare, (MOHFW),
Government of India has recently (2008) brought out a document entitled “India Guaranteeing Quality
Primary Health Care for All: An Agenda for Action”. In this book, key public health challenges have been
identified state wise and have been furnished in a tabular form.
Key Public Health Challenges in States of India
Indicator
States with higher incidence/lower performance
requiring greater thrust- Public Health Challenges
1 Infant Mortality
MP, UP, Orissa Rajasthan, Chattisgarh, Bihar Assam
2 Maternal Mortality
Assam, Bihar, MP, Orissa Rajasthan, UP
3
Very high out of pocket expenditures in
Government hospitals
Bihar Haryana, Punjab Rajasthan, UP, Assam, Karnataka,
Orissa
4
High TB Cases/suspected cases, chest symptoms
Jharkhand, Bihar, Gujarat, UP, West Bengal, Assam, Andhra
Pradesh, Tamil Nadu
5 High TFR
MP,UP, Bihar, Jharkhand, Chattisgarh, Rajasthan
6 Full immunization
Rajasthan, UP, MP, Bihar, Jharkhand
7 Diabetes
Kerala, Tamil Nadu, Tripura Goa, West Bengal, Delhi
8 Asthma
West Bengal, Kerala, Mizoram, Sikkim, Tripura
9 Malaria
Assam, Maharashtra, Karnataka, West Bengal, Orissa,
Rajasthan, UP, Gujarat Chhattisgarh Jharkhand MP, Arunachal
Pradesh, Meghalaya
10 Tobacco and alcohol
11 Age at marriage
12 Diarrhoea and availability of ORS
Rajasthan, Chattisgarh, MP, Bihar, Jharkhand, Orissa, West
Bengal, Mizoram, Meghalaya, Tripura, Nagaland, Assam,
Arunachal Pradesh, Sikkim, Andhra Pradesh, Goa, Kerala, Tamil
Nadu, Punjab, Chhttisgarh.
Bihar, Jharkhand, Rajasthan, Andhra Pradesh, West Bengal,
MP, UP, Chhattisgarh
UP, Assam, Rajasthan, Nagaland, Jharkhand
13 HIV prevalence
14 Spousal physical or sexual violence
Manipur, Andhra Pradesh, Karnataka, Maharastra, Tamil Nadu
MP, Rajasthan, Bihar, Tripura, Manipur, UP, Tamil Nadu,
West Bengal, Assam
| 27

4.7 Page 37

▲back to top


Population Foundation of India
Concern
The health problems in the eastern region show a complex Epidemiology. In one hand, Orissa is
experiencing the problems of poverty, social deprivation, and under nutrition and on the other, new diseases
related to behavior and life style (non communicable diseases (like cardio vascular diseases, hypertension,
chronic respiratory diseases, diabetes and cancer etc.) are in the rise. Thus, presently, there is a double burden
of diseases.
Though, there is no doubt, a double burden of diseases, but an area of concern is a tendency to highlight
the growing burden of non-communicable diseases and reducing the focus on communicable diseases from
a very significant part of morbidity and mortality burden of existing health system in the eastern region i.e.,
Bihar, Jharkhand, Orissa and West Bengal. Incidentally, the high incidence of communicable diseases including
infectious diseases ((a)Water-borne-Diarrhoea and Hepatitis, (b)Air-borne-Pneumonia, Measles and TB, (c)
Vector-borne-Malaria, Kala-azar, Japanese encephalitis and Dengue) in this region is due to poverty and
malnutrition and other environmental factors such as poor sanitation and lack of safe drinking water.
Programmes focused on this category of disease i.e. communicable disease are relatively in-expensive and
offer a significant scope for rapid reduction of morbidity and mortality burden in this region. Unfortunately enough,
there has been an undesirable shift of attention away from communicable disease burden. This is in fact a matter
of grave concern; therefore, there is an urgent need for proactive and sustained advocacy effort against this.
4. Conclusion and the Way Forward
To sum up, in this region, the state of Orissa (69) has one of the highest Infant Mortality Rate (IMR)
according to the latest Sample Registration System (SRS), 2008. Bihar (56) is having little more than the
national average (53). However, the states of West Bengal (35) and Jharkhand (46) perform relatively better.
Maternal Mortality Ratio (MMR) in this region is also relatively high. All the states of this region excepting
West Bengal (141) are in the higher side than the national average (254).
In this region there is a need to focus on reducing IMR and MMR. The challenge of reducing infant mortality
particularly during the neo-natal period also depends strongly on public action to assure that a range of good
quality basic health care services made available equitably. Reducing maternal mortality requires that a continuum
of services be available to address risk factors and complications. Verbal autopsy audit of all such deaths would
help us to understand the leading causes of such events for taking necessary action. The participation of various
community based organizations, NGOs, PRIs and local experts should be encouraged during the audit.
The slow pace of health sector reforms in the eastern states (except perhaps – West Bengal) poses a major
challenge. Also poverty, social justice and gender issues have not been brought to centre stage in health sector
reforms. Linking health programmes to poverty alleviation is critical in the context of the states of this region
because the burden of health services falls disproportionately on the poor. Poverty remains one of the main
reasons for untreated illness, thereby resulting in a sharp increase in morbidity. This burden is compounded
further in a situation of unequal gender relations on the one hand and unequal social status on the other.
In reality, the health delivery system as it exists today is based on loosely integrated vertical programmes
of reproductive and child health, control of communicable diseases, and a stand alone HIV / AIDS prevention
/ control programme. However, now that the National Rural Health Mission is in place, one can take the
opportunity of this programme platform.
The NRHM appears to have brought back the Primacy of Primary Health Care as advocated in the ‘ Health
for All’ -Alma Ata declaration in 1978 with its emphasis on equity and strong people’s participation addressing
the underlying social, economic and political causes of poor health. People say that primary health care was
tried and failed. In fact, in our country it has never been tried in its true spirit, in the comprehensive form as
advocated at the Alma Ata.
28 |

4.8 Page 38

▲back to top


Population, Health & Social Development in Bihar, Jharkhand, Orissa and West bengal
The goal and objectives of NRHM in the framework for implementation clearly states in the intent to work
on nutrition, water, sanitation and gender issues as health determinants. In fact “Communitisation” is the
hallmark of NHRM. This component of the mission includes the training of ASHAs, VHSCs, which works closely
with PRI members, village health planning, community monitoring possibly of inter-sectoral co-ordination
with Integrated Child Development Services (ICDS) and untied funds and offers concrete ways by which the
strategy to improve nutritional status can be introduced.
Available research indicates that a broad based policy approach is the best avenue for readdressing health
disparities in less developed countries (Dara Carr, 2004).
Therefore to accelerate Health Transition the Sate Governments of Bihar, Jharkhand, Orissa and West
Bengal can optimally use their existing resources (both financial and human) to produce good health. The
issues to be focused are the following:
•Livelihood, Nutrition and Housing
•Education and Empowerment of Women
•Safe Water & Sanitation
•Investment to improve Access to Effective Primary Health Care
The issue of population stabilization in the states of Bihar and Jharkhand should be tackled in a holistic
manner by utilizing the existing platform of NRHM because family planning programmes can not be addressed
in isolation and has to be positioned under the broader context of comprehensive primary health care and
therefore there is an opportunity to be used as a part and parcel of the flagship programme. Population
stabilization is not merely about numbers; it has to be looked at in the context of wider socio - economic
development.
As mentioned earlier, NRHM provides a platform for :
• Fostering inter-sectoral co-ordination.
•Decentralized planning and implementation.
•Strengthening of Primary Health Care.
•Involving communities in monitoring services and convergence at the village level.
Primary Health Care (PHC) is the backbone of the NRHM. PHC is not something to be “delivered” by a
benign Government alone. The community has to play a major and a vital role in ensuring a successful health
care system. The community can ensure accountability and efficacy and outreach of the health care system.
This unique opportunity has to be meaningfully utilized by the civil society provided by the Mission and
should not be missed.
| 29

4.9 Page 39

▲back to top


Population Foundation of India
References
1.Ali A. and Mishra N.R. (2008) Demographic Transition in Punjab, Haryana & Himachal Pradesh, Issues
and Challenges for Population Stabilization in the conference volume on Health, Population and Social
Development in Chandigarh 23-24 October 2008.
2.Ali A., Nayak S. & Mukhopadhyay S. (2007) State of Health in Bihar. PFI, 2007
3.Ali A. (2002) Population Scenario of India and National Population Policy-pp 329-342 in Population
Stabilization and Development, The Universe, Cuttack, 2002
4.Ali A (2004) The Myth of Population Explosion: Reflections in NPP and State Population Policies in the
Health for Millions Vol 30, Nos. 3 & 4 August –Sept. , Oct-Nov., 2004, VHAI, New Delhi.
5. Bose A. (1996) Demographic Transition and Demographic Imbalance in India PP 89-99 in Health
Transition Review, Supplement to Vol 6 1996
6.Carr, D (2004) Improving the Health of the World’s Poorest People.
7.International Institute for Population Sciences (1995), National Family Health Survey India, 1992-93,
Bombay
8.International Institute for Population Sciences, Mumbai and ORC macro Maryland(2000),National Family
Health Survey, India 1998-99; India
9.International Institute for Population Sciences (IIPS), 2006, National Family Health Survey-III,2005-06:
India.Volume I, IIPS, Mumbai
10.International Institute for Population Sciences (IIPS), 2007, District Level Household Survey (DLHS)-
III,2007-08, Fact Sheets for Bihar, Jharkhand, Orissa, West Bengal, IIPS, Mumbai
11.MoHFW (2000) National Population Policy -2000, Ministry of Health and Family Welfare, Government of
India
12.MoHFW (2007) Annual Report 2006-07, Ministry of Health and Family Welfare, Government of India
13.MoHFW (2008) Annual Report 2007-08, Ministry of Health and Family Welfare, Government of India
14.MoHFW (2008) India Guaranteeing Quality Primary Health Care For All: An Agenda For Action, NRHM,
New Delhi 2008
15.National Institute of Health and Family Welfare and National AIDS Control Organization (2007) Annual
Sentinel Surveillance for HIV Infection in India. Country Report 2006
16.Nanda A.R. (2002) Not Just a Number Game PP29-32, in Seminar Beyond Numbers, No 511,
March,2003
17.Nanda A.R. (2004) Obsolescence and Anachronism of Population Control: From Demography to Demology
in Demography India pp 1-12, Vol 33, No 1,2004
18. Population Foundation of India (PFI), New Delhi and Population Reference Bureau (PRB) (2007), The
Future of Population of India, a Long Range Demographic View.
19. Population Foundation of India (PFI), New Delhi (2008), Infant and Child Mortality in India: District Level
Estimates
20. Premi Mahendra K, (2009) India’s Changing Population Profile
30 |

4.10 Page 40

▲back to top


Population, Health & Social Development in Bihar, Jharkhand, Orissa and West bengal
21. Poverty Estimates for 2004-05. Press Information Bureau, Planning Commission, Govt. of India, New
Delhi, March 2007
22.Registrar General of India, Report on Medical Certification of Cause of Death,2002, Office of the RGI,
(2008)
23.Registrar General of India, Report on Causes of Deaths in India, 2001-2003, Office of the RGI, (2009)
24.Sample Registration System Bulletin, Office of the Registrar General of India, New Delhi, vol. 44 (1),
October 2009.
25.Sample Registration System. “Maternal Mortality in India 2004-06: Trends, Causes and Risk Factors”.
Office of the Registrar General of India, New Delhi, 2009
26.Sample Registration System, Special Bulletin on Maternal Mortality in India 2004-06, Office of the
RGI,2009
27.Sample Registration System, SRS Based Abridged Life Tables, Office of the RGI,2004-06
28.Visaria, L. 1999. “Proximate Determinants of Fertility in India: An Exploration of NFHS Data”, Economic
and Political Weekly, Vol. 34, Nos. 42 and 43, October, pp. 3033-3040.
| 31

5 Pages 41-50

▲back to top


5.1 Page 41

▲back to top


bihar
at a glance

5.2 Page 42

▲back to top


Population Foundation of India
Bihar
Showing
Districts
Map not to scale
34 |

5.3 Page 43

▲back to top


Population, Health & Social Development in Bihar, Jharkhand, Orissa and West bengal
STATE PROFILE
Bihar
Key Demographic, Health and RCH Indicators at a glance
General Information
Area (sq. kms.)
No. of Districts
No. of CD Blocks
No. of Villages
No. of Towns
Demographic Particulars (Census, 2001)
Population
Persons
Males
Females
Rural (%)
Urban (%)
Scheduled Castes (%)
Scheduled Tribes (%)
Elderly population (60+ years) (%)
Young people (10-24 years) (%)
Adolescents (10-19 years) (%)
Decadal Growth Rate, 1991-2001 (%)
Population density (per sq. km)
Sex Ratio (females per 1000 males)
Child Sex Ratio (0-6 years) (girls per 1000 boys)
Literacy rate
Persons
Males
Females
Work participation rate
Female work participation rate
Proportion of people living below poverty line, 2004-05
Per capita net state domestic product at current prices in rupees, 2005-06
Human Development Index (HDI), 2001 (among 28 states)
Value
Rank
Social Development Index (SDI), 2001 (among 20 major states)
Rural
Value
Rank
Urban
Value
Rank
Household Amenities (%), Census 2001
Households with kutchha houses
Households with safe drinking water
Households with electricity connection
Vital Indices
Crude Birth Rate (CBR), 2008, SRS
Total Fertility Rate (TFR), 2007, SRS
94163
37
533
45098
130
82998509
43243795
39754714
89.5
10.5
15.7
0.9
6.6
29.7
22.0
28.6
881
919
942
47.0
59.7
31.1
33.7
18.8
32.5
6610
0.365
26
16.13
20
27.1
19
34.3
86.6
10.3
28.9
3.9
| 35

5.4 Page 44

▲back to top


Population Foundation of India
Age Specific Fertility Rates, 2007, SRS
15-19 years
20-24 years
25-29 years
30-34 years
35-39 years
40-44 years
45-49 years
General Fertility Rate, 2007,SRS
Gross Reproduction Rate, 2007, SRS
Life Expectancy at Birth, 2000-2004, SRS
Crude Death Rate (CDR), 2008, SRS
Maternal Mortality Ratio (MMR), 2004-06, RGI
Child Mortality Rate (CMR), 2007, SRS
Infant Mortality Rate (IMR), 2008, SRS
Neo-natal mortality rate, 2007, SRS
Early neo-natal mortality rate, 2007, SRS
Late neo-natal mortality rate, 2007, SRS
Post neo-natal mortality rate, 2007, SRS
Peri-natal mortality rate, 2007, SRS
Still birth rate, 2007, SRS
Key RCH and Nutrition Indicators (%)
Girls marrying below 18 years, DLHS, 2007-08
Women (20-24) reporting birth of order 2 & above, DLHS, 2007-08
Current use of any FP method, DLHS, 2007-08
Total unmet need, DLHS, 2007-08
Mothers who received any antenatal check-up, DLHS, 2007-08
Mothers who had three or more ANC, DLHS, 2007-08
Mothers who consumed IFA tablets, DLHS, 2007-08
Safe delivery, DLHS, 2007-08
Institutional delivery, DLHS, 2007-08
Children with full immunization (12-23 months), DLHS, 2007-08
Children under 3 years who are underweight, NFHS-3, 2005-06
Children under 3 years who are stunted, NFHS-3, 2005-06
Children under 3 years who are wasted, NFHS-3, 2005-06
Children age (6-59 months) who are anaemic, NFHS-3, 2005-06
Ever married women age (15-49 years) who are anaemic, NFHS-3, 2005-06
Medical/Health Infrastructures/Institutions
Community Health Centres (CHCs)
Primary Health Centres (PHCs)
Sub Centres (SCs)
Information on HIV/AIDS (%)
Women who have heard of HIV/AIDS, NFHS-3, 2005-06
Men who have heard of HIV/AIDS, NFHS-3, 2005-06
Women who know that HIV/AIDS can be prevented by using condoms, NFHS-3, 2005-06
Men who know that HIV/AIDS can be prevented by using condoms, NFHS-3, 2005-06
HIV+ among ANC clinics (%)
HIV+ among STD clinics (%)
Number of Integrated Counseling and Testing Centres (ICTC formerly VCTC)
Number of Prevention of Parent To Child Transmission Centres (PPTCTC)
Number of Anti Retroviral Therapy (ART) Centres
36 |
49.1
265.7
227.8
134.1
64.8
32.6
12.2
128.9
1.9
61.2
7.3
312
19
56
31
27
4
27
28
1
46.2
59.6
32.4
37.2
59.3
26.4
9.3
31.9
27.7
41.4
55.9
55.6
27.1
78.0
67.4
70
1641
8858
38.7
75.2
22.8
62.3
0.36
1.05
99
42
4

5.5 Page 45

▲back to top


districts
at a glance
| 37

5.6 Page 46

▲back to top


Population Foundation of India
dai srtar irc tia
ShowIiNnDgIA CD Blocks
BIHAR
DISTRICT ARARIA
KILOMETRES
5
0
5
E
P
A
L
NARPATGANJ
NARPATGANJ
KURSAKATTA
KURSAKATTA
SIKTI
SIKTI
FORBESGANJ
FORBESGANJ
ARARIA
PALASI
PALASI
ARARIA
JOKIHAT
BHARGAMA
RANIGANJ
RANIGANJ
BHARGAMA
D
T
I
S
T
R
I
C
JOKIHAT
N
R
U
P
BOUNDARY, INTERNATIONAL
,,
DISTRICT
,, C.D. BLOCK
HEADQUARTERS: DISTRICT, C.D. BLOCK
38 |

5.7 Page 47

▲back to top


Population, Health & Social Development in Bihar, Jharkhand, Orissa and West bengal
DISTRICT Araria
General Information
Household Amenities, (%), Census 2001
Area (Sq. Kms.)
2830.0
Households with kutchha houses
Percent to total state’s area
3.0
Households with safe drinking water
C D blocks
9
Households with electricity connection
Towns
3 Vital Rates
No. of villages
783
Crude Birth Rate, 2001
Total Fertility Rate, 2001
Demographic Particulars (Census, 2001)
Population
Persons 2158606
Infant Mortality Rate, 2001
Key RCH Indicators from District Level
Household Survey, 2007-08 (%)
Girls marrying below 18 years
Males 1128105
Birth order 3 and above
Females 1030503
Current use of any FP Method
Rural (%)
Urban (%)
Scheduled Castes (%)
93.9
Total unmet need
6.1
Mothers who had at least 3 ANC visits during
the last pregnancy
13.6
Scheduled Tribes (%)
1.4
Elderly population (60+ years) (%)
5.4
Young people (10-24 years) (%)
28.5
Institutional delivery
Adolescents (10-19 years) (%)
21.3
Decadal Growth Rate, 1991-2001 (%)
33.9
Children with full immunization
Population density (per sq. km)
763
Sex Ratio (females per 1000 males)
Medical/Health Infrastructures/Institutions
1991
907
2001
913
Child Sex Ratio (0-6 years)
(girls per 1000 boys)
1991
986
CHCs
PHCs
Sub-Centres
2001
963
Literacy rate (7+)
Persons
35.0
Males
46.4
Females
22.4
Total work participation rate
39.5
Female work participation rate
25.8
74.6
98.7
10.3
36.2
4.9
65
41.4
58.2
31.5
36.1
41.2
13.7
35.8
3
-
-
| 39

5.8 Page 48

▲back to top


Population Foundation of India
district
aurangabad
Showing CD Blocks
INDIA
BIHAR
DISTRICT AURANGABAD
KILOMETRES
5
0
5
H
O
S
A
T
DISTRICT
J E H ANAB
A
D
DAUDNAGAR
HASPURA
DAUDNAGAR
HASPURA
GOH
OBRA
GOH
BARUN
BARUN
OBRA
AURANGABAD
RAFIGANJ
RAFIGANJ
AURANGABAD
NABINAGAR
NABINAGAR
KUTUMBA
KUTUMBA
DEO
DEO
S
K
H
A
N
D
D
I
MADANPUR
MADANPUR
R
T
BOUNDARY , STATE
,,
DISTRICT
,,
C.D. BLOCK
HEADQUARTERS: DISTRICT, C.D. BLOCK
40 |

5.9 Page 49

▲back to top


Population, Health & Social Development in Bihar, Jharkhand, Orissa and West bengal
DISTRICT Aurangabad
General Information
Household Amenities, (%), Census 2001
Area (Sq. Kms.)
3305.0
Households with kutchha houses
Percent to total state’s area
3.5
Households with safe drinking water
C D blocks
11
Households with electricity connection
Towns
5 Vital Rates
No. of villages
1828
Crude Birth Rate, 2001
Total Fertility Rate, 2001
Demographic Particulars (Census, 2001)
Population
Persons 2013055
Infant Mortality Rate, 2001
Key RCH Indicators from District Level
Household Survey, 2007-08 (%)
Girls marrying below 18 years
Males 1040945
Birth order 3 and above
Females 972110
Current use of any FP Method
Rural (%)
Urban (%)
Scheduled Castes (%)
91.6
Total unmet need
8.4
Mothers who had at least 3 ANC visits during
the last pregnancy
23.5
Scheduled Tribes (%)
0.1
Elderly population (60+ years) (%)
7.0
Young people (10-24 years) (%)
30.3
Institutional delivery
Adolescents (10-19 years) (%)
22.3
Decadal Growth Rate, 1991-2001 (%)
30.7
Children with full immunization
Population density (per sq. km)
609
Sex Ratio (females per 1000 males)
Medical/Health Infrastructures/Institutions
1991
915
2001
934
Child Sex Ratio (0-6 years)
(girls per 1000 boys)
1991
970
CHCs
PHCs
Sub-Centres
2001
943
Literacy rate (7+)
Persons
57.0
Males
71.1
Females
41.9
Total work participation rate
33.3
Female work participation rate
20.2
14.2
83.5
7.8
32.3
4.3
63
38.7
46.9
34.5
37.9
18.9
30.6
56.5
3
-
-
| 41

5.10 Page 50

▲back to top


Population Foundation of India
INDIA
BIHAR
DISTRICT BANKA
KILOMETRES
5
0
5
district
banka
Showing
CD Blocks
MUNGER
DISTRICT
B
H
A
G
A
L
P
U
R
T
IC
SHAMBHUGANJ
AMARPUR
RAJAUN
R
SHAMBHUGANJ
AMARPUR
BELHAR
BELHAR
PHULIDUMAR
PHULIDUMAR
BANKA
BANKA
RAJAUN
DHURAIYA
DHURAIYA
BARAHAT
BARAHAT
CHANAN
KATORIA
KATORIA
BAUSI
BAUSI
CHANAN
J
H
A
BOUNDARY , STATE
,,
DISTRICT
,,
C.D. BLOCK
HEADQUARTERS: DISTRICT, C.D. BLOCK
K
R
42 |

6 Pages 51-60

▲back to top


6.1 Page 51

▲back to top


Population, Health & Social Development in Bihar, Jharkhand, Orissa and West bengal
DISTRICT Banka
General Information
Household Amenities, (%), Census 2001
Area (sq. kms.)
3020.0
Households with kutchha houses
Percent to total state’s area
3.2
Households with safe drinking water
C D blocks
11
Households with electricity connection
Towns
2 Vital Rates
No. of Villages
1737
Crude Birth Rate, 2001
Total Fertility Rate, 2001
Demographic Particulars (Census, 2001)
Population
Persons 1608773
Infant Mortality Rate, 2001
Key RCH Indicators from District Level
Household Survey, 2007-08 (%)
Girls marrying below 18 years
Males 843293
Birth order 3 and above
Females 765480
Current use of any FP Method
Rural (%)
96.5
Total unmet need
Urban (%)
3.5
Mothers who had at least 3 ANC visits during
the last pregnancy
Scheduled Castes (%)
12.4
Scheduled Tribes (%)
4.7
Elderly population (60+ years) (%)
6.8
Young people (10-24 years) (%)
28.3
Institutional delivery
Adolescents (10-19 years)(%)
20.9
Decadal Growth Rate, 1991-2001 (%)
24.5
Children with full immunization
Population density (per sq. km)
533
Sex Ratio (females per 1000 males)
Medical/Health Infrastructures/Institutions
1991
893
2001
908
Child Sex Ratio (0-6 years)
(girls per 1000 boys)
1991
969
CHCs
PHCs
Sub-Centres
2001
965
Literacy rate (7+)
Information on HIV/AIDS
Persons
42.7
Males
55.3
HIV+ among ANC clinics (%)
Females
Total work participation rate
Female work participation rate
28.7
HIV+ among STD clinics (%)
39.6
Number of Integrated Counseling and Testing
Centres (ICTC formerly VCTC)
28.2
Number of Anti Retroviral Therapy (ART) Centres
48.6
49.9
4.7
33.8
4.8
56
59.9
50.4
25.0
39.2
31.5
24.7
32.9
3
-
-
0.75
0.40
0
0
| 43

6.2 Page 52

▲back to top


Population Foundation of India
district
Begusarai
Showing CD Blocks
T
C
I
AS
M
A
T
S
I
CHORAHI
KHUDABANDPUR
KHUDABANDPUR
CHORAHI
GARHPURA
INDIA
BIHAR
DISTRICT BEGUSARAI
KILOMETRES
5
0
5
T
S
MANSURCHAK
MANSURCHAK
BACHHWARA
CHERIA
BARIARPUR
BHAGWANPUR
CHERIA
BARIARPUR
GARHPURA
BAKHRI
BAKHRI
BACHHWARA
T
R
I
C
T
BOUNDARY , DISTRICT
,,
C.D. BLOCK
HEADQUARTERS: DISTRICT, C.D. BLOCK
BHAGWANPUR
BIRPUR
TEGHRA
BIRPUR
TEGHRA
BARAUNI
BARAUNI
NAOKOTHI
NAOKOTHI
BEGUSARAI
DANDARI
DANDARI
C
T
K
H
A
G
A
R
SAHEBPUR KAMAL
IA
P
A
TNA
BEGUSARAI
MATIHANI
S
T
R
ICT
MATIHANI
SAMHO AKA
KURATH
SAMHO AKA
KURATH
A
LAKH ISAR
BALIA
SAHEBPUR KAMAL
BALIA
DISTRICT
G
N
U
M
44 |

6.3 Page 53

▲back to top


Population, Health & Social Development in Bihar, Jharkhand, Orissa and West bengal
DISTRICT Begusarai
General Information
Household Amenities, (%), Census 2001
Area (sq. kms.)
1918.0
Households with kutchha houses
18.7
Percent to total state’s area
2.0
Households with safe drinking water
89.2
C D blocks
18
Households with electricity connection
16.8
Towns
2 Vital Rates
No. of villages
815
Crude Birth Rate, 2001
34.0
Total Fertility Rate, 2001
4.8
Demographic Particulars (Census, 2001)
Infant Mortality Rate, 2001
58
Population
Key RCH Indicators from District Level
Household Survey, 2007-08 (%)
Persons 2349366
Girls marrying below 18 years
46.2
Males 1228874
Birth order 3 and above
54.2
Females 1120492
Current use of any FP Method
28.0
Rural (%)
95.4
Total unmet need
39.0
Urban (%)
4.6
Mothers who had at least 3 ANC visits during
the last pregnancy
28.3
Scheduled Castes (%)
14.5
Scheduled Tribes (%)
0.1
Elderly population (60+ years) (%)
6.2
Young people (10-24 years) (%)
30.7
Institutional delivery
26.8
Adolescents (10-19 years)(%)
22.7
Decadal Growth Rate, 1991-2001 (%)
29.5
Children with full immunization
40.3
Population density (per sq. km)
1225
Sex Ratio (females per 1000 males)
Medical/Health Infrastructures/Institutions
1991
898
2001
912
CHCs
2
Child Sex Ratio (0-6 years)
(girls per 1000 boys)
PHCs
-
1991
961
Sub-Centres
-
2001
946
Literacy rate (7+)
Information on HIV/AIDS
Persons
48.0
Males
59.1
HIV+ among ANC clinics (%)
0.5
Females
35.6
HIV+ among STD clinics (%)
-
Total work participation rate
31.8
Number of Integrated Counseling and Testing
Centres (ICTC formerly VCTC)
0
Female work participation rate
15.9
Number of Anti Retroviral Therapy
(ART) Centres
0
| 45

6.4 Page 54

▲back to top


Population Foundation of India
district
Bhagalpur
Showing CD Blocks
INDIA
BIHAR
DISTRICT BHAGALPUR
KILOMETRES
5
0
5
D
I
S
T
R
I
C
T
MADHEPURA
BIHPUR
DISTRICT P URNIA
NARAYANPUR
NAUGACHHIA
DISTRICT
NARAYANPUR
BI H P U R
KHARIK
NAUGACHHIA
RANGRA CHOWK
RANGRA CHOWK
RANGRA CHOWK
K
A
T
I
H
A
R
R
E
G
SULTANGANJ
SULTANGANJ
NATHNAGAR
NATHNAGAR
KHARIK
ISMAILPUR
ISMAILPUR
JAGDISHPUR
SABOUR
SABOUR
GORADIH
GOPALPUR
GOPALPUR
COLGONG
COLGONG
PIRPAINT I
PIRPAINTI
SHAHKUND
SHAHKUND
JAGDISHPUR
GORADIH
SONHAULA
D
I
S
T
R
I
C
T
SONHAULA
B
A
N
K
A
H
J
BOUNDARY , STATE
,,
DISTRICT
,,
C.D. BLOCK
HEADQUARTERS: DISTRICT, C.D. BLOCK
K
R
A
46 |

6.5 Page 55

▲back to top


Population, Health & Social Development in Bihar, Jharkhand, Orissa and West bengal
DISTRICT BHAGALPUR
General Information
Area (Sq. Kms.)
Household Amenities, (%), Census 2001
2569.0
Households with kutchha houses
Percent to total state’s area
2.7
Households with safe drinking water
C D Blocks
16
Households with electricity connection
Towns
5 Vital Rates
No. of Villages
1052
Crude Birth Rate, 2001
Total Fertility Rate, 2001
Demographic Particulars (Census, 2001)
Infant Mortality Rate, 2001
Population
Key RCH Indicators from District Level
Household Survey, 2007-08 (%)
Persons 2423172
Girls marrying below 18 years
Males 1291658
Birth order 3 and above
Females 1131514
Current use of any FP Method
Rural (%)
81.3
Total unmet need
Urban (%)
18.7
Mothers who had at least 3 ANC visits during
the last pregnancy
Scheduled Castes (%)
Scheduled Tribes (%)
Elderly population (60+ years) (%)
Young people (10-24 years) (%)
Adolescents (10-19 years)(%)
Decadal Growth Rate, 1991-2001 (%)
Population Density (per sq. km)
Sex Ratio (females per 1000 males)
1991
2001
Child Sex Ratio (0-6 years) (girls per 1000 boys)
1991
2001
Literacy rate (7+)
Persons
Males
Females
10.5
2.3
6.7
30.4
Institutional delivery
22.7
26.9
Children with full immunization
943
Medical/Health Infrastructures/Institutions
864
876
CHCs
PHCs
944
Sub-Centres
966
Information on HIV/AIDS
49.5
59.2
HIV+ among ANC clinics (%)
38.1
HIV+ among STD clinics (%)
Total work participation rate
35.3
Number of Integrated Counseling and Testing
Centres (ICTC formerly VCTC)
Female work participation rate
21.4
Number of Anti Retroviral Therapy (ART) Centres
28.7
69.6
19.1
31.9
4.5
52
27.8
53.1
40.3
36.4
20.4
30.4
49.6
2
-
-
0.25
0
0
1
| 47

6.6 Page 56

▲back to top


Population Foundation of India
district
BhoINDjIA pur
ShowiBnIHgARCD Blocks
DISTRICT BHOJPUR
KILOMETRES
5
0
5
R
UTTAR PRADESH
IS TRICT
SARAN
SHAHPUR
BARHARA
BARHARA
SHAHPUR
BEHEA
ARRAH
BEHEA
UDWANTNAGAR
ARRAH
KOILWAR
KOILWAR
JAGDISHPUR
JAGDISHPUR
UDWANTNAGAR
SANDESH
PIRO
PIRO
GARHANI
GARHANI
CHARPOKHARI
CHARPOKHARI
AGIAON
AGIAON
SANDESH
TARARI
SAHAR
R
TARARI
O
HT A S
DISTRICT
SAHAR
N
A
JEH
BOUNDARY , STATE
,,
DISTRICT
,,
C.D. BLOCK
HEADQUARTERS: DISTRICT, C.D. BLOCK
48 |

6.7 Page 57

▲back to top


Population, Health & Social Development in Bihar, Jharkhand, Orissa and West bengal
DISTRICT BHOJPUR
General Information
Area (sq. kms.)
Percent to total state’s area
C D blocks
Towns
No. of Villages
Demographic Particulars (Census, 2001)
Household Amenities, (%), Census 2001
2474.0
Households with kutchha houses
2.6
Households with safe drinking water
14
Households with electricity connection
6 Vital Rates
1129
Crude Birth Rate, 2001
Total Fertility Rate, 2001
Infant Mortality Rate, 2001
Population
Key RCH Indicators from District Level
Household Survey, 2007-08 (%)
Persons 2243144
Girls marrying below 18 years
Males 1179611
Birth order 3 and above
Females 1063533
Current use of any FP Method
Rural (%)
86.1
Total unmet need
Urban (%)
13.9
Mothers who had at least 3 ANC visits during
the last pregnancy
Scheduled Castes (%)
Scheduled Tribes (%)
Elderly population (60+ years) (%)
Young people (10-24 years) (%)
Adolescents (10-19 years)(%)
Decadal Growth Rate, 1991-2001 (%)
Population density (per sq. km)
Sex Ratio (females per 1000 males)
1991
2001
Child Sex Ratio (0-6 years) (girls per 1000 boys)
1991
2001
Literacy rate (7+)
Persons
Males
Females
15.3
0.4
7.5
30.7
Institutional delivery
22.8
25.1
Children with full immunization
907
Medical/Health Infrastructures/Institutions
904
902
CHCs
PHCs
924
Sub-Centres
940
Information on HIV/AIDS
59.0
74.3
HIV+ among ANC clinics (%)
41.8
HIV+ among STD clinics (%)
Total work participation rate
29.1
Number of Integrated Counseling and Testing
Centres (ICTC formerly VCTC)
Female work participation rate
12.6
Number of Anti Retroviral Therapy (ART) Centres
6.6
91.0
10.0
30.1
4.2
55
48.1
45.5
35.3
39.9
17.2
40.4
31.2
2
-
-
-
0.50
0
0
| 49

6.8 Page 58

▲back to top


Population Foundation of India
INDIA
d i s tBIHrARi c t
Buxar DISTRIINCDTIABUXAR
BKILIOHMSEAThRRESowing
DIS5TRCICDT0 BBlUoX5cAkRs
KILOMETRES
5
0
A5
D
E
S
H
R
A
D
E
S
H
SIMRI
R
SIMRI
SIMRI
CHAKKI
CHAKKI
R
BUXAR
SIMRI
CHAKKI
BARHAMPUR
A
R
BUXAR
BUXAR
DUMRAON
CHAKKI
BARHAMPUR
BARHAMPUR
A
CHAUSA
C H A U SCAHAUSA
CHAUSA
RAJPUR
BUXAR
ITARHI
ITAIRTHIA R H I
ITARHI
DUMRAON
DUMRAON
BARHAMPUR
CHAUGAIN
CHAUGAIN
DUMRAON
CHAUGAIN
KESATH
N A W A N A G A R CHAUGAIN
KESATH
KESATH
N A W A N A G A RNAWANAGAR
KESATH
KAIMUR
KAIMUR
(BHABUA)
(BHABUA)
RAJPUR
RAJPUR
D RAJPUR
IST
D
R
I
C
T
ISTRICT
NAWANAGAR
S
A
T
H
RO
S
A
T
H
RO
BOUNDARY , STATE
,,
DISTRICT
,,
C.D. BLOCK
HEADQUARTERS: DISTRICT, C.D. BLOCK
BOUNDARY , STATE
,,
DISTRICT
,,
C.D. BLOCK
HEADQUARTERS: DISTRICT, C.D. BLOCK
50 |

6.9 Page 59

▲back to top


Population, Health & Social Development in Bihar, Jharkhand, Orissa and West bengal
DISTRICT BUXAR
General Information
Household Amenities, (%), Census 2001
Area (sq. kms.)
Percent to total state’s area
C D blocks
Towns
1624.0
Households with kutchha houses
1.7
Households with safe drinking water
11
Households with electricity connection
2 Vital Rates
No. of villages
882
Crude Birth Rate, 2001
Total Fertility Rate, 2001
Demographic Particulars (Census, 2001)
Infant Mortality Rate, 2001
Population
Key RCH Indicators from District Level
Household Survey, 2007-08 (%)
Persons 1402396
Girls marrying below 18 years
Males
Females
Rural (%)
738354
664042
90.8
Birth order 3 and above
Current use of any FP Method
Total unmet need
Urban (%)
9.2
Mothers who had at least 3 ANC visits during
the last pregnancy
Scheduled Castes (%)
Scheduled Tribes (%)
Elderly population (60+ years) (%)
Young people (10-24 years) (%)
Adolescents (10-19 years)(%)
Decadal Growth Rate, 1991-2001 (%)
Population density (per sq. km)
Sex Ratio (females per 1000 males)
1991
2001
1991
2001
Literacy rate (7+)
Persons
Males
Females
Total work participation rate
Female work participation rate
14.1
0.6
7.6
29.8
Institutional delivery
22.3
28.9
Children with full immunization
864
Medical/Health Infrastructures/Institutions
884
899
CHCs
PHCs
905
Sub-Centres
925
Information on HIV/AIDS
56.8
71.9
HIV+ among ANC clinics (%)
39.9
HIV+ among STD clinics (%)
29.1
Number of Integrated Counseling and Testing
Centres (ICTC formerly VCTC)
11.9
Number of Anti Retroviral Therapy (ART) Centres
9.0
87.8
11.5
31.7
4.4
53
49.8
47.9
31.2
36.8
22.1
48.0
27.7
0
-
-
-
0.40
0
0
| 51

6.10 Page 60

▲back to top


Population Foundation of India
district
darbhanga
Showing CD Blocks
ITA M A R H I D
INDIA
BIHAR
JALE
I
S
T
R
DISTRICT DARBHANGA
KILOMETRES
5
0
5
JALE
I
C
T
KEOTIRANWAY
SINGHWARA
SINGHWARA
KEOTIRANWAY
DARBHANGA
DARBHANGA
M
A
MANIGACHHI
MANIGACHHI
D
H
TARDIH
TARDIH
HANUMANNAGAR
BAHADURPUR
BAHADURPUR
BENIPUR
ALINAGAR
GHANSHYAMPUR
HANUMANNAGAR
HAYAGHAT
D
I
S
HAYAGHAT
T
R
I
C
T
BAHERI
BAHERI
BENIPUR
ALINAGAR
GHANSHYAMPUR
KIRATPUR
BIRAUL
G O R A B A U R A M KIRATPUR
BIRAUL
GORA
BAURAM
S
A
KUSHESHWAR
ASTHAN
M
BOUNDARY , DISTRICT
,,
C.D. BLOCK
HEADQUARTERS: DISTRICT, C.D. BLOCK
A
S
T
I
KUSHESHWAR
ASTHAN
KUSHESHWAR
ASTHAN
PURBI
P
U
R
KUSHESHWAR
ASTHAN
PURBI
D
K
I
H
S
A
T
G
R
A
I
R
CT
IA
52 |

7 Pages 61-70

▲back to top


7.1 Page 61

▲back to top


Population, Health & Social Development in Bihar, Jharkhand, Orissa and West bengal
DISTRICT DARBHANGA
General Information
Area (sq. kms.)
Percent to total state’s area
C D blocks
Towns
No. of villages
Demographic Particulars (Census, 2001)
Household Amenities, (%), Census 2001
2279.0
Households with kutchha houses
2.4
Households with safe drinking water
18
Households with electricity connection
1 Vital Rates
1179
Crude Birth Rate, 2001
Total Fertility Rate, 2001
Infant Mortality Rate, 2001
Population
Key RCH Indicators from District Level
Household Survey, 2007-08 (%)
Persons
Males
Females
Rural (%)
3295789
1722189
1573600
91.9
Girls marrying below 18 years
Birth order 3 and above
Current use of any FP Method
Total unmet need
Urban (%)
8.1
Mothers who had at least 3 ANC visits during
the last pregnancy
Scheduled Castes (%)
Scheduled Tribes (%)
Elderly population (60+ years) (%)
Young people (10-24 years) (%)
Adolescents (10-19 years)(%)
Decadal Growth Rate, 1991-2001 (%)
Population density (per sq. km)
Sex Ratio (females per 1000 males)
1991
2001
Child Sex Ratio (0-6 years) (girls per 1000 boys)
1991
2001
Literacy rate (7+)
Persons
Males
Females
15.5
0.0
6.4
30.1
Institutional delivery
22.4
31.3
Children with full immunization
1446
Medical/Health Infrastructures/Institutions
911
914
CHCs
PHCs
954
Sub-Centres
915
Information on HIV/AIDS
44.3
56.7
HIV+ among ANC clinics (%)
30.8
HIV+ among STD clinics (%)
Total work participation rate
31.2
Number of Integrated Counseling and Testing
Centres (ICTC formerly VCTC)
Female work participation rate
14.9
Number of Anti Retroviral Therapy (ART) Centres
31.7
99.0
8.8
33.1
4.5
60
39.1
51.4
31.8
36.3
29.0
15.1
41.8
2
-
-
0.25
0
12
1
| 53

7.2 Page 62

▲back to top


Population Foundation of India
district
gaya
Showing
CD Blocks
INDIA
BIHAR
DISTRICT GAYA
KILOMETRES
5
0
5
DISTRICT
TIKARI
JEHANABAD
KHIZIRSARAI
DISTRICT NALANDA
KONCH
TIKARI
BELAGANJ
BELAGANJ
KHIZIRSARAI
NEEMCHAK
NEEMCHAK
BATHANI
ATRI
BATHANI
ATRI
ATRI
MUHRA
KONCH
GURARU PARAIYA
PARAIYA
GAYA
MANPUR
ATRI
WAZIRGANJ
MUHRA
GAYA
MANPUR
WAZIRGANJ
GURARU
TANKUPPA
T
S
I
D
DUMARIA
AMAS
GURUA
GURUA
BODH GAYA
BODH GAYA
SHERGHATI
TANKUPPA
FATEHPUR
AMAS
BANKE BAZAR
IMAMGANJ
BANKE
BAZAR
SHERGHATI
DOBHI
DOBHI
MOHANPUR
BARACHATTI
MOHANPUR
FATEHPUR
D
DUMARIA
IMAMGANJ
BARACHATTI
N
A
H
K
J
H
A
R
BOUNDARY , STATE
,,
DISTRICT
,,
C.D. BLOCK
HEADQUARTERS: DISTRICT, C.D. BLOCK
54 |

7.3 Page 63

▲back to top


Population, Health & Social Development in Bihar, Jharkhand, Orissa and West bengal
DISTRICT GAYA
General Information
Area (sq. kms.)
Percent to total state’s area
Household Amenities, (%), Census 2001
4976.0
Households with kutchha houses
5.3
Households with safe drinking water
C D blocks
24
Households with electricity connection
Towns
No. of villages
5 Vital Rates
2832
Crude Birth Rate, 2001
Total Fertility Rate, 2001
Demographic Particulars (Census, 2001)
Infant Mortality Rate, 2001
Population
Key RCH Indicators from District Level
Household Survey, 2007-08 (%)
Persons 3473428
Males 1792163
Females 1681265
Rural (%)
86.3
Girls marrying below 18 years
Birth order 3 and above
Current use of any FP Method
Total unmet need
Urban (%)
13.7
Mothers who had at least 3 ANC visits during
the last pregnancy
Scheduled Castes (%)
29.6
Scheduled Tribes (%)
0.1
Elderly population (60+ years) (%)
6.7
Young people (10-24 years) (%)
30.7
Institutional delivery
Adolescents (10-19 years)(%)
22.5
Decadal Growth Rate, 1991-2001 (%)
30.3
Children with full immunization
Population density (per sq. km)
698
Sex Ratio (females per 1000 males)
Medical/Health Infrastructures/Institutions
1991
922
2001
938
CHCs
Child Sex Ratio (0-6 years) (girls per 1000 boys)
PHCs
1991
983
Sub-Centres
2001
968
Literacy rate (7+)
Information on HIV/AIDS
Persons
50.4
Males
63.3
HIV+ among ANC clinics (%)
Females
36.7
HIV+ among STD clinics (%)
Total work participation rate
36.8
Number of Integrated Counseling and Testing
Centres (ICTC formerly VCTC)
Female work participation rate
25.5
Number of Anti Retroviral Therapy (ART) Centres
20.6
71.8
10.0
33.2
4.4
59
50.4
50.8
30.5
34.0
23.9
20.7
31.8
2
-
-
-
0.40
0
0
| 55

7.4 Page 64

▲back to top


Population Foundation of India
district
gopalganj
Showing CD Blocks
P
R
A
R
A
KATIYA
T
PACH DEURI
T
U
KATIYA
PACH DEURI
D
E
S
KUCHAIKOTE
KUCHAIKOTE
H
PASHCHDIIMS CTHRAI CMPTARAN
GOPALGANJ
D
I
S
T
R
I
C
T
INDIA
BIHAR
DISTRICT GOPALGANJ
KILOMETRES
5
0
5
BIJAIPUR
BHOREY
U
T
T
A
R
BIJAIPUR
BHOREY
PRADESH
PHULWARIA
PHULWARIA
UCHKAGAON
UCHKAGAON
THAWE
HATHUA
THAWE
GOPALGANJ
MANJHA
MANJHA
HATHUA
D
I
S
T
R
I
C
T
BOUNDARY , STATE
,,
DISTRICT
,,
C.D. BLOCK
HEADQUARTERS: DISTRICT, C.D. BLOCK
BARAULI
BARAULI
SIDHWALIA
SIDHWALIA
A
M
P
A
R
BAIKUNTHPUR
S
I
W
BAIKUNTHPUR
A
N
DISTRICT SARAN
56 |

7.5 Page 65

▲back to top


Population, Health & Social Development in Bihar, Jharkhand, Orissa and West bengal
DISTRICT GOPALGANJ
General Information
Area (sq. kms.)
Percent to total state’s area
C D blocks
Towns
No. of villages
Demographic Particulars (Census, 2001)
Population
Persons
Males
Females
Rural (%)
Urban (%)
Scheduled Castes (%)
Scheduled Tribes (%)
Elderly population (60+ years) (%)
Young people (10-24 years) (%)
Adolescents (10-19 years) (%)
Decadal Growth Rate, 1991-2001 (%)
Population density (per sq. km)
Sex Ratio (females per 1000 males)
1991
2001
Child Sex Ratio (0-6 years) (girls per 1000 boys)
1991
2001
Literacy rate (7+)
Persons
Males
Females
Total work participation rate
Female work participation rate
Household Amenities, (%), Census 2001
2033.0
Households with kutchha houses
2.2
Households with safe drinking water
14
Households with electricity connection
4 Vital Rates
1475
Crude Birth Rate, 2001
Total Fertility Rate, 2001
Infant Mortality Rate, 2001
Key RCH Indicators from District Level
Household Survey, 2007-08 (%)
2152638
Girls marrying below 18 years
1075710
Birth order 3 and above
1076928
Current use of any FP Method
93.3
Total unmet need
6.1
Mothers who had at least 3 ANC visits during
the last pregnancy
12.4
0.3
7.3
30.1
Institutional delivery
23.2
26.3
Children with full immunization
1059
Medical/Health Infrastructures/Institutions
968
1001
CHCs
PHCs
966
Sub-Centres
964
Information on HIV/AIDS
47.5
63.0
HIV+ among ANC clinics (%)
32.2
HIV+ among STD clinics (%)
29.8
Number of Integrated Counseling and Testing
Centres (ICTC formerly VCTC)
15.1
Number of Anti Retroviral Therapy (ART) Centres
35.3
97.3
6.0
31.9
4.4
46
35.9
48.4
22.1
43.8
31.8
36.5
52.4
3
-
-
-
1.6
0
0
| 57

7.6 Page 66

▲back to top


Population Foundation of India
INDIA
BIHAR
DISTRICT JAMUI
KILOMETRES
5
0
5
DISTRICT
SDHISETIKRHICPTURA
ISLAMNAGAR
ALIGANJ
district
jamui
Showing
CD Blocks
I
A
R
A
S
I
H
K
LA
BARHAT
JAMUI
BARHAT
LAKSHMIPUR
ISLAMNAGAR
ALIGANJ
SIKANDRA
SIKANDRA
JAMUI
LAKSHMIPUR
GIDHAUR
N
A
W
ADA
KHAIRA
KHAIRA
GIDHAUR
JHAJHA
JHAJHA
SONO
H
SONO
CHAKAI
CHAKAI
BOUNDARY , STATE
,,
DISTRICT
,,
C.D. BLOCK
HEADQUARTERS: DISTRICT, C.D. BLOCK
K
H
A
58 |

7.7 Page 67

▲back to top


Population, Health & Social Development in Bihar, Jharkhand, Orissa and West bengal
DISTRICT JAMUI
General Information
Household Amenities, (%), Census 2001
Area (Sq. Kms.)
3098.0
Households with kutchha houses
Percent to total state’s area
3.3
Households with safe drinking water
C D blocks
10
Households with electricity connection
Towns
2 Vital Rates
No. of villages
1373
Crude Birth Rate, 2001
Total Fertility Rate, 2001
Demographic Particulars (Census, 2001)
Infant Mortality Rate, 2001
Population
Key RCH Indicators from District Level
Household Survey, 2007-08 (%)
Persons 1398796
Girls marrying below 18 years
Males 729138
Birth order 3 and above
Females 669658
Current use of any FP Method
Rural (%)
92.6
Total unmet need
Urban (%)
7.4
Mothers who had at least 3 ANC visits during
the last pregnancy
Scheduled Castes (%)
17.4
Scheduled Tribes (%)
4.8
Elderly population (60+ years) (%)
6.1
Young people (10-24 years) (%)
30.3
Institutional delivery
Adolescents (10-19 years) (%)
22.4
Decadal Growth Rate, 1991-2001 (%)
33.0
Children with full immunization
Population density (per sq. km)
452
Sex Ratio (females per 1000 males)
Medical/Health Infrastructures/Institutions
1991
903
2001
918
CHCs
Child Sex Ratio (0-6 years) (girls per 1000 boys)
PHCs
1991
967
Sub-Centres
2001
963
Literacy rate (7+)
Information on HIV/AIDS
Persons
42.4
Males
57.1
HIV+ among ANC clinics (%)
Females
26.3
HIV+ among STD clinics (%)
Total work participation rate
42.7
Number of Integrated Counseling and Testing
Centres (ICTC formerly VCTC)
Female work participation rate
34.8
Number of Anti Retroviral Therapy (ART) Centres
9.9
38.3
7.0
32.8
4.5
58
72.9
49.4
27.4
44.2
27.1
17.6
17.4
3
-
-
-
2.0
0
0
| 59

7.8 Page 68

▲back to top


Population Foundation of India
district
jehanabad
Showing CD Blocks
INDIA
BIHAR
DISTRICT JEHANABAD
KILOMETRES
5
0
5
R
U
P
D
I
S
T
R
I
C
T
P
A
T
N
A
MODANGANJ
IOCT
R
T
S
I
D
KALER
B
ARWAL
ARWAL
JEHANABAD
KARPI
RATNI
FARIDPUR
KARPI
KURTHA
RATNI
FARIDPUR
JEHANABAD
KAKO
MODANGANJ
KAKO
GHOSHI
GHOSHI
KALER
DISTRICT
SONBHADRA
BANSHI SURYAPUR
SONBHADRA
BANSHI SURYAPUR
AURANGABAD
D
KURTHA
MAKHDUMPUR
MAKHDUMPUR
HULASGANJ
HULASGANJ
I
S
T
R
I
C
T
A
Y
A
G
BOUNDARY , DISTRICT
,,
C.D. BLOCK
HEADQUARTERS: DISTRICT, C.D. BLOCK
60 |

7.9 Page 69

▲back to top


Population, Health & Social Development in Bihar, Jharkhand, Orissa and West bengal
DISTRICT JEHANABAD
General Information
Area (sq. kms.)
Percent to total state’s area
C D blocks
Towns
No. of villages
Demographic particulars (Census, 2001)
Population
Persons
Males
Females
Rural (%)
Urban (%)
Scheduled Castes (%)
Scheduled Tribes (%)
Elderly population (60+ years) (%)
Young people (10-24 years) (%)
Adolescents (10-19 years)(%)
Decadal Growth Rate, 1991-2001 (%)
Population density (per sq. km)
Sex Ratio (females per 1000 males)
1991
2001
Child Sex Ratio (0-6 years) (girls per 1000 boys)
1991
2001
Literacy rate (7+)
Persons
Males
Females
Total work participation rate
Female work participation rate
Household amenities, (%), Census 2001
1569.0
Households with kutchha houses
1.7
Households with safe drinking water
12
Households with electricity connection
2 Vital Rates
928
Crude Birth Rate, 2001
Total Fertility Rate, 2001
Infant Mortality Rate, 2001
Key RCH Indicators from District Level
Household Survey, 2007-08 (%)
1514315
Girls marrying below 18 years
784946
Birth order 3 and above
729369
Current use of any FP Method
92.6
Total unmet need
7.4
Mothers who had at least 3 ANC visits during
the last pregnancy
18.9
0.1
7.4
30.1
Institutional delivery
21.9
28.9
Children with full immunization
965
Medical/Health Infrastructures/Institutions
919
929
CHCs
PHCs
967
Sub-Centres
917
Information on HIV/AIDS
55.3
70.1
HIV+ among ANC clinics (%)
39.4
HIV+ among STD clinics (%)
38.4
Number of Integrated Counseling and Testing
Centres (ICTC formerly VCTC)
27.9
Number of Anti Retroviral Therapy (ART) Centres
17.0
83.4
4.6
32.0
4.1
60
56.7
46.1
28.2
39.8
30.6
42.5
47.2
2
-
-
-
1.20
0
0
| 61

7.10 Page 70

▲back to top


Population Foundation of India
district
kaimur (BHABUA)
Showing CD Blocks
INDIA
BIHAR
DISTRICT KAIMUR
(BHABUA)
KILOMETRES
5
0
5
E
H
S
NUAON
DISTRICT
B
D
RAMGARH
NUAON
RAMGARH
A
DURGAWATI
DURGAWATI
MOHANIA
CHAND
CHAND
MOHANIA
BHABHUA
KUDRA
CHAINPUR
BHABHUA
CHAINPUR
BHAGWANPUR
BHAGWANPUR
KUDRA
RAMPUR
RAMPUR
62 |
ADHAURA
ADHAURA
T
BOUNDARY , STATE
D
I
S
,,
DISTRICT
,,
C.D. BLOCK
HEADQUARTERS: DISTRICT, C.D. BLOCK

8 Pages 71-80

▲back to top


8.1 Page 71

▲back to top


Population, Health & Social Development in Bihar, Jharkhand, Orissa and West bengal
DISTRICT KAIMUR (BHABUA)
General Information
Household Amenities, (%), Census 2001
Area (sq. bms.)
3362.0
Households with kutchha houses
Percent to total state’s area
3.6
Households with safe drinking water
C D blocks
11
Households with electricity connection
Towns
1 Vital Rates
No. of villages
1398
Crude Birth Rate, 2001
Total Fertility Rate, 2001
Demographic Particulars (Census, 2001)
Infant Mortality Rate, 2001
Population
Key RCH Indicators from District Level
Household Survey, 2007-08 (%)
Persons 1289074
Girls marrying below 18 years
Males 677623
Birth order 3 and above
Females 611451
Current use of any FP Method
Rural (%)
96.8
Total unmet need
Urban (%)
3.2
Mothers who had at least 3 ANC visits during
the last pregnancy
Scheduled Castes (%)
22.2
Scheduled Tribes (%)
2.8
Elderly population (60+ years) (%)
7.4
Young people (10-24 years) (%)
28.5
Institutional delivery
Adolescents (10-19 years) (%)
21.0
Decadal Growth Rate, 1991-2001 (%)
31.1
Children with full immunization
Population density (per sq. km)
383
Sex Ratio (females per 1000 males)
Medical/Health Infrastructures/
Institutions
1991
884
2001
902
CHCs
Child Sex Ratio (0-6 years) (girls per 1000 boys)
PHCs
1991
918
Sub-Centres
2001
940
Literacy rate (7+)
Persons
55.1
Males
69.7
Females
38.8
Total work participation rate
34.4
Female work participation rate
20.7
5.5
75.0
11.3
34.4
4.8
68
56.1
51.5
29.9
34.9
23.7
42.6
21.9
2
-
-
| 63

8.2 Page 72

▲back to top


Population Foundation of India
district
katihar
Showing CD Blocks
INDIA
BIHAR
DISTRICT KATIHAR
KILOMETRES
5
0
5
I
C
T
FALKA
FALKA
KORHA
KORHA
SAMELI
SAMELI
BARARI
KURSELA
KURSELA
BARARI
N
BALRAMPUR
R
U
P
KADWA
BALRAMPUR
HASANGANJ
HASANGANJ
DANDKHORA
KATIHAR
DANDKHORA
KADWA
KATIHAR
PRANPUR
RAGHUNATHPUR
AZAMNAGAR
BARSOI
AZAMNAGAR
MANSAHI
MANSAHI
PRANPUR
MANIHARI
TRICT
BHAGALPUR
BOUNDARY , STATE
DISTRICT
,,
C.D. BLOCK
HEADQUARTERS: DISTRICT, C.D. BLOCK
MANIHARI
AMDABAD
JH
A
AMDABAD
RKHAND
64 |

8.3 Page 73

▲back to top


Population, Health & Social Development in Bihar, Jharkhand, Orissa and West bengal
DISTRICT KATIHAR
General Information
Area (sq. kms.)
Percent to total state’s area
C D blocks
Towns
No. of villages
Demographic Particulars (Census, 2001)
Household Amenities, (%), Census 2001
3057.0
Households with kutchha houses
3.2
Households with safe drinking water
16
Households with electricity connection
3 Vital Rates
1393
Crude Birth Rate, 2001
Total Fertility Rate, 2001
Infant Mortality Rate, 2001
Population
Key RCH Indicators from District Level
Household Survey, 2007-08 (%)
Persons
Males
Females
Rural (%)
2392638
1246872
1145766
90.9
Girls marrying below 18 years
Birth order 3 and above
Current use of any FP Method
Total unmet need
Urban (%)
9.1
Mothers who had at least 3 ANC visits during
the last pregnancy
Scheduled Castes (%)
Scheduled Tribes (%)
Elderly population (60+ years) (%)
Young people (10-24 years) (%)
Adolescents (10-19 years) (%)
Decadal Growth Rate, 1991-2001 (%)
Population density (per sq. km)
Sex Ratio (females per 1000 males)
1991
2001
Child Sex Ratio (0-6 years) (girls per 1000 boys)
1991
2001
Literacy rate (7+)
Persons
Males
Females
Total work participation rate
Female work participation rate
8.7
5.9
5.5
29.1
Institutional delivery
22.0
31.1
Children with full immunization
783
Medical/Health Infrastructures/Institutions
909
919
CHCs
PHCs
975
Sub-Centres
966
Information on HIV/AIDS
35.1
45.3
HIV+ among ANC clinics (%)
23.8
HIV+ among STD clinics (%)
37.5
Number of Integrated Counseling and Testing
Centres (ICTC formerly VCTC)
23.1
Number of Anti Retroviral Therapy (ART) Centres
48.5
96.5
7.0
38.2
5.3
71
43.7
53.0
26.0
43.7
32.5
12.4
32.6
3
-
-
-
2.50
0
0
| 65

8.4 Page 74

▲back to top


Population Foundation of India
district
khagaria
Showing CD Blocks
SAMASTIPUR
CT
INDIA
BIHAR
DISTRICT KHAGARIA
KILOMETRES
D
5
0
5
I
S
T
R
I
CT
S
A
H
A
R
S
A
ALAULI
ALAULI
C
T
KHAGARIA
KHAGARIA
B
E
G
U
S
A
RAI
MANSI
CHAUTHAM
CHAUTHAM
MANSI
GOGRI
BELDAUR
BELDAUR
GOGRI
PARBATTA
BOUNDARY , DISTRICT
,,
C.D. BLOCK
HEADQUARTERS: DISTRICT, C.D. BLOCK
U
N
G
ER
PARBATTA
T
IC
R
T
IS
D
66 |

8.5 Page 75

▲back to top


Population, Health & Social Development in Bihar, Jharkhand, Orissa and West bengal
DISTRICT KHAGARIA
General Information
Household Amenities, (%), Census 2001
Area (sq. kms.)
1486.0
Households with kutchha houses
34.8
Percent to total state’s area
1.6
Households with safe drinking water
95.8
C D blocks
7
Households with electricity connection
8.9
Towns
2 Vital Rates
No. of Villages
298
Crude Birth Rate, 2001
35.7
Total Fertility Rate, 2001
5.1
Demographic Particulars (Census, 2001)
Infant Mortality Rate, 2001
52
Population
Key RCH Indicators from District Level
Household Survey, 2007-08 (%)
Persons 1280354
Males 679267
Females 601087
Rural (%)
94.0
Girls marrying below 18 years
49.3
Birth order 3 and above
51.3
Current use of any FP Method
31.1
Total unmet need
37.3
Urban (%)
6.0
Mothers who had at least 3 ANC visits during
the last pregnancy
26.4
Scheduled Castes (%)
14.5
Scheduled Tribes (%)
0.0
Elderly population (60+ years) (%)
6.0
Young people (10-24 years) (%)
29.7
Institutional delivery
25.3
Adolescents (10-19 years) (%)
22.0
Decadal Growth Rate, 1991-2001 (%)
29.7
Children with full immunization
45.8
Population density (per sq. km)
862
Sex Ratio (females per 1000 males)
Medical/Health Infrastructures/Institutions
1991
868
2001
885
CHCs
1
Child Sex Ratio (0-6 years) (girls per 1000 boys)
PHCs
-
1991
943
Sub-Centres
-
2001
932
Literacy rate (7+)
Information on HIV/AIDS
Persons
41.3
Males
51.8
HIV+ among ANC clinics (%)
0
Females
29.3
HIV+ among STD clinics (%)
0
Total work participation rate
36.5
Number of Integrated Counseling and Testing
Centres (ICTC formerly VCTC)
5
Female work participation rate
22.9
Number of Anti Retroviral Therapy (ART) Centres
0
| 67

8.6 Page 76

▲back to top


Population Foundation of India
district
kishanganj
INDIA
Showing CD Blocks
BIHAR
DISTRICT KISHANGANJ
L
KILOMETRES
A
5
0
5
P
E
N
DIGHALBANK
THAKURGANJ
TERHAGACHH
DIGHALBANK
TERHAGACHH
BAHADURGANJ
THAKURGANJ
POTHIA
BAHADURGANJ
POTHIA
KOCHADHAMIN
KOCHADHAMIN
KISHANGANJ
KISHANGANJ
T
S
E
W
BOUNDARY, INTERNATIONAL
,,
STATE
,,
DISTRICT
,,
C.D. BLOCK
HEADQUARTERS: DISTRICT, C.D. BLOCK
68 |

8.7 Page 77

▲back to top


Population, Health & Social Development in Bihar, Jharkhand, Orissa and West bengal
DISTRICT KISHANGANJ
General Information
Area (sq. kms.)
Percent to total state’s area
C D blocks
Towns
No. of villages
Demographic Particulars (Census, 2001)
Household Amenities, (%), Census 2001
1884.0
Households with kutchha houses
2.0
Households with safe drinking water
7
Households with electricity connection
3 Vital Rates
815
Crude Birth Rate, 2001
Total Fertility Rate, 2001
Infant Mortality Rate, 2001
Population
Key RCH Indicators from District Level
Household Survey, 2007-08 (%)
Persons 1296348
Males 669552
Females 626796
Rural (%)
90.0
Girls marrying below 18 years
Birth order 3 and above
Current use of any FP Method
Total unmet need
Urban (%)
Scheduled Castes (%)
Scheduled Tribes (%)
Elderly population (60+ years) (%)
Young people (10-24 years) (%)
Adolescents (10-19 years) (%)
Decadal Growth Rate, 1991-2001 (%)
Population density (per sq. km)
10.0
6.6
3.6
4.9
29.5
22.4
31.7
688
Mothers who had at least 3 ANC visits during
the last pregnancy
Institutional delivery
Children with full immunization
Sex Ratio (females per 1000 males)
Medical/Health Infrastructures/
Institutions
1991
933
2001
936
CHCs
Child Sex Ratio (0-6 years) (girls per 1000 boys)
PHCs
1991
982
Sub-Centres
2001
Literacy rate (7+)
Persons
947
31.1
Information on HIV/AIDS
Males
42.7
HIV+ among ANC clinics (%)
Females
18.6
HIV+ among STD clinics (%)
Total work participation rate
32.2
Number of Integrated Counseling and Testing
Centres (ICTC formerly VCTC)
Female work participation rate
10.2
Number of Anti Retroviral Therapy (ART) Centres
52.2
90.9
4.5
39.0
5.3
77
32.1
57.0
27.2
38.1
28.5
17.8
26.6
2
-
-
0.00
0.00
6
0
| 69

8.8 Page 78

▲back to top


Population Foundation of India
district
INDIA
lakhisarai BIHAR
DISTRICT LAKHISARAI
Showing CD Blocks
IS T R I C T
D
PATNA
TRICT
P A T N KUTAHA A
IS
D
BARAHIYA
KUTAHA
D
D
I
I
S
S
T
T
R
R
I
I
CT BEG
CP
I
TP
A
RBI
YA
E
G
KILOINMEDTIRAES
5
0
5
BIHAR
U
S
A
DISTRICT
RAI D I
LAS KTHIRSARAI
KILOMETRES
5
0
5
U S A R A SURAJGARHA I
DISTR
PIPARIYA
BARAHIYA
LAKHISARAI
LAKHISARAI
PIPARIYA
PIPARIYA
SURAJGARHA
SURAJGARHA
RAMGARH CHOWK
RAMGARH CHOWK
HALSI
HALSI
D
I
S HALSI
HALSI
RAMGARH
CHOWK
RAMGARH
CHOWK
T
R
D
I
S
T
R
LAKHISARAI SURAJGARHA
J
LAKHISARAI
T
I
C
J
T
I
C
BOUNDARY , DISTRICT
,, C.D. BLOCK
HEADQUARTERS: DISTRICT, C.D. BLOCK
BOUNDARY , DISTRICT
,, C.D. BLOCK
HEADQUARTERS: DISTRICT, C.D. BLOCK
70 |

8.9 Page 79

▲back to top


Population, Health & Social Development in Bihar, Jharkhand, Orissa and West bengal
DISTRICT LAKHISARAI
General Information
Household Amenities, (%), Census 2001
Area (sq. kms.) 1228.0
Households with kutchha houses
Percent to total state’s area
1.3
Households with safe drinking water
C D blocks
6
Households with electricity connection
Towns
2 Vital Rates
No. of villages
410
Crude Birth Rate, 2001
Total Fertility Rate, 2001
Demographic Particulars (Census, 2001)
Infant Mortality Rate, 2001
Population
Key RCH Indicators from District Level
Household Survey, 2007-08 (%)
Persons 802225
Girls marrying below 18 years
Males 417672
Birth order 3 and above
Females 384553
Current use of any FP Method
Rural (%)
85.3
Total unmet need
Urban (%)
14.7
Mothers who had at least 3 ANC visits during
the last pregnancy
Scheduled Castes (%)
15.8
Scheduled Tribes (%)
0.7
Elderly population (60+ years) (%)
6.6
Young people (10-24 years) (%)
29.5
Institutional delivery
Adolescents (10-19 years) (%)
21.8
Decadal Growth Rate, 1991-2001 (%)
24.1
Children with full immunization
Population density (per sq. km)
Sex Ratio (females per 1000 males)
1991
653
Medical/Health Infrastructures/
Institutions
880
2001
921
CHCs
Child Sex Ratio (0-6 years) (girls per 1000 boys)
PHCs
1991
955
Sub-Centres
2001
951
Literacy rate (7+)
Information on HIV/AIDS
Persons
48.0
Males
60.7
HIV+ among ANC clinics (%)
Females
34.0
HIV+ among STD clinics (%)
Total work participation rate
36.5
Number of Integrated Counseling and Testing
Centres (ICTC formerly VCTC)
Female work participation rate
23.3
Number of Anti Retroviral Therapy (ART) Centres
15.7
57.6
12.9
33.8
4.7
60
54.7
48.0
31.2
41.6
25.3
32.5
36.0
1
-
-
1.0
-
0
0
| 71

8.10 Page 80

▲back to top


Population Foundation of India
district
INDIA madhepura
BIHAR
Showing CD Blocks
DISTRICT MADHEPURA
KILOMETRES
5
0
5
C
T
S
U
P
A
SINGHESHWAR
U
L
T
GAMHARIA
GAMHARIA
SHANKARPUR
SHANKARPUR
KUMARKHAND
KUMARKHAND
GHAILARH
SINGHESHWAR
GHAILARH
D
IS
T
R
MADHEPURA
MADHEPURA
MURLIGANJ
MURLIGANJ
BOUNDARY , DISTRICT
,,
C.D. BLOCK
HEADQUARTERS: DISTRICT, C.D. BLOCK
GWALPARA
GWALPARA
BIHARIGANJ
BIHARIGANJ
KISHANGANJ
KISHANGANJ
ALAMNAGAR
PURAINI
PURAINI
CHAUSA
ALAMNAGAR
CHAUSA
DISTRICT
BHAGALPUR
72 |

9 Pages 81-90

▲back to top


9.1 Page 81

▲back to top


Population, Health & Social Development in Bihar, Jharkhand, Orissa and West bengal
DISTRICT MADHEPURA
General Information
Area (sq. kms.)
Percent to total state’s area
C D blocks
Towns
No. of villages
Demographic Particulars (Census, 2001)
Population
Persons
Males
Females
Rural (%)
Urban (%)
Scheduled Castes (%)
Scheduled Tribes (%)
Elderly population (60+ years) (%)
Young people (10-24 years) (%)
Adolescents (10-19 years) (%)
Decadal Growth Rate, 1991-2001 (%)
Population density (per sq. km)
Sex Ratio (females per 1000 males)
1991
2001
Child Sex Ratio (0-6 years) (girls per 1000 boys)
1991
2001
Literacy rate (7+)
Persons
Males
Females
Total work participation rate
Female work participation rate
Household Amenities, (%), Census 2001
1788.0
Households with kutchha houses
1.9
Households with safe drinking water
13
Households with electricity connection
2 Vital Rates
450
Crude Birth Rate, 2001
Total Fertility Rate, 2001
1526646
Infant Mortality Rate, 2001
Key RCH Indicators from District Level
Household Survey, 2007-08 (%)
Girls marrying below 18 years
797180
Birth order 3 and above
729466
Current use of any FP Method
95.5
Total unmet need
4.5
Mothers who had at least 3 ANC visits during
the last pregnancy
17.1
0.6
5.7
28.3
Institutional delivery
20.9
29.6
Children with full immunization
854
Medical/Health Infrastructures/
Institutions
885
915
CHCs
PHCs
942
Sub-Centres
927
Information on HIV/AIDS
36.1
48.8
HIV+ among ANC clinics (%)
22.1
HIV+ among STD clinics (%)
44.8
Number of Integrated Counseling and Testing
Centres (ICTC formerly VCTC)
37.3
Number of Anti Retroviral Therapy (ART) Centres
72.1
96.6
3.8
36.7
4.8
60
55.3
53.5
35.0
35.9
20.0
17.7
39.7
1
-
-
0.58
-
0
0
| 73

9.2 Page 82

▲back to top


Population Foundation of India
district
madhubani
Showing CD Blocks
E
N
P
INDIA
BIHAR
DISTRICT MADHUBANI
MADH−
WAPUR
HARLAKHI
HARLAKHI
BASOPATTI
BASOPATTI
JAINAGAR
JAINAGAR
LADANIA
LADANIA
LAUKAHA
KILOMETRES
5
0
5
A
KHAJAULI
KALUAHI
MADHWAPUR BENIPATTI
LAUKAHA
LAUKAHI
L
KHAJAULI
BABU BARHI
KALUAHI
BENIPATTI
BABU BARHI
BISFI
MADHUBANI
RAJNAGAR
RAJNAGAR
ANDHRA
THARHI
ANDHRA
THARHI
PHULPARAS
LAUKAHI
BISFI
R
I
C
T
BOUNDARY, INTERNATIONAL
,,
DISTRICT
,,
C.D. BLOCK
HEADQUARTERS: DISTRICT, C.D. BLOCK
MADHUBANI
PANDAUL
JHANJHARPUR
PANDAUL
JHANJHARPUR
LAKHNAUR
PHULPARAS
GHOGHARDIHA
GHOGHARDIHA
D
A
R
B
LAKHNAUR
MADHEPUR
H
A
MADHEPUR
N
G
A
DISSA H
T
S
I
D
74 |

9.3 Page 83

▲back to top


Population, Health & Social Development in Bihar, Jharkhand, Orissa and West bengal
DISTRICT MADHUBANI
General Information
Household Amenities, (%), Census 2001
Area (sq. kms.)
3501.0
Households with kutchha houses
Percent to total state’s area
3.7
Households with safe drinking water
C D blocks
21
Households with electricity connection
Towns
4 Vital Rates
No. of villages
1150
Crude Birth Rate, 2001
Total Fertility Rate, 2001
Demographic Particulars (Census, 2001)
Population
Persons 3575281
Infant Mortality Rate, 2001
Key RCH Indicators from District Level
Household Survey, 2007-08 (%)
Girls marrying below 18 years
Males 1840997
Birth order 3 and above
Females 1734284
Current use of any FP Method
Rural (%)
Urban (%)
Scheduled Castes (%)
96.5
Total unmet need
3.5
Mothers who had at least 3 ANC visits during
the last pregnancy
13.5
Scheduled Tribes (%)
0.0
Elderly population (60+ years) (%)
6.6
Young people (10-24 years) (%)
28.6
Institutional delivery
Adolescents (10-19 years) (%)
21.1
Decadal Growth Rate, 1991-2001 (%)
26.2
Children with full immunization
Population density (per sq. km)
1021
Sex Ratio (females per 1000 males)
Medical/Health Infrastructures/Institutions
1991
932
2001
942
CHCs
Child Sex Ratio (0-6 years) (girls per 1000 boys)
PHCs
1991
953
Sub-Centres
2001
939
Literacy rate (7+)
Information on HIV/AIDS
Persons
42.0
Males
56.8
HIV+ among ANC clinics (%)
Females
26.2
HIV+ among STD clinics (%)
Total work participation rate
34.3
Number of Integrated Counseling and Testing
Centres (ICTC formerly VCTC)
Female work participation rate
20.1
Number of Anti Retroviral Therapy (ART) Centres
61.6
98.1
5.1
33.3
4.3
59
39.5
53.1
34.9
40.3
35.6
16.0
42.1
2
-
-
0.0
0.0
15
0
| 75

9.4 Page 84

▲back to top


Population Foundation of India
district
munger
Showing CD Blocks
INDIA
BIHAR
DISTRICT MUNGER
KILOMETRES
5
0
5
TRI
S
T
IC
R
USARAI
G
E
B
MUNGER
MUNGER
JAMALPUR
JAMALPUR
DHARHARA
DHARHARA
BARIARPUR
BARIARPUR
DISTRICT
BH A G A L P U R
ASARGANJ
KHARAGPUR
J
A
M
U
I
BOUNDARY , DISTRICT
,,
C.D. BLOCK
HEADQUARTERS: DISTRICT, C.D. BLOCK
KHARAGPUR
TARAPUR
TARAPUR
TETIAH
BAMBAR
TETIAH
BAMBAR
SANGRAMPUR
SANGRAMPUR
D
I
ISTR
76 |

9.5 Page 85

▲back to top


Population, Health & Social Development in Bihar, Jharkhand, Orissa and West bengal
DISTRICT MUNGER
General Information
Area (sq. kms.)
Percent to total state’s area
C D blocks
Towns
No. of villages
Demographic Particulars (Census, 2001)
Population
Persons
Males
Females
Rural (%)
Urban (%)
Scheduled Castes (%)
Scheduled Tribes (%)
Elderly population (60+ years) (%)
Young people (10-24 years) (%)
Adolescents (10-19 years) (%)
Decadal Growth Rate, 1991-2001 (%)
Population density (per sq. km)
Sex Ratio (females per 1000 males)
1991
2001
Child Sex Ratio (0-6 years) (girls per 1000 boys)
1991
2001
Literacy rate (7+)
Persons
Males
Females
Total work participation rate
Female work participation rate
Household Amenities, (%), Census 2001
1419.0
Households with kutchha houses
1.5
Households with safe drinking water
9
Households with electricity connection
4 Vital Rates
633
Crude Birth Rate, 2001
Total Fertility Rate, 2001
Infant Mortality Rate, 2001
Key RCH Indicators from District Level
Household Survey, 2007-08 (%)
1137797
607730
530067
72.1
Girls marrying below 18 years
Birth order 3 and above
Current use of any FP Method
Total unmet need
27.9
Mothers who had at least 3 ANC visits during
the last pregnancy
13.3
1.6
6.8
31.2
Institutional delivery
23.2
20.6
Children with full immunization
802
Medical/Health Infrastructures/Institutions
856
Number of Hospitals
872
CHCs
PHCs
934
Sub-Centres
914
59.5
69.9
47.4
29.1
13.4
23.5
51.0
23.7
29.0
4.0
55
30.5
42.6
41.4
31.6
36.8
48.6
36.3
1
-
-
| 77

9.6 Page 86

▲back to top


Population Foundation of India
district
muzaffarpur
Showing CD Blocks
INDIA
BIHAR
DISTRICT MUZAFFARPUR
RICT
T
KILOMETRES
5
0
PURBA
5
C
H
A
M
A
P
R
A
N
DI
SH
S
E
T
O
R
H
I
A
C
R
T
MINAPUR
SAHEBGANJ
BARURAJ
(MOTIPUR)
SAHEBGANJ
BARURAJ
(MOTIPUR)
MINAPUR
KANTI
RICT
T
S
SITAM
A
R
AURAI
AURAI
KATRA
BOCHAHA
KATRA
PAROO
PAROO
KANTI
SARAIYA
MARWAN
MARWAN
SARAIYA
BOCHAHA
GAIGHAT
MUZAFFARPUR
MUSAHARI
GAIGHAT
KURHANI
BANDRA
DHOLI
(MORAUL)
BANDRA
A
RAN
KURHANI
D
I
S
T
R
I
C
T
BOUNDARY , DISTRICT
,,
C.D. BLOCK
HEADQUARTERS: DISTRICT, C.D. BLOCK
SAKRA
DHOLI
(MORAUL)
SAKRA
DI S T
VAISHALI
78 |

9.7 Page 87

▲back to top


Population, Health & Social Development in Bihar, Jharkhand, Orissa and West bengal
DISTRICT MUZAFFARPUR
General Information
Area (sq. kms.)
Percent to total state’s area
C D blocks
Towns
No. of villages
Demographic Particulars (Census, 2001)
Population
Persons
Males
Females
Rural (%)
Urban (%)
Scheduled Castes (%)
Scheduled Tribes (%)
Elderly population (60+ years) (%)
Young people (10-24 years) (%)
Adolescents (10-19 years) (%)
Decadal Growth Rate, 1991-2001 (%)
Population density (per sq. km)
Sex Ratio (females per 1000 males)
1991
2001
Child Sex Ratio (0-6 years) (girls per 1000 boys)
1991
2001
Literacy rate (7+)
Persons
Males
Females
Total work participation rate
Female work participation rate
Household Amenities, (%), Census 2001
3172.0
Households with kutchha houses
3.4
Households with safe drinking water
16
Households with electricity connection
3 Vital Rates
1824
Crude Birth Rate, 2001
Total Fertility Rate, 2001
Infant Mortality Rate, 2001
Key RCH Indicators from District Level
Household Survey, 2007-08 (%)
3746714
Girls marrying below 18 years
1951466
Birth order 3 and above
1795248
Current use of any FP Method
90.7
Total unmet need
9.3
Mothers who had at least 3 ANC visits during
the last pregnancy
15.9
0.1
7.0
29.5
Institutional delivery
21.9
26.8
Children with full immunization
1181
Medical/Health Infrastructures/Institutions
904
920
CHCs
PHCs
943
Sub-Centres
928
Information on HIV/AIDS
48.0
59.1
HIV+ among ANC clinics (%)
35.8
HIV+ among STD clinics (%)
30.4
Number of Integrated Counseling and Testing
Centres (ICTC formerly VCTC)
12.7
Number of Anti Retroviral Therapy (ART) Centres
42.9
93.1
12.5
32.7
4.6
64
35.7
50.5
33.1
36.9
20.4
23.0
57.4
1
61
473
0.0
0.4
11
1
| 79

9.8 Page 88

▲back to top


Population Foundation of India
district
nalanda
Showing CD Blocks
T
S
KARAI PARSURAI
KARAI PARSURAI
R
I
C
HARNAUT
NAGAR NAUSA
NAGAR NAUSA
CHANDI
T
HARNAUT
INDIA
BIHAR
DISTRICT NALANDA
KILOMETRES
5
0
5
P
A
T
HILSA
HILSA
CHANDI
EKANGARSARAI
EKANGARSARAI
THARTHARI
THARTHARI
NOORSARAI
PARBALPUR
PARBALPUR
NOORSARAI
BEN
ISLAMPUR
BEN
SILAO
RAHUI
RAHUI
BIHAR
BIHAR
BIND
N
A
SARMERA
BIND
SARMERA
ASTHAWAN
ASTHAWAN
DISTRICT
A
S H E I KH PUR
ISLAMPUR
D
IS
TRICT
RAJGIR
SILAO
GIRIAK
KATRISARAI
GIRIAK
KATRISARAI
GAYA
RAJGIR
DISTRICT
W
A
N
BOUNDARY . DISTRICT
,,
C.D. BLOCK
HEADQUARTERS: DISTRICT, C.D. BLOCK
80 |

9.9 Page 89

▲back to top


Population, Health & Social Development in Bihar, Jharkhand, Orissa and West bengal
DISTRICT NALANDA
General Information
Area (sq. kms.)
Percent to total state’s area
C D blocks
Household Amenities, (%), Census 2001
2355.0
Households with kutchha houses
2.5
Households with safe drinking water
20
Households with electricity connection
Towns
5 Vital Rates
No. of villages
1140
Demographic Particulars (Census, 2001)
Population
Persons
Males
Females
2370528
1238599
1131929
Crude Birth Rate, 2001
Total Fertility Rate, 2001
Infant Mortality Rate, 2001
Key RCH Indicators from District Level
Household Survey, 2007-08 (%)
Girls marrying below 18 years
Birth order 3 and above
Current use of any FP Method
Rural (%)
85.1
Total unmet need
Urban (%)
14.9
Mothers who had at least 3 ANC visits during
the last pregnancy
Scheduled Castes (%)
20.0
Scheduled Tribes (%)
0.0
Elderly population (60+ years) (%)
7.1
Young people (10-24 years) (%)
30.0
Institutional delivery
Adolescents (10-19 years) (%)
22.0
Decadal Growth Rate, 1991-2001 (%)
18.7
Children with full immunization
Population density (per sq. km)
Sex Ratio (females per 1000 males)
1991
1007
Medical/Health Infrastructures/
Institutions
898
2001
914
Child Sex Ratio (0-6 years) (girls per 1000 boys)
1991
962
CHCs
PHCs
Sub-Centres
2001
942
Literacy rate (7+)
Persons
Males
Females
Information on HIV/AIDS
53.2
66.4
HIV+ among ANC clinics (%)
38.6
HIV+ among STD clinics (%)
Total work participation rate
Female work participation rate
38.1
Number of Integrated Counseling and Testing
Centres (ICTC formerly VCTC)
27.0
Number of Anti Retroviral Therapy (ART) Centres
12.9
63.3
10.4
31.2
4.2
62
46.6
47.8
30.9
40.7
25.2
39.3
54.2
3
48
302
0.25
1.33
0
0
| 81

9.10 Page 90

▲back to top


Population Foundation of India
district
nawada
Showing CD Blocks
INDIA
BIHAR
DISTRICT NAWADA
KILOMETRES
5
0
5
DISTRICT S
A
D
KASHI CHAK
N
NALA
KASHI CHAK
DISTRICT
WARISALIGANJ
WARISALIGANJ
NARDIGANJ
NAWADA
PAKRIBARAWAN
NARDIGANJ
NAWADA
PAKRIBARAWAN
ROH
HISUA
HISUA
NARHAT
AKBARPUR
NARHAT
MESKAUR
SIRDALA
AKBARPUR
RAJAULI
ROH
GOVINDPUR
GOVINDPUR
SIRDALA
RAJAULI
J
H
A
H
K
R
S
T
R
ICT
KAWAKOLE
KAWAKOLE
D
N
A
BOUNDARY , STATE
,,
DISTRICT
,,
C.D. BLOCK
HEADQUARTERS: DISTRICT, C.D. BLOCK
82 |

10 Pages 91-100

▲back to top


10.1 Page 91

▲back to top


Population, Health & Social Development in Bihar, Jharkhand, Orissa and West bengal
DISTRICT NAWADA
General Information
Household Amenities, (%), Census 2001
Area (sq. kms.)
2494.0
Households with kutchha houses
Percent to total state’s area
2.6
Households with safe drinking water
C D blocks
14
Households with electricity connection
Towns
3 Vital Rates
No. of villages
1051
Crude Birth Rate, 2001
Total Fertility Rate, 2001
Demographic Particulars (Census, 2001)
Population
Persons 1809696
Infant Mortality Rate, 2001
Key RCH Indicators from District Level
Household Survey, 2007-08 (%)
Girls marrying below 18 years
Males 929960
Birth order 3 and above
Females 879736
Current use of any FP Method
Rural (%)
Urban (%)
Scheduled Castes (%)
92.3
Total unmet need
7.7
Mothers who had at least 3 ANC visits during
the last pregnancy
24.1
Scheduled Tribes (%)
0.1
Elderly population (60+ years) (%)
6.8
Young people (10-24 years) (%)
30.4
Institutional delivery
Adolescents (10-19 years) (%)
22.5
Decadal Growth Rate, 1991-2001 (%)
33.1
Children with full immunization
Population density (per sq. km)
726
Sex Ratio (females per 1000 males)
Medical/Health Infrastructures/
Institutions
1991
936
2001
946
CHCs
Child Sex Ratio (0-6 years) (girls per 1000 boys)
PHCs
1991
974
Sub-Centres
2001
978
Literacy rate (7+)
Information on HIV/AIDS
Persons
46.8
Males
60.6
HIV+ among ANC clinics (%)
Females
32.2
HIV+ among STD clinics (%)
Total work participation rate
37.3
Number of Integrated Counseling and Testing
Centres (ICTC formerly VCTC)
Female work participation rate
25.8
Number of Anti Retroviral Therapy (ART) Centres
13.6
74.0
6.7
33.3
4.3
59
65.3
51.6
24.3
39.9
23.6
31.1
48.9
2
37
129
0.25
-
0
0
| 83

10.2 Page 92

▲back to top


Population Foundation of India
district
paschim
champaran
Showing CD Blocks
INDIA
E
BIHAR
PASHCHIM CHAMPARAN
N
P
KILOMETRES
5
0
5
SIDHAW
RAMNAGAR
SIDHAW
GAUNAHA
A
GAUNAHA
MAINATANR
RAMNAGAR
PIPRASI
BAGAHA
PIPRASI
NARKATIAGANJ
MAINATANR
NARKATIAGANJ
BAGAHA
LAURIYA
MADHUBANI
MADHUBANI B H I T A H A
BHITAHA
LAURIYA
JOGAPATTI
CHANPATIA
JOGAPATTI
CHANPATIA
SIKTA
SIKTA
D
E
BOUNDARY, INTERNATIONAL
,,
STATE
,,
DISTRICT
,,
C.D. BLOCK
HEADQUARTERS: DISTRICT, C.D. BLOCK
THAKRAHAN
MAJHAULIA
THAKRAHAN
BAIRIA
S
BAIRIA
NAUTAN
MAJHAULIA
H
NAUTAN
T
C
I
R
T
P ATLRGIACNTJ
DIS
84 |

10.3 Page 93

▲back to top


Population, Health & Social Development in Bihar, Jharkhand, Orissa and West bengal
DISTRICT PASCHIM CHAMPARAN
General Information
Area (sq. kms.)
Percent to total state’s area
C D blocks
Household Amenities, (%), Census 2001
5228.0
Households with kutchha houses
5.6
Households with safe drinking water
18
Households with electricity connection
Towns
5 Vital Rates
No. of villages
Demographic Particulars (Census, 2001)
Population
1484
Crude Birth Rate, 2001
Total Fertility Rate, 2001
Infant Mortality Rate, 2001
Key RCH Indicators from District Level
Household Survey, 2007-08 (%)
Persons 3043466
Girls marrying below 18 years
Males 1600839
Birth order 3 and above
Females 1442627
Current use of any FP Method
Rural (%)
Urban (%)
Scheduled Castes (%)
Scheduled Tribes (%)
Elderly population (60+ years) (%)
89.8
Total unmet need
10.2
Mothers who had at least 3 ANC visits during
the last pregnancy
14.3
1.5
6.1
Young people (10-24 years) (%)
28.1
Institutional delivery
Adolescents (10-19 years) (%)
Decadal Growth Rate, 1991-2001 (%)
Population density (per sq. km)
Sex Ratio (females per 1000 males)
20.6
30.4
Children with full immunization
582
Medical/Health Infrastructures/
Institutions
1991
877
2001
901
Child Sex Ratio (0-6 years) (girls per 1000 boys)
1991
963
CHCs
PHCs
Sub-Centres
2001
953
Literacy rate (7+)
Persons
Males
Females
Information on HIV/AIDS
38.9
51.1
HIV+ among ANC clinics (%)
25.2
HIV+ among STD clinics (%)
Total work participation rate
37.9
Number of Integrated Counseling and Testing
Centres (ICTC formerly VCTC)
Female work participation rate
23.6
Number of Anti Retroviral Therapy (ART) Centres
52.3
96.8
6.2
35.7
5.0
57
57.8
58.7
32.3
36.9
32.4
24.9
30.2
2
41
389
0.00
1.20
12
0
| 85

10.4 Page 94

▲back to top


Population Foundation of India
district
patna
Showing CD
Blocks
IS T R ICT
D
MANER
MANER
S
A
R
PATNA
A
N
INDIA
BIHAR
DISTRICT PATNA
KILOMETRES
5
0
5
BIHTA
DINAPUR
PATNA
BIHTA
NAUBATPUR
PHULWARI
PATNA
CITY
PHULWARI SAMPAT
CHAK
S
T
RICT
VAISHALI
DIST
DISTRICT SAMASTIPUR
R
I
PANDARAKH
C
T
BIKRAM
NAUBATPUR
PUNPUN
PUNPUN
FATWAH
FATWAH
BAKHTIARPUR
KHUSRUPUR
BARH
PANDARAKH
BIKRAM
DULHIN
BAZAR
MASAURHI
DHANARUA
KHUSRUPUR
DANIAWAN
DANIAWAN
ATHMALGOLA
BAKHTIARPUR ATHMALGOLA
BARH
MOKAMEH
G
US
DULHIN
BAZAR
MASAURHI
DHANARUA
BELCHHI BELCHHI
GHOSWARI
MOKAMEH
PALIGANJ
PALIGANJ
TR I CT
J
E
H
A
N
A
B
A
D
D
I
S
T
R
I
C
T
N
A
L
A
N
GHOSWARI
D
A
DIST RICT LAK HISARAI
BOUNDARY , DISTRICT
,,
C.D. BLOCK
HEADQUARTERS: DISTRICT, C.D. BLOCK
86 |

10.5 Page 95

▲back to top


Population, Health & Social Development in Bihar, Jharkhand, Orissa and West bengal
DISTRICT PATNA
General Information
Household Amenities, (%), Census 2001
Area (sq. kms.)
3202.0
Households with kutchha houses
Percent to total state’s area
3.4
Households with safe drinking water
C D blocks
24
Households with electricity connection
Towns
12 Vital Rates
No. of villages
1565
Crude Birth Rate, 2001
Total Fertility Rate, 2001
Demographic Particulars (Census, 2001)
Infant Mortality Rate, 2001
Population
Key RCH Indicators from District Level
Household Survey, 2007-08 (%)
Persons 4718592
Girls marrying below 18 years
Males 2519942
Birth order 3 and above
Females 2198650
Current use of any FP Method
Rural (%)
58.4
Total unmet need
Urban (%)
41.6
Mothers who had at least 3 ANC visits during
the last pregnancy
Scheduled Castes (%)
15.5
Scheduled Tribes (%)
0.2
Elderly population (60+ years) (%)
6.7
Young people (10-24 years) (%)
31.7
Institutional delivery
Adolescents (10-19 years) (%)
23.0
Decadal Growth Rate, 1991-2001 (%)
30.4
Children with full immunization
Population density (per sq. km)
1474
Sex Ratio (females per 1000 males)
Medical/Health Infrastructures/Institutions
1991
867
2001
873
CHCs
Child Sex Ratio (0-6 years) (girls per 1000 boys)
PHCs
1991
937
Sub-Centres
2001
923
Literacy rate (7+)
Information on HIV/AIDS
Persons
62.9
Males
73.3
HIV+ among ANC clinics (%)
Females
50.8
HIV+ among STD clinics (%)
Total work participation rate
30.2
Number of Integrated Counseling and Testing
Centres (ICTC formerly VCTC)
Female work participation rate
13.3
Number of Anti Retroviral Therapy (ART) Centres
9.4
77.5
42.8
28.4
3.9
50
34.0
45.7
43.7
31.0
20.7
58.8
43.8
4
86
418
0.75
3.20
1
1
| 87

10.6 Page 96

▲back to top


Population Foundation of India
district
pcuhrNabmaparanBINIHDAIAR
ShowinE g
CDISBTlRoICcTkPsURBA
INDIA
CHAMPARAN
N
RAXAUL
BAZAR
KILOMETRES
5 BIHA0 R 5
RAXAUL
ADAPUR
E
DISTRPICT PURBA CHAMPARAN
RAXAUL
RAMGARHWA BAZAR
RAXAUL
RAMGARHWA
ADAPUR
ADAPUR
A KILOMETRES
5
0
5
NARKATIA
P BANKATWA GHORASAHAN
RAMGARHWA
SUGRAAUMLI GARHWA
BANJARIA
ADAPUR
A
NARKATIA
BANKATWA
GHORASAHAN
MOTIHNAARRKAI TIA
BANKATWA GHORASAHAN
DHAKA
T
IS
D
T
IS
D
PAHARPUR
SUGAULI
NARKATIA
BACNHKIARTAWIAA
SUGAULI
BANJARIA
BANJARIA
TURKAULIA
MOTIHARI
GHORASAHAN
DHAKA
CHIRAIA
DHAKA
HARSIDSHUI GAULI
MOTIHARI
CHIRAIA
BANJARIA
DHAKA
PATAHI
PPAAHAHRAPURRPUR
HARSIDHI
HARSIDHI
TURKAULIA
TURKAULIA
PIPRAKOTHI
PIPRAKOTHI
CHIRAIA PATAHI
ARERAJ
ARPEARHAARJPUR
HARSIDHI
TURKAUKOLITAWA
C
ART ERAJ
SANGRAMPUR
ARERAJ
SANGRAMPUR
KOTWA
KOTWA
KESARIA
G
SANGRAMPUR
C
O SANGRAMPUR
KOTWA
T
P
A
KESARIA KESARIA
G
L
O
P
A
G
A
N
J KESARIA
L
G
A
N
J
MOTIHARI
CHAKIA
(PIPRA)
PIPRAKOTHI
PIPRAKOTHI
PAKRIDAYAL
PAKRIDAYAL
PHENHARA
PATAHI
PHENHARA
MADHUBAN PATAHI
CHAKIA
KALYANPUR (PIPRA)
PAKRIDAYAL
PHENHARA
PAKRIDAYAL
CHAKIA
MADHUBPAHENNHARA
(PIPRA)
MADHUBAN
TETARIA
TETARIA
KALYANPUR
KALYANPUR
CHAKIA
(PIPRA)
KALYANPUR
DISTRICT
DISTRICT
MEHSI
MADHUBAN
MEHSI
MU
MU
MEHSI
TETARIA
TETARIA
Z A FFAR
MEHSI
Z A FFAR
U
P
U
P
BOUNDARY, INTERNATIONAL
,, DISTRICT
,, C.D. BLOCK
HEADQUARTERS: DISTRICT, C.D. BLOCK
BOUNDARY, INTERNATIONAL
,, DISTRICT
,, C.D. BLOCK
HEADQUARTERS: DISTRICT, C.D. BLOCK
88 |

10.7 Page 97

▲back to top


Population, Health & Social Development in Bihar, Jharkhand, Orissa and West bengal
DISTRICT PURBA CHAMPARAN
General Information
Household Amenities, (%), Census 2001
Area (sq. kms.)
3968.0
Households with kutchha houses
Percent to total state’s area
4.2
Households with safe drinking water
C D Bbocks
27
Households with electricity connection
Towns
7 Vital Rates
No. of villages
2835
Crude Birth Rate, 2001
Total Fertility Rate, 2001
Demographic Particulars (Census, 2001)
Population
Infant Mortality Rate, 2001
Key RCH Indicators from District Level
Household Survey, 2007-08 (%)
Persons 3939773
Girls marrying below 18 years
Males 2077047
Birth order 3 and above
Females 1862726
Current use of any FP Method
Rural (%)
93.6
Total unmet need
Urban (%)
6.4
Mothers who had at least 3 ANC visits during
the last pregnancy
Scheduled Castes (%)
13.0
Scheduled Tribes (%)
0.1
Elderly population (60+ years) (%)
6.2
Young people (10-24 years) (%)
28.4
Institutional delivery
Adolescents (10-19 years) (%)
20.9
Decadal Growth Rate, 1991-2001 (%)
29.5
Children with full immunization
Population density (per sq. km)
993
Sex Ratio (females per 1000 males)
Medical/Health Infrastructures/Institutions
1991
883
2001
897
CHCs
Child Sex Ratio (0-6 years) (girls per 1000 boys)
PHCs
1991
944
Sub-Centres
2001
937
Literacy rate (7+)
Information on HIV/AIDS
Persons
37.5
Males
49.3
HIV+ among ANC clinics (%)
Females
Total work participation rate
Female work participation rate
24.3
HIV+ among STD clinics (%)
32.7
Number of Integrated Counseling and Testing
Centres (ICTC formerly VCTC)
14.7
Number of Anti Retroviral Therapy (ART) Centres
45.0
93.0
6.3
34.8
4.9
59
54.9
48.1
27.7
34.7
36.0
27.1
41.3
3
66
315
0.50
1.60
16
0
| 89

10.8 Page 98

▲back to top


Population Foundation of India
district
purnia
Showing CD
Blocks
INDIA
BIHAR
DISTRICT PURNIA
KILOMETRES
5
0
5
A
R
D
I
S
T
R
I
C
T
SRINAGAR
BANMANKHI
DISTRICT
A
I
R
A
R
A
BAISA
BAISA
AMOUR
JALALGARH
JALALGARH
AMOUR
BANMANKHI
SRINAGAR KASBA
KASBA
BAISI
BARHARA
DHAMDAHA
BARHARA
DHAMDAHA
KRITYANAND
NAGAR
KRITYANAND
NAGAR
PURNIA EAST
DAGARUA
DAGARUA
PURNIA EAST
BHAWANIPUR
BHAWANIPUR
RUPAULI
RUPAULI
TR IC T BHAGALPUR
T
C
I
R
T
A
K
S
I
BOUNDARY , STATE
,,
DISTRICT
,,
C.D. BLOCK
HEADQUARTERS: DISTRICT, C.D. BLOCK
BAISI
I
T
90 |

10.9 Page 99

▲back to top


Population, Health & Social Development in Bihar, Jharkhand, Orissa and West bengal
DISTRICT PURNIA
General Information
Household Amenities, (%), Census 2001
Area (sq. kms.)
3229.0
Households with kutchha houses
Percent to total state’s area
3.4
Households with safe drinking water
C D blocks
14
Households with electricity connection
Towns
3 Vital Rates
No. of villages
1197
Crude Birth Rate, 2001
Total Fertility Rate, 2001
Demographic Particulars (Census, 2001)
Infant Mortality Rate, 2001
Population
Key RCH Indicators from District Level
Household Survey, 2007-08 (%)
Persons 2543942
Girls marrying below 18 years
Males 1328417
Birth order 3 and above
Females 1215525
Current use of any FP Method
Rural (%)
91.3
Total unmet need
Urban (%)
8.7
Mothers who had at least 3 ANC visits during
the last pregnancy
Scheduled Castes (%)
12.3
Scheduled Tribes (%)
4.4
Elderly population (60+ years) (%)
5.4
Young people (10-24 years) (%)
28.8
Institutional delivery
Adolescents (10-19 years) (%)
21.6
Decadal Growth Rate, 1991-2001 (%)
35.4
Children with full immunization
Population density (per sq. km)
788
Sex Ratio (females per 1000 males)
Medical/Health Infrastructures/Institutions
1991
903
2001
915
CHCs
Child Sex Ratio (0-6 years) (girls per 1000 boys)
PHCs
1991
965
Sub-Centres
2001
967
Literacy rate (7+)
Information on HIV/AIDS
Persons
35.1
Males
45.6
HIV+ among ANC clinics (%)
Females
23.4
HIV+ among STD clinics (%)
Total work participation rate
37.8
Number of Integrated Counseling and Testing
Centres (ICTC formerly VCTC)
Female work participation rate
23.3
Number of Anti Retroviral Therapy (ART) Centres
72.6
98.2
7.1
37.6
5.0
63
40.4
53.6
27.5
41.2
19.4
21.6
37.4
2
45
278
-
0.4
10
0
| 91

10.10 Page 100

▲back to top


Population Foundation of India
district
rohtas INDIA
BIHAR
Showing
DISTRICT ROHTACSD Blocks
KILOMETRES
5
0
5
)
A
R
T
IS
D
KOCHAS
KOCHAS
T
C
BUXAR
DINARA
KOATH
DAWATH
KOATH
DAWATH
DIST
DINARA
SURYAPURA
SURYAPURA
BIKRAMGANJ
BIKRAMGANJ
SANJHAULI
KARAKAT
CHENARI
KARGAHAR
KARGAHAR
SHEOSAGAR
SHEOSAGAR
NOKHA
NOKHA
SASARAM
SASARAM
SANJHAULI
KARAKAT
RAJPUR
RAJPUR
NASRIGANJ
AKORHI
GOLA
AKORHI
GOLA
DEHRI
NASRIGANJ
DEHRI
A
R
U
J
P
U
R
CHENARI
TILAUTHU
TILAUTHU
UPTRTAADRESH
J
S
DI
H
A
NAUHATTA
ROHTAS
ROHTAS
NAUHATTA
N
A
R
K
H
BOUNDARY , STATE
,,
DISTRICT
,,
C.D. BLOCK
HEADQUARTERS: DISTRICT, C.D. BLOCK
92 |

11 Pages 101-110

▲back to top


11.1 Page 101

▲back to top


Population, Health & Social Development in Bihar, Jharkhand, Orissa and West bengal
DISTRICT ROHTAS
General Information
Household Amenities, (%), Census 2001
Area (sq. kms.)
3851.0
Households with kutchha houses
Percent to total state’s area
4.1
Households with safe drinking water
C D blocks
18
Households with electricity connection
Towns
5 Vital Rates
No. of villages
1855
Crude Birth Rate, 2001
Total Fertility Rate, 2001
Demographic Particulars (Census, 2001)
Infant Mortality Rate, 2001
Population
Key RCH Indicators from District Level
Household Survey, 2007-08 (%)
Persons 2450748
Girls marrying below 18 years
Males 1283485
Birth order 3 and above
Females 1167263
Current use of any FP Method
Rural (%)
86.7
Total unmet need
Urban (%)
13.3
Mothers who had at least 3 ANC visits during
the last pregnancy
Scheduled Castes (%)
18.1
Scheduled Tribes (%)
1.0
Elderly population (60+ years) (%)
6.9
Young people (10-24 years) (%)
30.0
Institutional delivery
Adolescents (10-19 years) (%)
22.2
Decadal Growth Rate, 1991-2001 (%)
27.8
Children with full immunization
Population density (per sq. km)
636
Sex Ratio (females per 1000 males)
Medical/Health Infrastructures/Institutions
1991
894
2001
909
CHCs
Child Sex Ratio (0-6 years) (girls per 1000 boys)
PHCs
1991
965
Sub-Centres
2001
951
Literacy rate (7+)
Information on HIV/AIDS
Persons
61.3
Males
75.3
HIV+ among ANC clinics (%)
Females
45.7
HIV+ among STD clinics (%)
Total work participation rate
30.4
Number of Integrated Counseling and Testing
Centres (ICTC formerly VCTC)
Female work participation rate
13.5
Number of Anti Retroviral Therapy (ART) Centres
2.4
92.6
16.5
32.1
4.5
55
52.9
47.7
40.0
29.8
26.6
48.5
42.3
1
30
186
0.50
-
0
0
| 93

11.2 Page 102

▲back to top


Population Foundation of India
district
INDIA
saharsa BIHAR
DMIASDTHRUBI CANT I
DMIASDTHRUBI CANT I
D
D
I
I
S
S
Showing
TRICT S
TRICT S
CD
UP
UP
BlocksDISTRICINTDISAAHARSA
KILOMETRES
5
BIH0AR
5
DISTRICT SAHARSA
AUL
KILOMETRES
5
0
5
AUL
NAUHATTA
NAUHATTA
SATAR KATAIYA
M A HNI SAHUI H A T T A
NAUHATTASATAR KATA IY A
SATAR KATAIYA
KAHARA
MAHISHI
MAHISHI
SATAR KATAKIYAHAARA
KAHARA
KAHARA
SAUR BAZAR
MAHISHI
SIMRI BAKHTIARPUR
SAUR BAZAR
SAUR BAZAR
RIC
T
R
PIA T ACR G H A T
T
PATARGHAT
PATARGHAT
SAUR BAZAR
SIM R I B AKH TIA RPU RSIMRI BAKHTIARPUR
SONBARSA
PATARGHAT
SALKHUA
BANMA ITAHRI
SONBARSA
SONBARSA
SALKHUA
R
I
C
R
T
I
C
T
SIMRI BAKHTIARPUR
SALKHUA
B
A
N
M
ABIATNAMAHIRTAIHRI
SONBARSA
SALKHUA
BANMA ITAHRI
A
I
KH A GAR
A
I
KH A GAR
BOUNDARY , DISTRICT
,,
C.D. BLOCK
HEADQUARTERS: DISTRICT, C.D. BLOCK
BOUNDARY , DISTRICT
,,
C.D. BLOCK
HEADQUARTERS: DISTRICT, C.D. BLOCK
94 |

11.3 Page 103

▲back to top


Population, Health & Social Development in Bihar, Jharkhand, Orissa and West bengal
DISTRICT SAHARSA
General Information
Household Amenities, (%), Census 2001
Area (sq. kms.)
1702.0
Households with kutchha houses
Percent to total state’s area
1.8
Households with safe drinking water
C D blocks
10
Households with electricity connection
Towns
1 Vital Rates
No. of villages
504
Crude Birth Rate, 2001
Total Fertility Rate, 2001
Demographic Particulars (Census, 2001)
Infant Mortality Rate, 2001
Population
Key RCH Indicators from District Level
Household Survey, 2007-08 (%)
Persons 1508182
Girls marrying below 18 years
Males 789432
Birth order 3 and above
Females 718750
Current use of any FP Method
Rural (%)
91.7
Total unmet need
Urban (%)
8.3
Mothers who had at least 3 ANC visits during
the last pregnancy
Scheduled Castes (%)
16.1
Scheduled Tribes (%)
0.3
Elderly population (60+ years) (%)
5.8
Young people (10-24 years) (%)
29.4
Institutional delivery
Adolescents (10-19 years) (%)
21.6
Decadal Growth Rate, 1991-2001 (%)
33.2
Children with full immunization
Population density (per sq. km)
Sex Ratio (females per 1000 males)
1991
886
Medical/Health Infrastructures/
Institutions
884
2001
910
CHCs
Child Sex Ratio (0-6 years) (girls per 1000 boys)
PHCs
1991
920
Sub-Centres
2001
912
Literacy rate (7+)
Information on HIV/AIDS
Persons
39.1
Males
51.7
HIV+ among ANC clinics (%)
Females
Total work participation rate
Female work participation rate
25.3
HIV+ among STD clinics (%)
39.1
Number of Integrated Counseling and Testing
Centres (ICTC formerly VCTC)
28.4
Number of Anti Retroviral Therapy (ART) Centres
57.5
96.5
6.9
35.5
4.6
57
54.4
47.9
32.6
37.5
13.9
20.0
43.4
0
40
152
1.14
-
0
0
| 95

11.4 Page 104

▲back to top


Population Foundation of India
district
samastipur
Showing CD Blocks
D
FFARPUR
I
S
T
R
KALYANPUR
I
C
T
PUSA
KALYANPUR
WARISNAGAR
INDIA
BIHAR
DISTRICT SAMASTIPUR
KILOMETRES
5
0
5
D
A
R
KHANPUR
B
PUSA
WARISNAGAR
TAJPUR
TAJPUR
SAMASTIPUR
SAMASTIPUR
KHANPUR
SHIVAJI NAGAR
SHIVAJI NAGAR
SINGHIA
H
A
TAJPUR
MORWA
TAJPUR
MORWA
SARAIRANJAN
SARAIRANJAN
UJIARPUR
UJIARPUR
ROSERA
HASANPUR
SINGHIA
BIBHUTPUR
ROSERA
N
G
A
BITHAN
PATORI
DALSINGHSARAI
DALSINGHSARAI
VIDYAPATINAGAR
BIBHUTPUR
PATORI
MOHANPUR
VIDYAPATINAGAR
MOHIUDDINAGAR
MOHIUDDINAGAR
D
I
S
T
R
I
C
T
B
E
G
U
S
HASANPUR
ARA
BITHAN
I
DISTRICT KHAGARIA
MOHANPUR
D
ISTRI CT
T
PA
BOUNDARY , DISTRICT
,,
C.D. BLOCK
HEADQUARTERS: DISTRICT, C.D. BLOCK
96 |

11.5 Page 105

▲back to top


Population, Health & Social Development in Bihar, Jharkhand, Orissa and West bengal
DISTRICT SAMASTIPUR
General Information
Household Amenities, (%), Census 2001
Area (sq. kms.)
2904.0
Households with kutchha houses
Percent to total state’s area
3.1
Households with safe drinking water
C D blocks
20
Households with electricity connection
Towns
4 Vital Rates
No. of villages
1230
Crude Birth Rate, 2001
Total Fertility Rate, 2001
Demographic Particulars (Census, 2001)
Infant Mortality Rate, 2001
Population
Key RCH Indicators from District Level
Household Survey, 2007-08 (%)
Persons 3394793
Girls marrying below 18 years
Males 1760692
Birth order 3 and above
Females 1634101
Current use of any FP Method
Rural (%)
96.4
Total unmet need
Urban (%)
3.9
Mothers who had at least 3 ANC visits during
the last pregnancy
Scheduled Castes (%)
18.5
Scheduled Tribes (%)
0.1
Elderly population (60+ years) (%)
6.7
Young people (10-24 years) (%)
29.5
Institutional delivery
Adolescents (10-19 years)(%)
21.9
Decadal Growth Rate, 1991-2001 (%)
24.9
Children with full immunization
Population density (per sq. km)
1169
Sex Ratio (females per 1000 males)
Medical/Health Infrastructures/Institutions
1991
926
2001
928
CHCs
Child Sex Ratio (0-6 years) (girls per 1000 boys)
PHCs
1991
942
Sub-Centres
2001
938
Literacy rate (7+)
Information on HIV/AIDS
Persons
45.1
Males
57.6
HIV+ among ANC clinics (%)
Females
31.7
HIV+ among STD clinics (%)
Total work participation rate
31.6
Number of Integrated Counseling and Testing
Centres (ICTC formerly VCTC)
Female work participation rate
15.1
Number of Anti Retroviral Therapy (ART) Centres
25.7
86.7
7.4
34.8
4.9
54
51.4
52.7
34.8
36.3
23.9
27.6
51.1
1
73
354
0.75
-
0
0
| 97

11.6 Page 106

▲back to top


Population Foundation of India
district
saran
Showing CD
Blocks
INDIA
BIHAR
DISTRICT SARAN
KILOMETRES
5
0
5
DISTRICT
GOPALGANJ
PANAPUR
W
I
S
MASHRAKH
MASHRAKH
PANAPUR
TARAIYA
T
RIC
EKMA
LAHLADPUR
LAHLADPUR
BANIAPUR
BANIAPUR
EKMA
ISHUAPUR
ISHUAPUR
TARAIYA
AMNOUR
RPUR
MAKER
MANJHI
UTTAR
MANJHI
PRADESH
JALALPUR
JALALPUR
REVELGANJ
REVELGANJ
MARHAURA
MARHAURA
NAGRA
AMNOUR
NAGRA
CHAPRA
GARKHA
MAKER
PARSA
PARSA
DARIAPUR
CHAPRA
GARKHA
DARIAPUR
DIGHWARA
DIGHWARA
SONEPUR
BOUNDARY , STATE
,,
DISTRICT
,,
C.D. BLOCK
HEADQUARTERS: DISTRICT, C.D. BLOCK
DISTRICT BHOJPUR
D I ST RIC
T
SONEPUR
PATNA
98 |

11.7 Page 107

▲back to top


Population, Health & Social Development in Bihar, Jharkhand, Orissa and West bengal
DISTRICT SARAN
General Information
Household Amenities, (%), Census 2001
Area (sq. kms.)
Percent to total state’s area
C D blocks
Towns
No. of villages
2641.0
Households with kutchha houses
2.8
Households with safe drinking water
20
Households with electricity connection
5 Vital Rates
1708
Crude Birth Rate, 2001
Demographic Particulars (Census, 2001)
Total Fertility Rate, 2001
Infant Mortality Rate, 2001
Population
Key RCH Indicators from District Level
Household Survey, 2007-08 (%)
Persons 3248701
Males 1652661
Females 1596040
Rural (%)
90.8
Urban (%)
9.2
Scheduled Castes (%)
12.0
Scheduled Tribes (%)
0.2
Elderly population (60+ years) (%)
8.0
Girls marrying below 18 years
Birth order 3 and above
Current use of any FP Method
Total unmet need
Mothers who had at least 3 ANC visits during
the last pregnancy
Young people (10-24 years) (%)
30.2
Adolescents (10-19 years) (%)
23.2
Institutional delivery
Decadal Growth Rate, 1991-2001 (%)
Population density (per sq. km)
Sex Ratio (females per 1000 males)
1991
2001
Child Sex Ratio (0-6 years) (girls per 1000 boys)
26.3
Children with full immunization
1230
Medical/Health Infrastructures/
Institutions
963
966
CHCs
PHCs
1991
960
2001
949
Sub-Centres
Literacy rate (7+)
Persons
81.8
Males
67.3
Females
35.8
Total work participation rate
26.5
Female work participation rate
10.4
12.6
86.9
7.1
32.6
4.7
56
31.0
51.5
29.1
43.7
22.7
22.4
65.1
3
60
413
| 99

11.8 Page 108

▲back to top


Population Foundation of India
district
sheikhpINDuIA ra
ShowingBIHCADR Blocks
DISTRICT SHEIKHPURA
KILOMETRES
5
0
5
NALAN
T
BARBIGHA
DA
D
I
S
T
R
BARBIGHA
GHAT KUSUMBHA
SHEIKHPURA
GHAT KUSUMBHA
SHEIKHOPUR
SARAI
SHEIKHOPUR
SARAI
SHEIKHPURA
ARIARI
CHEWARA
N
AWADA
ARIARI
CHEWARA
DIST RICT JAMUI
BOUNDARY , DISTRICT
,,
C.D. BLOCK
HEADQUARTERS: DISTRICT, C.D. BLOCK
100 |

11.9 Page 109

▲back to top


Population, Health & Social Development in Bihar, Jharkhand, Orissa and West bengal
DISTRICT SHEIKHPURA
General Information
Area (sq. kms.)
Percent to total state’s area
C D blocks
Towns
No. of villages
Demographic Particulars (Census, 2001)
Population
Persons
Males
Females
Rural (%)
Urban (%)
Scheduled Castes (%)
Scheduled Tribes (%)
Elderly population (60+ years) (%)
Young people (10-24 years) (%)
Adolescents (10-19 years) (%)
Decadal Growth Rate, 1991-2001 (%)
Population density (per sq. km)
Sex Ratio (females per 1000 males)
1991
2001
Child Sex Ratio (0-6 years) (girls per 1000 boys)
1991
2001
Literacy rate (7+)
Persons
Males
Females
Total work participation rate
Female work participation rate
Household Amenities, (%), Census 2001
689.0
Households with kutchha houses
0.7
Households with safe drinking water
6
Households with electricity connection
2 Vital Rates
315
Crude Birth Rate, 2001
Total Fertility Rate, 2001
Infant Mortality Rate, 2001
Key RCH Indicators from District Level
Household Survey, 2007-08 (%)
525502
273992
251510
84.5
Girls marrying below 18 years
Birth order 3 and above
Current use of any FP Method
Total unmet need
15.5
Mothers who had at least 3 ANC visits during
the last pregnancy
19.7
0.0
6.7
29.9
Institutional delivery
22.0
25.0
Children with full immunization
793
Medical/Health Infrastructures/
Institutions
896
918
965
955
CHCs
PHCs
Sub-Centres
48.6
61.9
33.9
37.0
25.0
11.5
55.4
10.1
34.3
4.7
62
53.5
52.1
26.7
39.0
43.2
41.6
38.3
1
21
74
| 101

11.10 Page 110

▲back to top


Population Foundation of India
district
sheohar
Showing CD Blocks
INDIA
BIHAR
DISTRICT SHEOHAR
KILOMETRES
5
0
5
D
I
S
T
PURNAHIYA
PURNAHIYA
SHEOHAR
PIPRARHI
DUMRI KATSARI
SHEOHAR
PIPRARHI
DUMRI KATSARI
TARIANI CHOWK
TARIANI CHOWK
BOUNDARY , DISTRICT
,,
C.D. BLOCK
HEADQUARTERS: DISTRICT, C.D. BLOCK
102 |
DISTRICT MUZAFFARPUR

12 Pages 111-120

▲back to top


12.1 Page 111

▲back to top


Population, Health & Social Development in Bihar, Jharkhand, Orissa and West bengal
DISTRICT SHEOHAR
General Information
Household Amenities, (%), Census 2001
Area (sq. kms.)
443.0
Households with kutchha houses
60.9
Percent to total state’s area
0.5
Households with safe drinking water
98.1
C D Blocks
5
Households with electricity connection
3.1
Towns
1 Vital Rates
No. of Villages
213
Crude Birth Rate, 2001
35.8
Total Fertility Rate, 2001
5.1
Demographic Particulars (Census, 2001)
Infant Mortality Rate, 2001
72
Population
Key RCH Indicators from District Level
Household Survey, 2007-08 (%)
Persons 515961
Girls marrying below 18 years
54.8
Males 273680
Birth order 3 and above
57.0
Females 242281
Current use of any FP Method
27.4
Rural (%)
95.9
Total unmet need
42.6
Urban (%)
4.1
Mothers who had at least 3 ANC visits during
the last pregnancy
18.9
Scheduled Castes (%)
14.4
Scheduled Tribes (%)
0.0
Elderly population (60+ years) (%)
6.9
Young people (10-24 years) (%)
28.2
Institutional delivery
11.9
Adolescents (10-19 years) (%)
20.7
Decadal Growth Rate, 1991-2001 (%)
36.6
Children with full immunization
28.3
Population density (per sq. km)
1165
Sex Ratio (females per 1000 males)
Medical/Health Infrastructures/
Institutions
1991
876
2001
885
CHCs
1
Child Sex Ratio (0-6 years) (girls per 1000 boys)
PHCs
10
1991
946
Sub-Centres
34
2001
916
Literacy rate (7+)
Persons
35.3
Males
45.3
Females
23.9
Total work participation rate
31.2
Female work participation rate
9.8
| 103

12.2 Page 112

▲back to top


Population Foundation of India
sitamarhi BINIHDdAIARi s t r i c t
DISTRICINTDSIAITAMARHI
KILBOIMHETARERS Showing CD BlPocks
5
05
DISTRICT SITAMARHI
KILOMETRES
5
0 5E
P SONBARSA
PARIHAR
N
N
BAIRGANIA
BAIRGANIA
BAIRGANIA
BAIRGANIA
E
MAJORGANJ
MAJORGANJ
SONBARSA
SONBARSA
PARIHAR
MAJORGANJ
SUPPI
MAJORGANJ
BATHNAHA
SONBARSA
PARIHAR
SUPPI
SUPPI
SUPPI
RIGA BATHNAHA
RIRGAI G A
RIGA
RIGA
RIGA
DUMRA
BATHNAHA
BATHNAHA
PARSAUNI
SIDTUAMRMAARHI U.A.
PARSAUNI
PARSAUNI
BELSAND
PARSAUNI
SITAMARHI U.A.
RUNISAIDPUR
PARIHAR
SURSAND
SURSAND
BAJPATTI
BAJPATTI
BAJPATTI
BAJPATTI
NANPUR
L
SURSAND
CHORAUT
L
SURSAND
CHORAUT
CHORAUT
CHORAUT
PUPRI CHORAUT
PPUUPPRRI I
CHORAUT
CHORAUT
BELSAND
BELSAND
RUNISAIDPUR
NANPUR
NANPUR
PUPRI
CHORAUT
BELSAND
RUNISAIDPUR
NANPUR
BOKHRA
RUNISAIDPUR
BOKHRA
BOKHRA
RICT
RICT
M U Z A F F A R P U R BOKHRA
MUZAFFARPUR
BOUNDARY, INTERNATIONAL
,,
DISTRICT
,,
C.D. BLOCK
HEADQUARTERS: DISTRICT, C.D. BLOCK
BOUNDARY, INTERNATIONAL
,,
DISTRICT
,,
C.D. BLOCK
HEADQUARTERS: DISTRICT, C.D. BLOCK
104 |

12.3 Page 113

▲back to top


Population, Health & Social Development in Bihar, Jharkhand, Orissa and West bengal
DISTRICT SITAMARHI
General Information
Area (sq. kms.)
Percent to total state’s area
C D blocks
Towns
No. of villages
Demographic Particulars (Census, 2001)
Population
Persons
Males
Females
Rural (%)
Urban (%)
Scheduled Castes (%)
Scheduled Tribes (%)
Elderly population (60+ years) (%)
Young people (10-24 years) (%)
Adolescents (10-19 years) (%)
Decadal Growth Rate, 1991-2001 (%)
Population density (per sq. km)
Sex Ratio (females per 1000 males)
1991
2001
Child Sex Ratio (0-6 years) (girls per 1000 boys)
1991
2001
Literacy rate (7+)
Persons
Males
Females
Household Amenities, (%), Census 2001
2200.0
Households with kutchha houses
2.3
Households with safe drinking water
17
Households with electricity connection
5 Vital Rates
945
Crude Birth Rate, 2001
Total Fertility Rate, 2001
Infant Mortality Rate, 2001
Key RCH Indicators from District Level
Household Survey, 2007-08 (%)
2682720
Girls marrying below 18 years
1417611
Birth order 3 and above
1265109
Current use of any FP Method
94.3
Total unmet need
5.7
Mothers who had at least 3 ANC visits during
the last pregnancy
11.8
0.1
6.5
28.4
Institutional delivery
20.8
33.2
Children with full immunization
1219
Medical/Health Infrastructures/
Institutions
884
892
CHCs
PHCs
921
Sub-Centres
924
Information on HIV/AIDS
38.5
49.4
HIV+ among ANC clinics (%)
26.1
HIV+ among STD clinics (%)
Total work participation rate
31.9
Number of Integrated Counseling and Testing
Centres (ICTC formerly VCTC)
Female work participation rate
11.2
Number of Prevention of Parent to Child
Transmission Centres (PPTCTC)
Number of Anti Retroviral Therapy (ART) Centres
34.1
98.0
5.4
36.3
5.1
74
44.4
56.3
25.3
41.2
22.9
16.4
39.1
1
51
213
0.50
2.01
12
0
| 105

12.4 Page 114

▲back to top


Population Foundation of India
district
siwan
Showing
CD Blocks
GUTHANI
GUTHANI
R
DIS
NAUTAN
NAUTAN
MAIRWA
MAIRWA
ZIRADEI
DARAULI
ZIRADEI
TRICT
BARHARIA
SIWAN
BARHARIA
INDIA
BIHAR
DISTRICT SIWAN
KILOMETRES
G
5
0
5
O
P
A
L
G
GORIAKOTHI
A
SIWAN
HUSSAINGANJ
HUSSAINGANJ
PACHRUKHI
PACHRUKHI
GORIAKOTHI
LAKRI
NABIGANJ
BASANTPUR
LAKRI
NABIGANJ
MAHARAJGANJ
BASANTPUR
MAHARAJGANJ
BHAGWANPUR HAT
DARAULI
P
ANDAR
ANDAR
HASANPURA
RAGHUNATHPUR
HASANPURA
DARAUNDHA
DARAUNDHA
RAGHUNATHPUR
SISWAN
R
I
R
T
A
SISWAN
D
E
S
H
BHAGWANPUR HAT
A
S
T
C
BOUNDARY , STATE
,,
DISTRICT
,,
C.D. BLOCK
HEADQUARTERS: DISTRICT, C.D. BLOCK
106 |

12.5 Page 115

▲back to top


Population, Health & Social Development in Bihar, Jharkhand, Orissa and West bengal
DISTRICT SIWAN
General Information
Household Amenities, (%), Census 2001
Area (sq. kms.)
2219.0
Households with kutchha houses
Percent to total state’s area
2.4
Households with safe drinking water
C D blocks
19
Households with electricity connection
Towns
3 Vital Rates
No. of villages
1545
Crude Birth Rate, 2001
Total Fertility Rate, 2001
Demographic Particulars (Census, 2001)
Infant Mortality Rate, 2001
Population
Key RCH Indicators from District Level
Household Survey, 2007-08 (%)
Persons 2714349
Girls marrying below 18 years
Males 1336283
Birth order 3 and above
Females 1378066
Current use of any FP Method
Rural (%)
94.5
Total unmet need
Urban (%)
5.5
Mothers who had at least 3 ANC visits during
the last pregnancy
Scheduled Castes (%)
11.4
Scheduled Tribes (%)
0.5
Elderly population (60+ years) (%)
8.0
Young people (10-24 years) (%)
30.6
Institutional delivery
Adolescents (10-19 years)(%)
23.7
Decadal Growth Rate, 1991-2001 (%)
25.0
Children with full immunization
Population density (per sq. km)
Sex Ratio (females per 1000 males)
1991
1223
Medical/Health Infrastructures/
Institutions
1017
2001
1031
CHCs
Child Sex Ratio (0-6 years) (girls per 1000 boys)
PHCs
1991
963
Sub-Centres
2001
934
Literacy rate (7+)
Information on HIV/AIDS
Persons
51.6
Males
67.3
HIV+ among ANC clinics (%)
Females
36.9
HIV+ among STD clinics (%)
Total work participation rate
26.9
Number of Integrated Counseling and Testing
Centres (ICTC formerly VCTC)
Female work participation rate
12.8
Number of Anti Retroviral Therapy (ART) Centres
16.3
96.4
5.2
32.9
4.6
48
27.6
46.0
24.0
39.7
33.4
33.5
52.4
2
49
370
-
4.76
0
0
| 107

12.6 Page 116

▲back to top


Population Foundation of India
district
supaul
Showing
CD Blocks
R
UPAUL
ES
5
A
B
U
LI
N
I
N
SARAIGARH
BHAPTIAHI
INDIA
BIHAR
DISTRICT SUPAUL
L
KILOMETRES
L
A
5
0
5A
P
P
E
E
BASANTPUR
N
BASANTPUR
NIRMALI
I
N
BAASANTPUR
NIRMALI
BASANTPUR
SARAIGARH
BHAPTIAHI
A
B
U
R A GHH O P U R
D
NIRMALI
M
PRATAPGANJ
MARAUNA
T
RAGHOPUR
PRATAPGANJ
CHHATAPUR
SARAIGARH
BHAPTIAHI
RAGHOPUR
SARAIGARH
BHAPTIAHI
KISHANPUR
RAGHOPUR
PRATAPGANJ
PRATAPGANJ
CHHATAPUR
KISHANPUR
KISHANPUR
PIPRA
KISHANPUR
MARAUNAP I P R A
TRIBENIGANJ
CHHATAPUR
TRIBENIGANJ
CHHATAPUR
PIPRA
TRIBENIGANJ
PIPRA
TRSIBUEPNAIUGLANJ
L
SUPAUL
L
A
D
I
S
T
R
TI
R
C
IC
T
TS
A
M
HA
R
A
SA
D
H
D
EI
PS
T
U
R
R
IC
A
T
MA
BOUNDARY, INTERNATIONAL
,,
DISTRICT
D
H
E
P
U
R
A
,,
C.D. BLOCK
HEADQUARTERS: DISTRICT, C.D. BLOCK
BOUNDARY, INTERNATIONAL
,,
DISTRICT
,,
C.D. BLOCK
HEADQUARTERS: DISTRICT, C.D. BL
108 |

12.7 Page 117

▲back to top


Population, Health & Social Development in Bihar, Jharkhand, Orissa and West bengal
DISTRICT SUPAUL
General Information
Household Amenities, (%), Census 2001
Area (sq. kms.)
2410.0
Households with kutchha houses
Percent to total state’s area
2.6
Households with safe drinking water
C D blocks
11
Households with electricity connection
Towns
3 Vital Rates
No. of villages
591
Crude Birth Rate, 2001
Total Fertility Rate, 2001
Demographic Particulars (Census, 2001)
Infant Mortality Rate, 2001
Population
Key RCH Indicators from District Level
Household Survey, 2007-08 (%)
Persons 1732578
Girls marrying below 18 years
Males 902207
Birth order 3 and above
Females 830371
Current use of any FP Method
Rural (%)
94.9
Total unmet need
Urban (%)
5.1
Mothers who had at least 3 ANC visits during
the last pregnancy
Scheduled Castes (%)
14.8
Scheduled Tribes (%)
0.3
Elderly population (60+ years) (%)
5.8
Young people (10-24 years) (%)
28.5
Institutional delivery
Adolescents (10-19 years) (%)
20.9
Decadal Growth Rate, 1991-2001 (%)
29.0
Children with full immunization
Population density (per sq. km)
719
Sex Ratio (females per 1000 males)
Medical/Health Infrastructures/Institutions
1991
904
2001
920
CHCs
Child Sex Ratio (0-6 years) (girls per 1000 boys)
PHCs
1991
941
Sub-Centres
2001
925
Literacy rate (7+)
Information on HIV/AIDS
Persons
37.3
Males
52.4
Females
20.8
HIV+ among ANC clinics (%)
HIV+ among STD clinics (%)
Total work participation rate
42.0
Number of Integrated Counseling and Testing
Centres (ICTC formerly VCTC)
Female work participation rate
33.0
Number of Anti Retroviral Therapy (ART) Centres
78.3
97.4
4.7
36.2
4.7
57
44.2
51.5
43.1
29.8
21.2
23.2
39.5
1
37
178
-
0.40
0
0
| 109

12.8 Page 118

▲back to top


Population Foundation of India
district
vaishali
Showing CD Blocks
INDIA
BIHAR
DISTRICT VAISHALI
D
I
S
T
R
I
C
T
VAISHALI
VAISHALI
PATERHI
BELSAR
PATERHI
BELSAR
KILOMETRES
5
0
5
M
U
Z
A
F
F
A
R
P
U
R
GORAUL
CHEHRA
KALAN
LALGANJ
CHEHRA
KALAN
BHAGWANPUR
GORAUL
MAHUA
PATEPUR
LALGANJ
BHAGWANPUR
G O R A U L MAHUA
PATEPUR
HAJIPUR
RAJAPAKAR
RAJAPAKAR
HAJIPUR
BIDUPUR
BIDUPUR
RAGHOPUR
RAGHOPUR
JANDAHA
DESRI
DESRI
JANDAHA
SAHDAI
BUZURG
MAHNAR
SAHDAI
BUZURG
MAHNAR
I
CT
A
P A TN
BOUNDARY , DISTRICT
,,
C.D. BLOCK
HEADQUARTERS: DISTRICT, C.D. BLOCK
110 |

12.9 Page 119

▲back to top


Population, Health & Social Development in Bihar, Jharkhand, Orissa and West bengal
DISTRICT VAISHALI
General Information
Household Amenities, (%), Census 2001
Area (sq. kms.)
2036.0
Households with kutchha houses
Percent to total state’s area
2.2
Households with safe drinking water
C D blocks
16
Households with electricity connection
Towns
3 Vital Rates
No. of villages
1889
Crude Birth Rate, 2001
Total Fertility Rate, 2001
Demographic Particulars (Census, 2001)
Population
Persons 2718421
Infant Mortality Rate, 2001
Key RCH Indicators from District Level
Household Survey, 2007-08 (%)
Girls marrying below 18 years
Males 1415603
Birth order 3 and above
Females 1302818
Current use of any FP Method
Rural (%)
Urban (%)
Scheduled Castes (%)
93.1
Total unmet need
6.9
Mothers who had at least 3 ANC visits during
the last pregnancy
20.7
Scheduled Tribes (%)
0.1
Elderly population (60+ years) (%)
7.3
Young people (10-24 years) (%)
29.6
Institutional delivery
Adolescents (10-19 years)(%)
22.1
Decadal Growth Rate, 1991-2001 (%)
26.7
Children with full immunization
Population density (per sq. km)
Sex Ratio (females per 1000 males)
1991
1335
Medical/Health Infrastructures/
Institutions
921
2001
920
CHCs
Child Sex Ratio (0-6 years) (girls per 1000 boys)
PHCs
1991
946
Sub-Centres
2001
937
Literacy rate (7+)
Information on HIV/AIDS
Persons
50.5
Males
63.2
HIV+ among ANC clinics (%)
Females
Total work participation rate
Female work participation rate
36.6
HIV+ among STD clinics (%)
28.8
Number of Integrated Counseling and Testing
Centres (ICTC formerly VCTC)
10.9
Number of Anti Retroviral Therapy (ART) Centres
26.8
77.7
9.0
31.9
4.6
48
41.2
46.9
43.6
32.7
16.0
28.2
53.3
2
47
336
0.50
-
0
0
| 111

12.10 Page 120

▲back to top


JHARKHAND
at a glance

13 Pages 121-130

▲back to top


13.1 Page 121

▲back to top


Population Foundation of India
JHARKHAND
Showing Districts
INDIA
JHARKHAND
ADMINISTRATIVE DIVISIONS 2001
B
GARHWA
I
PALAMU
CHATRA
LOHARDAGA
H
KODARMA
A
GIRIDIH
DEOGHAR
HAZARIBAG
BOKARO
DHANBAD
RANCHI
R
GODDA
SAHIBGANJ
PAKAUR
DUMKA
G
N
E
GUMLA
PASHCHIMI
SINGHBHUM
PURBA
SINGHBHUM
O
... ...
.. ...
Map not to scale
R
I
A
S
S
BOUNDARY: STATE
,, DISTRICT
114 |

13.2 Page 122

▲back to top


Population, Health & Social Development in Bihar, Jharkhand, Orissa and West bengal
STATE PROFILE
JHARKHAND
Key Demographic, Health and RCH Indicators at a glance
General Information
Area (sq. kms.)
No. of Districts
No. of CD Blocks
No. of total villages
No. of towns
Demographic Particulars (Census, 2001)
Population
Persons
Males
Females
Rural (%)
Urban (%)
Scheduled Castes (%)
Scheduled Tribes (%)
Elderly population (60+ years) (%)
Young people (10-24 years) (%)
Adolescents(10-19 years) (%)
Decadal Growth Rate, 1991-2001 (%)
Population density (per sq. km)
Sex Ratio (females per 1000 males)
Child Sex Ratio (0-6 years) (girls per 1000 boys)
Literacy rate
Persons
Males
Females
Work participation rate
Female work participation rate
Proportion of people living below poverty line, 2004-05
Per capita net state domestic product at current prices in rupees, 2005-06
Human Development Index (HDI), 2001 (among 28 states)
Value
Rank
Social Development Index (SDI), 2001 (among 20 major states)
Rural
Value
Rank
Urban
Value
Rank
Household Amenities (%), Census 2001
Households with kutchha houses
Households with safe drinking water
Households with electricity connection
Vital Indices
Crude Birth Rate (CBR), 2008, SRS
Total Fertility Rate (TFR), 2007, SRS
79714
18
210
32615
270
26945829
13885037
13060792
77.8
22.2
11.8
26.3
5.9
30.4
22.4
23.4
338
941
965
53.6
67.3
38.9
37.5
26.4
34.8
14990
0.525
21
16.22
19
33.96
17
11.0
42.6
24.3
25.8
3.2
| 115

13.3 Page 123

▲back to top


Population Foundation of India
Age Specific Fertility Rates, 2007, SRS
15-19 years
20-24 years
25-29 years
30-34 years
35-39 years
40-44 years
45-49 years
General Fertility Rate, 2007,SRS
Gross Reproduction Rate, 2007, SRS
Life Expectancy at Birth, 2000-2004, SRS
Crude Death Rate (CDR), 2008, SRS
Maternal Mortality Ratio (MMR), 2004-06, RGI
Child Mortality Rate (CMR), 2007, SRS
Infant Mortality Rate (IMR), 2008, SRS
Neo-natal mortality rate, 2007, SRS
Early neo-natal mortality rate, 2007, SRS
Late neo-natal mortality rate, 2007, SRS
Post neo-natal mortality rate, 2007, SRS
Peri-natal mortality rate, 2007, SRS
Still birth rate, 2007, SRS
Key RCH and Nutrition Indicators (%)
Girls marrying below 18 years, DLHS, 2007-08
Women(20-24) reporting birth of order 2 & above, DLHS, 2007-08
Current use of any FP method, DLHS, 2007-08
Total unmet need, DLHS, 2007-08
Mothers who received any antenatal check-up, DLHS, 2007-08
Mothers who had three or more ANC, DLHS, 2007-08
Mothers who consumed IFA tablets, DLHS, 2007-08
Safe delivery, DLHS, 2007-08
Institutional delivery, DLHS, 2007-08
Children with full immunization (12-23 months), DLHS, 2007-08
Children under 3 years who are underweight, NFHS-3, 2005-06
Children under 3 years who are stunted, NFHS-3, 2005-06
Children under 3 years who are wasted, NFHS-3, 2005-06
Children age 6-59 months who are anaemic, NFHS-3, 2005-06
Ever married women age 15-49 years who are anaemic, NFHS-3, 2005-06
Medical/Health Infrastructures/Institutions
Community Health Centres (CHCs)
Primary Health Centres (PHCs)
Sub Centres (SCs)
Information on HIV/AIDS (%)
Women who have heard of HIV/AIDS, NFHS-3, 2005-06
Men who have heard of HIV/AIDS, NFHS-3, 2005-06
Women who know that HIV/AIDS can be prevented by using condoms, NFHS-3, 2005-06
Men who know that HIV/AIDS can be prevented by using condoms, NFHS-3, 2005-06
HIV+ among ANC clinics (%)
HIV+ among STD clinics (%)
Number of Integrated Counseling and Testing Centres (ICTC formerly VCTC)
Number of Prevention of Parent To Child Transmission Centres (PPTCTC)
Number of Anti Retroviral Therapy (ART) Centres
116 |
58.7
233.3
179.6
95.1
44.6
24.6
7.7
106.4
1.6
NA
7.1
312
14
46
28
24
4
20
25
1
36.0
51.4
34.9
34.7
55.9
30.5
19.1
25.0
17.8
54.1
56.5
49.8
32.3
70.3
69.5
194
330
3958
34.0
60.8
24.8
52.9
0.13
0.63
19
1
2

13.4 Page 124

▲back to top


districts
at a glance
| 117

13.5 Page 125

▲back to top


Population Foundation of India
district
GARHWA
Showing CD Blocks
SH
KHARAUNDHI
KHARAUNDHI
R
NAGAR - UNTARI
R
NAGAR - UNTARI
DHURKI
R
DHURKI
B I HAR
KANDI
R
BHAWANATHPUR
KANDI
SINDURIA
R
MAJHIAON
R
MAJHIAON
INDIA
JHARKHAND
DISTRICT GARHWA
KILOMETRES
5
0
5
RAMNA
RAMNA
R
R MERAL
DANDAI
R
DANDAI
MERAL
RPGARHWA
GARHWA
R
CHINIA
CHINIA
R
RANKA
RANKA
RAMKANDA
R
RAMKANDA
BHANDARIA
R
BHANDARIA
BOUNDARY, STATE
,, DISTRICT
,, C. D. BLOCK
HEADQUARTERS: DISTRICT, C. D. BLOCK
PR
118 |

13.6 Page 126

▲back to top


Population, Health & Social Development in Bihar, Jharkhand, Orissa and West bengal
DISTRICT GARHWA
General Information
Household Amenities, (%), Census 2001
Area(sq. kms.)
4044.0
Households with kutchha houses
Percent to total state’s area
5.1
Households with safe drinking water
C D blocks
14
Households with electricity connection
Towns
2 Vital Rates
No. of villages
858
Crude Birth Rate, 2001
Total Fertility Rate, 2001
Demographic Particulars (Census, 2001)
Infant Mortality Rate, 2001
Population
Key RCH Indicators from District Level
Household Survey, 2007-08 (%)
Persons 1035464
Girls marrying below 18 years
Males 535332
Birth order 3 and above
Females 500132
Current use of any FP Method
Rural (%)
95.9
Total unmet need
Urban (%)
4.1
Mothers who had at least 3 ANC visits during
the last pregnancy
Scheduled Castes (%)
23.9
Scheduled Tribes (%)
15.4
Elderly population (60+ years) (%)
6.56
Young people (10-24 years) (%)
29.40
Institutional delivery
Adolescents(10-19 years) (%)
21.6
Decadal Growth Rate, 1991-2001 (%)
29.05
Children with full immunization
Population density (per sq. km)
256
Sex Ratio (females per 1000 males)
Medical/Health Infrastructures/
Institutions
1991
926
2001
934
CHCs
Child Sex Ratio (0-6 years) (girls per 1000 boys)
PHCs
1991
969
Sub-Centres
2001
962
Literacy rate (7+)
Persons
39.2
Males
54.3
Females
22.9
Total work participation rate
38.9
Female work participation rate
37.2
0.7
47.5
6.0
37.7
5.3
65
39.4
53.7
44.7
26.3
20.3
10.8
66.6
8
10
111
| 119

13.7 Page 127

▲back to top


Population Foundation of India
district
palamu
Showing
CD Blocks
R
HUSSAINABAD
HUSSAINABAD
BIH
R
HARIHARGANJ
HARIHARGANJ
IN D IA
JHARKHAND
DISTRICT PALAMU
KILOMETRES
5
0
5
PANDU
R
BISHRAMPUR
R
BISHRAMPUR
CHHATARPUR
R
CHHATARPUR
R
PATAN
PATAN
MANATU
R
MANATU
CHAINPUR
R
DALTONGANJ
RP
LESLIGANJ
R
LESLIGANJ
DALTONGANJ
PANKI
R
PANKI
DISTRICT C
CHAINPUR
BARWADIH
R
SATBARWA
R
MANIKA
R
MANIKA
BARWADIH
GARU
R
GARU
LATEHAR
BALUMATH
R
BALUMATH
LATEHAR
R
CHANDWA
R
CHANDWA
DISTR ICT LOHARDAGA
DISTRI
RH
MAHUADANR
MAHUADANR
R
BOUNDARY, STATE
,, DISTRICT
D
I
S
T
R
I
HEADQUARTERS:
,,
DISTRICT,
C.
C.
D.
D.
BLOCK
BLOCK
PR
120 |

13.8 Page 128

▲back to top


Population, Health & Social Development in Bihar, Jharkhand, Orissa and West bengal
DISTRICT PALAMU
General Information
Household Amenities, (%), Census 2001
Area (sq. kms.)
8705.0
Households with kutchha houses
Percent to total state’s area
10.9
Households with safe drinking water
C D blocks
19
Households with electricity connection
Towns
5 Vital Rates
No. of villages
2465
Crude Birth Rate, 2001
Total Fertility Rate, 2001
Demographic Particulars (Census, 2001)
Population
Persons 2098359
Infant Mortality Rate, 2001
Key RCH Indicators from District Level
Household Survey, 2007-08 (%)
Girls marrying below 18 years
Males 1084417
Birth order 3 and above
Females 1013942
Current use of any FP Method
Rural (%)
94.0
Total unmet need
Urban (%)
Scheduled Castes (%)
6.0
Mothers who had at least 3 ANC visits during
the last pregnancy
25.7
Scheduled Tribes (%)
18.7
Elderly population (60+ years) (%)
6.36
Young people (10-24 years) (%)
30.12
Institutional delivery
Adolescents(10-19 years) (%)
22.5
Decadal Growth Rate, 1991-2001 (%)
26.80
Children with full immunization
Population density (per sq. km)
Sex Ratio (females per 1000 males)
1991
241
Medical/Health Infrastructures/
Institutions
932
2001
935
CHCs
Child Sex Ratio (0-6 years) (girls per 1000 boys)
PHCs
1991
982
Sub-Centres
2001
967
Literacy rate (7+)
Information on HIV/AIDS
Persons
44.9
Males
58.9
HIV+ among ANC clinics (%)
Females
29.8
HIV+ among STD clinics (%)
Total work participation rate
Female work participation rate
37.8
Number of Integrated Counseling and testing
Centres (ICTC formerly VCTC)
35.6
Number of Anti Retroviral Therapy (ART) Centres
1.6
44.1
7.8
34.7
4.9
75
37.2
50.6
39.9
36.2
23.0
18.0
53.4
10
21
172
0
1
0
| 121

13.9 Page 129

▲back to top


Population Foundation of India
district
chatra
Showing
CD Blocks
INDIA
H
A
JHARKHAND
DISTRICT CHATRA
I
R
KILOMETRES
B
HUNTERGANJ
R
5
0
5
Part Of
Gaya District
PRATAPPUR
RPRATAPPUR
KUNDA
R
KUNDA
HUNTERGANJ
CHATRA
RP
CHATRA
ITKHORI
R
ITKHORI
GIDHAUR
R
GIDHAUR
LAWALAUNG
LAWALAUNG
R
SIMARIA
R
PATHALGORA
R
PATHALGORA
SIMARIA
I
C
T
P
A
L
AMU
TANDWA
TANDWA
R
ICT
R
BOUNDARY, STATE
,, DISTRICT
,, C. D. BLOCK
HEADQUARTERS: DISTRICT, C. D. BLOCK
PR
RDAISNTCRHI IC T
122 |

13.10 Page 130

▲back to top


Population, Health & Social Development in Bihar, Jharkhand, Orissa and West bengal
DISTRICT CHATRA
General Information
Household Amenities, (%), Census 2001
Area (sq. kms.) 3706.0
Households with kutchha houses
Percent to total state’s area
4.6
Households with safe drinking water
C D blocks
10
Households with electricity connection
Towns
1 Vital Rates
No. of villages 1343
Crude Birth Rate, 2001
Total Fertility Rate, 2001
Demographic Particulars (Census, 2001)
Infant Mortality Rate, 2001
Population
Key RCH Indicators from District Level
Household Survey, 2007-08 (%)
Persons 791434
Girls marrying below 18 years
Males 404067
Birth order 3 and above
Females 387367
Current use of any FP Method
Rural (%)
94.7
Total unmet need
Urban (%)
5.3
Mothers who had at least 3 ANC visits during
the last pregnancy
Scheduled Castes (%)
31.9
Scheduled Tribes (%)
3.8
Elderly population (60+ years) (%)
5.94
Young people (10-24 years) (%)
30.26
Institutional delivery
Adolescents(10-19 years)(%)
22.8
Decadal Growth Rate, 1991-2001 (%)
29.05
Children with full immunization
Population density (per sq. km)
Sex Ratio (females per 1000 males)
Medical/Health Infrastructures/
Institutions
1991
952
2001
959
CHCs
Child Sex Ratio (0-6 years) (girls per 1000 boys)
PHCs
1991 1,001
Sub-Centres
2001
975
Literacy rate (7+)
Persons
43.2
Males
55.6
Females
30.2
Total work participation rate
37.8
Female work participation rate
36.5
1.4
32.6
6.4
34.1
4.6
60
46.4
50.0
32.3
39.7
22.9
14.4
45.4
6
8
93
| 123

14 Pages 131-140

▲back to top


14.1 Page 131

▲back to top


Population Foundation of India
district
hazaribag
Showing CD Blocks
A
R
H
I
B
CHAUPARAN
R
CHAUPARAN
BARHI
R
INDIA
JHARKHAND
DISTRICT HAZARIBAG
DISTRICT
KILOMETRES
5
0
5
KODARMA
KEREDARI
R
KEREDARI
R
PADMA
PADMA
BARHI
KATKAMSANDI
R
KATKAMSANDI
ICHAK
ICHAK
R
HAZARIBAG
RP
HAZARIBAG
R CHURCHU
BARKAGAON
R
BARKAGAON
CHURCHU
MANDU
R
BARKATHA
BARKATHA
R
BISHUNGARH
R
BISHUNGARH
R
D
PATRATU
R
RAMGARH
I
S
T
RAMGARH
R
IC T
RANCHI
BOUNDARY, STATE
,, DISTRICT
,, C. D. BLOCK
HEADQUARTERS: DISTRICT, C. D. BLOCK
PR
GOLA
R
GOLA
*
* WEST BENGAL
124 |

14.2 Page 132

▲back to top


Population, Health & Social Development in Bihar, Jharkhand, Orissa and West bengal
DISTRICT HAZARIBAG
General Information
Area (sq. kms.)
Percent to total state’s area
C D blocks
Towns
No. of villages
Demographic Particulars (Census, 2001)
Population
Persons
Males
Females
Rural (%)
Urban (%)
Scheduled Castes (%)
Scheduled Tribes (%)
Elderly population (60+ years) (%)
Young people (10-24 years) (%)
Adolescents (10-19 years)(%)
Decadal Growth Rate, 1991-2001 (%)
Population density (per sq. km)
Sex Ratio (females per 1000 males)
1991
2001
Child Sex Ratio (0-6 years) (girls per 1000 boys)
1991
2001
Literacy rate (7+)
Persons
Males
Females
Total work participation rate
Female work participation rate
Household Amenities, (%), Census 2001
5965.0
Households with kutchha houses
7.5
Households with safe drinking water
15
Households with electricity connection
23 Vital Rates
1543
Crude Birth Rate, 2001
Total Fertility Rate, 2001
Infant Mortality Rate, 2001
Key RCH Indicators from District Level
Household Survey, 2007-08 (%)
2277475
Girls marrying below 18 years
1167793
Birth order 3 and above
1109682
Current use of any FP Method
76.8
Total unmet need
23.2
Mothers who had at least 3 ANC visits
during the last pregnancy
15.0
11.8
5.55
31.93
Institutional delivery
23.9
24.02
Children with full immunization
382
Medical/Health Infrastructures/
Institutions
914
950
CHCs
PHCs
978
Sub-Centres
966
Information on HIV/AIDS
57.7
71.8
HIV+ among ANC clinics (%)
42.8
HIV+ among STD clinics (%)
34.7
Number of Integrated Counseling and
testing Centres (ICTC formerly VCTC)
33.0
Number of Anti Retroviral Therapy (ART)
Centres
0.4
26.4
34.7
30.0
4.1
46
33.6
37.6
47.1
26.9
38.7
25.8
68.9
14
19
203
1
1
0
| 125

14.3 Page 133

▲back to top


Population Foundation of India
district
kodarma
Showing CD Blocks
INDIA
JHARKHAND
DISTRICT KODARMA
LIKOMETRES
5
0
5
SATGAWAN
R
SATGAWAN
KODARMA
RP
KODARMA
C
T
R JAINAGAR
JAINAGAR
MARKACHO
MARKACHO
R
H
A
Z
A
R
I
B
A
G
BOUNDARY, STATE
,, DISTRICT
,, C. D. BLOCK
HEADQUARTERS: DISTRICT, C. D. BLOCK
PR
126 |

14.4 Page 134

▲back to top


Population, Health & Social Development in Bihar, Jharkhand, Orissa and West bengal
DISTRICT KODARMA
General Information
Household Amenities, (%), Census 2001
Area (sq. kms.) 1494.0
Households with kutchha houses
Percent to total state’s area
1.9
Households with safe drinking water
C D blocks
4
Households with electricity connection
Towns
2 Vital Rates
No. of villages
526
Crude Birth Rate, 2001
Total Fertility Rate, 2001
Demographic Particulars (Census, 2001)
Infant Mortality Rate, 2001
Population
Key RCH Indicators from District Level
Household Survey, 2007-08 (%)
Persons 499403
Girls marrying below 18 years
Males 249549
Birth order 3 and above
Females 249854
Current use of any FP Method
Rural (%)
82.6
Total unmet need
Urban (%)
17.4
Mothers who had at least 3 ANC visits during
the last pregnancy
Scheduled Castes (%)
14.4
Scheduled Tribes (%)
0.8
Elderly population (60+ years) (%)
6.60
Young people (10-24 years) (%)
29.96
Institutional delivery
Adolescents(10-19 years)(%)
22.3
Decadal Growth Rate, 1991-2001 (%)
26.32
Children with full immunization
Population density (per sq. km)
334
Sex Ratio (females per 1000 males)
Medical/Health Infrastructures/Institutions
1991
986
2001 1001
CHCs
Child Sex Ratio (0-6 years) (girls per 1000 boys)
PHCs
1991
989
Sub-Centres
2001
975
Literacy rate (7+)
Information on HIV/AIDS
Persons
52.2
Males
70.94
HIV+ among ANC clinics (%)
Females
33.61
HIV+ among STD clinics (%)
Total work participation rate
35.0
Number of Integrated Counseling and testing
Centres (ICTC formerly VCTC)
Female work participation rate
35.5
Number of Anti Retroviral Therapy (ART) Centres
0.7
21.0
21.7
33.1
4.5
46
55.9
51.6
30.7
43.8
32.9
27.1
46.9
4
5
65
0
-
1
0
| 127

14.5 Page 135

▲back to top


Population Foundation of India
district
giridih
Showing
CD Blocks
GAWAN
R
GAWAN
TISRI
TISRI
R
H
DEORI
R DEORI
INDIA
JHARKHAND
DISTRICT GIRIDIH
KILOMETRES
5
0
5
A
G
A
IB
R
DHANWAR
R
DHANWAR
JAMUA
R
JAMUA
BIRNI
R
BIRNI
BENGABAD
R
BENGABAD
BAGODAR
GIRIDIH
PR
GIRIDIH
R
GANDE
R BAGODAR
DUMRI
R
DUMRI
PIRTANR
R
PIRTANR
GANDE
DIST RIC
DIST RICT BOKARO
D IS TRICT DHA
BOUNDARY, STATE
,, DISTRICT
,, C. D. BLOCK
HEADQUARTERS: DISTRICT, C. D. BLOCK
PR
128 |

14.6 Page 136

▲back to top


Population, Health & Social Development in Bihar, Jharkhand, Orissa and West bengal
DISTRICT GIRIDIH
General Information
Household Amenities, (%), Census 2001
Area (sq. kms.)
4919.0
Households with kutchha houses
Percent to total state’s area
6.2
Households with safe drinking water
C D blocks
12
Households with electricity connection
Towns
4 Vital Rates
No. of villages
2532
Crude Birth Rate, 2001
Total Fertility Rate, 2001
Demographic Particulars (Census, 2001)
Infant Mortality Rate, 2001
Population
Key RCH Indicators from District Level
Household Survey, 2007-08 (%)
Persons 1904430
Girls marrying below 18 years
Males 960679
Birth order 3 and above
Females 943751
Current use of any FP Method
Rural (%)
93.6
Total unmet need
Urban (%)
6.4
Mothers who had at least 3 ANC visits during
the last pregnancy
Scheduled Castes (%)
13.0
Scheduled Tribes (%)
9.7
Elderly population (60+ years) (%)
5.96
Young people (10-24 years) (%)
29.39
Institutional delivery
Adolescents(10-19 years)(%)
21.7
Decadal Growth Rate, 1991-2001 (%)
27.09
Children with full immunization
Population density (per sq. km)
Sex Ratio (females per 1000 males)
1991
387
Medical/Health Infrastructures/
Institutions
966
2001
982
CHCs
Child Sex Ratio (0-6 years) (girls per 1000 boys)
PHCs
1991
993
Sub-Centres
2001
978
Literacy rate (7+)
Information on HIV/AIDS
Persons
44.5
Males
62.09
HIV+ among ANC clinics (%)
Females
26.62
HIV+ among STD clinics (%)
Total work participation rate
33.8
Number of Integrated Counseling and testing
Centres (ICTC formerly VCTC)
Female work participation rate
32.0
Number of Anti Retroviral Therapy (ART) Centres
0.6
13.8
9.6
35.8
4.7
56
50.3
41.7
24.1
43.9
24.9
16.6
21.6
12
15
180
-
1.78
1
0
| 129

14.7 Page 137

▲back to top


Population Foundation of India
district
deoghar
Showing CD Blocks
INDIA
JHARKHAND
DISTRICT DEOGHAR
A
H
R
KILOMETRES
5
0
5
JASIDIH
RP DEOGHAR
DEVIPUR
R
DEVIPUR
MOHANPUR
R
MOHANPUR
SARWAN
R
SARWAN
MADHUPUR
MADHUPUR
R
KARON
R
KARON
R
SARATH
R
PALOJORI
SARATH
PALOJORI
BOUNDARY, STATE
,, DISTRICT
,, C. D. BLOCK
HEADQUARTERS: DISTRICT, C. D. BLOCK
PR
R
D
I
S
T
130 |

14.8 Page 138

▲back to top


Population, Health & Social Development in Bihar, Jharkhand, Orissa and West bengal
DISTRICT DEOGHAR
General Information
Household Amenities, (%), Census 2001
Area (sq. kms.)
2479.0
Households with kutchha houses
Percent to total state’s area
3.1
Households with safe drinking water
C D blocks
8
Households with electricity connection
Towns
3 Vital Rates
No. of villages
2356
Crude Birth Rate, 2001
Total Fertility Rate, 2001
Demographic Particulars (Census, 2001)
Infant Mortality Rate, 2001
Population
Key RCH Indicators from District Level
Household Survey, 2007-08 (%)
Persons 1165390
Girls marrying below 18 years
Males 608878
Birth order 3 and above
Females 556512
Current use of any FP Method
Rural (%)
86.3
Total unmet need
Urban (%)
13.7
Mothers who had at least 3 ANC visits during
the last pregnancy
Scheduled Castes (%)
12.6
Scheduled Tribes (%)
12.2
Elderly population (60+ years) (%)
6.24
Young people (10-24 years) (%)
29.85
Institutional delivery
Adolescents(10-19 years) (%)
21.9
Decadal Growth Rate, 1991-2001 (%)
24.46
Children with full immunization
Population density (per sq. km)
470
Sex Ratio (females per 1000 males)
Medical/Health Infrastructures/Institutions
1991
911
2001
914
CHCs
Child Sex Ratio (0-6 years) (girls per 1000 boys)
PHCs
1991
987
Sub-Centres
2001
973
Literacy rate (7+)
Information on HIV/AIDS
Persons
50.1
Males
66.38
HIV+ among ANC clinics (%)
Females
31.99
HIV+ among STD clinics (%)
Total work participation rate
37.1
Number of Integrated Counseling and testing
Centres (ICTC formerly VCTC)
Female work participation rate
30.6
Number of Anti Retroviral Therapy (ART) Centres
19.0
34.8
16.9
33.2
4.5
57
55.2
42.2
37.4
31.2
27.2
16.2
35.7
8
5
181
0
0
2
0
| 131

14.9 Page 139

▲back to top


Population Foundation of India
district
godda
Showing
CD Blocks
INDIA
JHARKHAND
DISTRICT GODDA
KILOMETRES
5
0
5
MEHERMA
R
MEHERMA
THAKURGANGTI
R THAKURGANGTI
MAHAGAMA
R
MAHAGAMA
R
BOARIJOR
BOARIJOR
PATHARGAMA
R
PATHARGAMA
GODDA
RP
GODDA
POREYAHAT
POREYAHAT
R
SUNDARPAHARI
R
SUNDARPAHARI
DISTRICT
DUMKA
DIS
BOUNDARY, STATE
,, DISTRICT
,, C. D. BLOCK
HEADQUARTERS: DISTRICT, C. D. BLOCK
PR
132 |

14.10 Page 140

▲back to top


Population, Health & Social Development in Bihar, Jharkhand, Orissa and West bengal
DISTRICT GODDA
General Information
Household Amenities, (%), Census 2001
Area (sq. kms.)
2110.0
Households with kutchha houses
Percent to total state’s area
2.6
Households with safe drinking water
C D blocks
8
Households with electricity connection
Towns
1 Vital Rates
No. of villages
1633
Crude Birth Rate, 2001
Total Fertility Rate, 2001
Demographic Particulars (Census, 2001)
Infant Mortality Rate, 2001
Population
Key RCH Indicators from District Level
Household Survey, 2007-08 (%)
Persons 1047939
Girls marrying below 18 years
Males 544043
Birth order 3 and above
Females 503896
Current use of any FP Method
Rural (%)
96.5
Total unmet need
Urban (%)
3.5
Mothers who had at least 3 ANC visits during
the last pregnancy
Scheduled Castes (%)
8.6
Scheduled Tribes (%)
23.6
Elderly population (60+ years) (%)
6.41
Young people (10-24 years) (%)
28.12
Institutional delivery
Adolescents (10-19 years) (%)
20.6
Decadal Growth Rate,1991-2001 (%)
21.61
Children with full immunization
Population density (per sq. km)
497
Sex Ratio (females per 1000 males)
Medical/Health Infrastructures/Institutions
1991
922
2001
926
CHCs
Child Sex Ratio (0-6 years) (girls per 1000 boys)
PHCs
1991
984
Sub-Centres
2001
978
Literacy rate (7+)
Information on HIV/AIDS
Persons
43.13
Males
57.52
HIV+ among ANC clinics (%)
Females
27.39
HIV+ among STD clinics (%)
Total work participation rate
40.3
Number of Integrated Counseling and testing
Centres (ICTC formerly VCTC)
Female work participation rate
34.4
Number of Anti Retroviral Therapy (ART)
Centres
49.5
40.3
8.5
31.5
4.2
54
39.4
43.8
21.4
37.9
23.8
10.7
28.4
7
21
195
0.25
-
1
0
| 133

15 Pages 141-150

▲back to top


15.1 Page 141

▲back to top


Population Foundation of India
district
sahibganj
Showing CD Blocks
I
B
H
A
R
SAHIBGANJ
PR SAHIBGANJ
INDIA
JHARKHAND
DISTRICT SAHIBGANJ
KILOMETRES
5
0
5
MANDRO
R
MANDRO
BORIO
R
BORIO
TALJHARI
R
TALJHARI
RAJMAHAL
R
RAJMAHAL
R UDHWA
BARHAIT
R
BARHAIT
PATHNA
UDHWA
BARHARWA
R
DI
BOUNDARY, STATE
S
T
R
I
C
T
,, DISTRICT
,, C. D. BLOCK
HEADQUARTERS: DISTRICT, C. D. BLOCK
PR
R
PATHNA
BARHARWA
PAKAU R
134 |

15.2 Page 142

▲back to top


Population, Health & Social Development in Bihar, Jharkhand, Orissa and West bengal
DISTRICT SAHIBGANJ
General Information
Household Amenities, (%), Census 2001
Area (sq. kms.) 1599.0
Households with kutchha houses
Percent to total state’s area
2.0
Households with safe drinking water
C D blocks
9
Households with electricity connection
Towns
2 Vital Rates
No. of villages 1307
Crude Birth Rate, 2001
Total Fertility Rate, 2001
Demographic Particulars (Census, 2001)
Infant Mortality Rate, 2001
Population
Key RCH Indicators from District Level
Household Survey, 2007-08 (%)
Persons 927770
Girls marrying below 18 years
Males 477662
Birth order 3 and above
Females 450108
Current use of any FP Method
Rural (%)
89.4
Total unmet need
Urban (%)
10.6
Mothers who had at least 3 ANC visits during
the last pregnancy
Scheduled Castes (%)
6.4
Scheduled Tribes (%)
29.1
Elderly population (60+ years) (%)
4.90
Young people (10-24 years) (%)
28.94
Institutional delivery
Adolescents(10-19 years) (%)
21.3
Decadal Growth Rate, 1991-2001 (%)
25.89
Children with full immunization
Population density (per sq. km)
580
Sex Ratio (females per 1000 males)
Medical/Health Infrastructures/Institutions
1991
924
2001
942
CHCs
Child Sex Ratio (0-6 years) (girls per 1000 boys)
PHCs
1991
963
Sub-Centres
2001
973
Literacy rate (7+)
Information on HIV/AIDS
Persons
37.61
Males
47.93
HIV+ among ANC clinics (%)
Females
26.56
HIV+ among STD clinics (%)
Total work participation rate
41.8
Number of Integrated Counseling and testing
Centres (ICTC formerly VCTC)
Female work participation rate
37.0
Number of Anti Retroviral Therapy (ART)
Centres
25.2
55.9
8.1
35.5
4.5
69
39.6
47.8
28.0
38.9
19.9
6.0
33.6
7
10
141
0.50
-
-
0
| 135

15.3 Page 143

▲back to top


Population Foundation of India
district
pakaur
Showing CD Blocks
DISTRICT SAHIBGANJ
INDIA
JHARKHAND
DISTRICT PAKAUR
Km 5
0
5 Km
LITIPARA
R
LITIPARA
HIRANPUR
R
HIRANPUR
AMRAPARA
AMRAPARA
R
MAHESHPUR
R
MAHESHPUR
PAKAUR
RP
PAKAUR
PAKURIA
R
PAKURIA
BOUNDARY, STATE
,, DISTRICT
,, C. D. BLOCK
P R HEADQUARTERS: DISTRICT, C. D. BLOCK
136 |

15.4 Page 144

▲back to top


Population, Health & Social Development in Bihar, Jharkhand, Orissa and West bengal
DISTRICT PAKAUR
General Information
Household Amenities, (%), Census 2001
Area (sq. kms.) 1806.0
Households with kutchha houses
Percent to total state’s area
2.3
Households with safe drinking water
C D blocks
6
Households with electricity connection
Towns
1 Vital Rates
No. of villages 1128
Crude Birth Rate, 2001
Total Fertility Rate, 2001
Demographic Particulars (Census, 2001)
Infant Mortality Rate, 2001
Population
Key RCH Indicators from District Level
Household Survey, 2007-08 (%)
Persons 701664
Girls marrying below 18 years
Males 358545
Birth order 3 and above
Females 343119
Current use of any FP Method
Rural (%)
94.9
Total unmet need
Urban (%)
5.1
Mothers who had at least 3 ANC visits during
the last pregnancy
Scheduled Castes (%)
3.3
Scheduled Tribes (%)
44.6
Elderly population (60+ years) (%)
4.43
Young people (10-24 years) (%)
28.73
Institutional delivery
Adolescents(10-19 years) (%)
21.1
Decadal Growth Rate, 1991-2001 (%)
24.34
Children with full immunization
Population density (per sq. km)
389
Sex Ratio (females per 1000 males)
Medical/Health Infrastructures/Institutions
1991
954
2001
957
CHCs
Child Sex Ratio (0-6 years)
(girls per 1000 boys)
PHCs
1991
987
Sub-Centres
2001
964
Literacy rate (7+)
Persons
30.65
Males
40.23
Females
20.61
Total work participation rate
44.1
Female work participation rate
39.5
29.5
66.6
6.0
35.0
4.4
56
45.2
54.5
15.6
46.0
17.0
10.8
41.9
6
9
121
| 137

15.5 Page 145

▲back to top


Population Foundation of India
district
dumka
Showing
CD Blocks
HAR
SARAIYAHAT
R
SARAIYAHAT
DISTRICT
RAMGARH
R
GODDA
I N D IA
JHARKHAND
DISTRICT DUMKA
KILOMETRES
5
0
5
DISTR
DISTRIC
JARMUNDI
R
BASUKINATH
R
JAMA
JAMA
MASALIA
R
MASALIA
RAMGARH
DUMKA
PR
DUMKA
GOPIKANDAR
R
GOPIKANDAR
KATHIKUND
R
KATHIKUND
SHIKARIPARA
R
SHIKARIPARA
DIST R I
NARAYANPUR
R
NARAYANPUR
D
IS
T
R
IC
T
DHANBAD
JAMTARA
R
JAMTARA
NALA
R NALA
KUNDAHIT
R
KUNDAHIT
RANISHWAR
R
RANISHWAR
E
B
T
S
E
W
BOUNDARY, STATE
,, DISTRICT
,, C. D. BLOCK
HEADQUARTERS: DISTRICT, C. D. BLOCK P R
138 |

15.6 Page 146

▲back to top


Population, Health & Social Development in Bihar, Jharkhand, Orissa and West bengal
DISTRICT DUMKA
General Information
Household Amenities, (%), Census 2001
Area (sq. kms.)
6212.0
Households with kutchha houses
Percent to total state’s area
7.8
Households with safe drinking water
C D blocks
14
Households with electricity connection
Towns
4 Vital Rates
No. of villages
3737
Crude Birth Rate, 2001
Total Fertility Rate, 2001
Demographic Particulars (Census, 2001)
Infant Mortality Rate, 2001
Population
Key RCH Indicators from District Level
Household Survey, 2007-08 (%)
Persons 1759602
Girls marrying below 18 years
Males 897364
Birth order 3 and above
Females 862238
Current use of any FP Method
Rural (%)
93.5
Total unmet need
Urban (%)
6.5
Mothers who had at least 3 ANC visits during
the last pregnancy
Scheduled Castes (%)
7.3
Scheduled Tribes (%)
39.9
Elderly population (60+ years) (%)
5.90
Young people (10-24 years) (%)
28.80
Institutional delivery
Adolescents(10-19 years) (%)
20.9
Decadal Growth Rate, 1991-2001 (%)
17.31
Children with full immunization
Population density (per sq. km)
Sex Ratio (females per 1000 males)
1991
283
Medical/Health Infrastructures/
Institutions
955
2001
961
CHCs
Child Sex Ratio (0-6 years) (girls per 1000 boys)
PHCs
1991
984
Sub-Centres
2001
977
Literacy rate (7+)
Information on HIV/AIDS
Persons
47.94
Males
62.86
HIV+ among ANC clinics (%)
Females
32.35
HIV+ among STD clinics (%)
Total work participation rate
44.2
Number of Integrated Counseling and testing
Centres (ICTC formerly VCTC)
Female work participation rate
38.4
Number of Anti Retroviral Therapy (ART)
Centres
35.5
50.1
7.7
28.6
3.6
47
51.1
32.2
36.5
34.2
27.0
9.2
52.9
10
36
258
-
0.4
1
0
| 139

15.7 Page 147

▲back to top


Population Foundation of India
district
dhanbad
Showing CD Blocks
RI D I H
D I S T RI
TUNDI
R
TUNDI
INDIA
JHARKHAND
DISTRICT DHANBAD
KILOMETRES
D
5
0
5
IS
T
R
IC
T
TOPCHANCHI
R
TOPCHANCHI
GOBINDPUR
D
U
M
K
A
BAGHMARA-CUM-
R
TOPCHANCHI
KATRAS
DHANBAD
RP
DHANBAD-CUM-
KENDUADID-CUM-JAGTA
R GOBINDPUR
NIRSA
R
NIRSA-CUM-CHIRKUNDA
I
CT
BALIAPUR
R
BALIAPUR
B
O
K
A
R
JHARIA-CUM-JORAPOKHAR-
O
R
CUM-SINDRI
JORAPOKHAR
BOUNDARY, STATE
,, DISTRICT
,, C. D. BLOCK
HEADQUARTERS: DISTRICT, C. D. BLOCK P R
WEST
BENG
140 |

15.8 Page 148

▲back to top


Population, Health & Social Development in Bihar, Jharkhand, Orissa and West bengal
DISTRICT DHANBAD
General Information
Household Amenities, (%), Census 2001
Area (sq. kms.)
2052
Households with kutchha houses
Percent to total state’s area
2.6
Households with safe drinking water
C D blocks
8
Households with electricity connection
Towns
47 Vital Rates
No. of villages
1121
Crude Birth Rate, 2001
Total Fertility Rate, 2001
Demographic Particulars (Census, 2001)
Infant Mortality Rate, 2001
Population
Key RCH Indicators from District Level
Household Survey, 2007-08 (%)
Persons 2397102
Girls marrying below 18 years
Males 1278946
Birth order 3 and above
Females 1118156
Current use of any FP Method
Rural (%)
47.6
Total unmet need
Urban (%)
52.4
Mothers who had at least 3 ANC visits during
the last pregnancy
Scheduled Castes (%)
16.0
Scheduled Tribes (%)
8.5
Elderly population (60+ years) (%)
4.59
Young people (10-24 years) (%)
33.54
Institutional delivery
Adolescents(10-19 years) (%)
24.9
Decadal Growth Rate, 1991-2001 (%)
22.82
Children with full immunization
Population density (per sq. km)
1147
Sex Ratio (females per 1000 males)
Medical/Health Infrastructures/Institutions
1991
819
2001
874
CHCs
Child Sex Ratio (0-6 years) (girls per 1000 boys)
PHCs
1991
966
Sub-Centres
2001
951
Literacy rate (7+)
Information on HIV/AIDS
Persons
67.0
Males
79.54
HIV+ among ANC clinics (%)
Females
52.43
HIV+ among STD clinics (%)
Total work participation rate
27.7
Number of Integrated Counseling and testing
Centres (ICTC formerly VCTC)
Female work participation rate
16.0
Number of Anti Retroviral Therapy (ART)
Centres
3.4
58.2
6.6
24.4
3.4
27
25.4
38.9
49.0
28.3
50.0
35.4
47.5
8
28
137
0.88
0.40
1
0
| 141

15.9 Page 149

▲back to top


Population Foundation of India
district
bokaro
Showing CD Blocks
GUMIA
R
GUMIA
DISTRICT GIRIDIH
NAWADIH
R
P
R BERMO
BERMO
NAWADIH
PETERBAR
R
PETERBAR
JARIDIH
CHAS
KASMAR
R
KASMAR
JARIDIH
R
R CHAS
I N D IA
JHARKHAND
DISTRICT BOKARO
KILOMETRES
5
0
5
ICT
DHANBAD
R
CHANDANKIYARI
CHANDANKIYARI
BOUNDARY, STATE
,, DISTRICT
,, C. D. BLOCK
HEADQUARTERS: DISTRICT, C. D. BLOCK P R
W
E
S
T
N
BE
142 |

15.10 Page 150

▲back to top


Population, Health & Social Development in Bihar, Jharkhand, Orissa and West bengal
DISTRICT BOKARO
General Information
Household Amenities, (%), Census 2001
Area (sq. kms.) 2,861
Households with kutchha houses
Percent to total state’s area
3.6
Households with safe drinking water
C D blocks
8
Households with electricity connection
Towns
16 Vital Rates
No. of villages
621
Crude Birth Rate, 2001
Total Fertility Rate, 2001
Demographic Particulars (Census, 2001)
Population
Infant Mortality Rate, 2001
Key RCH Indicators from District Level
Household Survey, 2007-08 (%)
Persons 1777662
Girls marrying below 18 years
Males 938436
Birth order 3 and above
Females 839226
Current use of any FP Method
Rural (%)
54.7
Total unmet need
Urban (%)
45.3
Mothers who had at least 3 ANC visits during
the last pregnancy
Scheduled Castes (%)
13.3
Scheduled Tribes (%)
12.3
Elderly population (60+ years) (%)
4.81
Young people (10-24 years) (%)
32.27
Institutional delivery
Adolescents(10-19 years) (%)
23.5
Decadal Growth Rate, 1991-2001 (%)
22.11
Children with full immunization
Population density (per sq. km)
617
Sex Ratio (females per 1000 males)
Medical/Health Infrastructures/Institutions
1991
865
2001
894
CHCs
Child Sex Ratio (0-6 years) (girls per 1000 boys)
PHCs
1991
982
Sub-Centres
2001
950
Literacy rate (7+)
Information on HIV/AIDS
Persons
62.1
Males
76.04
HIV+ among ANC clinics (%)
Females
46.33
HIV+ among STD clinics (%)
Total work participation rate
Female work participation rate
28.7
Number of Integrated Counseling and testing
Centres (ICTC formerly VCTC)
19.5
Number of Anti Retroviral Therapy (ART)
Centres
7.3
52.1
44.6
25.8
3.5
37
29.9
37.8
51.7
26.7
47.1
31.9
56.4
8
16
116
0.28
0.80
1
0
| 143

16 Pages 151-160

▲back to top


16.1 Page 151

▲back to top


Population Foundation of India
district
ranchi
Showing CD
Blocks
ALAMU
DISTRICT
CHATRA
BURMU
CHANHO
R
BURMU
R
CHANHO
MANDAR
R
MANDAR
BERO
R BERO
DISTRICT
HAZA
R
RATU
R
RATU
ORMANJHI
KANKE
R
KANKE
ORMANJHI
R
RANCHI
P
R
NAMKUM
ANGARA
R
ANGARA
NAMKUM
IN DIA
JHARKHAND
DISTRICT RANCHI
KILOMETRES
5
0
5
SILLI
SILLI
R
SONAHATU
LAPUNG
R
LAPUNG
KARRA
R
KARRA
KHUNTI
KHUNTI
R
BUNDU
BUNDU
R
SONAHATU
R
TAMAR-I
TORPA
R
TORPA
MURHU
R
MURHU
ERKI
R
ERKI
TAMAR
R
RANIA
R
RANIA
DISTRICT PASHCHIMI SINGHBHUM
BOUNDARY, STATE
,, DISTRICT
,, C. D. BLOCK
HEADQUARTERS: DISTRICT, C. D. BLOCK
PR
144 |

16.2 Page 152

▲back to top


Population, Health & Social Development in Bihar, Jharkhand, Orissa and West bengal
DISTRICT RANCHI
General Information
Household Amenities, (%), Census 2001
Area (sq. kms.)
7698.0
Households with kutchha houses
Percent to total state’s area
9.7
Households with safe drinking water
C D blocks
20
Households with electricity connection
Towns
8 Vital Rates
No. of villages
2052
Crude Birth Rate, 2001
Total Fertility Rate, 2001
Demographic Particulars (Census, 2001)
Population
Infant Mortality Rate, 2001
Key RCH Indicators from District Level
Household Survey, 2007-08 (%)
Persons 2785064
Girls marrying below 18 years
Males 1436976
Birth order 3 and above
Females 1348088
Current use of any FP Method
Rural (%)
64.9
Total unmet need
Urban (%)
35.1
Mothers who had at least 3 ANC visits during
the last pregnancy
Scheduled Castes (%)
5.2
Scheduled Tribes (%)
41.8
Elderly population (60+ years) (%)
6.20
Young people (10-24 years) (%)
31.31
Institutional delivery
Adolescents(10-19 years) (%)
23.0
Decadal Growth Rate, 1991-2001 (%)
25.7
Children with full immunization
Population density (per sq. km)
362
Sex Ratio (females per 1000 males)
Medical/Health Infrastructures/Institutions
1991
921
2001
938
CHCs
Child Sex Ratio (0-6 years) (girls per 1000 boys)
PHCs
1991
968
Sub-Centres
2001
961
Literacy rate (7+)
Information on HIV/AIDS
Persons
64.6
Males
76.56
HIV+ among ANC clinics (%)
Females
51.72
HIV+ among STD clinics (%)
Total work participation rate
38.7
Number of Integrated Counseling and testing
Centres (ICTC formerly VCTC)
Female work participation rate
36.5
Number of Anti Retroviral Therapy (ART)
Centres
1.5
36.2
29.9
26.4
3.5
45
25.3
34.9
39.8
31.2
42.1
27.4
74.3
20
32
502
0.25
1.20
3
1
| 145

16.3 Page 153

▲back to top


Population Foundation of India
district
lohardaga
Showing CD Blocks
IS T R I C T
D
INDIA
JHARKHAND
DISTRICT LOHARDAGA
PA
L
A
KILOMETRES
5
0
5
M
U
KISKO
NAWADIH
R
KURU
R
KURU
I
C
T
LOHARDAGA
RP
LOHARDAGA
SENHA
SENHA
R
BHANDRA
G
U
M
L
A
R
BHANDRA
BOUNDARIES, DISTRICT
,, C. D. BLOCK
HEADQUARTERS: DISTRICT, C. D. BLOCK
PR
146 |

16.4 Page 154

▲back to top


Population, Health & Social Development in Bihar, Jharkhand, Orissa and West bengal
DISTRICT LOHARDAGA
General Information
Area (sq. kms.)
Percent to total state’s area
C D blocks
Towns
No. of villages
Demographic Particulars (Census, 2001)
Population
Persons
Males
Females
Rural (%)
Urban (%)
Scheduled Castes (%)
Scheduled Tribes (%)
Elderly population (60+ years) (%)
Young people (10-24 years) (%)
Adolescents(10-19 years) (%)
Decadal Growth Rate, 1991-2001 (%)
Population density (per sq. km)
Sex Ratio (females per 1000 males)
1991
2001
Child Sex Ratio (0-6 years) (girls per 1000 boys)
1991
2001
Literacy rate (7+)
Persons
Males
Females
Total work participation rate
Female work participation rate
Household Amenities, (%), Census 2001
1491.0
Households with kutchha houses
1.9
Households with safe drinking water
5
Households with electricity connection
1 Vital Rates
352
Crude Birth Rate, 2001
Total Fertility Rate, 2001
Infant Mortality Rate, 2001
Key RCH Indicators from District Level
Household Survey, 2007-08 (%)
364521
Girls marrying below 18 years
184507
Birth order 3 and above
180014
Current use of any FP Method
87.3
Total unmet need
12.7
Mothers who had at least 3 ANC visits during
the last pregnancy
3.5
55.7
6.25
30.25
Institutional delivery
23.3
26.14
Children with full immunization
244
Medical/Health Infrastructures/Institutions
971
976
CHCs
PHCs
984
Sub-Centres
945
Information on HIV/AIDS
53.6
67.28
HIV+ among ANC clinics (%)
39.64
HIV+ among STD clinics (%)
42.1
Number of Integrated Counseling and testing
Centres (ICTC formerly VCTC)
43.0
Number of Anti Retroviral Therapy (ART)
Centres
0.2
27.2
10.2
32.9
4.6
59
24.4
51.6
34.1
39.6
31.3
20.9
81.2
73
10
5
0
-
-
0
| 147

16.5 Page 155

▲back to top


Population Foundation of India
INDIA
JHARKHAND
DISTRICT GUMLA
KILOMETRES
5
0
5
district
gumla
Showing
CD Blocks
U
M
A
L
BOUNDARY, STATE
,, DISTRICT
,, C. D. BLOCK
HEADQUARTERS: DISTRICT, C. D. BLOCK
PR
DISTR
BISHUNPUR
R
R
DUMRI
R
CHAINPUR
LO HAR DAG A
R
GHAGHRA
SISAI
R
R
VERNO
R
RAIDIH
GUMLA
RP
R
PALKOT
BASIA
R
KAMDARA
R
SIMDEGA
R
KURDEG
R
THETHAITANGAR
R
BOLBA
O
R
I
R
KOLEBIRA
BANO
R
JALDEGA
R
A
S
S
148 |

16.6 Page 156

▲back to top


Population, Health & Social Development in Bihar, Jharkhand, Orissa and West bengal
DISTRICT GUMLA
General Information
Household Amenities, (%), Census 2001
Area (sq. kms.)
9077
Households with kutchha houses
Percent to total state’s area
11.4
Households with safe drinking water
C D blocks
18
Households with electricity connection
Towns
2 Vital Rates
No. of villages
1393
Crude Birth Rate, 2001
Total Fertility Rate, 2001
Demographic Particulars (Census, 2001)
Infant Mortality Rate, 2001
Population
Key RCH Indicators from District Level
Household Survey, 2007-08 (%)
Persons 1346767
Girls marrying below 18 years
Males 675769
Birth order 3 and above
Females 670998
Current use of any FP Method
Rural (%)
94.5
Total unmet need
Urban (%)
5.5
Mothers who had at least 3 ANC visits during
the last pregnancy
Scheduled Castes (%)
5.0
Scheduled Tribes (%)
68.4
Elderly population (60+ years) (%)
7.16
Young people (10-24 years) (%)
28.67
Institutional delivery
Adolescents(10-19 years) (%)
21.8
Decadal Growth Rate, 1991-2001 (%)
16.60
Children with full immunization
Population density (per sq. km)
148
Sex Ratio (females per 1000 males)
Medical/Health Infrastructures/Institutions
1991
987
2001
993
CHCs
Child Sex Ratio (0-6 years) (girls per 1000 boys)
PHCs
1991
988
Sub-Centres
2001
976
Literacy rate (7+)
Information on HIV/AIDS
Persons
51.7
Males
63.50
HIV+ among ANC clinics (%)
Females
39.95
HIV+ among STD clinics (%)
Total work participation rate
Female work participation rate
48.9
Number of Integrated Counseling and testing
Centres (ICTC formerly VCTC)
45.8
Number of Prevention of Parent to Child
Transmission Centres (PPTCTC)
Number of Anti Retroviral Therapy (ART) Centres
0.4
16.8
5.1
30.7
4.0
60
29.0
52.9
32.0
38.1
30.0
10.3
68.6
11
13
242
0
-
2
-
1
| 149

16.7 Page 157

▲back to top


Population Foundation of India
district
pashim
singhbhum
Showing CD Blocks
INDIA
JHARKHAND
DISTRICT PASHCHIMI SINGHBHUM
KILOMETRES
5
0
5
DISTR IC T
BANDGAON
R
I
H
C
RAN
KUCHAI
KUCHAI
R
WEST BEN
ICHAGARH
R
ICHAGARH
NIMDIH
CHANDIL
R
CHANDIL
R
NIMDIH
KHARSAWAN
R
ADITYAPUR
SERAIKELA
R
KHARSAWAN
ADITYAPUR
(GAMHARIA)
BANDGAON
SONUA
GOILKERA
R
GOILKERA
SONUA
R
MANOHARPUR
R
CHAKRADHARPUR
R
CHAKRADHARPUR
KHUNTPANI
R
SERAIKELA
R
GOBINDPUR
(RAJMAHAL)
R
GOBINDPUR
KHUNTPANI
CHAIBASA
RP
CHAIBASA
TONTO
TONTO
R
JHINKPANI
R
TANTNAGAR
R
TANTNAGAR
JHINKPANI
R
MANJHARI
DIST
MANJHARI
MANOHARPUR
BARAJAMDA
R
NOAMUNDI
(BARAJAMDA)
JAGANNATHPUR
R
JAGANNATHPUR
KUMARDUNGI
R
KUMARDUNGI
R
O
I
S
R
MAJHGAON
MAJHGAON
S
A
BOUNDARY, STATE
,, DISTRICT
,, C. D. BLOCK
HEADQUARTERS: DISTRICT, C. D. BLOCK
PR
150 |

16.8 Page 158

▲back to top


Population, Health & Social Development in Bihar, Jharkhand, Orissa and West bengal
DISTRICT PASCHIM SINGHBHUM
General Information
Household Amenities, (%), Census 2001
Area (sq. kms.)
9907
Households with kutchha houses
Percent to total state’s area
12.4
Households with safe drinking water
C D blocks
23
Households with electricity connection
Towns
14 Vital Rates
No. of villages
2777
Crude Birth Rate, 2001
Total Fertility Rate, 2001
Demographic Particulars (Census, 2001)
Infant Mortality Rate, 2001
Population
Key RCH Indicators from District Level
Household Survey, 2007-08 (%)
Persons 2082795
Girls marrying below 18 years
Males 1054641
Birth order 3 and above
Females 1028154
Current use of any FP Method
Rural (%)
83.2
Total unmet need
Urban (%)
16.8
Mothers who had at least 3 ANC visits during
the last pregnancy
Scheduled Castes (%)
4.9
Scheduled Tribes (%)
53.4
Elderly population (60+ years) (%)
5.73
Young people (10-24 years) (%)
29.49
Institutional delivery
Adolescents(10-19 years) (%)
21.9
Decadal Growth Rate, 1991-2001 (%)
16.35
Children with full immunization
Population density (per sq. km)
210
Sex Ratio (females per 1000 males)
Medical/Health Infrastructures/Institutions
1991
965
2001
975
CHCs
Child Sex Ratio (0-6 years) (girls per 1000 boys)
PHCs
1991
987
Sub-Centres
2001
969
Literacy rate (7+)
Information on HIV/AIDS
Persons
50.2
Males
65.60
HIV+ among ANC clinics (%)
Females
34.37
HIV+ among STD clinics (%)
Total work participation rate
44.1
Number of Integrated Counseling and testing
Centres (ICTC formerly VCTC)
Female work participation rate
41.2
Number of Anti Retroviral Therapy (ART) Centres
11.6
55.4
16.5
28.3
3.5
54
24.5
49.5
27.9
41.6
40.4
21.9
59.1
15
15
342
-
-
2
0
| 151

16.9 Page 159

▲back to top


Population Foundation of India
district
purbi
singhbhum
Showing CD Blocks
PATAMDA
R
PATAMDA
JAMSHEDPUR
RP
GOLMURI-CUM-JUGSALAI
INDIA
JHARKHAND
DISTRICT PURBI SINGHBHUM
KILOMETRES
5
0
5
POTKA
R
GHATSHILA
MUSABANI
GHATSHILA
R
B
E
N
POTKA
R
MUSABANI
DHALBHUMGARH
R
CHAKULIA
R
R DUMARIA
DHALBHUMGARH
CHAKULIA
O
R
DUMARIA
I
BAHARAGORA
S
S
R
BAHARAGORA
A
BOUNDARY, STATE
,, DISTRICT
,, C. D. BLOCK
HEADQUARTERS: DISTRICT, C. D. BLOCK
PR
152 |

16.10 Page 160

▲back to top


Population, Health & Social Development in Bihar, Jharkhand, Orissa and West bengal
DISTRICT PURBI SINGHBHUM
General Information
Household Amenities, (%), Census 2001
Area (sq. kms.)
2533
Households with kutchha houses
Percent to total state’s area
4.4
Households with safe drinking water
C D blocks
9
Households with electricity connection
Towns
13 Vital Rates
No. of villages
1610
Crude Birth Rate, 2001
Total Fertility Rate, 2001
Demographic Particulars (Census, 2001)
Infant Mortality Rate, 2001
Population
Key RCH Indicators from District Level
Household Survey, 2007-08 (%)
Persons 1982988
Girls marrying below 18 years
Males 1027433
Birth order 3 and above
Females 955555
Current use of any FP Method
Rural (%)
45.0
Total unmet need
Urban (%)
55.0
Mothers who had at least 3 ANC visits during
the last pregnancy
Scheduled Castes (%)
4.7
Scheduled Tribes (%)
27.8
Elderly population (60+ years) (%)
6.67
Young people (10-24 years) (%)
30.36
Institutional delivery
Adolescents(10-19 years) (%)
21.3
Decadal Growth Rate, 1991-2001 (%)
22.66
Children with full immunization
Population density (per sq. km)
561
Sex Ratio (females per 1000 males)
Medical/Health Infrastructures/Institutions
1991
906
2001
930
CHCs
Child Sex Ratio (0-6 years) (girls per 1000 boys)
PHCs
1991
958
Sub-Centres
2001
941
Literacy rate (7+)
Information on HIV/AIDS
Persons
68.8
Males
79.44
HIV+ among ANC clinics (%)
Females
57.32
HIV+ among STD clinics (%)
Total work participation rate
34.9
Number of Integrated Counseling and testing
Centres (ICTC formerly VCTC)
Female work participation rate
27.8
Number of Anti Retroviral Therapy (ART) Centres
23.7
61.0
47.4
22.1
2.7
36
22.5
25.1
47.7
28.7
57.3
49.0
81.5
9
16
244
0.25
3.13
2
1
| 153

17 Pages 161-170

▲back to top


17.1 Page 161

▲back to top


ORISSA
at a glance

17.2 Page 162

▲back to top


Population Foundation of India
ORISSA
Showing
Districts
Map not to scale
156 |

17.3 Page 163

▲back to top


Population, Health & Social Development in Bihar, Jharkhand, Orissa and West bengal
STATE PROFILE
ORISSA
Key Demographic, Health and RCH Indicators at a glance
General information
Area (sq kms)
No. of districts
No. of CD blocks
No. of villages
No. of towns
Demographic Particulars (Census, 2001)
Population
Persons
Males
Females
Rural (%)
Urban (%)
Scheduled Castes (%)
Scheduled Tribes (%)
Elderly population (60+ years) (%)
Young people (10-24 years) (%)
Adolescents (10-19 years) (%)
Decadal Growth Rate, 1991-2001 (%)
Population density (per sq. km)
Sex Ratio (females per 1000 males)
Child Sex Ratio (0-6 years) (girls per 1000 boys)
Literacy rate
Persons
Males
Females
Work participation rate
Female work participation rate
Proportion of people living below poverty line (2004-05)
Per capita net state domestic product at current prices in rupees, 2005-06
Human Development Index (HDI), 2001 (among 26 states)
Value
Rank
Social Development Index (SDI), 2001 (among 16 major states)
Rural
Value
Rank
Urban
Value
Rank
Household Amenities (%), Census 2001
Households with kutchha houses
Households with safe drinking water
Households with electricity connection
Vital Indices
Crude Birth Rate (CBR), 2008, SRS
Total Fertility Rate (TFR), 2007, SRS
155707
30
314
51061
103
36804660
1866570
18144090
85.0
14.9
16.5
22.1
8.8
29.8
21.2
16.3
236
972
953
63.1
75.3
50.5
38.8
24.7
39.9
13329
0.443
24
27.3
16
37.4
15
47.4
64.2
26.9
21.4
2.4
| 157

17.4 Page 164

▲back to top


Population Foundation of India
Age Specific Fertility Rates, 2007, SRS
15-19 years
20-24 years
25-29 years
30-34 years
35-39 years
40-44 years
45-49 years
General Fertility Rate, 2007,SRS
Gross Reproduction Rate, 2007, SRS
Life Expectancy at Birth, 2002-2006, SRS
Crude Death Rate (CDR), 2008, SRS
Maternal Mortality Ratio (MMR), 2004-06, RGI
Child Mortality Rate (CMR), 2007, SRS
Infant Mortality Rate (IMR), 2008, SRS
Neo-natal mortality rate, 2007, SRS
Early neo-natal mortality rate, 2007, SRS
Late neo-natal mortality rate, 2007, SRS
Post neo-natal mortality rate, 2007, SRS
Peri-natal mortality rate, 2007, SRS
Still birth rate, 2007, SRS
Key RCH and Nutrition Indicators (%)
Girls marrying below 18 years, DLHS, 2007-08
Women age 20-24 reporting birth order 2 & above, DLHS, 2007-08
Current use of any FP method, DLHS, 2007-08
Total unmet need, DLHS, 2007-08
Pregnant women with any ANC, DLHS, 2007-08
Pregnant women with 3 + ANCs, DLHS, 2007-08
Mother who consumed 100 IFA tablets, DLHS, 2007-08
Safe delivery, DLHS, 2007-08
Institutional delivery, DLHS, 2007-08
Children with full immunization (12-35 months), DLHS, 2007-08
Children under 3 years who are underweight, NFHS-3, 2005-06
Children under 3 years who are stunted, NFHS-3, 2005-06
Children under 3 years who are wasted, NFHS-3, 2005-06
Children age 6-35 months who are anaemic, NFHS-3, 2005-06
Ever married women age 15-49 years who are anaemic, NFHS-3, 2005-06
Medical/Health Infrastructures/Institutions
Number of Hospitals
Community Health Centres (CHCs)
Primary Health Centres (PHCs)
Sub Centres (SCs)
Information on HIV/AIDS (%)
Women who have heard of HIV/AIDS, NFHS-3, 2005-06
Men who have heard of HIV/AIDS, NFHS-3, 2005-06
Women who know that consistent condom use can reduce the chances of getting HIV/AIDS, NFHS-3,
2005-06
Men who know that consistent condom use can reduce the chances of getting HIV/AIDS, NFHS-3,
2005-06
HIV+ among ANC clinics (%)
HIV+ among STD clinics (%)
Number of Integrated Counseling and Testing Centres (ICTC formerly VCTC)
Number of Prevention of Parent To Child Transmission Centres (PPTCTC)
Number of Anti Retroviral Therapy (ART) Centres
158 |
35.7
172.9
151.7
77.9
26.2
10.4
3.3
79.7
1.2
59.6
9.0
303
20
69
49
37
12
22
49
13
19.1
39.6
47.0
24.0
84.1
54.6
37.6
50.9
44.3
62.4
40.7
45.0
19.5
65.0
61.2
32
157
1171
7283
66.0
78.4
33.0
64.9
0.55
2.34
184
-
3

17.5 Page 165

▲back to top


districts
at a glance
| 159

17.6 Page 166

▲back to top


Population Foundation of India
dis t ri c t
bARGARH
Showing CD Blocks
160 |

17.7 Page 167

▲back to top


Population, Health & Social Development in Bihar, Jharkhand, Orissa and West bengal
DISTRICT BARGARH
General Information
Household Amenities, (%), Census 2001
Area (sq. kms.)
5837
Households with kutchha houses
Percent to total state’s area
3.7
Households with safe drinking water
C D blocks
12
Households with electricity connection
Towns
03 Vital Rates
No. of villages
1208
Crude Birth Rate, 2001
Total Fertility Rate, 2001
Demographic Particulars (Census, 2001)
Infant Mortality Rate, 2001
Population
Key RCH Indicators from District Level
Household Survey, 2007-08 (%)
Persons 1346336
Girls marrying below 18 years
Males 681500
Birth order 3 and above
Females 664836
Current use of any FP Method
Rural (%)
92.3
Total unmet need
Urban (%)
7.6
Pregnant women who had at least with 3 ANCs
visits during the last pregnancy
Scheduled Castes (%)
19.4
Scheduled Tribes (%)
19.4
Institutional delivery
Elderly population (60+ years) (%)
9.7
Young people (10-24 years) (%)
30.1
Adolescent (10-19 years) (%)
21.5
Decadal Growth Rate, 1991-2001 (%)
11.5
Children with full immunization
Population density (per sq. km)
231
Sex Ratio (females per 1000 males)
Medical/Health Infrastructures/Institutions
1991
979
2001
976
CHCs
Child Sex Ratio (0-6 years) (girls per 1000 boys)
PHCs
1991
971
Sub-Centres
2001
957
Literacy rate (7+)
Information on HIV/AIDS
Persons
63.9
Males
77.4
HIV+ among ANC clinics (%)
Females
50.2
HIV+ among STD clinics (%)
Total work participation rate
44.1
Number of Integrated Counseling and Testing
Centres (ICTC formerly VCTC)
Female work participation rate
31.3
Number of Anti Retroviral Therapy (ART) Centres
28.0
82.3
28.5
20.6
2.5
74
24.0
23.9
44.6
30.1
64.3
43.6
70.4
8
49
204
0.25
-
4
-
| 161

17.8 Page 168

▲back to top


Population Foundation of India
dis t ri c t
JHARSUGUDA
Showing CD Blocks
162 |

17.9 Page 169

▲back to top


Population, Health & Social Development in Bihar, Jharkhand, Orissa and West bengal
DISTRICT JHARSUGUDA
General Information
Area (sq. kms.)
Percent to total state’s area
C D blocks
Towns
No. of villages
Demographic Particulars (Census, 2001)
Population
Persons
Males
Females
Rural (%)
Urban (%)
Scheduled Castes (%)
Scheduled Tribes (%)
Elderly population (60+ years) (%)
Young people (10-24 years) (%)
Adolescent (10-19 years) (%)
Decadal Growth Rate, 1991-2001 (%)
Population density (per sq. km)
Sex Ratio (females per 1000 males)
1991
2001
Child Sex Ratio (0-6 years) (girls per 1000 boys)
1991
2001
Literacy rate (7+)
Persons
Males
Females
Total work participation rate
Household Amenities, (%), Census 2001
2081
Households with kutchha houses
1.3
Households with safe drinking water
05
Households with electricity connection
03 Vital Rates
356
Crude Birth Rate, 2001
Total Fertility Rate, 2001
Infant Mortality Rate, 2001
Key RCH Indicators from District Level
Household Survey, 2007-08 (%)
509716
Girls marrying below 18 years
261941
Birth order 3 and above
247775
Current use of any FP Method
92.4
Total unmet need
7.6
Pregnant women who had at least with 3
ANCs visits during the last pregnancy
17.1
31.3
Institutional delivery
8.2
31.1
22.3
15.3
Children with full immunization
245
Medical/Health Infrastructures/Institutions
938
946
CHCs
PHCs
970
Sub-Centres
949
Information on HIV/AIDS
70.6
82.2
HIV+ among ANC clinics (%)
58.4
HIV+ among STD clinics (%)
37.2
Number of Integrated Counseling and Testing
Centres (ICTC formerly VCTC)
Female work participation rate
22.6
Number of Anti Retroviral Therapy (ART) Centres
13.6
58.1
48.1
21.1
2.6
61
10.9
22.1
46.4
28.3
65.8
65.1
78.3
3
17
66
0.0
-
3
-
| 163

17.10 Page 170

▲back to top


Population Foundation of India
dis t ri c t
SAMbALPUR
Showing CD Blocks
164 |

18 Pages 171-180

▲back to top


18.1 Page 171

▲back to top


Population, Health & Social Development in Bihar, Jharkhand, Orissa and West bengal
DISTRICT SAMBALPUR
General Information
Area (sq. kms.)
Percent to total state’s area
C D blocks
Towns
No. of villages
Demographic Particulars (Census, 2001)
Population
Persons
Males
Females
Rural (%)
Urban (%)
Scheduled Castes (%)
Scheduled Tribes (%)
Elderly population (60+ years) (%)
Young people (10-24 years) (%)
Adolescent (10-19 years) (%)
Decadal Growth Rate, 1991-2001 (%)
Population density (per sq. km)
Sex Ratio (females per 1000 males)
1991
2001
Child Sex Ratio (0-6 years) (girls per 1000 boys)
1991
2001
Literacy rate (7+)
Persons
Males
Females
Total work participation rate
Household Amenities, (%), Census 2001
6657
Households with kutchha houses
4.3
Households with safe drinking water
09
Households with electricity connection
05 Vital Rates
1325
Crude Birth Rate, 2001
Total Fertility Rate, 2001
Infant Mortality Rate, 2001
Key RCH Indicators from District Level
Household Survey, 2007-08 (%)
935613
Girls marrying below 18 years
475122
Birth order 3 and above
460491
Current use of any FP Method
72.8
Total unmet need
27.2
Pregnant women who had at least with 3
ANCs visits during the last pregnancy
17.0
34.5
Institutional delivery
8.4
30.4
22.4
15.0
Children with full immunization
141
Medical/Health Infrastructures/Institutions
956
969
CHCs
PHCs
972
Sub-Centres
959
Information on HIV/AIDS
67.2
79.0
HIV+ among ANC clinics (%)
55.1
HIV+ among STD clinics (%)
45.0
Number of Integrated Counseling and Testing
Centres (ICTC formerly VCTC)
Female work participation rate
35.6
Number of Anti Retroviral Therapy (ART) Centres
22.7
63.4
36.4
21.2
2.6
90
9.7
18.6
44.4
27.7
67.4
56.6
70.5
9
31
167
0.50
0.40
5
1
| 165

18.2 Page 172

▲back to top


Population Foundation of India
dis t ri c t
Debagarh
Showing CD Blocks
166 |

18.3 Page 173

▲back to top


Population, Health & Social Development in Bihar, Jharkhand, Orissa and West bengal
DISTRICT DEBAGARH
General Information
Area (sq. kms.)
Percent to total state’s area
C D blocks
Towns
No. of villages
Demographic Particulars (Census, 2001)
Population
Persons
Males
Females
Rural (%)
Urban (%)
Scheduled Castes (%)
Scheduled Tribes (%)
Elderly population (60+ years) (%)
Young people (10-24 years) (%)
Adolescent (10-19 years) (%)
Decadal Growth Rate, 1991-2001 (%)
Population density (per sq. km)
Sex Ratio (females per 1000 males)
1991
2001
Child Sex Ratio (0-6 years) (girls per 1000 boys)
1991
2001
Literacy rate (7+)
Persons
Males
Females
Total work participation rate
Household Amenities, (%), Census 2001
2940
Households with kutchha houses
1.9
Households with safe drinking water
03
Households with electricity connection
01 Vital Rates
867
Crude Birth Rate, 2001
Total Fertility Rate, 2001
Infant Mortality Rate, 2001
Key RCH Indicators from District Level
Household Survey, 2007-08 (%)
274108
Girls marrying below 18 years
138408
Birth order 3 and above
135700
Current use of any FP Method
92.6
Total unmet need
7.3
Pregnant women who had at least with 3
ANCs visits during the last pregnancy
15.4
33.6
Institutional delivery
8.1
30.1
21.6
17.0
Children with full immunization
93
Medical/Health Infrastructures/Institutions
982
980
CHCs
PHCs
965
Sub-Centres
956
Information on HIV/AIDS
60.3
73.3
HIV+ among ANC clinics (%)
47.1
HIV+ among STD clinics (%)
46.1
Number of Integrated Counseling and Testing
Centres (ICTC formerly VCTC)
Female work participation rate
38.6
Number of Anti Retroviral Therapy (ART) Centres
41.6
56.7
12.3
25.5
3.1
95
22.5
22.1
35.6
32.3
60.2
44.4
56.2
9
34
-
-
2
-
| 167

18.4 Page 174

▲back to top


Population Foundation of India
dis t ri c t
SUNDARGARH
Showing CD Blocks
168 |

18.5 Page 175

▲back to top


Population, Health & Social Development in Bihar, Jharkhand, Orissa and West bengal
DISTRICT SUNDARGARH
General Information
Area (sq. kms.)
Percent to total state’s area
C D blocks
Towns
No. of villages
Demographic Particulars (Census, 2001)
Population
Persons
Males
Females
Rural (%)
Urban (%)
Scheduled Castes (%)
Scheduled Tribes (%)
Elderly population (60+ years) (%)
Young people (10-24 years) (%)
Adolescent (10-19 years) (%)
Decadal Growth Rate, 1991-2001 (%)
Population density (per sq. km)
Sex Ratio (females per 1000 males)
1991
2001
Child Sex Ratio (0-6 years) (girls per 1000 boys)
1991
2001
Literacy rate (7+)
Persons
Males
Females
Total work participation rate
Household Amenities, (%), Census 2001
9712
Households with kutchha houses
6.2
Households with safe drinking water
17
Households with electricity connection
05 Vital Rates
1744
Crude Birth Rate, 2001
Total Fertility Rate, 2001
Infant Mortality Rate, 2001
Key RCH Indicators from District Level
Household Survey, 2007-08 (%)
1830673
Girls marrying below 18 years
935601
Birth order 3 and above
895072
Current use of any FP Method
65.6
Total unmet need
34.3
Pregnant women who had at least with 3
ANCs visits during the last pregnancy
8.6
50.2
Institutional delivery
6.8
30.4
21.6
16.3
Children with full immunization
188
Medical/Health Infrastructures/Institutions
936
957
CHCs
PHCs
967
Sub-Centres
970
Information on HIV/AIDS
64.8
75.3
HIV+ among ANC clinics (%)
53.8
HIV+ among STD clinics (%)
40.4
Number of Integrated Counseling and Testing
Centres (ICTC formerly VCTC)
Female work participation rate
28.9
Number of Anti Retroviral Therapy (ART) Centres
6.2
65.0
38.4
22.8
2.7
73
13.7
29.4
47.2
27.1
64.1
45.6
62.0
2
8
42
0.25
-
7
-
| 169

18.6 Page 176

▲back to top


Population Foundation of India
dis t ri c t
KENDUJHAR
Showing CD Blocks
170 |

18.7 Page 177

▲back to top


Population, Health & Social Development in Bihar, Jharkhand, Orissa and West bengal
DISTRICT KENDUJHAR
General Information
Area (sq. kms.)
Percent to total state’s area
C D blocks
Towns
No. of villages
Demographic Particulars (Census, 2001)
Population
Persons
Males
Females
Rural (%)
Urban (%)
Scheduled Castes (%)
Scheduled Tribes (%)
Elderly population (60+ years) (%)
Young people (10-24 years) (%)
Adolescent (10-19 years) (%)
Decadal Growth Rate, 1991-2001 (%)
Population density (per sq. km)
Sex Ratio (females per 1000 males)
1991
2001
Child Sex Ratio (0-6 years) (girls per 1000 boys)
1991
2001
Literacy rate (7+)
Persons
Males
Females
Total work participation rate
Household Amenities, (%), Census 2001
8303
Households with kutchha houses
5.3
Households with safe drinking water
04
Households with electricity connection
13 Vital Rates
2127
Crude Birth Rate, 2001
Total Fertility Rate, 2001
Infant Mortality Rate, 2001
Key RCH Indicators from District Level
Household Survey, 2007-08 (%)
1561990
Girls marrying below 18 years
790036
Birth order 3 and above
771954
Current use of any FP Method
86.3
Total unmet need
13.6
Pregnant women who had at least with 3
ANCs visits during the last pregnancy
11.6
44.5
Institutional delivery
6.7
29.4
21.1
16.8
Children with full immunization
18.8
Medical/Health Infrastructures/Institutions
974
977
CHCs
PHCs
981
Sub-Centres
962
Information on HIV/AIDS
59.2
72.0
HIV+ among ANC clinics (%)
46.2
HIV+ among STD clinics (%)
39.8
Number of Integrated Counseling and Testing
Centres (ICTC formerly VCTC)
Female work participation rate
28.1
Number of Anti Retroviral Therapy (ART) Centres
47.5
55.1
18.9
25.3
3.0
86
20.9
26.7
48.0
22.8
56.8
34.3
59.5
11
61
351
0.5
-
5
-
-
| 171

18.8 Page 178

▲back to top


Population Foundation of India
dis t ri c t
MAYURBHANJ
Showing CD Blocks
172 |

18.9 Page 179

▲back to top


Population, Health & Social Development in Bihar, Jharkhand, Orissa and West bengal
DISTRICT MAYURBHANJ
General Information
Area (sq. kms.)
Percent to total state’s area
C D Blocks
Towns
No. of villages
Demographic Particulars (Census, 2001)
Population
Persons
Males
Females
Rural (%)
Urban (%)
Scheduled Castes (%)
Scheduled Tribes (%)
Elderly population (60+ years) (%)
Young people (10-24 years) (%)
Adolescent (10-19 years) (%)
Decadal Growth Rate, 1991-2001 (%)
Population density (per sq. km)
Sex Ratio (females per 1000 males)
1991
2001
Child Sex Ratio (0-6 years) (girls per 1000 boys)
1991
2001
Literacy rate (7+)
Persons
Males
Females
Total work participation rate
Household Amenities, (%), Census 2001
10418
Households with kutchha houses
6.7
Households with safe drinking water
26
Households with electricity connection
04 Vital Rates
3945
Crude Birth Rate, 2001
Total Fertility Rate, 2001
Infant Mortality Rate, 2001
Key RCH Indicators from District Level
Household Survey, 2007-08 (%)
2223456
Girls marrying below 18 years
1123200
Birth order 3 and above
1100256
Current use of any FP Method
93.0
Total unmet need
7.0
Pregnant women who had at least with 3
ANCs visits during the last pregnancy
7.7
56.6
Institutional delivery
7.2
27.6
20.1
17.9
Children with full immunization
213
Medical/Health Infrastructures/Institutions
979
980
CHCs
PHCs
962
Sub-Centres
956
Information on HIV/AIDS
51.9
65.8
HIV+ among ANC clinics (%)
37.8
HIV+ among STD clinics (%)
46.2
Number of Integrated Counseling and Testing
Centres (ICTC formerly VCTC)
Female work participation rate
39.9
Number of Anti Retroviral Therapy (ART) Centres
60.5
44.3
15.7
26.0
3.0
65
37.5
20.4
49.8
21.3
66.0
43.0
58.2
17
85
589
0.5
-
7
-
| 173

18.10 Page 180

▲back to top


Population Foundation of India
dis t ri c t
BALESHWAR
Showing CD Blocks
174 |

19 Pages 181-190

▲back to top


19.1 Page 181

▲back to top


Population, Health & Social Development in Bihar, Jharkhand, Orissa and West bengal
DISTRICT BALESHWAR
General Information
Area (sq. kms.)
Percent to total state’s area
C D blocks
Towns
No. of villages
Demographic Particulars (Census, 2001)
Population
Persons
Males
Females
Rural (%)
Urban (%)
Scheduled Castes (%)
Scheduled Tribes (%)
Elderly population (60+ years) (%)
Young people (10-24 years) (%)
Adolescent (10-19 years) (%)
Decadal Growth Rate, 1991-2001 (%)
Population density (per sq. km)
Sex Ratio (females per 1000 males)
1991
2001
Child Sex Ratio (0-6 years) (girls per 1000 boys)
1991
2001
Literacy rate (7+)
Persons
Males
Females
Total work participation rate
Household Amenities, (%), Census 2001
3806
Households with kutchha houses
2.4
Households with safe drinking water
12
Households with electricity connection
Vital Rates
2971
Crude Birth Rate, 2001
Total Fertility Rate, 2001
Infant Mortality Rate, 2001
Key RCH Indicators from District Level
Household Survey, 2007-08 (%)
2024508
Girls marrying below 18 years
1036511
Birth order 3 and above
987997
Current use of any FP Method
89.1
Total unmet need
10.8
Pregnant women who had at least with 3
ANCs visits during the last pregnancy
18.8
11.3
Institutional delivery
7.9
30.0
22.0
19.3
Children with full immunization
532
Medical/Health Infrastructures/Institutions
955
953
CHCs
PHCs
965
Sub-Centres
944
Information on HIV/AIDS
70.5
81.7
HIV+ among ANC clinics (%)
58.9
HIV+ among STD clinics (%)
31.9
Number of Integrated Counseling and Testing
Centres (ICTC formerly VCTC)
Female work participation rate
11.4
Number of Anti Retroviral Therapy (ART) Centres
69.6
86.8
31.9
25.2
2.9
73
15.0
19.4
65.7
18.2
67.6
52.4
82.8
9
72
275
-
3.2
11
-
| 175

19.2 Page 182

▲back to top


Population Foundation of India
dis t ri c t
BHADRAK
Showing CD Blocks
176 |

19.3 Page 183

▲back to top


Population, Health & Social Development in Bihar, Jharkhand, Orissa and West bengal
DISTRICT BHADRAK
General Information
Area (sq. kms.)
Percent to total state’s area
C D blocks
Towns
No. of villages
Demographic Particulars (Census, 2001)
Population
Persons
Males
Females
Rural (%)
Urban (%)
Scheduled Castes (%)
Scheduled Tribes (%)
Elderly population (60+ years) (%)
Young people (10-24 years) (%)
Adolescent (10-19 years) (%)
Decadal Growth Rate, 1991-2001 (%)
Population density (per sq. km)
Sex Ratio (females per 1000 males)
1991
2001
Child Sex Ratio (0-6 years) (girls per 1000 boys)
1991
2001
Literacy rate (7+)
Persons
Males
Females
Total work participation rate
Household Amenities, (%), Census 2001
2505
Households with kutchha houses
1.6
Households with safe drinking water
07
Households with electricity connection
03 Vital Rates
1307
Crude Birth Rate, 2001
Total Fertility Rate, 2001
Infant Mortality Rate, 2001
Key RCH Indicators from District Level
Household Survey, 2007-08 (%)
1333749
Girls marrying below 18 years
675642
Birth order 3 and above
658107
Current use of any FP Method
89.4
Total unmet need
10.6
Pregnant women who had at least with 3
ANCs visits during the last pregnancy
21.5
1.9
Institutional delivery
8.6
32.0
22.9
20.6
Children with full immunization
532
Medical/Health Infrastructures/Institutions
985
974
CHCs
PHCs
955
Sub-Centres
943
Information on HIV/AIDS
73.8
84.7
HIV+ among ANC clinics (%)
62.8
HIV+ among STD clinics (%)
28.9
Number of Integrated Counseling and Testing
Centres (ICTC formerly VCTC)
Female work participation rate
8.1
Number of Anti Retroviral Therapy (ART) Centres
85.6
88.9
25.6
24.8
2.9
73
6.6
25.6
58.8
22.3
64.7
42.8
72.7
6
50
178
1.0
-
8
-
| 177

19.4 Page 184

▲back to top


Population Foundation of India
dis t ri c t
KENDRAPARA
Showing CD Blocks
178 |

19.5 Page 185

▲back to top


Population, Health & Social Development in Bihar, Jharkhand, Orissa and West bengal
DISTRICT KENDRAPARA
General Information
Area (sq. kms.)
Percent to total state’s area
C D vlocks
Towns
No. of villages
Demographic Particulars (Census, 2001)
Population
Persons
Males
Females
Rural (%)
Urban (%)
Scheduled Castes (%)
Scheduled Tribes (%)
Elderly population (60+ years) (%)
Young people (10-24 years) (%)
Adolescent (10-19 years) (%)
Decadal Growth Rate, 1991-2001 (%)
Population density (per sq. km)
Sex Ratio (females per 1000 males)
1991
2001
Child Sex Ratio (0-6 years) (girls per 1000 boys)
1991
2001
Literacy rate (7+)
Persons
Males
Females
Total work participation rate
Household Amenities, (%), Census 2001
2644
Households with kutchha houses
1.7
Households with safe drinking water
09
Households with electricity connection
02 Vital Rates
1532
Crude Birth Rate, 2001
Total Fertility Rate, 2001
Infant Mortality Rate, 2001
Key RCH Indicators from District Level
Household Survey, 2007-08 (%)
1302005
Girls marrying below 18 years
646438
Birth order 3 and above
655567
Current use of any FP Method
94.4
Total unmet need
5.6
Pregnant women who had at least with 3
ANCs visits during the last pregnancy
20.5
0.5
Institutional delivery
10.8
31.3
22.4
13.2
Children with full immunization
492
Medical/Health Infrastructures/Institutions
1007
1014
CHCs
PHCs
942
Sub-Centres
940
Information on HIV/AIDS
76.8
87.1
HIV+ among ANC clinics (%)
66.7
HIV+ among STD clinics (%)
29.8
Number of Integrated Counseling and Testing
Centres (ICTC formerly VCTC)
Female work participation rate
10.0
Number of Anti Retroviral Therapy (ART) Centres
81.5
73.2
26.1
21.6
2.6
72
1.7
24.0
53.7
31.2
64.9
46.9
73.5
9
44
227
0.0
-
4
-
| 179

19.6 Page 186

▲back to top


Population Foundation of India
dis t ri c t
JAGATSINGHAPUR
Showing CD Blocks
180 |

19.7 Page 187

▲back to top


Population, Health & Social Development in Bihar, Jharkhand, Orissa and West bengal
DISTRICT JAGATSINGHAPUR
General Information
Area (sq. kms.)
Percent to total state’s area
C D blocks
Towns
No. of villages
Demographic Particulars (Census, 2001)
Population
Persons
Males
Females
Rural (%)
Urban (%)
Scheduled Castes (%)
Scheduled Tribes (%)
Elderly population (60+ years) (%)
Young people (10-24 years) (%)
Adolescent (10-19 years) (%)
Decadal Growth Rate, 1991-2001 (%)
Population density (per sq. km)
Sex Ratio (females per 1000 males)
1991
2001
Child Sex Ratio (0-6 years) (girls per 1000 boys)
1991
2001
Literacy rate (7+)
Persons
Males
Females
Total work participation rate
Household Amenities, (%), Census 2001
1668
Households with kutchha houses
1.1
Households with safe drinking water
08
Households with electricity connection
02 Vital Rates
1391
Crude Birth Rate, 2001
Total Fertility Rate, 2001
Infant Mortality Rate, 2001
Key RCH Indicators from District Level
Household Survey, 2007-08 (%)
1057629
Girls marrying below 18 years
538881
Birth order 3 and above
518748
Current use of any FP Method
90.1
Total unmet need
9.8
Pregnant women who had at least with 3
ANCs visits during the last pregnancy
21.1
0.8
Institutional delivery
10.8
36.8
21.5
13.2
Children with full immunization
634
Medical/Health Infrastructures/Institutions
977
963
CHCs
PHCs
942
Sub-Centres
926
Information on HIV/AIDS
79.1
88.6
HIV+ among ANC clinics (%)
69.2
HIV+ among STD clinics (%)
31.2
Number of Integrated Counseling and Testing
Centres (ICTC formerly VCTC)
Female work participation rate
11.5
Number of Anti Retroviral Therapy (ART) Centres
67.0
78.9
20.8
18.8
2.3
66
3.4
12.8
55.8
25.9
86.4
79.8
81.8
6
38
189
0.5
-
3
-
| 181

19.8 Page 188

▲back to top


Population Foundation of India
dis t ri c t
cuttack
Showing CD Blocks
182 |

19.9 Page 189

▲back to top


Population, Health & Social Development in Bihar, Jharkhand, Orissa and West bengal
DISTRICT CUTTACK
General Information
Area (sq. kms.)
Percent to total state’s area
C D blocks
Towns
No. of villages
Demographic Particulars (Census, 2001)
Population
Persons
Males
Females
Rural (%)
Urban (%)
Scheduled Castes (%)
Scheduled Tribes (%)
Elderly population (60+ years) (%)
Young people (10-24 years) (%)
Adolescent (10-19 years) (%)
Decadal Growth Rate, 1991-2001 (%)
Population density (per sq. km)
Sex Ratio (females per 1000 males)
1991
2001
Child Sex Ratio (0-6 years) (girls per 1000 boys)
1991
2001
Literacy rate (7+)
Persons
Males
Females
Total work participation rate
Household Amenities, (%), Census 2001
3932
Households with kutchha houses
2.5
Households with safe drinking water
14
Households with electricity connection
04 Vital Rates
1865
Crude Birth Rate, 2001
Total Fertility Rate, 2001
Infant Mortality Rate, 2001
Key RCH Indicators from District Level
Household Survey, 2007-08 (%)
2347094
Girls marrying below 18 years
1207781
Birth order 3 and above
113313
Current use of any FP Method
72.6
Total unmet need
27.3
Pregnant women who had at least with 3
ANCs visits during the last pregnancy
19.1
3.6
Institutional delivery
9.8
30.7
21.1
14.0
Children with full immunization
595
Medical/Health Infrastructures/Institutions
922
938
CHCs
PHCs
945
Sub-Centres
939
Information on HIV/AIDS
76.6
85.8
HIV+ among ANC clinics (%)
66.9
HIV+ among STD clinics (%)
33.9
Number of Integrated Counseling and Testing
Centres (ICTC formerly VCTC)
Female work participation rate
13.8
Number of Anti Retroviral Therapy (ART) Centres
47
56.4
43.8
19.6
2.4
76
5.6
14.9
58.1
22.1
73.5
68.2
68.6
9
57
332
0.75
2.80
7
1
| 183

19.10 Page 190

▲back to top


Population Foundation of India
dis t ri c t
JAjaPUR
Showing CD Blocks
184 |

20 Pages 191-200

▲back to top


20.1 Page 191

▲back to top


Population, Health & Social Development in Bihar, Jharkhand, Orissa and West bengal
DISTRICT JAJAPUR
General Information
Area (Sq. Kms.)
Percent to total state’s area
C D Blocks
Towns
No. of Villages
Demographic Particulars (Census, 2001)
Population
Persons
Males
Females
Rural (%)
Urban (%)
Scheduled Castes (%)
Scheduled Tribes (%)
Elderly population (60+ years) (%)
Young people (10-24 years) (%)
Adolescent (10-19 years) (%)
Decadal Growth Rate, 1991-2001 (%)
Population density (per sq. km)
Sex Ratio (females per 1000 males)
1991
2001
Child Sex Ratio (0-6 years) (girls per 1000 boys)
1991
2001
Literacy rate (7+)
Persons
Males
Females
Total work participation rate
Household Amenities, (%), Census 2001
2899
Households with kutchha houses
1.9
Households with safe drinking water
10
Households with electricity connection
02 Vital Rates
1781
Crude Birth Rate, 2001
Total Fertility Rate, 2001
Infant Mortality Rate, 2001
Key RCH Indicators from District Level
Household Survey, 2007-08 (%)
1624341
Girls marrying below 18 years
823747
Birth order 3 and above
800594
Current use of any FP Method
95.5
Total unmet need
4.5
Pregnant women who had at least with 3
ANCs visits during the last pregnancy
23.0
7.8
Institutional delivery
8.8
32.1
22.8
17.1
Children with full immunization
560
Medical/Health Infrastructures/Institutions
977
972
CHCs
PHCs
946
Sub-Centres
937
Information on HIV/AIDS
71.4
81.9
HIV+ among ANC clinics (%)
60.7
HIV+ among STD clinics (%)
27.5
Number of Integrated Counseling and Testing
Centres (ICTC formerly VCTC)
Female work participation rate
6.8
Number of Anti Retroviral Therapy (ART) Centres
70.6
43.6
30.0
21.8
2.6
68
5.5
20.8
53.6
25.0
67.7
61.5
82.3
9
56
260
0.25
-
4
-
| 185

20.2 Page 192

▲back to top


Population Foundation of India
dis t ri c t
dhenkanal
Showing CD Blocks
186 |

20.3 Page 193

▲back to top


Population, Health & Social Development in Bihar, Jharkhand, Orissa and West bengal
DISTRICT DHENKANAL
General Information
Area (sq. kms.)
Percent to total state’s area
C D Blocks
Towns
No. of Villages
Demographic Particulars (Census, 2001)
Population
Persons
Males
Females
Rural (%)
Urban (%)
Scheduled Castes (%)
Scheduled Tribes (%)
Elderly population (60+ years) (%)
Young people (10-24 years) (%)
Adolescent (10-19 years) (%)
Decadal Growth Rate, 1991-2001 (%)
Population density (per sq. km)
Sex Ratio (females per 1000 males)
1991
2001
Child Sex Ratio (0-6 years) (girls per 1000 boys)
1991
2001
Literacy rate (7+)
Persons
Males
Females
Total work participation rate
Household Amenities, (%), Census 2001
4452
Households with kutchha houses
2.9
Households with safe drinking water
08
Households with electricity connection
03 Vital Rates
1221
Crude Birth Rate, 2001
Total Fertility Rate, 2001
Infant Mortality Rate, 2001
Key RCH Indicators from District Level
Household Survey, 2007-08 (%)
1066878
Girls marrying below 18 years
544001
Birth order 3 and above
522877
Current use of any FP Method
91.3
Total unmet need
8.7
Pregnant women who had at least with 3
ANCs visits during the last pregnancy
18.5
12.8
Institutional delivery
8.7
30.4
21.3
12.5
Children with full immunization
240
Medical/Health Infrastructures/
Institutions
954
961
CHCs
PHCs
957
Sub-Centres
925
Information on HIV/AIDS
69.4
80.6
HIV+ among ANC clinics (%)
57.8
HIV+ among STD clinics (%)
33.4
Number of Integrated Counseling and Testing
Centres (ICTC formerly VCTC)
Female work participation rate
15.1
Number of Anti Retroviral Therapy (ART) Centres
66.3
31.5
26.1
21.8
2.7
87
12.9
27.4
53.7
24.2
64.8
46.9
61.5
6
36
167
0.0
-
3
-
| 187

20.4 Page 194

▲back to top


Population Foundation of India
dis t ri c t
anugul
Showing CD Blocks
188 |

20.5 Page 195

▲back to top


Population, Health & Social Development in Bihar, Jharkhand, Orissa and West bengal
DISTRICT ANUGUL
General Information
Area (sq. kms.)
Percent to total state’s area
C D Blocks
Towns
No. of Villages
Demographic Particulars (Census, 2001)
Population
Persons
Males
Females
Rural (%)
Urban (%)
Scheduled Castes (%)
Scheduled Tribes (%)
Elderly population (60+ years) (%)
Young people (10-24 years) (%)
Adolescent (10-19 years) (%)
Decadal Growth Rate, 1991-2001 (%)
Population density (per sq. km)
Sex Ratio (females per 1000 males)
1991
2001
Child Sex Ratio (0-6 years) (girls per 1000 boys)
1991
2001
Literacy rate (7+)
Persons
Males
Females
Total work participation rate
Household Amenities, (%), Census 2001
6375
Households with kutchha houses
4.1
Households with safe drinking water
08
Households with electricity connection
02 Vital Rates
1922
Crude Birth Rate, 2001
Total Fertility Rate, 2001
Infant Mortality Rate, 2001
Key RCH Indicators from District Level
Household Survey, 2007-08 (%)
1140003
Girls marrying below 18 years
587234
Birth order 3 and above
552769
Current use of any FP Method
86.1
Total unmet need
13.9
Pregnant women who had at least with 3
ANCs visits during the last pregnancy
17.2
11.7
Institutional delivery
7.4
30.8
21.8
18.6
Children with full immunization
179
Medical/Health Infrastructures/Institutions
942
941
CHCs
PHCs
961
Sub-Centres
937
Information on HIV/AIDS
68.7
81.4
HIV+ among ANC clinics (%)
55.3
HIV+ among STD clinics (%)
39.8
Number of Integrated Counseling and Testing
Centres (ICTC formerly VCTC)
Female work participation rate
26.7
Number of Anti Retroviral Therapy (ART) Centres
53.8
44.0
29.6
23.4
2.9
78
32.3
21.3
51.7
23.9
60.4
40.7
62.0
4
32
166
1.75
-
9
-
| 189

20.6 Page 196

▲back to top


Population Foundation of India
dis t ri c t
nayagarh
Showing CD Blocks
190 |

20.7 Page 197

▲back to top


Population, Health & Social Development in Bihar, Jharkhand, Orissa and West bengal
DISTRICT NAYAGARH
General Information
Area (Sq. Kms.)
Percent to total state’s area
C D Blocks
Towns
No. of Villages
Demographic Particulars (Census, 2001)
Population
Persons
Males
Females
Rural (%)
Urban (%)
Scheduled Castes (%)
Scheduled Tribes (%)
Elderly population (60+ years) (%)
Young people (10-24 years) (%)
Adolescent (10-19 years) (%)
Decadal Growth Rate, 1991-2001 (%)
Population density (per sq. km)
Sex Ratio (females per 1000 males)
1991
2001
Child Sex Ratio (0-6 years) (girls per 1000 boys)
1991
2001
Literacy rate (7+)
Persons
Males
Females
Total work participation rate
Household Amenities, (%), Census 2001
3890
Households with kutchha houses
2.5
Households with safe drinking water
08
Households with electricity connection
02 Vital Rates
1694
Crude Birth Rate, 2001
Total Fertility Rate, 2001
Infant Mortality Rate, 2001
Key RCH Indicators from District Level
Household Survey, 2007-08 (%)
864516
Girls marrying below 18 years
446177
Birth order 3 and above
418339
Current use of any FP Method
95.7
Total unmet need
4.3
Pregnant women who had at least with 3
ANCs visits during the last pregnancy
14.0
5.9
Institutional delivery
10.1
29.3
20.5
18.6
Children with full immunization
179
Medical/Health Infrastructures/
Institutions
958
941
CHCs
PHCs
950
Sub-Centres
937
Information on HIV/AIDS
68.7
82.7
HIV+ among ANC clinics (%)
55.3
HIV+ among STD clinics (%)
33.3
Number of Integrated Counseling and Testing
Centres (ICTC formerly VCTC)
Female work participation rate
11.0
Number of Anti Retroviral Therapy (ART) Centres
52.2
43.9
29.6
23.4
2.9
78
32.3
21.3
51.7
23.9
60.4
40.7
62.0
6
34
166
0.75
-
5
-
| 191

20.8 Page 198

▲back to top


Population Foundation of India
dis t ri c t
khordha
Showing CD Blocks
192 |

20.9 Page 199

▲back to top


Population, Health & Social Development in Bihar, Jharkhand, Orissa and West bengal
DISTRICT KHORDHA
General Information
Area (sq. kms.)
Percent to total state’s area
C D blocks
Towns
No. of villages
Demographic Particulars (Census, 2001)
Population
Persons
Males
Females
Rural (%)
Urban (%)
Scheduled Castes (%)
Scheduled Tribes (%)
Elderly population (60+ years) (%)
Young people (10-24 years) (%)
Adolescent (10-19 years) (%)
Decadal Growth Rate, 1991-2001 (%)
Population density (per sq. km)
Sex Ratio (females per 1000 males)
1991
2001
Child Sex Ratio (0-6 years) (girls per 1000 boys)
1991
2001
Literacy rate (7+)
Persons
Males
Females
Total work participation rate
Household Amenities, (%), Census 2001
2813
Households with kutchha houses
1.8
Households with safe drinking water
10
Households with electricity connection
05 Vital Rates
1567
Crude Birth Rate, 2001
Total Fertility Rate, 2001
Infant Mortality Rate, 2001
Key RCH Indicators from District Level
Household Survey, 2007-08 (%)
1877395
Girls marrying below 18 years
986886
Birth order 3 and above
890509
Current use of any FP Method
57.1
Total unmet need
42.9
Pregnant women who had at least with 3
ANCs visits during the last pregnancy
13.5
5.2
Institutional delivery
8.0
31.0
20.9
24.9
Children with full immunization
667
Medical/Health Infrastructures/Institutions
903
902
CHCs
PHCs
950
Sub-Centres
926
Information on HIV/AIDS
79.5
87.9
HIV+ among ANC clinics (%)
70.3
HIV+ among STD clinics (%)
30.6
Number of Integrated Counseling and Testing
Centres (ICTC formerly VCTC)
Female work participation rate
8.8
Number of Anti Retroviral Therapy (ART) Centres
41.2
52.0
56.5
20.3
2.4
71
13.1
10.2
57.8
27.5
75.9
70.7
71.1
7
63
202
0.25
2.00
12
-
| 193

20.10 Page 200

▲back to top


Population Foundation of India
district
puri
Showing
CD Blocks
194 |

21 Pages 201-210

▲back to top


21.1 Page 201

▲back to top


Population, Health & Social Development in Bihar, Jharkhand, Orissa and West bengal
DISTRICT PURI
General Information
Area (sq. kms.)
Percent to total state’s area
C D blocks
Towns
No. of villages
Demographic Particulars (Census, 2001)
Population
Persons
Males
Females
Rural (%)
Urban (%)
Scheduled Castes (%)
Scheduled Tribes (%)
Elderly population (60+ years) (%)
Young people (10-24 years) (%)
Adolescent (10-19 years) (%)
Decadal Growth Rate, 1991-2001 (%)
Population density (per sq. km)
Sex Ratio (females per 1000 males)
1991
2001
Child Sex Ratio (0-6 years) (girls per 1000 boys)
1991
2001
Literacy rate (7+)
Persons
Males
Females
Total work participation rate
Household Amenities, (%), Census 2001
3479
Households with kutchha houses
2.2
Households with safe drinking water
11
Households with electricity connection
04 Vital Rates
1714
Crude Birth Rate, 2001
Total Fertility Rate, 2001
Infant Mortality Rate, 2001
Key RCH Indicators from District Level
Household Survey, 2007-08 (%)
1502682
Girls marrying below 18 years
763389
Birth order 3 and above
739293
Current use of any FP Method
86.4
Total unmet need
13.5
Pregnant women who had at least with 3
ANCs visits during the last pregnancy
18.2
0.3
Institutional delivery
9.8
30.5
21.1
15.2
Children with full immunization
432
Medical/Health Infrastructures/Institutions
970
968
CHCs
PHCs
945
Sub-Centres
931
Information on HIV/AIDS
77.9
88.1
HIV+ among ANC clinics (%)
67.5
HIV+ among STD clinics (%)
30.0
Number of Integrated Counseling and Testing
Centres (ICTC formerly VCTC)
Female work participation rate
7.7
Number of Anti Retroviral Therapy (ART) Centres
59.7
78.2
30.6
20.2
2.4
87
8.6
17.9
59.0
20.9
72.0
63.8
68.0
9
46
241
0.50
1.20
3
-
| 195

21.2 Page 202

▲back to top


Population Foundation of India
district
ganjam
Showing CD Blocks
196 |

21.3 Page 203

▲back to top


Population, Health & Social Development in Bihar, Jharkhand, Orissa and West bengal
DISTRICT GANJAM
General Information
Household Amenities, (%), Census 2001
Area (Sq. Kms.)
8206
Households with kutchha houses
Percent to total state’s area
5.3
Households with safe drinking water
C D Blocks
22
Households with electricity connection
Towns
18 Vital Rates
No. of Villages
3171
Crude Birth Rate, 2001
Total Fertility Rate, 2001
Demographic Particulars (Census, 2001)
Infant Mortality Rate, 2001
Population
Key RCH Indicators from District Level
Household Survey, 2007-08 (%)
Persons 3160635
Girls marrying below 18 years
Males 1581986
Birth order 3 and above
Females 1578649
Current use of any FP Method
Rural (%)
82.4
Total unmet need
Urban (%)
17.6
Pregnant women who had at least with 3 ANCs
visits during the last pregnancy
Scheduled Castes (%)
18.6
Scheduled Tribes (%)
2.9
Institutional delivery
Elderly population (60+ years) (%)
8.6
Young people (10-24 years) (%)
30.0
Adolescent (10-19 years) (%)
21.6
Decadal Growth Rate, 1991-2001 (%)
16.8
Children with full immunization
Population density (per sq. km)
385
Sex Ratio (females per 1000 males)
Medical/Health Infrastructures/Institutions
1991
1006
2001
998
CHCs
Child Sex Ratio (0-6 years) (girls per 1000 boys)
PHCs
1991
952
Sub-Centres
2001
939
Literacy rate (7+)
Information on HIV/AIDS
Persons
60.7
Males
75.2
HIV+ among ANC clinics (%)
Females
46.4
HIV+ among STD clinics (%)
Total work participation rate
41.3
Number of Integrated Counseling and Testing
Centres (ICTC formerly VCTC)
Female work participation rate
30.9
Number of Anti Retroviral Therapy (ART) Centres
38.3
59.2
33.7
24.0
2.9
86
36.3
23.6
44.5
30.1
66.0
55.4
44.1
19
89
460
3.25
3.60
26
1
| 197

21.4 Page 204

▲back to top


Population Foundation of India
district
gajapati
Showing CD Blocks
198 |

21.5 Page 205

▲back to top


Population, Health & Social Development in Bihar, Jharkhand, Orissa and West bengal
DISTRICT GAJAPATI
General Information
Area (sq. kms.)
Percent to total state’s area
C D blocks
Towns
No. of villages
Demographic Particulars (Census, 2001)
Population
Persons
Males
Females
Rural (%)
Urban (%)
Scheduled Castes (%)
Scheduled Tribes (%)
Elderly population (60+ years) (%)
Young people (10-24 years) (%)
Adolescent (10-19 years) (%)
Decadal Growth Rate, 1991-2001 (%)
Population density (per sq. km)
Sex Ratio (females per 1000 males)
1991
2001
Child Sex Ratio (0-6 years) (girls per 1000 boys)
1991
2001
Literacy rate (7+)
Persons
Males
Females
Total work participation rate
Household Amenities, (%), Census 2001
4325
Households with kutchha houses
2.8
Households with safe drinking water
07
Households with electricity connection
02 Vital Rates
1576
Crude Birth Rate, 2001
Total Fertility Rate, 2001
Infant Mortality Rate, 2001
Key RCH Indicators from District Level
Household Survey, 2007-08 (%)
518837
Girls marrying below 18 years
255423
Birth order 3 and above
263414
Current use of any FP Method
89.9
Total unmet need
10.1
Pregnant women who had at least with 3
ANCs visits during the last pregnancy
7.5
50.8
Institutional delivery
6.5
28.2
20.3
14.1
Children with full immunization
120
Medical/Health Infrastructures/Institutions
1027
1031
CHCs
PHCs
979
Sub-Centres
964
Information on HIV/AIDS
41.2
54.7
HIV+ among ANC clinics (%)
28.4
HIV+ among STD clinics (%)
53.1
Number of Integrated Counseling and Testing
Centres (ICTC formerly VCTC)
Female work participation rate
49.7
Number of Anti Retroviral Therapy (ART) Centres
57.2
45.2
16.9
27.6
3.3
116
13.6
43.0
37.7
12.1
71.8
19.9
42.9
5
20
136
-
-
3
-
| 199

21.6 Page 206

▲back to top


Population Foundation of India
district
kandhamal
Showing CD Blocks
200 |

21.7 Page 207

▲back to top


Population, Health & Social Development in Bihar, Jharkhand, Orissa and West bengal
DISTRICT KANDHAMAL
General Information
Area (sq. kms.)
Percent to total state’s area
C D Blocks
Towns
No. of Villages
Demographic Particulars (Census, 2001)
Population
Persons
Males
Females
Rural (%)
Urban (%)
Scheduled Castes (%)
Scheduled Tribes (%)
Elderly population (60+ years) (%)
Young people (10-24 years) (%)
Adolescent (10-19 years) (%)
Decadal Growth Rate, 1991-2001 (%)
Population density (per sq. km)
Sex Ratio (females per 1000 males)
1991
2001
Child Sex Ratio (0-6 years) (girls per 1000 boys)
1991
2001
Literacy rate (7+)
Persons
Males
Females
Total work participation rate
Household Amenities, (%), Census 2001
8021
Households with kutchha houses
5.2
Households with safe drinking water
12
Households with electricity connection
02 Vital Rates
2515
Crude Birth Rate, 2001
Total Fertility Rate, 2001
Infant Mortality Rate, 2001
Key RCH Indicators from District Level
Household Survey, 2007-08 (%)
648201
Girls marrying below 18 years
322799
Birth order 3 and above
325402
Current use of any FP Method
93.2
Total unmet need
6.8
Pregnant women who had at least with 3
ANCs visits during the last pregnancy
16.9
52.0
Institutional delivery
6.4
28.3
20.8
18.6
Children with full immunization
81
Medical/Health Infrastructures/Institutions
999
1008
CHCs
PHCs
990
Sub-Centres
970
Information on HIV/AIDS
52.8
69.8
HIV+ among ANC clinics (%)
35.8
HIV+ among STD clinics (%)
47.2
Number of Integrated Counseling and Testing
Centres (ICTC formerly VCTC)
Female work participation rate
42.2
Number of Anti Retroviral Therapy (ART) Centres
58.5
34.4
11.6
30.8
3.6
121
31.4
33.6
32.3
27.8
52.9
25.3
51.4
8
39
172
0.0
-
3
-
| 201

21.8 Page 208

▲back to top


Population Foundation of India
dis t ri c t
baudh
Showing
CD Blocks
202 |

21.9 Page 209

▲back to top


Population, Health & Social Development in Bihar, Jharkhand, Orissa and West bengal
DISTRICT BAUDH
General Information
Area (sq. kms.)
Percent to total state’s area
C D blocks
Towns
No. of villages
Demographic Particulars (Census, 2001)
Population
Persons
Males
Females
Rural (%)
Urban (%)
Scheduled Castes (%)
Scheduled Tribes (%)
Elderly population (60+ years) (%)
Young people (10-24 years) (%)
Adolescent (10-19 years) (%)
Decadal Growth Rate, 1991-2001 (%)
Population density (per sq. km)
Sex Ratio (females per 1000 males)
1991
2001
Child Sex Ratio (0-6 years) (girls per 1000 boys)
1991
2001
Literacy rate (7+)
Persons
Males
Females
Total work participation rate
Household Amenities, (%), Census 2001
3098
Households with kutchha houses
2.0
Households with safe drinking water
03
Households with electricity connection
01 Vital Rates
1156
Crude Birth Rate, 2001
Total Fertility Rate, 2001
Infant Mortality Rate, 2001
Key RCH Indicators from District Level
Household Survey, 2007-08 (%)
373372
Girls marrying below 18 years
188155
Birth order 3 and above
185217
Current use of any FP Method
95.2
Total unmet need
4.8
Pregnant women who had at least with 3
ANCs visits during the last pregnancy
21.9
12.5
Institutional delivery
8.0
28.6
20.3
17.5
Children with full immunization
121
Medical/Health Infrastructures/Institutions
987
984
CHCs
PHCs
1004
Sub-Centres
966
Information on HIV/AIDS
57.7
76.2
HIV+ among ANC clinics (%)
39.0
HIV+ among STD clinics (%)
45.7
Number of Integrated Counseling and Testing
Centres (ICTC formerly VCTC)
Female work participation rate
35.5
Number of Anti Retroviral Therapy (ART) Centres
81.7
64.7
12.6
27.4
3.2
100
41.1
33.8
32.4
20.3
58.5
28.7
44.5
1
12
67
0.0
-
2
-
| 203

21.10 Page 210

▲back to top


Population Foundation of India
dis t ri c t
sonapur
Showing CD Blocks
204 |

22 Pages 211-220

▲back to top


22.1 Page 211

▲back to top


Population, Health & Social Development in Bihar, Jharkhand, Orissa and West bengal
DISTRICT SONAPUR
General Information
Area (sq. kms.)
Percent to total state’s area
C D Blocks
Towns
No. of Villages
Demographic Particulars (Census, 2001)
Population
Persons
Males
Females
Rural (%)
Urban (%)
Scheduled Castes (%)
Scheduled Tribes (%)
Elderly population (60+ years) (%)
Young people (10-24 years) (%)
Adolescent (10-19 years) (%)
Decadal Growth Rate, 1991-2001 (%)
Population density (per sq. km)
Sex Ratio (females per 1000 males)
1991
2001
Child Sex Ratio (0-6 years) (girls per 1000 boys)
1991
2001
Persons
Males
Females
Total work participation rate
Household Amenities, (%), Census 2001
2337
Households with kutchha houses
1.5
Households with safe drinking water
06
Households with electricity connection
03 Vital Rates
959
Crude Birth Rate, 2001
Total Fertility Rate, 2001
Infant Mortality Rate, 2001
Key RCH indicators from District Level
Household Survey, 2007-08 (%)
541835
Girls marrying below 18 years
275601
Birth order 3 and above
266234
Current use of any FP Method
92.6
Total unmet need
7.4
Pregnant women who had at least with 3
ANCs visits during the last pregnancy
23.6
9.8
Institutional delivery
9.0
30.8
22.5
13.6
Children with full immunization
232
Medical/Health Infrastructures/Institutions
979
966
CHCs
PHCs
972
Sub-Centres
967
Information on HIV/AIDS
62.8
78.9
HIV+ among ANC clinics (%)
46.1
HIV+ among STD clinics (%)
43.7
Number of Integrated Counseling and Testing
Centres (ICTC formerly VCTC)
Female work participation rate
32.8
Number of Anti Retroviral Therapy (ART) Centres
60.3
76.2
18.5
22.7
2.8
69
35.1
26.1
33.7
37.4
71.0
41.0
81.4
5
18
89
0.0
-
3
-
| 205

22.2 Page 212

▲back to top


Population Foundation of India
dis t ri c t
balangir
Showing CD Blocks
206 |

22.3 Page 213

▲back to top


Population, Health & Social Development in Bihar, Jharkhand, Orissa and West bengal
DISTRICT BALANGIR
General Information
Area (sq. kms.)
Percent to total state’s area
C D blocks
Towns
No. of villages
Demographic Particulars (Census, 2001)
Population
Persons
Males
Females
Rural (%)
Urban (%)
Scheduled Castes (%)
Scheduled Tribes (%)
Elderly population (60+ years) (%)
Young people (10-24 years) (%)
Adolescent (10-19 years) (%)
Decadal Growth Rate, 1991-2001 (%)
Population density (per sq. km)
Sex Ratio (females per 1000 males)
1991
2001
Child Sex Ratio (0-6 years) (girls per 1000 boys)
1991
2001
Literacy rate (7+)
Persons
Males
Females
Total work participation rate
Household Amenities, (%), Census 2001
6575
Households with kutchha houses
4.2
Households with safe drinking water
14
Households with electricity connection
04 Vital Rates
1794
Crude Birth Rate, 2001
Total Fertility Rate, 2001
Infant Mortality Rate, 2001
Key RCH Indicators from District Level
Household Survey, 2007-08 (%)
1337194
Girls marrying below 18 years
673985
Birth order 3 and above
663209
Current use of any FP Method
88.4
Total unmet need
11.6
Pregnant women who had at least with 3
ANCs visits during the last pregnancy
16.9
20.6
Institutional delivery
9.4
28.9
20.8
8.6
Children with full immunization
203
Medical/Health Infrastructures/Institutions
981
984
CHCs
PHCs
976
Sub-Centres
967
Information on HIV/AIDS
55.7
71.7
HIV+ among ANC clinics (%)
39.5
HIV+ among STD clinics (%)
41.9
Number of Integrated Counseling and Testing
Centres (ICTC formerly VCTC)
Female work participation rate
28.4
Number of Anti Retroviral Therapy (ART) Centres
22.7
73.7
15.1
22.9
2.8
87
19.5
21.0
38.8
28.8
50.2
52.1
40.7
8
44
226
1.25
-
15
-
| 207

22.4 Page 214

▲back to top


Population Foundation of India
dis t ri c t
nuapada
Showing CD Blocks
208 |

22.5 Page 215

▲back to top


Population, Health & Social Development in Bihar, Jharkhand, Orissa and West bengal
DISTRICT NUAPADA
General Information
Area (sq. kms.)
Percent to total state’s area
C D blocks
Towns
No. of villages
Demographic Particulars (Census, 2001)
Population
Persons
Males
Females
Rural (%)
Urban (%)
Scheduled Castes (%)
Scheduled Tribes (%)
Elderly population (60+ years) (%)
Young people (10-24 years) (%)
Adolescent (10-19 years) (%)
Decadal Growth Rate, 1991-2001 (%)
Population density (per sq. km)
Sex Ratio (females per 1000 males)
1991
2001
Child Sex Ratio (0-6 years) (girls per 1000 boys)
1991
2001
Literacy rate (7+)
Persons
Males
Females
Total work participation rate
Household Amenities, (%), Census 2001
3852
Households with kutchha houses
2.5
Households with safe drinking water
05
Households with electricity connection
02 Vital Rates
659
Crude Birth Rate, 2001
Total Fertility Rate, 2001
Infant Mortality Rate, 2001
Key RCH Indicators from District Level
Household Survey, 2007-08 (%)
530690
Girls marrying below 18 years
264396
Birth order 3 and above
266294
Current use of any FP Method
94.3
Total unmet need
5.7
Pregnant women who had at least with 3
ANCs visits during the last pregnancy
13.6
34.7
Institutional delivery
9.2
27.8
20.1
13.0
Children with full immunization
138
Medical/Health Infrastructures/Institutions
1002
1007
CHCs
PHCs
999
Sub-Centres
969
Information on HIV/AIDS
42.0
58.5
HIV+ among ANC clinics (%)
25.7
HIV+ among STD clinics (%)
46.0
Number of Integrated Counseling and Testing
Centres (ICTC formerly VCTC)
Female work participation rate
36.8
Number of Anti Retroviral Therapy (ART) Centres
5.9
84.2
13.2
25.9
3.0
91
21.7
25.8
31.4
32.5
59.4
28.7
57.4
4
17
95
-
-
4
-
| 209

22.6 Page 216

▲back to top


Population Foundation of India
dis t ri c t
kalahandi
Showing CD Blocks
210 |

22.7 Page 217

▲back to top


Population, Health & Social Development in Bihar, Jharkhand, Orissa and West bengal
DISTRICT KALAHANDI
General Information
Area (sq. kms.)
Percent to total state’s area
C D Blocks
Towns
No. of Villages
Demographic Particulars (Census, 2001)
Population
Persons
Males
Females
Rural (%)
Urban (%)
Scheduled Castes (%)
Scheduled Tribes (%)
Elderly population (60+ years) (%)
Young people (10-24 years) (%)
Adolescent (10-19 years) (%)
Decadal Growth Rate, 1991-2001 (%)
Population density (per sq. km)
Sex Ratio (females per 1000 males)
1991
2001
Child Sex Ratio (0-6 years) (girls per
1000 boys)
1991
2001
Literacy rate (7+)
Persons
Males
Females
Total work participation rate
Household Amenities, (%), Census 2001
7920
Households with kutchha houses
5.1
Households with safe drinking water
13
Households with electricity connection
3 Vital Rates
2205
Crude Birth Rate, 2001
Total Fertility Rate, 2001
Infant Mortality Rate, 2001
Key RCH Indicators from District Level
Household Survey, 2007-08 (%)
1335494
Girls marrying below 18 years
667526
Birth order 3 and above
667968
Current use of any FP Method
92.5
Total unmet need
7.5
Pregnant women who had at least with 3
ANCs visits during the last pregnancy
17.7
28.6
Institutional delivery
8.1
27.1
19.3
18.0
Children with full immunization
169
Medical/Health Infrastructures/
Institutions
999
1001
CHCs
PHCs
1003
Sub-Centres
984
Information on HIV/AIDS
45.9
62.7
HIV+ among ANC clinics (%)
29.2
HIV+ among STD clinics (%)
46.5
Number of Integrated Counseling and Testing
Centres (ICTC formerly VCTC)
Female work participation rate
35.9
Number of Anti Retroviral Therapy (ART) Centres
7.7
82.5
13.2
26.8
3.2
105
29.9
41.8
28.9
34.9
61.4
27.3
43.2
10
43
242
0.0
-
4
-
| 211

22.8 Page 218

▲back to top


Population Foundation of India
dis t ri c t
rayagada
Showing CD Blocks
212 |

22.9 Page 219

▲back to top


Population, Health & Social Development in Bihar, Jharkhand, Orissa and West bengal
DISTRICT RAYAGADA
General Information
Area (Sq. Kms.)
Percent to total state’s area
C D Blocks
Towns
No. of Villages
Demographic Particulars (Census, 2001)
Population
Persons
Males
Females
Rural (%)
Urban (%)
Scheduled Castes (%)
Scheduled Tribes (%)
Elderly population (60+ years) (%)
Young people (10-24 years) (%)
Adolescent (10-19 years) (%)
Decadal Growth Rate, 1991-2001 (%)
Population density (per sq. km)
Sex Ratio (females per 1000 males)
1991
2001
Child Sex Ratio (0-6 years) (girls per 1000 boys)
1991
2001
Literacy rate (7+)
Persons
Males
Females
Total work participation rate
Household Amenities, (%), Census 2001
7073
Households with kutchha houses
4.5
Households with safe drinking water
11
Households with electricity connection
3 Vital Rates
2667
Crude Birth Rate, 2001
Total Fertility Rate, 2001
Infant Mortality Rate, 2001
Key RCH Iindicators from District Level
Household Survey, 2007-08 (%)
831109
Girls marrying below 18 years
409792
Birth order 3 and above
421317
Current use of any FP Method
86.2
Total unmet need
13.8
Pregnant women who had at least with 3
ANCs visits during the last pregnancy
13.9
55.8
Institutional delivery
5.9
27.2
19.2
16.4
Children with full immunization
118
Medical/Health Infrastructures/Institutions
1012
1028
CHCs
PHCs
1005
Sub-Centres
981
Information on HIV/AIDS
36.1
48.2
HIV+ among ANC clinics (%)
24.5
HIV+ among STD clinics (%)
48.0
Number of Integrated Counseling and Testing
Centres (ICTC formerly VCTC)
Female work participation rate
41.3
Number of Anti Retroviral Therapy (ART) Centres
53.7
79.5
18.2
28.5
3.3
119
35.2
35.3
35.8
26.5
59.4
18.1
26.8
5
40
235
0.5
-
5
-
| 213

22.10 Page 220

▲back to top


Population Foundation of India
dis t ri c t
nabarangapur
Showing CD Blocks
214 |

23 Pages 221-230

▲back to top


23.1 Page 221

▲back to top


Population, Health & Social Development in Bihar, Jharkhand, Orissa and West bengal
DISTRICT NABARANGAPUR
General Information
Area (sq. kms.)
Percent to total state’s area
C D blocks
Towns
No. of villages
Demographic Particulars (Census, 2001)
Population
Persons
Males
Females
Rural (%)
Urban (%)
Scheduled Castes (%)
Scheduled Tribes (%)
Elderly population (60+ years) (%)
Young people (10-24 years) (%)
Adolescent (10-19 years) (%)
Decadal Growth Rate, 1991-2001 (%)
Population density (per sq. km)
Sex Ratio (females per 1000 males)
1991
2001
Child Sex Ratio (0-6 years) (girls per 1000 boys)
1991
2001
Literacy rate (7+)
Persons
Males
Females
Total work participation rate
Household Amenities, (%), Census 2001
5291
Households with kutchha houses
3.4
Households with safe drinking water
10
Households with electricity connection
02 Vital Rates
897
Crude Birth Rate, 2001
Total Fertility Rate, 2001
Infant Mortality Rate, 2001
Key RCH Indicators from District Level
Household Survey, 2007-08 (%)
1025766
Girls marrying below 18 years
515162
Birth order 3 and above
510604
Current use of any FP Method
94.2
Total unmet need
5.8
Pregnant women who had at least with 3
ANCs visits during the last pregnancy
14.1
55.0
Institutional delivery
6.1
27.9
20.2
21.1
Children with full immunization
194
Medical/Health Infrastructures/
Institutions
989
991
CHCs
PHCs
999
Sub-Centres
949
Information on HIV/AIDS
33.9
47.0
HIV+ among ANC clinics (%)
20.6
HIV+ among STD clinics (%)
49.5
Number of Integrated Counseling and Testing
Centres (ICTC formerly VCTC)
Female work participation rate
42.4
Number of Anti Retroviral Therapy (ART) Centres
46.9
79.4
7.8
30.0
3.4
120
49.8
39.2
33.4
26.5
72.8
15.9
38.2
7
40
289
-
-
3
-
| 215

23.2 Page 222

▲back to top


Population Foundation of India
dis t ri c t
koraput
Showing CD Blocks
216 |

23.3 Page 223

▲back to top


Population, Health & Social Development in Bihar, Jharkhand, Orissa and West bengal
DISTRICT KORAPUT
General Information
Area (sq. kms.)
Percent to total state’s area
C D blocks
Towns
No. of villages
Demographic Particulars (Census, 2001)
Population
Persons
Males
Females
Rural (%)
Urban (%)
Scheduled Castes (%)
Scheduled Tribes (%)
Elderly population (60+ years) (%)
Young people (10-24 years) (%)
Adolescent (10-19 years) (%)
Decadal Growth Rate, 1991-2001 (%)
Population density (per sq. km)
Sex Ratio (females per 1000 males)
1991
2001
Child Sex Ratio (0-6 years) (girls per 1000 boys)
1991
2001
Literacy rate (7+)
Persons
Males
Females
Total work participation rate
Household Amenities, (%), Census 2001
8807
Households with kutchha houses
5.7
Households with safe drinking water
14
Households with electricity connection
04 Vital Rates
1997
Crude Birth Rate, 2001
Total Fertility Rate, 2001
Infant Mortality Rate, 2001
Key RCH Indicators from District Level
Household Survey, 2007-08 (%)
1180637
Girls marrying below 18 years
590743
Birth order 3 and above
589894
Current use of any FP Method
83.1
Total unmet need
16.8
Pregnant women who had at least with 3
ANCs visits during the last pregnancy
13.0
49.6
Institutional delivery
5.6
26.8
18.9
14.6
Children with full immunization
134
Medical/Health Infrastructures/Institutions
991
999
CHCs
PHCs
1019
Sub-Centres
983
Information on HIV/AIDS
35.7
47.2
HIV+ among ANC clinics (%)
24.7
HIV+ among STD clinics (%)
48.3
Number of Integrated Counseling and Testing
Centres (ICTC formerly VCTC)
Female work participation rate
40.4
Number of Anti Retroviral Therapy (ART) Centres
49
67.1
18.2
27.3
3.1
98
1.1
22.9
38.0
23.7
53.1
19.1
58.9
9
51
307
-
-
11
-
| 217

23.4 Page 224

▲back to top


Population Foundation of India
dis t ri c t
malkangiri
Showing CD Blocks
218 |

23.5 Page 225

▲back to top


Population, Health & Social Development in Bihar, Jharkhand, Orissa and West bengal
DISTRICT MALKANGIRI
General Information
Area (sq. kms.)
Percent to total state’s area
C D blocks
Towns
No. of villages
Demographic Particulars (Census, 2001)
Population
Persons
Males
Females
Rural (%)
Urban (%)
Scheduled Castes (%)
Scheduled Tribes (%)
Elderly population (60+ years) (%)
Young people (10-24 years) (%)
Adolescent (10-19 years) (%)
Decadal Growth Rate, 1991-2001 (%)
Population density (per sq. km)
Sex Ratio (females per 1000 males)
1991
2001
Child Sex Ratio (0-6 years) (girls per 1000 boys)
1991
2001
Literacy rate (7+)
Persons
Males
Females
Total work participation rate
Household Amenities, (%), Census 2001
5791
Households with kutchha houses
3.7
Households with safe drinking water
07
Households with electricity connection
02 Vital Rates
928
Crude Birth Rate, 2001
Total Fertility Rate, 2001
Infant Mortality Rate, 2001
Key RCH Indicators from District Level
Household Survey, 2007-08 (%)
504198
Girls marrying below 18 years
252507
Birth order 3 and above
251691
Current use of any FP Method
93.1
Total unmet need
6.8
Pregnant women who had at least with 3
ANCs visits during the last pregnancy
21.4
57.4
Institutional delivery
5.7
28.5
20.5
19.3
Children with full immunization
87
Medical/Health Infrastructures/Institutions
985
997
CHCs
PHCs
1000
Sub-Centres
982
Information on HIV/AIDS
30.5
40.1
HIV+ among ANC clinics (%)
20.5
HIV+ among STD clinics (%)
49.1
Number of Integrated Counseling and Testing
Centres (ICTC formerly VCTC)
Female work participation rate
42.3
Number of Anti Retroviral Therapy (ART) Centres
48.2
67.1
10.0
28.8
3.3
120
50.2
41.4
32.4
24.0
41.9
14.8
35.1
5
28
158
-
-
2
-
| 219

23.6 Page 226

▲back to top


WEST BENGAL
at a glance

23.7 Page 227

▲back to top


Population Foundation of India
West Bengal
Showing Districts
222 |

23.8 Page 228

▲back to top


Population, Health & Social Development in Bihar, Jharkhand, Orissa and West bengal
STATE PROFILE
WEST BENGAL
Key Demographic, Health and RCH Indicators at a glance
General Information
Area (sq kms)
No. of Districts
No. of CD Blocks
No. of Villages
No. of Towns
Demographic Particulars (Census, 2001)
Population
Persons
Males
Females
Rural (%)
Urban (%)
Scheduled Castes (%)
Scheduled Tribes (%)
Elderly population (60+ years) (%)
Young people (10-24 years) (%)
Adolescent (10-19 years) (%)
Decadal Growth Rate, 1991-2001 (%)
Population density (per sq. km)
Sex Ratio (females per 1000 males)
Child Sex Ratio (0-6 years) (girls per 1000 boys)
Literacy rate
Persons
Males
Females
Work participation rate
Female work participation rate
Proportion of people living below poverty line (2004-05)
Per capita net state domestic product at current prices in rupees, 2005-06
Human Development Index (HDI), 2001 (among 26 states)
Value
Rank
Social Development Index (SDI), 2001 (among 16 major states)
Rural
Value
Rank
Urban
Value
Rank
Household Amenities (%), Census 2001
Households with kutchha houses
Households with safe drinking water
Households with electricity connection
Vital Indices
Crude Birth Rate (CBR), 2008, SRS
Total Fertility Rate (TFR), 2007, SRS
88752
18
341
37945
126
80176197
41465985
38710212
72.0
28.0
23.0
5.5
7.5
30.2
21.4
17.7
903
934
960
68.6
77.0
59.6
36.8
18.3
20.6
20485
0.636
13
33.82
14
52.31
07
22.2
88.5
37.5
17.5
1.9
| 223

23.9 Page 229

▲back to top


Population Foundation of India
Age Specific Fertility Rates, 2007, SRS
15-19 years
20-24 years
25-29 years
30-34 years
35-39 years
40-44 years
45-49 years
General Fertility Rate, 2007,SRS
Gross Reproduction Rate, 2007, SRS
Life Expectancy at Birth, 2002-2006, SRS
Crude Death Rate (CDR), 2008, SRS
Maternal Mortality Ratio (MMR), 2004-06, RGI
Child mortality Rate, 2007, SRS
Infant Mortality Rate (IMR), 2008, SRS
Neo-natal mortality rate, 2007, SRS
Early neo-natal mortality rate, 2007, SRS
Late neo-natal mortality rate, 2007, SRS
Post neo-natal mortality rate, 2007, SRS
Peri-natal mortality rate, 2007, SRS
Still birth rate, 2007, SRS
Key RCH and Nutrition Indicators (%)
Girls marrying below 18 years, DLHS, 2007-08
Women age 20-24 reporting birth of order 2 & above, DLHS, 2007-08
Current use of any FP method, DLHS, 2007-08
Total unmet need, DLHS, 2007-08
Pregnant women with any ANC, DLHS, 2007-08
Pregnant women with 3 + ANCs, DLHS, 2007-08
Mother who consumed 100 IFA tablets, DLHS, 2007-08
Safe delivery, DLHS, 2007-08
Institutional delivery, DLHS, 2007-08
Children with full immunization (12-35 months), DLHS, 2007-08
Children under 3 years who are underweight, NFHS-3, 2005-06
Children under 3 years who are stunted, NFHS-3, 2005-06
Children under 3 years who are wasted, NFHS-3, 2005-06
Children age 6-35 months who are anaemic, NFHS-3, 2005-06
Ever married women age 15-49 years who are anaemic, NFHS-3, 2005-06
Medical/Health Infrastructures/Institutions
Number of Hospitals
Community Health Centres (CHCs)
Primary Health Centres (PHCs)
Sub Centres (SCs)
Information on HIV/AIDS (%)
Women who have heard of HIV/AIDS, NFHS-3, 2005-06
Men who have heard of HIV/AIDS, NFHS-3, 2005-06
Women who know that consistent condom use can reduce the chances of getting HIV/AIDS, NFHS-3,
2005-06
Men who know that consistent condom use can reduce the chances of getting HIV/AIDS, NFHS-3,
2005-06
HIV+ among ANC clinics (%)
HIV+ among STD clinics (%)
Number of Integrated Counseling and Testing Centres (ICTC formerly VCTC)
Number of Prevention of Parent To Child Transmission Centres (PPTCTC)
Number of Anti Retroviral Therapy (ART) Centres
224 |
67.0
163.6
95.6
42.1
13.6
4.2
1.7
66.3
1.0
64.9
6.2
141
9
35
28
23
5
9
30
8
41.3
44.2
72.7
11.6
96.1
67.0
22.4
51.6
49.2
75.8
38.7
44.6
16.9
61.0
63.2
15
349
924
10356
53.7
79.0
30.4
58.9
0.38
1.69
142
6

23.10 Page 230

▲back to top


districts
at a glance
| 225

24 Pages 231-240

▲back to top


24.1 Page 231

▲back to top


Population Foundation of India
Dd i astrr ijc itling
Showing CD Blocks
226 |

24.2 Page 232

▲back to top


Population, Health & Social Development in Bihar, Jharkhand, Orissa and West bengal
DISTRICT Darjiling
General Information
Household Amenities, (%), Census 2001
Area (sq. kms.)
3149
Households with kutchha houses
Percent to total state’s area
3.5
Households with safe drinking water
C D blocks
12
Households with electricity connection
Towns
05 Vital Rates
No. of villages
640
Crude Birth Rate, 2001
Total Fertility Rate, 2001
Demographic Particulars (Census, 2001)
Population
Persons 1609172
Infant Mortality Rate, 2001
Key RCH Indicators from District Level
Household Survey, 2007-08 (%)
Girls marrying below 18 years
Males 830644
Birth order 3 and above
Females 778528
Current use of any FP Method
Rural (%)
67.7
Total unmet need
Urban (%)
Scheduled Castes (%)
32.3 Pregnant women who had at least with 3 ANCs
16.1
visits during the last pregnancy
Scheduled Tribes (%)
12.7
Elderly population (60+ years) (%)
6.6
Young people (10-24 years) (%)
32.5
Institutional delivery
Adolescent (10-19 years) (%)
22.9
Decadal Growth Rate, 1991-2001 (%)
23.8
Children with full immunization
Population density (per sq. km)
511
Sex Ratio (females per 1000 males)
Medical/Health Infrastructures/
Institutions
1991
914
2001
937
CHCs
Child Sex Ratio (0-6 years) (girls per 1000 boys)
PHCs
1991
976
Sub-Centres
2001
962
Literacy rate (7+)
Information on HIV/AIDS
Persons
71.8
Males
80.1
HIV+ among ANC clinics (%)
Females
Total work participation rate
63.0
HIV+ among STD clinics (%)
35.4
Number of Integrated Counseling and Testing
Centres (ICTC formerly VCTC)
Female work participation rate
21.4
Number of Anti Retroviral Therapy (ART) Centres
14.5
41.1
54.8
19.6
2.1
55
25.1
13.3
67.0
13.0
70.4
72.4
86.2
11
22
230
0.0
2.17
10
1
| 227

24.3 Page 233

▲back to top


Population Foundation of India
dJiAstLrPi cAt IGURI
Showing CD Blocks
228 |

24.4 Page 234

▲back to top


Population, Health & Social Development in Bihar, Jharkhand, Orissa and West bengal
DISTRICT JALPAIGURI
General Information
Area (sq. kms.)
Household Amenities, (%), Census 2001
6227
Households with kutchha houses
Percent to total state’s area
7.0
C D blocks
13
Households with safe drinking water
Households with electricity connection
Towns
No. of villages
04 Vital Rates
742
Crude Birth Rate, 2001
Total Fertility Rate, 2001
Demographic Particulars (Census, 2001)
Population
Persons 3401173
Infant Mortality Rate, 2001
Key RCH Indicators from District Level
Household Survey, 2007-08 (%)
Girls marrying below 18 years
Males 1751145
Females 1650028
Rural (%)
82.2
Birth order 3 and above
Current use of any FP Method
Total unmet need
Urban (%)
Scheduled Castes (%)
17.8 Pregnant women who had at least with 3 ANCs
36.7
visits during the last pregnancy
Scheduled Tribes (%)
18.9
Elderly population (60+ years) (%)
6.1
Young people (10-24 years) (%)
31.0
Institutional delivery
Adolescent (10-19 years) (%)
22.5
Decadal Growth Rate, 1991-2001 (%)
21.5
Children with full immunization
Population density (per sq. km)
Sex Ratio (females per 1000 males)
1991
546
Medical/Health Infrastructures/
Institutions
927
2001
942
Child Sex Ratio (0-6 years) (girls per 1000 boys)
CHCs
PHCs
1991
2001
Literacy rate (7+)
973
969
Information on HIV/AIDS
Sub-Centres
Persons
62.9
Males
72.8
HIV+ among ANC clinics (%)
Females
Total work participation rate
52.2
HIV+ among STD clinics (%)
38.3
Number of Integrated Counseling and Testing
Centres (ICTC formerly VCTC)
Female work participation rate
23.5
Number of Anti Retroviral Therapy (ART) Centres
23.2
48.1
32.2
24.9
2.8
69
17.5
23.4
68.5
13.3
72.7
48.4
78.4
14
39
537
-
0.80
6
-
| 229

24.5 Page 235

▲back to top


Population Foundation of India
Kd i sOtCr iHc t BIHAR
Showing CD Blocks
230 |

24.6 Page 236

▲back to top


Population, Health & Social Development in Bihar, Jharkhand, Orissa and West bengal
DISTRICT KOCH BIHAR
General Information
Household Amenities, (%), Census 2001
Area (sq. kms.)
3387
Households with kutchha houses
Percent to total state’s area
3.8
Households with safe drinking water
C D blocks
12
Households with electricity connection
Towns
06 Vital Rates
No. of villages
1138
Crude Birth Rate, 2001
Total Fertility Rate, 2001
Demographic Particulars (Census, 2001)
Infant Mortality Rate, 2001
Population
Key RCH Indicators from District Level
Household Survey, 2007-08 (%)
Persons 2479155
Girls marrying below 18 years
Males 1272094
Birth order 3 and above
Females 1207061
Current use of any FP Method
Rural (%)
90.9
Total unmet need
Urban (%)
Scheduled Castes (%)
9.1 Pregnant women who had at least with 3 ANCs
50.1
visits during the last pregnancy
Scheduled Tribes (%)
0.6
Elderly population (60+ years) (%)
6.9
Young people (10-24 years) (%)
30.0
Institutional delivery
Adolescent (10-19 years) (%)
22.0
Decadal Growth Rate, 1991-2001 (%)
14.1
Children with full immunization
Population density (per sq. km)
Sex Ratio (females per 1000 males)
1991
732
Medical/Health Infrastructures/
Institutions
935
2001
949
CHCs
Child Sex Ratio (0-6 years) (girls per 1000 boys)
PHCs
1991
967
Sub-Centres
2001
964
Literacy rate (7+)
Information on HIV/AIDS
Persons
66.3
Males
75.9
HIV+ among ANC clinics (%)
Females
Total work participation rate
56.1
HIV+ among STD clinics (%)
39.0
Number of Integrated Counseling and Testing
Centres (ICTC formerly VCTC)
Female work participation rate
22.2
Number of Anti Retroviral Therapy (ART) Centres
28.3
85.9
12.8
25.5
3.0
76
45.8
21.7
71.2
10.2
59.0
46.4
78.0
13
29
406
0.0
-
6
-
| 231

24.7 Page 237

▲back to top


Population Foundation of India
d i st r i c t
UTTAR DINAJPUR
Showing CD Blocks
232 |

24.8 Page 238

▲back to top


Population, Health & Social Development in Bihar, Jharkhand, Orissa and West bengal
DISTRICT UTTAR DINAJPUR
General Information
Household Amenities, (%), Census 2001
Area (sq. kms.)
Percent to total state’s area
C D blocks
Towns
No. of villages
3140
Households with kutchha houses
3.5
Households with safe drinking water
09
Households with electricity connection
04 Vital Rates
1477
Crude Birth Rate, 2001
Demographic Particulars (Census, 2001)
Population
Persons 2441794
Males 1259737
Females 1182057
Total Fertility Rate, 2001
Infant Mortality Rate, 2001
Key RCH Indicators from District Level
Household Survey, 2007-08 (%)
Girls marrying below 18 years
Birth order 3 and above
Current use of any FP Method
Rural (%)
Urban (%)
Scheduled Castes (%)
Scheduled Tribes (%)
Elderly population (60+ years) (%)
Young people (10-24 years) (%)
Adolescent (10-19 years) (%)
Decadal Growth Rate, 1991-2001 (%)
Population density (per sq. km)
Sex Ratio (females per 1000 males)
1991
87.9
Total unmet need
12.1 Pregnant women who had at least with 3 ANCs
27.7
visits during the last pregnancy
5.1
5.1
Institutional delivery
28.7
21.2
28.7
Children with full immunization
778
Medical/Health Infrastructures/
Institutions
921
2001
Child Sex Ratio (0-6 years) (girls per 1000 boys)
1991
2001
Literacy rate
938
966
965
Information on HIV/AIDS
CHCs
PHCs
Sub-Centres
Persons
Males
Females
Total work participation rate
47.9
58.5
HIV+ among ANC clinics (%)
36.5
HIV+ among STD clinics (%)
38.3
Number of Integrated Counseling and Testing
Centres (ICTC formerly VCTC)
Female work participation rate
23.8
Number of Anti Retroviral Therapy (ART) Centres
37.0
93.9
14.5
35.1
4.3
64
39.1
41.0
51.8
19.8
53.3
27.6
54.5
9
20
344
2.25
-
5
-
| 233

24.9 Page 239

▲back to top


Population Foundation of India
d i st r i c t
DAKSHIN DINAJPUR
Showing CD Blocks
234 |

24.10 Page 240

▲back to top


Population, Health & Social Development in Bihar, Jharkhand, Orissa and West bengal
DISTRICT DAKSHIN DINAJPUR
General Information
Area (sq. kms.)
Percent to total state’s area
C D blocks
Towns
No. of villages
Demographic Particulars (Census, 2001)
Population
Persons
Males
Females
Rural (%)
Urban (%)
Scheduled Castes (%)
Scheduled Tribes (%)
Elderly population (60+ years) (%)
Young people (10-24 years) (%)
Adolescent (10-19 years) (%)
Decadal Growth Rate, 1991-2001 (%)
Population density (per sq. km)
Sex Ratio (females per 1000 males)
1991
2001
Child Sex Ratio (0-6 years) (girls per 1000 boys)
1991
2001
Literacy rate (7+)
Persons
Males
Females
Total work participation rate
Household Amenities, (%), Census 2001
2219
Households with kutchha houses
2.5
Households with safe drinking water
08
Households with electricity connection
02 Vital Rates
1579
Crude Birth Rate, 2001
Total Fertility Rate, 2001
Infant Mortality Rate, 2001
Key RCH Indicators from District Level
Household Survey, 2007-08 (%)
1503178
Girls marrying below 18 years
770335
Birth order 3 and above
732843
Current use of any FP Method
86.9
Total unmet need
13.1 Pregnant women who had at least with 3 ANCs
28.8
visits during the last pregnancy
16.1
6.4
Institutional delivery
28.2
20.1
22.1
Children with full immunization
677
Medical/Health Infrastructures/
Institutions
944
951
CHCs
PHCs
555
Sub-Centres
677
Information on HIV/AIDS
63.6
72.4
HIV+ among ANC clinics (%)
54.3
HIV+ among STD clinics (%)
40.8
Number of Integrated Counseling and Testing
Centres (ICTC formerly VCTC)
Female work participation rate
25.1
Number of Anti Retroviral Therapy (ART) Centres
17.7
96.1
19.4
26.9
3.3
77
48.7
17.1
68.2
10.2
77.6
40.3
88.9
7
19
247
-
1.20
2
-
| 235

25 Pages 241-250

▲back to top


25.1 Page 241

▲back to top


Population Foundation of India
d i st r i c t
MALDAH
Showing
CD Blocks
236 |

25.2 Page 242

▲back to top


Population, Health & Social Development in Bihar, Jharkhand, Orissa and West bengal
DISTRICT MALDAH
General Information
Household Amenities, (%), Census 2001
Area (sq. kms.)
3733
Households with kutchha houses
Percent to total state’s area
4.2
Households with safe drinking water
C D blocks
15
Households with electricity connection
Towns
02 Vital Rates
No. of villages
1641
Crude Birth Rate, 2001
Total Fertility Rate, 2001
Demographic Particulars (Census, 2001)
Population
Persons 3290468
Infant Mortality Rate, 2001
Key RCH Indicators from District Level
Household Survey, 2007-08 (%)
Girls marrying below 18 years
Males 1689406
Birth order 3 and above
Females 1601062
Current use of any FP Method
Rural (%)
92.7
Total unmet need
Urban (%)
Scheduled Castes (%)
7.3 Pregnant women who had at least with 3 ANCs
16.8
visits during the last pregnancy
Scheduled Tribes (%)
6.9
Elderly population (60+ years) (%)
5.2
Young people (10-24 years) (%)
30.0
Institutional delivery
Adolescent (10-19 years) (%)
22.0
Decadal Growth Rate, 1991-2001 (%)
24.8
Children with full immunization
Population density (per sq. km)
Sex Ratio (females per 1000 males)
1991
881
Medical/Health Infrastructures/
Institutions
938
2001
948
CHCs
Child Sex Ratio (0-6 years) (girls per 1000 boys)
PHCs
1991
706
Sub-Centres
2001
881
Literacy rate (7+)
Information on HIV/AIDS
Persons
50.2
Males
58.8
HIV+ among ANC clinics (%)
Females
Total work participation rate
41.3
HIV+ among STD clinics (%)
40.7
Number of Integrated Counseling and Testing
Centres (ICTC formerly VCTC)
Female work participation rate
28.3
Number of Anti Retroviral Therapy (ART) Centres
13.5
86.2
18.5
33.0
4.0
80
56.7
31.9
57.1
19.0
59.6
28.6
69.7
17
34
511
-
-
2
1
| 237

25.3 Page 243

▲back to top


Population Foundation of India
d i st r i c t
MURSHIDABAD
Showing CD Blocks
238 |

25.4 Page 244

▲back to top


Population, Health & Social Development in Bihar, Jharkhand, Orissa and West bengal
DISTRICT MURSHIDABAD
General Information
Household Amenities, (%), Census 2001
Area (sq. kms.)
5324
Households with kutchha houses
Percent to total state’s area
6.0
Households with safe drinking water
C D blocks
26
Households with electricity connection
Towns
07 Vital Rates
No. of villages
1925
Crude Birth Rate, 2001
Total Fertility Rate, 2001
Demographic Particulars (Census, 2001)
Population
Persons 5866569
Infant Mortality Rate, 2001
Key RCH Indicators from District Level
Household Survey, 2007-08 (%)
Girls marrying below 18 years
Males 3005000
Birth order 3 and above
Females 2861569
Current use of any FP Method
Rural (%)
87.5
Total unmet need
Urban (%)
Scheduled Castes (%)
12.5 Pregnant women who had at least with 3 ANCs
12.0
visits during the last pregnancy
Scheduled Tribes (%)
1.2
Elderly population (60+ years) (%)
5.6
Young people (10-24 years) (%)
31.4
Institutional delivery
Adolescent (10-19 years) (%)
23.0
Decadal Growth Rate, 1991-2001 (%)
23.8
Children with full immunization
Population density (per sq. km)
Sex Ratio (females per 1000 males)
1991
1102
Medical/Health Infrastructures/
Institutions
943
2001
952
CHCs
Child Sex Ratio (0-6 years) (girls per 1000 boys)
PHCs
1991
977
Sub-Centres
2001
972
Literacy rate (7+)
Information on HIV/AIDS
Persons
54.5
Males
60.7
HIV+ among ANC clinics (%)
Females
Total work participation rate
47.6
HIV+ among STD clinics (%)
34.2
Number of Integrated Counseling and Testing
Centres (ICTC formerly VCTC)
Female work participation rate
16.4
Number of Anti Retroviral Therapy (ART) Centres
16.8
98.2
18.2
22.6
2.6
67
61.4
28.1
68.5
11.4
63.0
41.6
62.5
27
70
832
-
4.80
7
-
| 239

25.5 Page 245

▲back to top


Population Foundation of India
d i st r i c t
BIRBHUM
Showing CD Blocks
240 |

25.6 Page 246

▲back to top


Population, Health & Social Development in Bihar, Jharkhand, Orissa and West bengal
DISTRICT BIRBHUM
General Information
Household Amenities, (%), Census 2001
Area (sq. kms.)
4545
Households with kutchha houses
Percent to total state’s area
5.1
Households with safe drinking water
C D blocks
19
Households with electricity connection
Towns
06 Vital Rates
No. of villages
2256
Crude Birth Rate, 2001
Total Fertility Rate, 2001
Demographic Particulars (Census, 2001)
Population
Persons 3015422
Infant Mortality Rate, 2001
Key RCH Indicators from District Level
Household Survey, 2007-08 (%)
Girls marrying below 18 years
Males 1546633
Birth order 3 and above
Females 1468789
Current use of any FP Method
Rural (%)
91.4
Total unmet need
Urban (%)
Scheduled Castes (%)
8.6 Pregnant women who had at least with 3 ANCs
29.5
visits during the last pregnancy
Scheduled Tribes (%)
6.7
Elderly population (60+ years) (%)
5.5
Young people (10-24 years) (%)
29.6
Institutional delivery
Adolescent (10-19 years) (%)
21.0
Decadal Growth Rate, 1991-2001 (%)
17.9
Children with full immunization
Population density (per sq. km)
Sex Ratio (females per 1000 males)
1991
663
Medical/Health Infrastructures/
Institutions
946
2001
950
CHCs
Child Sex Ratio (0-6 years) (girls per 1000 boys)
PHCs
1991
976
Sub-Centres
2001
964
Literacy rate (7+)
Information on HIV/AIDS
Persons
61.5
Males
70.9
HIV+ among ANC clinics (%)
Females
Total work participation rate
51.6
HIV+ among STD clinics (%)
37.4
Number of Integrated Counseling and Testing
Centres (ICTC formerly VCTC)
Female work participation rate
19.7
Number of Anti Retroviral Therapy (ART) Centres
59.9
86.9
27.4
26.1
3.0
61
58.3
19.9
69.9
9.5
58.0
48.7
64.4
19
58
484
0.0
-
4
-
| 241

25.7 Page 247

▲back to top


Population Foundation of India
d i st r i c t
BARDDHAMAN
Showing CD Blocks
242 |

25.8 Page 248

▲back to top


Population, Health & Social Development in Bihar, Jharkhand, Orissa and West bengal
DISTRICT BARDDHAMAN
General Information
Household Amenities, (%), Census 2001
Area (sq. kms.)
7024
Households with kutchha houses
Percent to total state’s area
7.9
Households with safe drinking water
C D blocks
31
Households with electricity connection
Towns
11 Vital Rates
No. of villages
2438
Crude Birth Rate, 2001
Total Fertility Rate, 2001
Demographic Particulars (Census, 2001)
Population
Persons 6895514
Infant Mortality Rate, 2001
Key RCH Indicators from District Level
Household Survey, 2007-08 (%)
Girls marrying below 18 years
Males 3588376
Birth order 3 and above
Females 3307138
Current use of any FP Method
Rural (%)
63.1
Total unmet need
Urban (%)
Scheduled Castes (%)
36.9 Pregnant women who had at least with 3 ANCs
26.9
visits during the last pregnancy
Scheduled Tribes (%)
6.4
Elderly population (60+ years) (%)
6.5
Young people (10-24 years) (%)
30.6
Institutional delivery
Adolescent (10-19 years) (%)
21.3
Decadal Growth Rate, 1991-2001 (%)
14.0
Children with full immunization
Population density (per sq. km)
Sex Ratio (females per 1000 males)
1991
982
Medical/Health Infrastructures/
Institutions
899
2001
922
CHCs
Child Sex Ratio (0-6 years) (girls per 1000 boys)
PHCs
1991
959
Sub-Centres
2001
956
Literacy rate (7+)
Information on HIV/AIDS
Persons
70.2
Males
78.6
HIV+ among ANC clinics (%)
Females
Total work participation rate
61.0
HIV+ among STD clinics (%)
35.5
Number of Integrated Counseling and Testing
Centres (ICTC formerly VCTC)
Female work participation rate
16.0
Number of Anti Retroviral Therapy (ART) Centres
33.0
88.9
43.9
20.0
2.3
52
39.4
15.7
68.4
9.1
70.7
58.0
63.8
35
104
765
0.25
0.40
9
1
| 243

25.9 Page 249

▲back to top


Population Foundation of India
d i st r i c t
NADIA
Showing CD
Blocks
244 |

25.10 Page 250

▲back to top


Population, Health & Social Development in Bihar, Jharkhand, Orissa and West bengal
DISTRICT NADIA
General Information
Household Amenities, (%), Census 2001
Area (sq. kms.)
3927
Households with kutchha houses
Percent to total state’s area
4.4
Households with safe drinking water
C D blocks
17
Households with electricity connection
Towns
08 Vital Rates
No. of villages
1250
Crude Birth Rate, 2001
Total Fertility Rate, 2001
Demographic Particulars (Census, 2001)
Population
Persons 4604827
Infant Mortality Rate, 2001
Key RCH Indicators from District Level
Household Survey, 2007-08 (%)
Girls marrying below 18 years
Males 2366853
Birth order 3 and above
Females 2237974
Current use of any FP Method
Rural (%)
78.7
Total unmet need
Urban (%)
Scheduled Castes (%)
21.3 Pregnant women who had at least with 3 ANCs
29.6
visits during the last pregnancy
Scheduled Tribes (%)
4.5
Elderly population (60+ years) (%)
8.3
Young people (10-24 years) (%)
30.6
Institutional delivery
Adolescent (10-19 years) (%)
21.7
Decadal Growth Rate, 1991-2001 (%)
19.5
Children with full immunization
Population density (per sq. km)
Sex Ratio (females per 1000 males)
1991
1173
Medical/Health Infrastructures/
Institutions
936
2001
946
CHCs
Child Sex Ratio (0-6 years) (girls per 1000 boys)
PHCs
1991
983
Sub-Centres
2001
972
Literacy rate (7+)
Information on HIV/AIDS
Persons
66.1
Males
72.3
HIV+ among ANC clinics (%)
Females
Total work participation rate
59.6
HIV+ among STD clinics (%)
35.1
Number of Integrated Counseling and Testing
Centres (ICTC formerly VCTC)
Female work participation rate
14.1
Number of Anti Retroviral Therapy (ART) Centres
6.2
98.4
29.7
21.1
2.4
62
42.9
12.4
71.2
9.4
76.4
69.9
86.0
17
49
469
-
0.8
8
-
| 245

26 Pages 251-260

▲back to top


26.1 Page 251

▲back to top


Population Foundation of India
d i st r i c t
NORTH
TWENTY FOUR
PARAGANAS
Showing CD Blocks
246 |

26.2 Page 252

▲back to top


Population, Health & Social Development in Bihar, Jharkhand, Orissa and West bengal
DISTRICT NORTH TWENTY FOUR PARAGANAS
General Information
Household Amenities, (%), Census 2001
Area (sq. kms.)
4094
Households with kutchha houses
Percent to total state’s area
4.6
Households with safe drinking water
C D blocks
22
Households with electricity connection
Towns
27 Vital Rates
No. of villages
1571
Crude Birth Rate, 2001
Total Fertility Rate, 2001
Demographic Particulars (Census, 2001)
Population
Persons 8934286
Infant Mortality Rate, 2001
Key RCH Indicators from District Level
Household Survey, 2007-08 (%)
Girls marrying below 18 years
Males 4638756
Birth order 3 and above
Females 4295530
Current use of any FP Method
Rural (%)
45.7
Total unmet need
Urban (%)
Scheduled Castes (%)
54.3 Pregnant women who had at least with 3 ANCs
20.6
visits during the last pregnancy
Scheduled Tribes (%)
2.2
Elderly population (60+ years) (%)
8.2
Young people (10-24 years) (%)
29.7
Institutional delivery
Adolescent (10-19 years) (%)
20.7
Decadal Growth Rate, 1991-2001 (%)
22.7
Children with full immunization
Population density (per sq. km)
Sex Ratio (females per 1000 males)
1991
2182
Medical/Health Infrastructures/
Institutions
907
2001
926
CHCs
Child Sex Ratio (0-6 years) (girls per 1000 boys)
PHCs
1991
969
Sub-Centres
2001
958
Literacy rate (7+)
Information on HIV/AIDS
Persons
78.1
Males
83.9
HIV+ among ANC clinics (%)
Females
Total work participation rate
71.7
HIV+ among STD clinics (%)
33.4
Number of Integrated Counseling and Testing
Centres (ICTC formerly VCTC)
Female work participation rate
11.3
6.4
98.3
55.3
18.8
2.1
59
28.9
14.1
66.9
12.9
86.6
62.8
81.7
22
53
742
0.25
-
12
Number of Anti Retroviral Therapy (ART) Centres
-
| 247

26.3 Page 253

▲back to top


Population Foundation of India
d i st r i c t
HUGLI
Showing CD
Blocks
248 |

26.4 Page 254

▲back to top


Population, Health & Social Development in Bihar, Jharkhand, Orissa and West bengal
DISTRICT HUGLI
General Information
Household Amenities, (%), Census 2001
Area (sq. kms.)
3149
Households with kutchha houses
Percent to total state’s area
3.5
Households with safe drinking water
C D blocks
18
Households with electricity connection
Towns
12 Vital Rates
No. of villages
1886
Crude Birth Rate, 2001
Total Fertility Rate, 2001
Demographic Particulars (Census, 2001)
Population
Persons 5041976
Infant Mortality Rate, 2001
Key RCH Indicators from District Level
Household Survey, 2007-08 (%)
Girls marrying below 18 years
Males 2589625
Birth order 3 and above
Females 2452351
Current use of any FP Method
Rural (%)
66.5
Total unmet need
Urban (%)
Scheduled Castes (%)
33.4 Pregnant women who had at least with 3 ANCs
23.6
visits during the last pregnancy
Scheduled Tribes (%)
4.2
Elderly population (60+ years) (%)
8.0
Young people (10-24 years) (%)
29.4
Institutional delivery
Adolescent (10-19 years) (%)
20.5
Decadal Growth Rate, 1991-2001 (%)
15.8
Children with full immunization
Population density (per sq. km)
Sex Ratio (females per 1000 males)
1991
1601
Medical/Health Infrastructures/
Institutions
917
2001
947
CHCs
Child Sex Ratio (0-6 years) (girls per 1000 boys)
PHCs
1991
960
Sub-Centres
2001
951
Literacy rate (7+)
Information on HIV/AIDS
Persons
75.1
Males
82.6
HIV+ among ANC clinics (%)
Females
Total work participation rate
67.2
HIV+ among STD clinics (%)
36.9
Number of Integrated Counseling and Testing
Centres (ICTC formerly VCTC)
Female work participation rate
16.2
Number of Anti Retroviral Therapy (ART) Centres
10.2
98.5
57.6
18.1
2.0
35
26.1
10.2
74.2
9.8
82.8
80.1
92.9
17
61
660
-
3.2
10
-
| 249

26.5 Page 255

▲back to top


Population Foundation of India
d i st r i c t
BANKURA
Showing CD Blocks
250 |

26.6 Page 256

▲back to top


Population, Health & Social Development in Bihar, Jharkhand, Orissa and West bengal
DISTRICT BANKURA
General Information
Household Amenities, (%), Census 2001
Area (sq. kms.)
6882
Households with kutchha houses
Percent to total state’s area
7.8
Households with safe drinking water
C D blocks
22
Households with electricity connection
Towns
03 Vital Rates
No. of villages
3577
Crude Birth Rate, 2001
Total Fertility Rate, 2001
Demographic Particulars (Census, 2001)
Population
Persons 3192695
Infant Mortality Rate, 2001
Key RCH Indicators from District Level
Household Survey, 2007-08 (%)
Girls marrying below 18 years
Males 1636002
Birth order 3 and above
Females 1556693
Current use of any FP Method
Rural (%)
92.6
Total unmet need
Urban (%)
Scheduled Castes (%)
7.7 Pregnant women who had at least with 3 ANCs
31.2
visits during the last pregnancy
Scheduled Tribes (%)
14.4
Elderly population (60+ years) (%)
7.3
Young people (10-24 years) (%)
29.4
Institutional delivery
Adolescent (10-19 years) (%)
20.7
Decadal Growth Rate, 1991-2001 (%)
13.8
Children with full immunization
Population density (per sq. km)
Sex Ratio (females per 1000 males)
1991
464
Medical/Health Infrastructures/
Institutions
951
2001
952
CHCs
Child Sex Ratio (0-6 years) (girls per 1000 boys)
PHCs
1991
962
Sub-Centres
2001
953
Literacy rate (7+)
Information on HIV/AIDS
Persons
63.4
Males
76.8
HIV+ among ANC clinics (%)
Females
Total work participation rate
49.4
HIV+ among STD clinics (%)
44.7
Number of Integrated Counseling and Testing
Centres (ICTC formerly VCTC)
Female work participation rate
32.0
Number of Anti Retroviral Therapy (ART) Centres
47.3
71.2
27.7
22.2
2.6
50
49.7
14.4
67.6
12.5
65.8
61.4
91.7
22
70
564
-
0.4
4
-
| 251

26.7 Page 257

▲back to top


Population Foundation of India
d i st r i c t
PURULIYA
Showing CD Blocks
252 |

26.8 Page 258

▲back to top


Population, Health & Social Development in Bihar, Jharkhand, Orissa and West bengal
DISTRICT PURULIYA
General Information
Household Amenities, (%), Census 2001
Area (sq. kms.)
6259
Households with kutchha houses
Percent to total state’s area
7.1
Households with safe drinking water
C D blocks
20
Households with electricity connection
Towns
03 Vital Rates
No. of villages
2468
Crude Birth Rate, 2001
Total Fertility Rate, 2001
Demographic Particulars (Census, 2001)
Population
Persons 2536516
Infant Mortality Rate, 2001
Key RCH Indicators from District Level
Household Survey, 2007-08 (%)
Girls marrying below 18 years
Males 1298078
Birth order 3 and above
Females 1238438
Current use of any FP Method
Rural (%)
89.9
Total unmet need
Urban (%)
Scheduled Castes (%)
10.1 Pregnant women who had at least with 3 ANCs
18.3
visits during the last pregnancy
Scheduled Tribes (%)
18.3
Elderly population (60+ years) (%)
7.2
Young people (10-24 years) (%)
28.8
Institutional delivery
Adolescent (10-19 years) (%)
20.9
Decadal Growth Rate, 1991-2001 (%)
14.0
Children with full immunization
Population density (per sq. km)
Sex Ratio (females per 1000 males)
1991
405
Medical/Health Infrastructures/
Institutions
947
2001
954
CHCs
Child Sex Ratio (0-6 years) (girls per 1000 boys)
PHCs
1991
969
Sub-Centres
2001
964
Literacy rate (7+)
Information on HIV/AIDS
Persons
55.6
Males
73.7
HIV+ among ANC clinics (%)
Females
Total work participation rate
36.5
HIV+ among STD clinics (%)
44.5
Number of Integrated Counseling and Testing
Centres (ICTC formerly VCTC)
Female work participation rate
36.2
Number of Anti Retroviral Therapy (ART) Centres
28.9
44.1
19.3
24.9
3.1
51
54.3
22.8
54.0
18.7
65.1
39.9
84.3
20
53
485
-
-
3
-
| 253

26.9 Page 259

▲back to top


Population Foundation of India
d i st r i c t
MEDINIPUR
Showing CD Blocks
254 |

26.10 Page 260

▲back to top


Population, Health & Social Development in Bihar, Jharkhand, Orissa and West bengal
DISTRICT MEDINIPUR
General Information
Household Amenities, (%), Census 2001
Area (sq. kms.) 14081
Households with kutchha houses
Percent to total state’s area
15.9
Households with safe drinking water
C D Blocks
54
Households with electricity connection
Towns
13 Vital Rates
No. of Villages 10544
Crude Birth Rate, 2001
Total Fertility Rate, 2001
Demographic Particulars (Census, 2001)
Population
Persons 9610788
Infant Mortality Rate, 2001
Key RCH Indicators from District Level
Household Survey, 2007-08 (%)
Girls marrying below 18 years
Males 4916370
Birth order 3 and above
Females 4694418
Current use of any FP Method
Rural (%)
89.8
Total unmet need
Urban (%)
Scheduled Castes (%)
10.2 Pregnant women who had at least with 3 ANCs
16.4
visits during the last pregnancy
Scheduled Tribes (%)
8.3
Elderly population (60+ years) (%)
7.2
Young people (10-24 years) (%)
30.9
Institutional delivery
Adolescent (10-19 years) (%)
21.9
Decadal Growth Rate, 1991-2001 (%)
15.7
Children with full immunization
Population density (per sq. km)
Sex Ratio (females per 1000 males)
1991
683
Medical/Health Infrastructures/
Institutions
949
2001
955
CHCs
Child Sex Ratio (0-6 years) (girls per 1000 boys)
PHCs
1991
953
Sub-Centres
2001
951
Literacy rate (7+)
Information on HIV/AIDS
Persons
74.9
Males
84.9
HIV+ among ANC clinics (%)
Females
Total work participation rate
64.4
HIV+ among STD clinics (%)
39.0
Number of Integrated Counseling and Testing
Centres (ICTC formerly VCTC)
Female work participation rate
22.8
39.4
74.6
21.0
22.6
2.6
51
-
-
-
-
-
-
-
54
138
1564
-
0.81
10
Number of Anti Retroviral Therapy (ART) Centres
1
| 255

27 Pages 261-270

▲back to top


27.1 Page 261

▲back to top


Population Foundation of India
d i st r i c t
haora
Showing CD
Blocks
256 |

27.2 Page 262

▲back to top


Population, Health & Social Development in Bihar, Jharkhand, Orissa and West bengal
DISTRICT HAORA
General Information
Area (sq. kms.)
Percent to total state’s area
C D blocks
Towns
No. of villages
Demographic Particulars (Census, 2001)
Population
Persons
Males
Females
Rural (%)
Urban (%)
Scheduled Castes (%)
Scheduled Tribes (%)
Elderly population (60+ years) (%)
Young people (10-24 years) (%)
Adolescent (10-19 years) (%)
Decadal Growth Rate, 1991-2001 (%)
Population density (per sq. km)
Sex Ratio (females per 1000 males)
1991
2001
Child Sex Ratio (0-6 years) (girls per 1000 boys)
1991
2001
Literacy rate (7+)
Persons
Males
Females
Total work participation rate
Household Amenities, (%), Census 2001
1467
Households with kutchha houses
1.7
Households with safe drinking water
14
Households with electricity connection
03 Vital Rates
727
Crude Birth Rate, 2001
Total Fertility Rate, 2001
Infant Mortality Rate, 2001
Key RCH Indicators from District Level
Household Survey, 2007-08 (%)
4273099
Girls marrying below 18 years
2241898
Birth order 3 and above
2031201
Current use of any FP Method
49.6
Total unmet need
50.4
Pregnant women who had at least with 3
ANCs visits during the last pregnancy
15.4
0.5
Institutional delivery
7.7
31.2
21.7
14.6
Children with full immunization
2913
Medical/Health Infrastructures/Institutions
881
906
CHCs
PHCs
962
Sub-Centres
956
Information on HIV/AIDS
77.0
83.2
HIV+ among ANC clinics (%)
70.1
HIV+ among STD clinics (%)
33.7
Number of Integrated Counseling and Testing
Centres (ICTC formerly VCTC)
Female work participation rate
9.2
Number of Anti Retroviral Therapy (ART) Centres
3.9
96.5
56.0
18.0
2.1
41
32.2
16.6
70.6
9.3
79.8
65.7
76.4
15
42
448
-
0.79
10
-
| 257

27.3 Page 263

▲back to top


Population Foundation of India
d i st r i c t
kolkata
Showing CD Blocks
258 |

27.4 Page 264

▲back to top


Population, Health & Social Development in Bihar, Jharkhand, Orissa and West bengal
DISTRICT KOLKATA
General Information
Area (sq. kms.)
Percent to total state’s area
C D blocks
Towns
No. of villages
Demographic Particulars (Census, 2001)
Population
Persons
Males
Females
Rural (%)
Urban (%)
Scheduled Castes (%)
Scheduled Tribes (%)
Elderly population (60+ years) (%)
Young people (10-24 years) (%)
Adolescent (10-19 years) (%)
Decadal Growth Rate, 1991-2001 (%)
Population density (per sq. km)
Sex Ratio (females per 1000 males)
1991
2001
Child Sex Ratio (0-6 years) (girls per 1000 boys)
1991
2001
Literacy rate (7+)
Persons
Males
Females
Total work participation rate
Household Amenities, (%), Census 2001
185
Households with kutchha houses
0.2
Households with safe drinking water
-
Households with electricity connection
01 Vital Rates
-
Crude Birth Rate, 2001
Total Fertility Rate, 2001
Infant Mortality Rate, 2001
Key RCH Indicators from District Level
Household Survey, 2007-08 (%)
4572876
Girls marrying below 18 years
2500040
Birth order 3 and above
2072836
Current use of any FP Method
0.0
Total unmet need
100.0
Pregnant women who had at least with 3
ANCs visits during the last pregnancy
6.0
0.2
Institutional delivery
9.9
27.7
18.1
3.9
Children with full immunization
24718
Medical/Health Infrastructures/Institutions
799
829
CHCs
PHCs
955
Sub-Centres
927
Information on HIV/AIDS
80.9
83.8
HIV+ among ANC clinics (%)
77.3
HIV+ among STD clinics (%)
37.6
Number of Integrated Counseling and Testing
Centres (ICTC formerly VCTC)
Female work participation rate
12.8
Number of Anti Retroviral Therapy (ART) Centres
1.1
98.6
94.9
11.8
1.4
55
19.4
16.9
68.9
7.9
90.3
87.7
82.2
-
-
-
1.76
3.60
22
2
| 259

27.5 Page 265

▲back to top


Population Foundation of India
d i st r i c t
south
twenty four
paragans
Showing CD Blocks
260 |

27.6 Page 266

▲back to top


Population, Health & Social Development in Bihar, Jharkhand, Orissa and West bengal
DISTRICT SOUTH TWENTY FOUR PARAGANAS
General Information
Area (sq. kms.)
Percent to total state’s area
C D blocks
Towns
No. of villages
Demographic Particulars (Census, 2001)
Population
Persons
Males
Females
Rural (%)
Urban (%)
Scheduled Castes (%)
Scheduled Tribes (%)
Elderly population (60+ years) (%)
Young people (10-24 years) (%)
Adolescent (10-19 years) (%)
Decadal Growth Rate, 1991-2001 (%)
Population density (per sq. km)
Sex Ratio (females per 1000 males)
1991
2001
Child Sex Ratio (0-6 years) (girls per 1000 boys)
1991
2001
Literacy rate (7+)
Persons
Males
Females
Total work participation rate
Household Amenities, (%), Census 2001
9960
Households with kutchha houses
11.2
Households with safe drinking water
29
Households with electricity connection
07 Vital Rates
2086
Crude Birth Rate, 2001
Total Fertility Rate, 2001
Infant Mortality Rate, 2001
Key RCH Indicators from District Level
Household Survey, 2007-08 (%)
6906689
Girls marrying below 18 years
3564993
Birth order 3 and above
3341696
Current use of any FP Method
84.3
Total unmet need
15.7
Pregnant women who had at least with 3
ANCs visits during the last pregnancy
32.1
1.2
Institutional delivery
6.8
31.5
22.6
20.9
Children with full immunization
693
Medical/Health Infrastructures/Institutions
929
937
CHCs
PHCs
973
Sub-Centres
964
Information on HIV/AIDS
69.5
79.2
HIV+ among ANC clinics (%)
59.0
HIV+ among STD clinics (%)
32.5
Number of Integrated Counseling and Testing
Centres (ICTC formerly VCTC)
Female work participation rate
11.8
Number of Anti Retroviral Therapy (ART) Centres
29.6
99.1
27.9
24.7
3.0
65
41.2
23.1
72.4
10.5
69.1
36.4
73.8
30
63
1068
0.0
0.4
11
-
| 261

27.7 Page 267

▲back to top


Population Foundation of India
References
1. Bulletin on Rural Health Statistics in India, (2008), Ministry of Health and Family Welfare Government of
India
2.Central Bureau of Health Intelligence, (2006), Health Information of India, 2005, Ministry of Health and
Family Welfare, Government of India
3.Council for Social Development (2006), India Social Development Report, OXFORD
4.Christophe Z Guilmoto, S Irudaya Rajan, District Level Estimates of Fertility from India’s 2001 Census, Economic
and Political Weekly February 16, 2002
5.Directorate of Census Operations, (2001), Bihar, Primary Census Abstract, Census of India, 2001
6.Directorate of Census Operations, (2001), Jharkhand, Primary Census Abstract, Census of India, 2001
7.Directorate of Census Operations, (2001), Orissa, Primary Census Abstract, Census of India, 2001
8.Directorate of Census Operations, West Bengal, (2001), Primary Census Abstract, Census of India, 2001
9.Directorate of Census Operations, Jharkhand, (2001), Provisional Population Totals, Paper-1 of 2001, Census
of India, 2001
10.Directorate of Census Operations, Bihar, (2001) Provisional Population Totals, Paper-1 of 2001, Census of
India,2001
11.Directorate of Census Operations, Orissa, (2001), Provisional Population Totals, Paper-1 of 2001, Census of
India, 2001
12.International Institute for Population Sciences (IIPS), Mumbai and ORC Macro, (2006) National Family Health
Survey (NFHS-III)-Fact Sheets, Bihar, Jharkhand, Orissa, West Bengal 2005-06
13.International Institute for Population Sciences (IIPS), Mumbai, (2006), Reproductive and Child Health-District
Level Household Survey (RCH-DLHS), 2006-2008
14.International Institute for Population Sciences (IIPS), Mumbai, (2006), National Family Health Survey, 2005-
2006
15.Ministry of Finance, Economic Division, (2006), Economic Survey, 2005-06, Government of India
16.National Institute of Health and Family Welfare (NIHFW) and National AIDS Control Organization (NACO),
New Delhi (2008), Annual Sentinel Surveillance for HIV Infection in India: Country Report, 2007
17.Registrar General and Census Commissioner of India, (2001), Report and Tables on Age, C-14, 2001, Census
of India, 2001
18.Registrar General of India, (2006), SRS based Abridged Life Tables, 1999-2003.
19.Registrar General of India, (2001), Housing Atlas of India, Census of India, 2004.
20.Registrar General of India, (2001), Tables on Housing and Household Amenities, Census of India, 2001
21.Registrar General of India, (2004), Primary Census Abstract, Total Population: Table A-5, Series-I, New Delhi,
Census of India, 2001
22.Registrar General of India, (2006), Sample Registration System, SRS Bulletin, October, 2009
23.Registrar General of India, (2004), Sample Registration System, Statistical Report No.1 of 2008
24.UNDP, (2002), Human Development Indices in India: Trends and Analysis
262 |

27.8 Page 268

▲back to top


Population, Health & Social Development in Bihar, Jharkhand, Orissa and West bengal
glossary
1. Anaemia
Severe: Anaemia-haemoglobin level <11.0 grams/deciliter (g/dl) for children and pregnant women and
<12.0 g/dl for non pregnant women.
Stunted: Stunting assessed is by height-for-age,
Wasted: wasting is assessed by weight-for-height
Underweight: is assessed by weight-for-age.
2. Child Sex Ratio (0-6 years): Number of girls in the age-group 0-6 years per 1000 boys in the same age-
group.
3. Crude Birth Rate (CBR): Total number of births in a given year and in a given geographical area per
thousand mid-year (average) population in the same year and geographical area.
4. Crude Death Rate (CDR): Total number of deaths in a given year and in a given geographical area per
thousand mid-year (average) population in the same year and geographical area.
5. Electrified Households: Households having electricity as source of lighting.
6. Human Development Index (HDI): The Human Development Index (HDI) is a summary measure of human
development. It measures the average achievement of the country in three basic dimensions of human
development i.e., health, education and income.
7. Infant Mortality Rate (IMR): The number of deaths of infants under age 1 per 1,000 live births in a given
year.
8. Life Expectancy at Birth: Average number of years a new born child is expected to live under current
mortality conditions.
9. Literacy Rate: Percentage of literates to the total population age 7 years and above.
10. Maternal Mortality Ratio (MMR): Number of deaths of women during pregnancy or within 42 days of
termination of pregnancy from any cause related to pregnancy/childbearing and childbirth per 100,000 live
births in a given year.
11. Safe Drinking Water: Drinking water from the safe sources such as Tap, Hand Pump and Tube Well are
classified as safe drinking water.
12. Social Development Index (SDI): The social development index captures six major dimensions of social
development namely demographic parameters, health situation, educational attainments, availability of basic
amenities, incidence of unemployment, poverty and extent of social deprivation.
13. Sex Ratio: Number of females per 1000 males in the population.
14. Temporary Houses (Kutchha Houses): Houses in which both walls and roof are made of materials,
which have to be replaced frequently. Walls may be made from any one of the following temporary materials,
namely, grass, thatch, bamboo, plastic, polythene, mud, unburnt bricks or wood. Roof may be made from any
one of the following temporary materials, namely, grass, thatch, bamboo, wood, mud, plastic or polythene.
15. Total Fertility Rate (TFR): The average number of children that would be born alive to a woman during her
life time if she were to pass through her child bearing years conforming to the age specific fertility rates of a
given year.
16. Work Participation Rate: Percentage of total workers (main and marginal) to total population.
| 263

27.9 Page 269

▲back to top