Resource Requirement Report

Resource Requirement Report


1 Pages 1-10

▲back to top


1.1 Page 1

▲back to top


RESOURCE
REQUIREMENT TO MEET
INDIA’S FP2020
COMMITMENTS
REPORT

1.2 Page 2

▲back to top


1.3 Page 3

▲back to top


TABLE OF CONTENTS
Title
Executive Summary
1 Background
2 Methodology
3 Different Options and Policy Scenarios to reach FP2020 Goals
4 Projection of (modern) Contraceptive Users under Various Options
5 Trend of Current Allocation and Projection of Required Public Finance
under Various Options
6 Key Findings and Recommendations
Annexures
Annexure 2: Persons Met
Annexure 3: Estimation of impact
Annexure 4: Case Studies
Page
v
1
3
4
9
18
29
1-19

1.4 Page 4

▲back to top


ABBREVIATIONS
AHS
ASHA
AWW
CAGR
CPR
CS
CSS
DLHS-IV
EAG
FP
FW
GoI
HP
IEC
IUD/IUCD
mCPR
NRHM
PFI
PIP
PPP
RCH
ROP
Annual Health Survey
Accredited Social Health Activist
Anganwadi Worker
Compound Annual Growth Rate
Contraceptive Prevalence Rate
Central Sector
Centrally Sponsored Scheme
District Level Household & Facility Survey (4th Round)
Empowered Action Group (EAG)
Family Planning
Family Welfare
Government of India
Himachal Pradesh
Information, Education and Communication
Intrauterine Device / Intrauterine Contraceptive Device
Modern Contraceptive Prevalence Rate
National Rural Health Mission
Population Foundation of India
Project Implementation Plan
Public Private Partnership
Reproductive and Child Health
Record of Proceedings

1.5 Page 5

▲back to top


EXECUTIVE SUMMARY
This report presents some key findings and 15 million short of the committed goal of 48
their policy implications in terms of financial million for FP2020. To reach the committed
resources needed to achieve the FP2020 goal goal of an additional 48 million contraceptive
in India, in line with the framework developed users along with the desired method-mix,
at the Family Planning Summit, London 2012. mCPR should increase to 66 percent in 2020.
More specifically, the document is based on an
exercise aimed to arrive at clear quantitative Attaining India’s commitment for the
projections in line with the national FP2020 FP2020 goals crucially hinges on its ability to
goals and commitments. A forecast of the upscale the coverage of spacing methods of
requirements is made grounded on a review of contraceptives. At the national level, under
the Family Planning (FP) budgetary allocation the current scenario, India will have 1.20
patterns and expenditure.
million new users of spacing methods by 2020
as against the target of 3.10 million, indicating
The quantitative exercise and consequent an increase of nearly three times warranted
projections considers seven options for by the FP2020 target method-mix.
meeting the FP2020 goals. The first option
reflects the secular trend of users of modern As private providers overwhelmingly
contraceptives and the others consider dominate the spacing contraceptive market,
various scenarios through which the FP2020 the FP2020 is critically dependent on their
goals may be achieved. It projects the financial participation.At the current trend,the number
resources required for each option to meet of ‘additional’ private users is expected to be
the projected family planning need of the users 9.79 million while the required number is 21.6
of the public sector. For this projection, only million to meet the FP2020 goal.This implies a
direct costs allocated to the states under plan ‘private gap’ of 11.8 million that is unlikely to
expenditure are considered (i.e. those costs be covered by the private market on its own.
which are likely to increase proportionately Hence, additional initiatives are necessary to
with an increase in users). This includes (A) bridge the ‘private’ gap, such as (1) additional
allocation to states through NRHM flexipools, public resources, or (2) involving the private
and (B) a part of the Central Sector (CS) sector through Social Franchise / Social
budget that covers contraceptives, supplies, Marketing (SF/SM) mechanisms.
and IEC. Similar (direct) costs incurred by
states from their own resources are not
considered due to data unavailability. However, Projection of Required Financial
this is not expected to significantly affect the Resources – National Level
results since most of these resources are To meet the FP2020 goal, the government
used on salary and routine maintenance.
would need to spend approximately Rs. 158
billion (or, US $2.4 billion) during 2013-2020
Key Findings
to provide family planning services by publicly
funded providers. This, however, may not still
Projection of Users
guarantee the additional 48 million users since
private users may not increase adequately to
At the current rate of increase of mCPR bridge the required gap. The upper limit of
(secular trend), India will have about 32.8 the required public finance is Rs. 233 billion
million additional users by 2020, i.e., about (or, US $3.6 billion) where the government
1

1.6 Page 6

▲back to top


fills in the ‘private gap’ with its own resources forthcoming years. First, there is hardly any
(in addition to the required increase for evidence in the state financial documents
additional public users).Alternatively, in terms showing planned progress towards achieving
of the percentage of the current allocation the desired method mix. The available
trend, the government would require at least evidences still reveal a significant bias in
32 per cent additional financial resources to resource allocation towards limiting methods
implement if it targets only the additional public – about 82 per cent of the flexipool budget and
users. The requirement for the additional 71 per cent of total resources (i.e., including
fund jumps to 95 per cent if the ‘private gap’ CS support of products and materials)
is to be filled in by public providers. A more are allocated for compensation (mostly to
efficient approach to address the gap is to users of limiting methods) and incentives
involve private providers through the SF/SM (to providers, mostly for limiting methods).
mechanisms, especially in selected EAG states The second concern is about the changing
(such as, Bihar, Chhattisgarh and Odisha).
pattern of the centre-state allocation formula
where the states, with their tight fiscal space
The SF/SM mechanism would better ensure and relatively low priority to family planning
the required progress towards FP2020 goals, activities, are expected to share 40 per cent of
but would cost more. The country would programme funds from their own resources
require Rs. 276 billion (or, about $4.25 billion) (instead of the existing 25 per cent).
if this mechanism is adopted nationally to
cover the potential ‘private gap’. This would Recommendations
need an increase of public finance by 131per To address the above concerns, the Centre-
cent if the government finances the operation State resource sharing formula needs to
of the SF/SM channels.
be revised as related to the FP component
Projection at the State Level
to meet the FP2020 commitment. More
specifically, the resources for FP2000 need
The study also included an intensive to be tightly ring-fenced with a maximum
analysis of different scenarios related central share to assure the fulfillment of
to resource requirement in the context commitments.The declining trend of product
of the 10 Indian states (8 EAG states: support (contraceptives) through the Central
Bihar, Chhattisgarh, Jharkhand, Madhya Sector budget needs to be reversed and
Pradesh, Orissa, Rajasthan, Uttaranchal aligned with the trend in flexipool support.
and Uttar Pradesh, Assam, and Himachal
Pradesh). The analysis remits a mixed signal. It is important to provide the states (especially
On the one hand, the allocation to states the EAG states) with the required technical
through the NRHM flexipools reflects an ‘on support to facilitate implementation of an
track’ trend so far, while the product and other ideal method mix. In addition, a comprehensive
material support from the central budget strategy to explore or upscale the SM/
show a sharp declining trend. Regarding the SF mechanism in selected priority states is
flexipool fund, these states are required to urgently required to involve the private sector.
allocate between Rs. 79 billion (lower limit)
and Rs. 127 billion (upper limit) between 2013 The programme initiatives should be coupled
and 2020, while the likely allocation during the with a process of generating scientific evidence
same period would be Rs.89 billion.
to fill in some critical knowledge gaps related
to the role of private sector, quality assurance
Despite a visible and significant upward trend mechanisms and community involvement in
in the flexipool resources, there are some generating demand. A more intensive analysis
2
serious concerns regarding progress in the of state budgets is also necessary, not only to

1.7 Page 7

▲back to top


identify the actual and required contribution
through states’ own resources, but also to
suggest a mechanism to track the use of
resources for FP2020.
and district levels with the goal of scaling
up investments and service delivery in 264
districts with particularly weak public health
indicators.
1. Background
The commitments involve close coordination
and partnerships between the government
The national programme of family planning and other key stakeholders such as the civil
in India, introduced as a pioneering initiative society organisations (CSOs) and the private
in 1952, to ensure control and stabilization sector. As a leading partner in the process,
of population growth has traversed a long the Population Foundation of India (PFI), a
trajectory on the family planning agenda. It national non-government organization at the
has arrived at a broad-based strategy that forefront of policy advocacy and research on
transcends the simple goals of controlling population, development and health issues
population growth to one of ensuring better in the country, is playing an active role in
maternal and child health outcomes, reducing the consultations on Family Planning (FP)
morbidity and mortality among mothers and globally. PFI’s Executive Director is a former
young children, and promoting a choice-based member of the FP2020 Reference Group, her
approach to enlarge contraceptive choices term having ended in 2015; she was one of
and sustain positive changes in family planning the three civil society representatives in the
behaviour.
initial constitution of the Group. As part of
its advocacy endeavours, PFI is advocating
In its course, the national policy framework with the Government of India and other
on family planning has always strived to stakeholders on Family Planning issues in
ensure congruence to global priorities to line with the framework developed at the
promote family planning through a mix of London Family Planning Summit (FP2020). It
strategies.This has included: enlarging product is also contributing towards meeting India’s
choices, engaging more effectively with commitment at the Summit. As a part of its
key stakeholders, influencing the decision- advocacy efforts,PFI is interested in identifying
making of couples from the perspective the resources required to achieve the FP2020
of reproductive rights, and affirming major commitments both financially and in terms of
commitments to attain specific goals in a strategy mix for family planning.This exercise,
time-bound manner.A recent landmark in the accordingly, is aimed at arriving at clear
global discourse and policy framework on quantitative projections, in alignment with the
family planning has been the London Summit national FP2020 goals and commitments; the
of Family Planning in 2012. It was here that requirements are forecast based on a review
over 60 countries pledged to increase of the FP budgetary allocation patterns and
access of an additional 120 million women expenditure.
to family planning services by 2020. Known
commonly as the FP2020 commitments, the 1.1. Objectives and
goals envision a gradual outlay of over USD 2
Study Questions
billion to provide family planning services to
an additional 48 million women in the country
as well as sustain the current coverage of
about 100 million users till 2020. India will
continue implementation of the plans for
Reproductive Health (RH) and Child Health
(CH), including FP, at national, sub-national,
Broadly, the objectives of this study are to:
1. Review the current (2005-06 till date)
pattern of resource allocation and
expenditure on various programmatic
and support components of Family
Planning across India; looking within
the treasury route and the off-budget
3

1.8 Page 8

▲back to top


(society) route of financing, at both
the national and state levels (10 high
focus states1).
2. Forecast the additional finances
required (up to 2020) to cover the
numbers committed to by India under
the FP2020, and which involves: (a)
meeting the “unmet needs” with the
present basket of choice; (b) increased
coverage through an increased
basket of choice; (c) reduction in
terminal methods and diversion of
the resources thus saved to spacing
methods, improved quality of care
and counseling; and (d) delayed early
marriage and age at first pregnancy.
3. Review the cycle of (i) PIPs (ii) fund
flows (iii) appropriate allocation vis-à-
vis utilization and (iv) existing review
system.
Following a consultation with PFI, it was
decided that the focus should primarily be on
Objective (2) i.e., projecting the requirement
of additional finances under various possible
options to meet the FP2020 goal. In
accordance with this, the study poses and
answers the following specific questions:
What are the options available to
achieve the FP 2020 goals?
What are the projected levels of
public and private users of modern
contraceptives under different
scenarios?
What is the amount of the public fund
that will be required to achieve the FP
2020 goal under different options?
To what extent does the present
trend in resource allocation for FP
by the federal government match the
FP2020 commitment?
Does the trend in state finances for
FP match the requirement?
In order to answer these key questions,
this study undertakes a detailed review of
the public expenditure and outlay patterns
and trends from the budget documents
and other published sources of data, at
both the central and state government
levels. Alternative scenarios are developed
depicting the pathways for attaining the
FP2020 goals at the national level, and
consequent targets set by the national
government for each of the states,estimating
the financial implications proportionate to
the pathways identified.
Brief Summary of Various Sections
Section 2 explains the overall methodology
adopted for projecting the various scenarios.
Section 3 introduces the policy options or
the likely scenarios, explaining the rationale
and assumptions behind each. Section 4
presents the methods, assumptions, and
results of the projection of the users (of
modern contraceptives) in 10 high-focus
states as well as in the country; and their
implications given the FP2020 targets-
commitment context. Section 5 presents the
methods, assumptions, and results related
to the projection of the required financial
resources to meet the needs of committed
additional users (48 million) under different
options. Section 6 highlights some limitations
of the study, and Section 7 concludes by
summarizing the key takeaway messages.
A separate Data Appendix contains all the
calculations and projections, along with the
financial expenditure review results.
2. Methodology
The research undertaken for this study was
1 The 10 high focus states are the eight EAG states (Bihar,
Chhattisgarh, Jharkhand, Madhya Pradesh, Odisha, Rajasthan, conducted in five steps (Figure 1):
Uttar Pradesh and Uttarakhand), and the two hilly states
of Jammu & Kashmir and Himachal Pradesh. For this study, Step 1: Deriving and defining various
4
Jammu & Kashmir (J & K) has been replaced by Assam due to
options or scenarios to meet the
unavailability of recent data on CPR in J & K.

1.9 Page 9

▲back to top


Figure 1: Process of projecting required resources for FP 2020
Derive
possible
options
/scenarios
to meet
FO2020
goals
Project
mCPR
(2013-
20)
Project
users of
modern
contrac
eptives
(2013 -
20)
Estimate
unit cost
from
actual
allocation
in 2013 -
16
Project
required
resources
(2013 -20)
FP2020 goals in India and in the 10
high-focus states (8 EAG states,Assam,
and HP).
Step 2: Estimating the current mCPR
(2012-13) from available secondary
data and projecting the mCPR for the
period 2013-14 through 2019-20 on
this basis (for all options derived in
Step 1).
Step 3: Projecting the number of
additional users and additional public
users (i.e., those who obtained FP
products and services from public
providers) of modern contraceptives
from 2013-14 through 2019-20 based
on the results of Steps 1 and 2.
users and Steps 4 and 5 were undertaken to
project the required financial resources. All
the above steps were carried out for each of
the 10 high-focus states (8 EAG states,Assam
and HP), as well as for the whole country.The
projections are entirely based on available
secondary data from various sources. The
detailed methods and assumptions for each
step are given in Section 3 (for Step 1),
Section 4 (for Steps 2 and 3) and Section 5
(for Steps 4 and 5).
3. Different Options and
Policy Scenarios to
reach FP2020 Goals
Step 4: Estimating the unit cost of The FP2020 strategy for India is usually
the provision of FP services by public described by its commitment to reach
providers from an average allocation an additional 48 million users with family
of programme funds in the years planning information, services, and supplies
2013-14 to 2015-16 and the projected within a fixed time frame (i.e., 2020). However,
number of public users derived in reaching the quantitative target is just a part
Step 3.
of the commitment. There are several other
Step 5: Based on the results from Step goals that underpin the target-led strategy,
3 and 4, projecting the required public such as, bringing about a structural change
finances from 2013 to 2020 to meet in the policy and governance to address the
the FP 2020 goals.
financing, delivery and socio-cultural barriers
to women accessing the FP services and
In brief, the steps are interlinked; Steps 2 and products. It also implies a strong focus on
3 were carried out for a projection of the supporting the ‘rights of women and girls to
5

1.10 Page 10

▲back to top


decide, freely, and for themselves, whether,
when, and how many children they want to
have’2. Hence, the implementation of the
strategy necessarily implies selecting a feasible
roadmap which would lead not only to the
quantitative target but also to a qualitative
one, including structural change in the service
delivery system.
In addition to a relatively lower visibility
and importance of the FP programme in the
overall reproductive health services, there
are three major operational challenges
that need to be addressed to decide a
feasible roadmap in the Indian context:
(1) the market of spacing contraceptives
is overwhelmingly dominated by the
private market; hence, the FP2020 target
is extremely difficult to achieve through
only government financing and action; (2)
the method mix of contraceptives is heavily
skewed toward limiting methods – more
specifically, towards female sterilization.
This is despite there being a significant
unmet need for spacing, especially among
the younger couples, thereby reflecting
a supplier-induced demand for limiting
methods. Hence, there is an urgent need to
bring some balance in the mix and expand
the informed choice set by introducing
new low-cost spacing contraceptives that
appropriately focus on the rights and choices
of women; and (3) the journey towards the
FP 2020 target needs to be assured with
a better quality of frontline services. The
need to strengthen infrastructure, human
resources management, accountability and
governance of the public health system has
been repeatedly emphasized as these are
major impediments to the effective delivery
of health and family planning services3.
to meet these challenges – especially the
first and the second challenge - keeping the
quantitative target as a fixed parameter. It is
important to note that a vision document
prepared by the Department of Health &
Family Welfare, Government of India4, has
already attempted to address the method
mix issue (the second challenge) and, albeit
partially, set a more balanced method-mix
target for each state5.The quality issues (the
third challenge) are also acknowledged and
several initiatives are proposed to improve
this. The weak link in the vision is the lack
of adequate direction on how to engage the
private sector to make sure that private
users fill in the required gap to reach the
overall quantitative target.
Option 1 in the table presents the ‘as usual’
or ‘secular trend’ scenario, i.e., the possible
outcome if the FP2020 strategy is ignored.
Option 2 would partially implement the
strategy – reaching the quantitative target
without addressing the first and second
challenge (i.e., the private sector and
method mix). Option 3 reflects a situation
where the quantitative target could be
achieved with a targeted change in method
mix. The first challenge, however, remains
unaddressed. The Options 4 and 5 are
presented showing two possible ways to
meet the first challenge (filling in the private
gap) in implementing Option 3. Option 6
presents the scenario where, in addition
to meeting other challenges, it would be
possible to offer a more diverse basket
of contraceptive choices entirely through
a public sector initiative. Option 7, on the
other hand, unfolds a scenario where the
objective of Option 6 can be met with the
involvement of the private sector.
The options or scenarios described in 4 India’s ‘vision FP 2020’. FP Division, Ministry of Health & FW,
Table 1 are devised as alternative solutions GoI, Nov 2014.
5 For example, the target method mix in the vision
2 http://www.familyplanning2020.org/
document does not include any spacing method except
3 Pachauri S. “Priority strategies for India’s family planning condoms, pills, and IUCD (hence, implicitly ruling out
programme”. Indian J Med Res 140 (Supplement), November introduction of new low-cost methods, such as
6
2014, pp 137-146
injectables).

2 Pages 11-20

▲back to top


2.1 Page 11

▲back to top


Table 1: Options or Scenarios to Meet FP 2020 Goals in India
Options / Scenarios
Description
Assumptions
Option 1: Secular growth (as
usual).
The projection is based on the histor-
ical trend of mCPR between 2007/8
(DLHS 3) and 2012/13 (AHS).The
mCPR and allocated public expenditure
are treated as the base.
No additional initiatives other than
the ongoing activities and budget
(with secular trend).
Option 2: Reaching the target
CPR/number, same method
mix, same public-private mix.
The projection is based on partial
fulfillment of the FP 2020 target - the
target CPR for each state and target
number for the country (48 million
additional users) are reached, but the
method mix remains the same as it is
at present.This option is least pre-
ferred.
Additional 48 million will be
achieved without any deliberate
attempt to change the method mix
and provider mix.
Number of private users will in-
crease to the required level without
any additional government initiative.
Option 3: Reaching the
target CPR, target method
mix, same public-private mix,
assuming private users will
increase as required.
This is the FP 2020 target which sets
Additional 48 million will be
a CPR target for each state and 48
achieved without any deliberate
million additional users for the country. attempt to change the provider mix.
The target method mix is as suggest-
ed by the Ministry. However, it is also The method mix will change in the
assumed that private sector, on its own, states as projected by the govern-
will expand its spread as required.This
ment’s vision document.
may be considered as the lower limit
for required investment.
Number of private users will in-
crease to the required level without
any additional government initiative.
Option 4: Reaching the target
CPR, target method mix, as-
suming private users will not
increase more than ‘as usual’
and the gap would be filled in
by public sector.
Same as Option 3 with an additional
assumption that the additional load
of users will be served entirely by the
public sector, i.e., private users will
grow at ‘as usual’ rate and the ‘pri-
vate gap’ will be filled in by the public
providers.This sets an ambitious goal
for the public sector and changes the
public-private mix and may be consid-
ered as the upper limit for required
investment.
Private sector will not be able to
generate more users than those ex-
pected in secular trend (Option 1).
Government will be able to fill in
the ‘private’ gap with the current
infrastructure.
The method mix will change in the
states as projected by the govern-
ment’s vision document.
The demand for contraceptives will
match the additional supply.
Option 5: Reaching the target Same as Option 3 with an additional Private sector will not be able to
CPR, suggested method mix, assumption that the additional load generate more users than those ex-
assuming private users will
of users will be served by the SF/SM pected in secular trend (Option 1).
grow at ‘as usual’ rate and
in PPP mode.That is, public users will
gap is filled in by Social Fran- grow at the projected rate in Option 3, Government will not be able to fill
chise (SF)/Social Marketing but private users will grow at ‘as usual’ in the ‘private’ gap with the current
(SM) in a PPP mode.
(Option 1) rate and the gap will be
infrastructure.
filled in by SF/SM agencies.This option
is considered for 10 states and INDIA The ‘private gap’ will be filled in by
(not for individual states).
SF/SM agencies with government
collaboration (PPP mode).
7

2.2 Page 12

▲back to top


Options / Scenarios
Description
Assumptions
Option 6: Reaching the target
CPR, suggested method mix
+ allocating additional users
to public sector.
Option 7: Reaching the target
CPR, suggested method mix
+ allocating additional users
to SF/SM agencies.
Same as Option 4 with an additional
assumption that the spacing method
would have more share than suggested
by the Ministry, private users will grow
at ‘as usual’ rate.This sets a very am-
bitious goal for the public sector.This
option has been considered for INDIA
only, not individual states.
Same as Option 4 with an additional
assumption that the spacing method
would have more share than suggested
by the Ministry.This sets a very am-
bitious goal for the public sector.This
option has been considered for INDIA
only, not individual states.
It is feasible to further change the
method mix than what the vision
document projects.
Private sector will not be able to
generate more users than those ex-
pected in secular trend (Option 1).
Government will be able to fill in
the ‘private’ gap with the current
infrastructure.
The demand for new contraceptives
will match the additional supply.
It is feasible to further change the
method mix than what the vision
document projects.
Private sector will not be able to
generate more users than those ex-
pected in secular trend (Option 1).
Government will not be able to fill
in the ‘private’ gap with the current
infrastructure.
The ‘private gap’ will be filled in by
SF/SM agencies with government
collaboration.
The demand for new contraceptives
will match the additional supply.
4. Projection of (modern)
Contraceptive
Users under Various
derived by combining the two estimates
in the following way: first, the estimated
population of married women aged 15-49
years for each state was collated; second,
Options – 2013-20
users of modern contraceptives in EAG
states were estimated by multiplying the
mCPR (for each method) of 2012-13
4.1. Data and Method
(from AHS) with the estimated population;
third, users of modern contraceptives in
Step 1: Estimating current mCPR and projecting
the future mCPR for 2013-14 through 2019-20.
other states were estimated by multiplying
mCPR of 2013-14 (from DLHS-IV); fourth,
modern users of EAG and other states
Data on contraceptive use (modern
methods) and the modern contraceptive
prevalence rate (mCPR) at the national
and state-level has been compiled from
were added; and, last, it was divided by the
total population (married women) of India
to get national mCPR in 2013 (the base
year).
the national surveys, viz. the latest round
of the Annual Health Survey (2012-
13) for the eight high-focus states, and
the recent District Level Household
For the projections of mCPR in India from
2013 to 2020 (to achieve the FP2020 goal),
the first step was to estimate the required
mCPR in 2020 by adding the target
Survey – Reproductive and Child Health additional 48 million users to the current
8
(DLHS-RCH) – IV (2013-14) for the volume of users, and then, dividing it by the
rest of the states. The national mCPR is projected population of married women

2.3 Page 13

▲back to top


(15-49 years) in 2020. The next step was Section 5).
to calculate the Compound Annual Growth
Rate (CAGR) between the mCPRs of 2013
and 2020 and allow the base rate to grow
at this CAGR. For the projections of mCPR
in each of the 10 states, a similar process
was followed, except that the target mCPR
for each state, as given in the Government’s
vision document (see Footnote 4), was
adopted, instead of estimating it from a
projected population.
The study has not attempted to apply complex
and rigorous mathematical models to build
the projected scenarios due to serious data
constraints. The projections are, therefore,
based on a set of simplified and linearized
trends from the available data.Although serious
efforts were made to simulate the ‘most likely’
assumptions, the analysis remains constrained
due to some limitations. For example, the
linear trend of mCPR under different options
Step 2: Estimating modern users and projecting
the additional public and private users for
2013-14 through 2019-20.
may be too simplistic, since contraceptive
prevalence levels among married women of
reproductive age in many states are probably
approaching levels of diminishing return; and
The ‘additional users’ were estimated by future increases in contraceptive use could
subtracting the users of one year from well occur at an increasing slower pace.
those of its previous years (e.g., additional
users in 2014-15 = users in 2015 – users
in 2014, and so on) for each method. For
estimating ‘public’ users, the share (%) of
The key findings on the projection of mCPR
and users are presented below (for details
see Annexes 1 and 2).
public users from DLHS-III (2007-08) was
used for each method for every state and
the country.
4.2. Projection of
mCPR and Users
Apart from the target levels of additional
users of contraceptive measures, a key
component of the projections of family
planning services is to consider the unique
users of different methods of contraceptives
on an annual basis. The difference between
additional users of contraceptive measures
annually, and ‘unique’ users is that while for
limiting methods, any ‘new’ user added in
any given year is by definition a unique user;
spacing methods require a ‘renewal’ or
continuance of adoption (of the particular
method, say condoms or OCPs) every year,
in order to be counted as a contraceptive
user. Only the proportion of existing users
from the past year, who continue with their
adoption in the current year, along with
fresh users from the current year, comprise
the ‘unique’ users for spacing methods. It
is important to note that the number of
‘unique’ users, not the ‘additional’ users,
4.2.1At the current rate of increase of
mCPR, India will have about 32.8
million additional users by 2020,
i.e., about 15 million short of the
committed FP2020 goal of 48 million.
The estimated mCPR for India in
2013 was 52.8, indicating about
125 million users of modern means
of contraceptives at present. If
contraceptive prevalence is allowed
to increase at its present trend, it is
expected to reach about 60.1 in 2020,
or 158 million users, thus adding
up an additional 32.8 million during
2013-20. Considering the 10 states
that are being analyzed in this study,
the mCPR is estimated to be 45.6,
or about 51 million current users.
Consequently, for the 10 states it
would grow to 55.8, and add another
18.7 million users.
is considered as the basis for unit cost 4.2.2To reach the committed goal of an
9
estimation and resource requirement (see
additional 48 million contraceptive

2.4 Page 14

▲back to top


Table 2: Current and FP2020 target method-mix in contraceptive methods
Specific Contra-
ceptive Method
Current Share
(2012-13)
Desired
Share (FP
2020)
Pill
8%
10%
Condom
12%
14%
IUD
2%
6%
Others
1%
1%
All spacing
23%
31%
Female Sterilization
76%
68%
Male Sterilization
1%
2%
All limiting
77%
70%
Source:AHS/DLHS-IV (for current share), Ministry Vision document
(for desired share)
users along with the desired method- the current annual growth rate of about 1.8
mix, the mCPR should increase to per cent.
66 in 2020. In this scenario, for the
country as whole, the total number 4.2.3The intensity of drive towards the
of users of a modern means of
FP2020 goal needs to be much higher
contraceptives would be 173 million,
in the 10 states (8 EAG states, Assam
or an additional 48 million users. The
and Himachal Pradesh), most especially
ideal or desired method mix (or, share
in Bihar, Odisha, UP, and Assam.AsTable
of various method users), as given
3 shows, the current combined mCPR
in the Ministry’s vision document, is
given in Table 26. Table 3 depicts the
target mCPR in the 10 states in 2020
under this scenario, along with the
corresponding number of additional
users that would be required. The
present levels of mCPR and users are
included for assessing the expansion
required.
of the 10 states was about 45.6 in 2013
(compared to 53 in India). Hence, the
implementation of the FP2020 strategy
would require substantial and more
intensive effort in these states to
bring about an equitable progress. It is
projected that in the target 48 million
users, 30 million (or, 62 per cent) would
have to be generated in the 10 states. In
In order to attain the FP2020 target level of
mCPR and increase the number of additional
users as shown above, the mCPR is required
to increase annually at the rate of 3.2 per
cent at the national level, as compared to
terms of the number of additional users,
most of the major states would fall
short of the number of users required
to meet the respective FP2020 targets
in the same year, if they continue with
the current trend of CPR. , Each of
6 The vision document allocated no share for ‘others’ (which
these states, if continuing at the current
includes injectables, ECP, implants, etc.) in the desired
method mix. However, in this document, the current share
10
of ‘others’ is included in the desired mix to acknowledge the
real situation.
trend of CPR, can be expected to have
a shortfal expressed as a percentage
of the number of users. The states can

2.5 Page 15

▲back to top


Table 3:Targeted level of contraceptive users and required additional
users under FP2020 target, India and 10 major states
States
Current
mCPR
FP2020
Goal
mCPR
Himachal Pradesh
57.7
73.5
Uttarakhand
54.3
70.7
Rajasthan
62.4
69.1
Odisha
46.3
63.4
Madhya Pradesh
59.3
70.9
Jharkhand
43.7
67.8
Chhattisgarh
56.5
67.5
Assam
38.1
55.6
Bihar
36.5
64.2
Uttar Pradesh
37.6
62.2
10 states (com-
bined)
45.6
65.1
All-India
52.8
65.9
Source:Vision FP2020 and Authors’ calculations
Current
Modern
Contra-
ceptive
Users
(mil)
(2013)
0.79
1.02
8.54
3.75
8.37
2.73
2.80
2.30
7.05
13.27
FP2020
Required
Modern
Contra-
ceptive
Users
(mil)
(2020)
Required
Addition-
al Users
(2013-
2020)
(mil)
Required
Addition-
al Users
from Pub-
lic Sector
1.08
0.29
0.21
1.48
0.46
0.31
10.60
2.06
1.54
5.58
1.83
1.14
11.15
2.78
1.90
4.82
2.10
1.18
3.79
0.99
0.80
3.73
1.43
0.66
14.25
7.20
3.32
24.36
11.09
5.22
50.61
125.27
80.84
173.41
30.23
48.14
16.28
26.57
be grouped into low-priority (green),
target; on the other hand,Assam, Bihar
medium-priority (amber) and high-
and Uttar Pradesh clearly require
priority states (red) (Table 4). Clearly,
significant upscaling of mCPR to reach
this involves a significant expansion of
their respective FP2020 targets; and
the coverage of FP services across the
Uttarakhand, Odisha and Jharkhand
states, particularly in the high-priority
require moderate levels of increase
states of Assam, Bihar, Uttar Pradesh
in mCPR. Considering these 10 states
and Odisha. In both Bihar and Uttar
together, there is a gap of 11.4 million
Pradesh, attaining the target mCPR
users between the projected levels
involves a nearly two-fold increase in
under the current trend, and the
the number of contraceptive users by
CPR level required as per the FP2020
2020.
targets. At the all-India level, the gap
amounts to 15.3 million between these
4.2.3As seen above,states such as Rajasthan,
two projections scenarios, with the
Madhya Pradesh, Chhattisgarh, and
10 major states accounting for about
Himachal Pradesh appear to be ‘on-
track’ with respect to the FP2020
three-fourths of the potential target
11
level of additional users required.

2.6 Page 16

▲back to top


Table 4: Gaps between ‘secular trend’ and ‘FP2020 goal scenario’
States
Bihar
Additional Users
(2013-20) (millions)
Secular Trend FP2020 Goal
3.28
7.2
Gap
3.92
Odisha
0.97
1.83
0.86
Uttaranchal
0.25
0.46
0.22
Assam
0.8
1.43
0.63
UP
6.72
11.09
4.37
Jharkhand
1.47
2.1
0.63
Himachal Pradesh
0.21
0.29
0.08
MP
2.04
2.78
0.73
Chattishgarh
0.84
0.99
0.15
Rajasthan
2.18
2.06
-0.12
* Red = high priority, Amber = medium priority, Green = low priority
Gap %
119.4%
88.8%
88.5%
78.5%
65.1%
42.7%
40.1%
36.0%
17.9%
-5.5%
Rank
1
2
3
4
5
6
7
8
9
10
4.3. Projecting Spacing and
of nearly three times warranted by
Limiting Method Use
the FP2020 target method-mix. On
the other hand, with regard to limiting
4.3.1Attaining India’s commitment for
the FP2020 goals crucially hinges on
its ability to upscale the coverage of
spacing methods of contraceptives.
From the current split between the
spacing and limiting contraceptive
methods, India will add more new
methods, India is well-poised to attain
the FP2020 target levels for new users,
even maintaining the current,‘as-usual’
trends; faced with the FP2020 target
scenario of 4.02 million new users, the
‘as-usual’ scenario leads to 4.0 million
new users in 2019-20.
users of spacing methods, than those
of limiting methods under the FP2020
target of contraceptive method-mix.
As shown below (Table 5), from 0.98
million new users of spacing methods,
and 3.25 million new users of limiting
methods in 2013-14, the FP2020 target
requires a major hike in the number of
4.3.2The split between spacing and limiting
methods under the FP2020 target
scenario is even narrower when
considering the 10 major states. Of
the total target of having 5.63 million
unique, or new users in 2020, 2.71
million are expected to be accounted
new users of spacing methods in 2020
for by spacing methods and the
– 3.10 million – while the target for
remaining 2.92 million by existing
the limiting method is pegged at 4.02
limiting methods – a significant rise
million. Notably, at the national level,
from the expected level of 1.01
under current,‘as-usual’ scenario, India
million new users in 2020 under
will have 1.20 million new users of
current trends. Among the states,
12
spacing methods as against the target
such a scenario warrants a four-fold
of 3.10 million, indicating an increase
increase in the number of new users

2.7 Page 17

▲back to top


Table 5: Projection of additional spacing and limiting users (Million)
States
2013-2014
Present Scenario
Spacing
users
(new)
Lim-
iting
users
(new)
Total
users
(new)
2019-2020
(As Usual)
Spacing
users
(new)
Lim-
iting
users
(new)
Total
users
(new)
2019-2020
(FP 2020 Target)
Spacing
users
(new)
Lim-
iting
users
(new)
Total
users
(new)
Assam
0.06
0.04
0.10
0.08
0.05
0.13
0.16
0.10
0.26
Bihar
0.06
0.34
0.40
0.08
0.47
0.55
0.47
0.94
1.41
Chattishgarh 0.01
0.10
0.11
0.01
0.12
0.13
0.07
0.11
0.18
Jharkhand
0.04
0.13
0.17
0.06
0.20
0.25
0.16
0.23
0.39
MP
0.04
0.22
0.27
0.05
0.27
0.32
0.25
0.27
0.52
Odisha
0.04
0.09
0.13
0.05
0.11
0.16
0.17
0.16
0.33
Rajasthan
0.07
0.22
0.28
0.08
0.26
0.34
0.17
0.18
0.34
UP
0.40
0.40
0.80
0.57
0.57
1.14
1.20
0.86
2.06
Uttarakhand 0.01
0.02
0.03
0.02
0.02
0.04
0.04
0.04
0.08
HP
0.01
0.02
0.03
0.0
0.03
0.03
0.03
0.02
0.05
10 States
0.74
1.57
2.31
1.01
2.08
3.09
2.71
2.92
5.63
India
0.98
3.25
4.23
1.20
4.0
5.17
3.10
4.02
7.12
of spacing methods in 2019-20 from
greater emphasis on spacing methods
the current levels (2013-14) in Bihar,
under the FP2020 method-mix
Chhattisgarh and Madhya Pradesh,
target), the private sector would be
and a three-fold increase required for
required to provide for an additional
Himachal Pradesh.
21.6 million of the targeted 48 million
additional users. This means that
4.4. Role of the Private Sector
against a relative ‘market share’ of 30
per cent under the normal scenario,
4.4.1Private providers overwhelmingly
dominate the spacing contraceptive
market; hence, FP2020 is critically
the FP2020 target scenario hikes up
the private sector share to 45 per
cent of the total additional users.
dependent on their participation. To
illustrate, under current or the ‘secular 4.4.2Considering the‘secular trend’ scenario
trend’ scenario, the private market
indicating growth of contraceptive
(including the social marketing/social
users at the current trend till 2020,
franchising channels) is expected to
a major expansion in the role of
cater to an additional 9.79 million
the private sector is called for, in
users during 2013-2020, compared
providing FP services to meet with
to the 23.03 million additional users
the FP2020 goals. This is largely due to
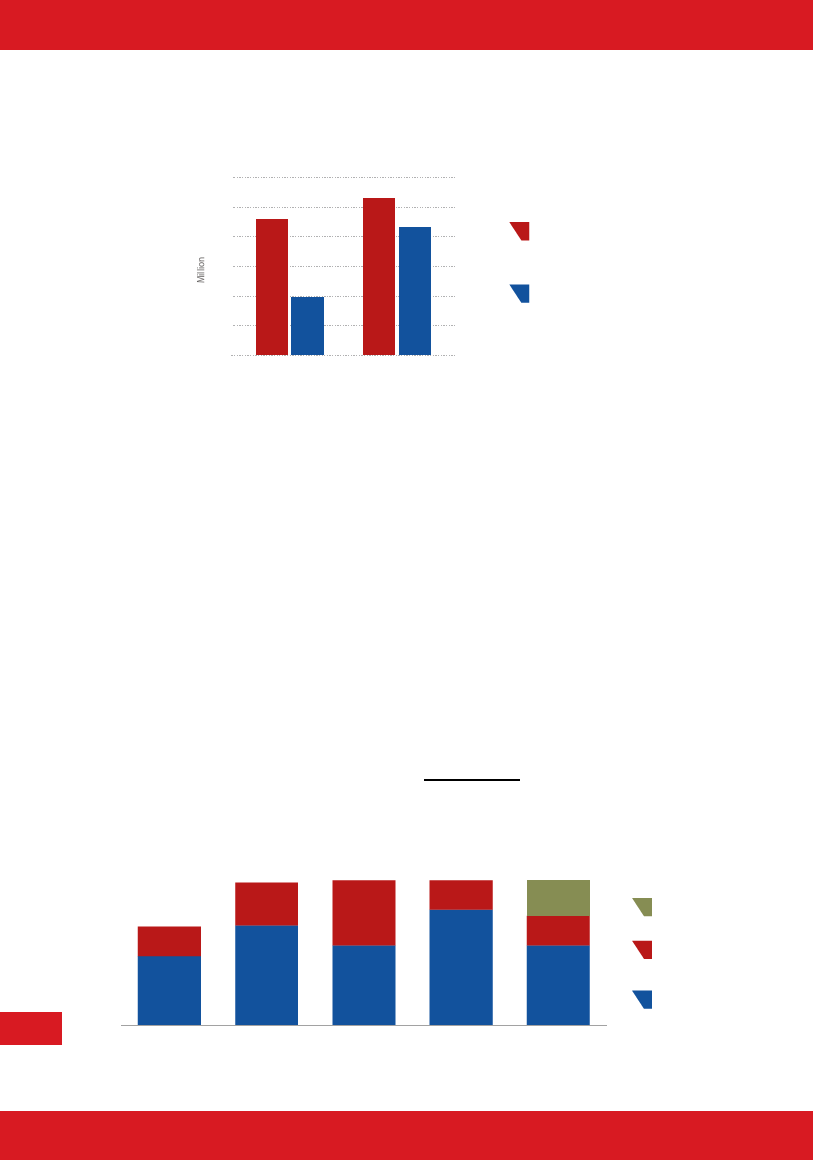
served by the public sector (Figure 2).
the nature of provider source-mix in
However, under the FP2020 goals
and the desired method-mix (with a
the contraceptive method-mix – the
13
private sector currently accounts for

2.8 Page 18

▲back to top


Figure 2. Required Additional Public and Private Users to Meet FP2020 Goals
(2013-20)
23.03
9.79
30
26.57
25
21.58
20
15
10
5
Additional public users
Additional private users
Secular trend
0
FP 2020 goal
(Option 3)
a major share in the spacing methods.
Thus, as the FP2020 target method-
mix involves a greater share of spacing
methods in the aggregate method-
mix, the proportionate share of the
private sector in terms of the expected
additional users by 2020, is significantly
higher than the present relative shares.
4.4.3There is no scientific evidence that
the private providers would be able to
generate the additional users required
to meet FP 2020 goal on their own
resources. Hence, additional initiatives
are necessary to bridge the ‘private’
gap. The present study considers
two alternative options (Options 4
and 5) towards this: (1) by additional
public resources (Option 4), and
(2) by involving the private sector
through the Social Franchise / Social
Marketing (SF/SM) mechanisms
(Option 5). Under both the options,
it is assumed that private users will
grow on the current (secular) trend
and generate 9.79 million additional
users as given in Figure 2 creating a
gap of about 11.8 million users. Under
Option 4, it is assumed that this gap
(11.8 million) will be met by the public
providers (in addition to its required
increase) while Option 5 presents a
scenario where this gap is filled in by
the SF/SM agencies (Figure 3). In the
context of additional users, Options
6 and 7 produce the same results
respectively as Options 4 and 5 since
the total additional users are pegged
at 48 million in all cases7. Clearly,
there would be varying implications
7 However, there will be differences in the projected ‘unique’
users for Options 6 and 7 (see Section 4.5)
Figure 3: Additional Public and Private Users (Million) - INDIA (2013-20)
9.79
23.03
14.13
33.22
21.58
26.57
9.79
38.35
11.78
9.79
26.57
SF/SM
Private users
Public users
14
Option 1
Option 2
Option 3
Option 4
Option 5

2.9 Page 19

▲back to top


on public financing depending on what
option is adopted (see Section 5).
4.5. U nique Users of
Contraceptive Methods
4.5.1Apart from the target levels of
additional users of contraceptive
measures, a key component of
the projections of family planning
services is to consider the ‘unique’ or
‘annual’ users of different methods of
contraceptives on an annual basis.The
difference between ‘additional’ users
of contraceptive measures annually,
and ‘unique’ users arises from the
fact that while for limiting methods
any ‘new’ user added in any given
year is by definition a unique user,
spacing methods require a ‘renewal’
or continuance of adoption (of the
particular method, for example,
condoms or OCPs) every year,in order
to be counted as a contraceptive user.
Only the proportion of existing users
from the past year, who continue with
their adoption in the current year,
along with fresh users from the current
year, comprise the ‘unique’ users for
spacing methods. In brief, ‘unique’ and
‘additional’ users are the same in the
limiting method, while ‘unique’ users
are greater than ‘additional’ users
in spacing methods. It is important
to note that the number of ‘unique’
users, not the ‘additional’ users, is
considered as the base for unit cost
estimation and resource requirement
in a year (see Section 5).
4.5.2The implementation of FP2020
strategy will increase the load of
annual or unique users in India by
60 per cent between 2013-14 and
2019-20 implying a huge pressure on
the service delivery system. Table 6
presents the projected volume of
unique users in the FP2020 scenario
(i.e., 48 million additional users
with desired method mix) in the
commencing and end years (2013-14
and 2019/20) and the respective share
of the public sector, for the 10 states
and at all-India level.
Table 6: Projected unique users of modern contraceptives
in 2013-14 and 2019-20 and FP2020 goals
States
Annual Unique
Users - Public Sector
(in millions)
Annual Unique Users – Total
(in millions)
2013-14
2019-20
2013-14
2019-20
Uttaranchal
0.18
0.25
0.53
0.72
Himachal
Pradesh
0.09
0.16
0.19
0.33
Rajasthan
1.16
1.59
2.22
3.06
Odisha
0.39
0.61
1.27
2.07
Madhya Pradesh
0.55
0.83
1.64
2.65
Jharkhand
0.31
0.57
0.83
1.61
Chhattisgarh
0.23
0.37
0.40
0.69
Assam
0.47
0.71
1.63
2.44
Bihar
0.45
0.85
1.78
4.07
Uttar Pradesh
1.51
2.59
7.85
13.79
All 10 States
5.34
8.52
18.36
31.43
All India
10.04
15.51
34.62
56.04
15

2.10 Page 20

▲back to top


4.5.3In high-priority states such as Bihar and
Uttar Pradesh, significant growth in the
level of new, unique users of modern
contraceptives will be required to
comply with the FP2020 targets. In
Bihar, the yearly number of unique
users will increase from the present
level of about 1.8 million to 4.1 million
in 2019-20. Of this projected number
of unique users, under the current
source-mix between the public and
private sector, about 0.85 million
would be expected to be covered by
the public sector FP services. Similarly,
in Uttar Pradesh, 13.8 million unique
users would be added in 2019-20 alone
in which 2.6 million will be served by
the public sector.
5. Trend of Current
Allocation and
Projection of Required
Public Finance under
Various Options
2013-2020
5.1. Data and Method
Historically, the Family Planning (formerly
known as Family Welfare) programme in India
is mostly guided and financed by the central
government while the states receive the fund
through multiple centre-to-state channels and
remain responsible for its implementation.
The financial resources are directed towards
meeting two needs: (1) fixed or committed
cost primarily to pay salaries and routine
maintenance of staff directly or indirectly
related to implementation; and (2) variable
and direct programme costs that are expected
to vary directly with the number of estimated
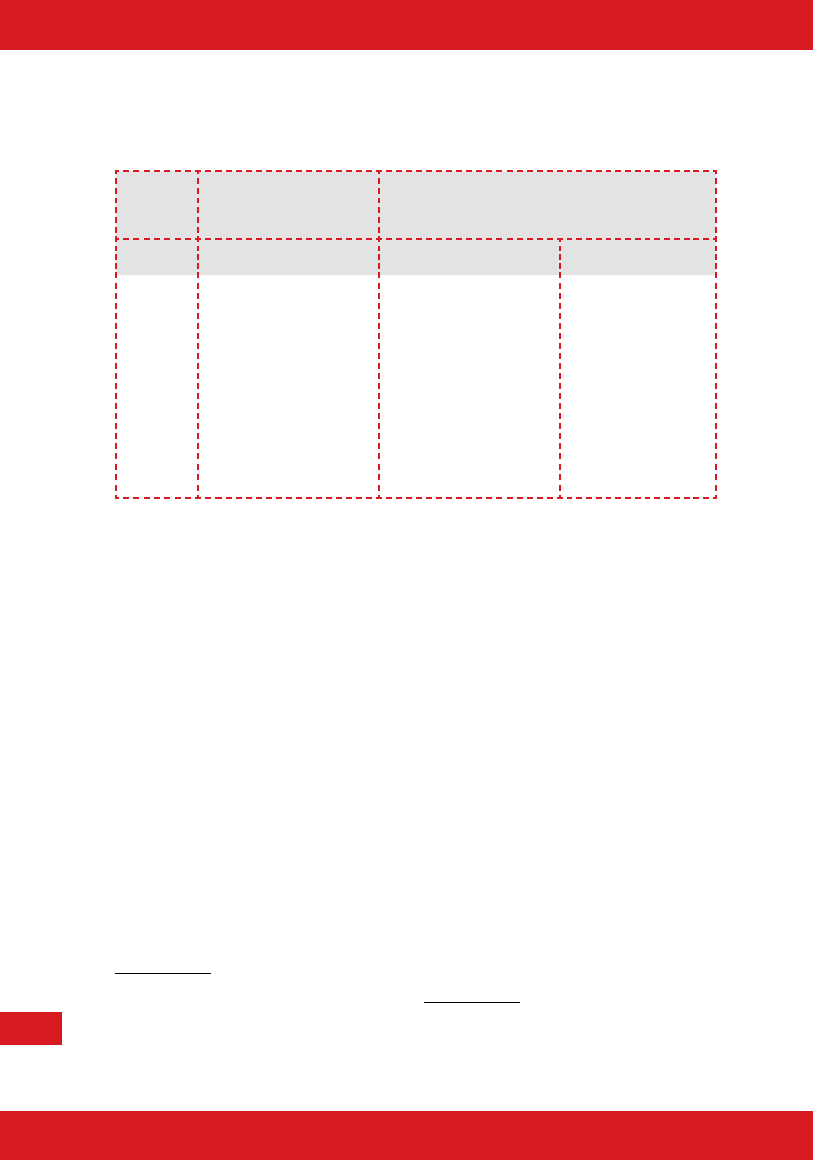
users. Table 7 presents the current fund flow
pattern in a nutshell.
Since the inception of NRHM (currently
known as NHM), the direct programme
support in FP flows primarily from two sources
of the central budget: (A) the flexipools (RCH
and NRHM flexipools); and (B) a part of the
Central Sector budget which is used to buy
and distribute contraceptives, supplies, and
IEC materials (see Table 7). In case of (A), state
governments are mandated to share 25 per
cent of the total requirement while the whole
of (B) is sponsored by the Central Ministry
of Health and Family Welfare. The fixed and
routine funds are obtained from the Central
Sector budget and the state’s own resources
and flow through state treasuries.
In this study, only sources (A) and (B) are
considered to project the requirement
of public finances for FP 2020. This may be
justified on the ground that since these two
components are directly linked to a number
of users, the resource requirement related
to ‘additional’ users is expected to reflect
primarily on these costs. In other words, it
Table 7: Public Financing for Family Planning in India
Source
Route
Destination
Purpose
Centre + State Flexipools under NRHM
State
Direct Programme Cost
Centre
In-kind (Central Sector budget)
State
Contraceptives, IEC, Supplies
Centre
Treasury (central sector budget)
Centre
Various supports spent by the
central ministry
Centre
Treasury (grants-in-aid)
16
State
Treasury
State
State
Routine maintenance
Plan & non-plan expenditure

3 Pages 21-30

▲back to top


3.1 Page 21

▲back to top


is the notion of ‘incremental’ cost that is of
greater importance while estimating the total
expenditure on FP programme and services,
not the recurrent expenditure, such as on
salaries and maintenance, etc.
It is also important to note that, for estimating
financial resources, the Study has used funds
actually ‘allocated’ by the central government
to the states. These are typically reflected
in the Record of Proceedings (RoPs) of the
Annual Meeting of the National Programme
Coordination Committee (NPCC) of
NRHM for each Indian state, where the
financial outlays are finally approved. These
approved financial figures have been used
for the estimations of this Study, instead of
actual expenditure, since the former better
approximates the government’s intention to
support programmes and services and, hence,
its progress toward meeting the FP2020
commitments.
The steps to project required resource is
given in Table 8. The process leads first to an
estimation of unit cost separately for each
state and for India from direct (and variable)
allocation of funds related to FP services that
are reported in the NRHM RoPs and the
Central’s own Central Sector (CS) budget.
The unit cost for the year is derived by dividing
total allocation from 2013-14 to 2015-16 by
total estimated unique users during the same
period. This unit cost is then used as the
base for projection with a 5 per cent rate of
increase per year for the period 2014-15 to
2019-20.
There are two limitations in this method:
first, the unit cost calculated by the above
method was assumed to be same for all
options; however, this may be a bit simplistic
since the proportionate contribution of HR,
IEC, contraceptives, etc. may change across
options due to a change in method mix; and
Table 8: Steps to estimate required resources (Options 1-4 and 6)
Steps
Description
Assumptions
Step 1
Step 2
Step 3
Step 4
Step 5
Add relevant items from the state ROP (Source A) for The states’ own resources for direct pro-
the years 2013/14 – 2015/16.Add 10% of ‘Infrastruc- gramme (variable costs) are negligible
ture & HR’ allocation from NRHM. Add them across
all states.This is the total approved allocation on FP to
states through NRHM flexipools
Add direct input costs (Contraceptives, Supplies, and There are no other major sources of
IEC) of the ‘Central Sector’ support (Source B) to 10 supply of these products
states (apportioned according to user percentage) and
India to get total resource flow to states (A+B)
Estimate unit cost by dividing total spend from 2013-
14 to 2015-16 by projected public users in the same
time period (i.e, 3 years’ average allocation ÷ 3 years’
average estimated users)
The projected number will approximate
the actual number of users
Estimate required resources by multiplying this unit
cost (with 5% increase every year) with projected
public users from 2014-15 to 2019-20
Inflation or nominal increment is as-
sumed to be 5%
Use actual approved outlay for 2013/14 - 2015/16
Step 6
Project approved outlay for 2016/17 - 2019/20 based
on the CAGR between 2013/14 through 2015/16
The flexipool allocation will increase at
the same rate as it increased between
2013/14 to 2015/16
CS support will also follow the same
trend
17

3.2 Page 22

▲back to top


(2) the unit cost may be underestimated if user) cost across different options. This
states spend a substantial amount of its own may be unrealistic to some extent since
resources for the direct operation cost of the the relative weights of different methods
programme8.
in the use of resources are likely to change
The above method, however, is not applicable
to estimate the unit cost of services provided
through the non-state SM/SF mechanism that
is highlighted in two options (Option 5 and 7).
In these options, two unit costs are required:
one for the public resources to be used for
public users estimated the same way as given
in Table 8, and the other is for the SF/SM
across the options (e.g., the unit cost of an
option where the share of limiting methods
is 80 per cent would be higher than the
option where it is 60 per cent). The likely
impact of the assumption, however, is not
expected to be significant as the method
mix does not change substantially across
the options.
users.The total required resource in this case Second,the projection of‘additional’ required
would be as follows:
resources was estimated by the difference
Required resource for Option 5 = Up × P5 +
Us × S5
Required resource for Option 7 = Up × P7 +
Us × S7
between required resources (projected) and
‘likely’ allocation (actual for 2013-14 to 2015-
16 and projected for the period 2016-17 to
2019-20). The projection of actual allocation
from 2016-17 to 2019-20 is based on the
where, Up = Unit cost for providing services
to public users, Us = Unit cost for providing
services to SF/SM users, P5, P7 = Public
users respectively for Option 5 and 7, and
S5, S7 = SF/SM users respectively for Option
5 and 7.
historical trend in the previous 3 years,
assuming that funds would be allocated only
on the basis of past trends or an increase
in the number of users. This assumption
risks deviation from the projected path
since actual allocation is often determined
by several other uncertain factors, such as
The method for estimating Up is already
explained in Table 8. It is expected that the
political priorities, general budgetary policy,
and the relative importance of competing
channels for service delivery through SF/ programmes.
SM channels would cost more than those of
the public sector (i.e., Us > Up). To estimate
Us, a standard costing method for a SM/
SF model, working in collaboration with
The results of the exercise are presented and
discussed in this section. The main results
from the unit cost estimation for India and
the government agencies, has been worked 10 states are presented first. Next, the
out based on some field data received from projections of required public expenditure at
various implementation agencies (e.g., MSI, the national level and 10 major states (Bihar,
Janani, etc.). The costing procedure and the Uttar Pradesh, Uttaranchal, Madhya Pradesh,
results are given in Box 1.
Chhattisgarh, Rajasthan, Jharkhand, Assam,
Himachal Pradesh and Odisha) are presented.
There are a few limitations in the projection. Next, a brief review is presented on how
First, the study assumes unique unit (per and to what extent the present allocations
reflect the progress towards meeting the
8 Due to data unavailability, neither of these limitations could
be addressed. For example, for (1) one needs fund allocation commitment. Finally, the Study concludes by
by methods (condoms, pills, sterilizations, etc). This was not highlighting some key issues related to the
18
available. Similarly, the state general budgets do not detail
‘incremental’ costs. However, neither of these limitations is
current trend in public financing of the FP
expected to significantly affect the results.
programme.

3.3 Page 23

▲back to top


Key findings on resource projections are
presented below (for details, see Annexes 4
and 5).
5.2. Unit Cost Estimation
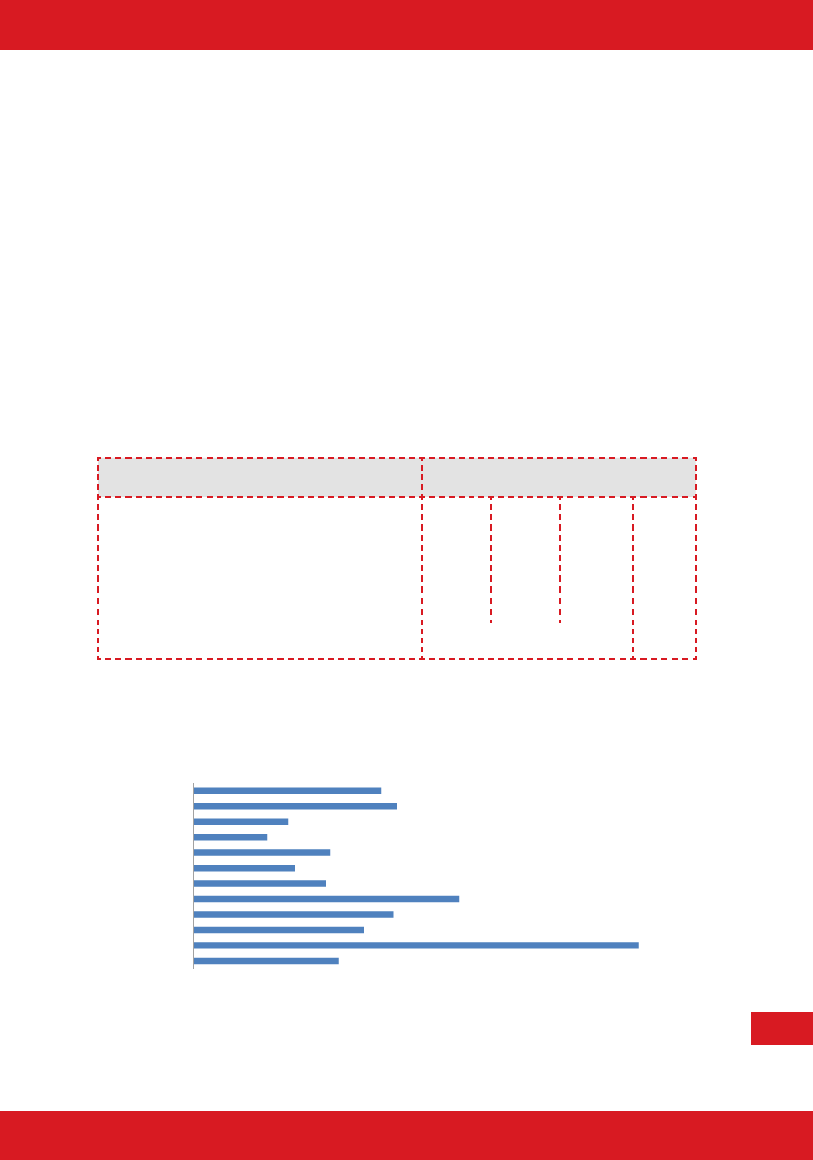
5.2.1The per users cost (incremental)
for FP services by the public sector
works out to about Rs. 1500 (or
about $23). As explained earlier, the
unit cost was estimated by averaging
the allocated amount and total
public users over the last three years
(2013-16) (Table 9). It is, however,
worth noting that the unit cost is
considerably higher than average
in two states – Bihar and Madhya
Pradesh – while it is slightly higher in
Jharkhand (Figure 4).
5.2.2The unit cost for providing services
through the SF/SM channel works
out to Rs. 2379 (or, about $37) based
on the assumption that the SF/SM
agencies will work in collaboration
with the government (see Box 1).
Table 9: Estimation of per user cost of publicly provided FP services*
Item
NRHM flexipool on FP
Infrastructure and maintenance (under NRHM) – 10%
CS support (contraceptives, supplies, IEC)
Total
Total estimated public users (Million) – secular trend
Per user cost (Rs)
Source: ROP and Demand for Grants of respective years
* See Annex 3 for details
Amount Allocated (in Rs. Million)
2013-14 2014-15
7640.2 7687.0
1601.7
5286.5
14528.4
3186.3
4520
15393.3
9.76
10.08
Average of 3 years
2015-16
9949.5
3666.1
2500
16115.6
10.43
Total
25276.7
8454.1
12306.5
46037.3
30.27
1521
($23)
Figure 4. Estimated Per User Cost of Publicly Provided FP Services (Indian Rs.)
10 states
Uttarakhand
Rajasthan
Madhya Pradesh
Chattisgarh
Assam
766
597
1,107
821
1,074
1,521
1,648
1,618
1,380
1,175
2,152
3,604
Source: Authors’ estimation from ROPs of respective states and CS budget (2013/14-2015/16)
19

3.4 Page 24

▲back to top


Box 1: Estimating unit cost for providing services
through the SF/SM channels in a PPP mode
The estimation is based on data collected from various sources (such as, MSI, Janani,
etc.) which are engaged in providing FP services through the SF/SM channels.The data
reflects an approximate costing for a typical 3-year programme intended to cover
about 0.8 million unique users. The data are presented briefly in three parts: inputs,
cost, and output.
Inputs: The following five channels are assumed to provide limiting and spacing
services:
Clinic-cum-training centers owned by SF/SM agencies: 6
Private clinics with MBBS doctors’ franchisee: 210 (franchise or franchisee – kindly
check)Private clinics with Ob/Gyn specialists: 74
Outreach teams: 12
SM outlets: 18000
Costs (for 3 years):
Operating cost of own centres: Rs. 194 million
Set-up and running cost of franchise, outreach and SM outlets: Rs. 908 million
Training cost: Rs. Rs. 248 million
Management and quality support: Rs. 119 million
Frontline field operations: Rs. 445 million
Establishing rural linkages and access: Rs. 109 million
Technical support: Rs. 50 million
Total cost: Rs. 2.07 billion
It is assumed that some existing government resources (e.g., infrastructure for training,
using frontline workers for establishing rural linkage, compensation for users, etc)
are also used for this initiative. The estimated value of this support is Rs. 93 million.
Therefore:
Net cost = Rs. 2.07 billion – Rs. 93 million = Rs. 1.98 billion................................(1)
Output (for 3 years)
Unique users of sterilization: 196,000
Unique users of IUCD: 144,250
Unique users of Pill: 174,000
Unique users of condoms: 103,430
Unique users of others (inj): 214,300
TOTAL UNIQUE USERS: 831,980 .............................................................................(2)
Unit cost: Unit cost is derived by dividing (1) by (2), i.e.
Rs. 1.98 billion / 831,980 = Rs. 2379
20

3.5 Page 25

▲back to top


5.3. Projection of Required
Resources
5.3.1To meet the FP2020 goal, the
government would need to spend
approximately Rs. 158 billion (US
$2.4 billion) till 2020 to provide family
planning services by publicly funded
providers (Table 10). This, however,
may not still guarantee the additional
48 million users since private users
may not increase adequately to bridge
the required gap (Option 3).
5.3.2The upper limit of required public
finance is Rs. 233 billion (US $3.6
billion) where the government fills
in the ‘private gap’ with its own
resources (in addition to the required
increase for additional public users).
This is the requirement under Option
4.The required resource would be Rs.
276 billion (US $4.2 billion) if the gap
is filled in by the SF/SM mechanism
(Option 5).The resource requirement
respectively for Options 6 and 7 are
Rs. 257 billion (US $3.9 billion) and Rs.
313 billion (US $4.8 billion).
Table 10: Projected ‘required’ public investment under different options (Rs. Billion)
OPTIONS
Option 1
2013-14 2014-15 2015-16 2016-17 2017-18 2018-19 2019-20 Total
14.8 15.3 15.9 17.2 18.7 20.3 22.0 124.2
Option 2
16.6 18.2 20.0 22.0 24.2 26.6 29.3 157 .0
Option 3
15.3 17.2 19.3 21.8 24.6 27.9 31.6 157.6
Option 4
16.8 20.7 25.4 31.0 37.8 45.9 55.7 233.3
Option 5
17.7 22.8 28.9 36.3 45.2 56.1 69.2 276.1
Option 6
16.0 20.4 25.9 32.8 41.6 52.9 67.5 256.9
Option 7
16.4 22.2 29.6 39.0 51.2 67.0 87.7 313.0
Projected outlay by GoI 14.5 15.4 16.1 16.7 17.2 17.8 18.4 116.1
Source: Authors’ calculation
5.3.3Alternatively, in terms of percentage
of the current allocation trend, the
country would require at least 32 per
cent additional financial resources
to implement Option 3 (Table 11).
Similarly, it would require additional
95 per cent resources to implement
Option 4 – the maximum limit of
public financing under the FP2020
scenario delineated by the government.
Option 6, which maximizes the role
of government in a more ambitious
scenario of method mix, demands
more additional resources (115 per
cent)
21

3.6 Page 26

▲back to top


Table 11: Additional resources required to fill in the gap
Projected
Actual
Allocation
(2013-20)
2013-20 Total Resource Re-
quired [ Rs. Billion]
Required Additional Resource –
Percentage of Actual Allocation
(Rs. Billion) Option Option Option Option Option Option Option Option
3
4
5
6
3
4
5
6
India
119.54
157.6 233.3 276.1 256.9 32%
95% 131% 115%
10 States
69.5
92.5 134.3 152.8
***
33%
93% 120%
***
*** this option was not considered for individual states.
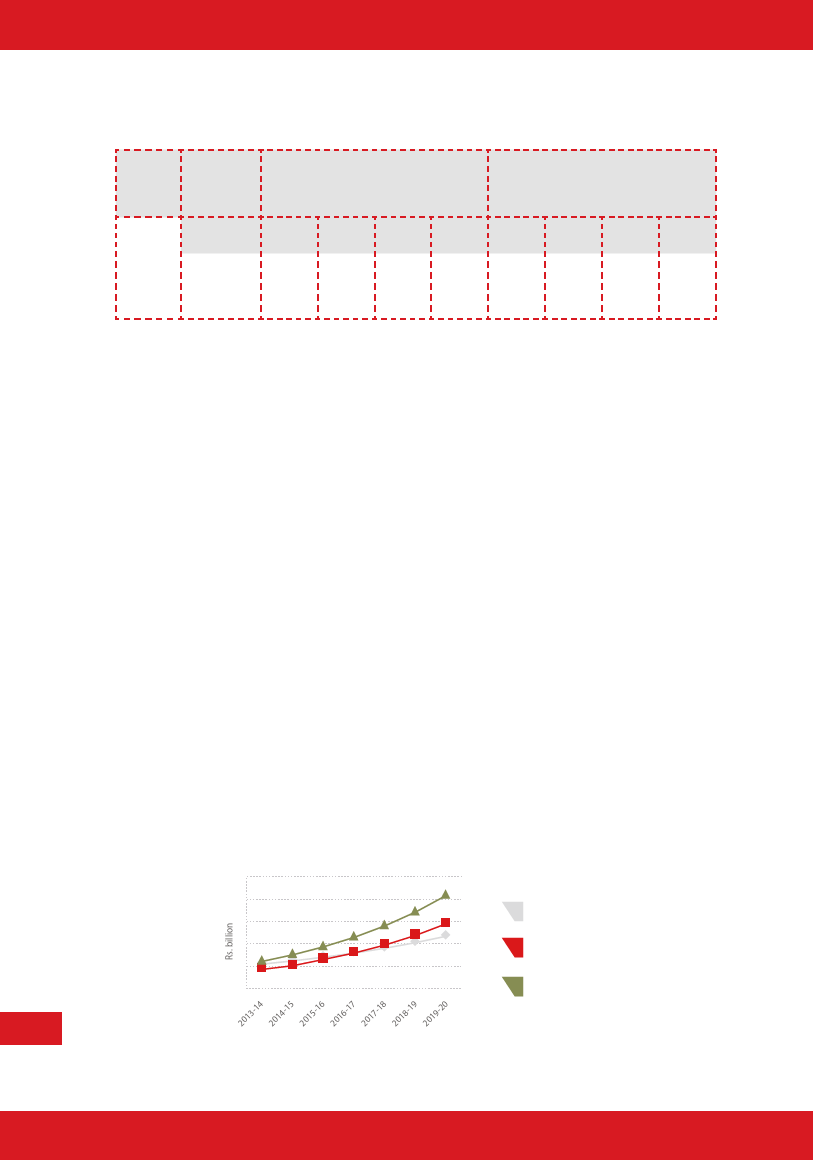
5.3.4The current trend in allocation
fall short of the required fund if the
through the NRHM flexipool (Source
higher limit (Option 4) is considered.
A), if sustained, would be adequate
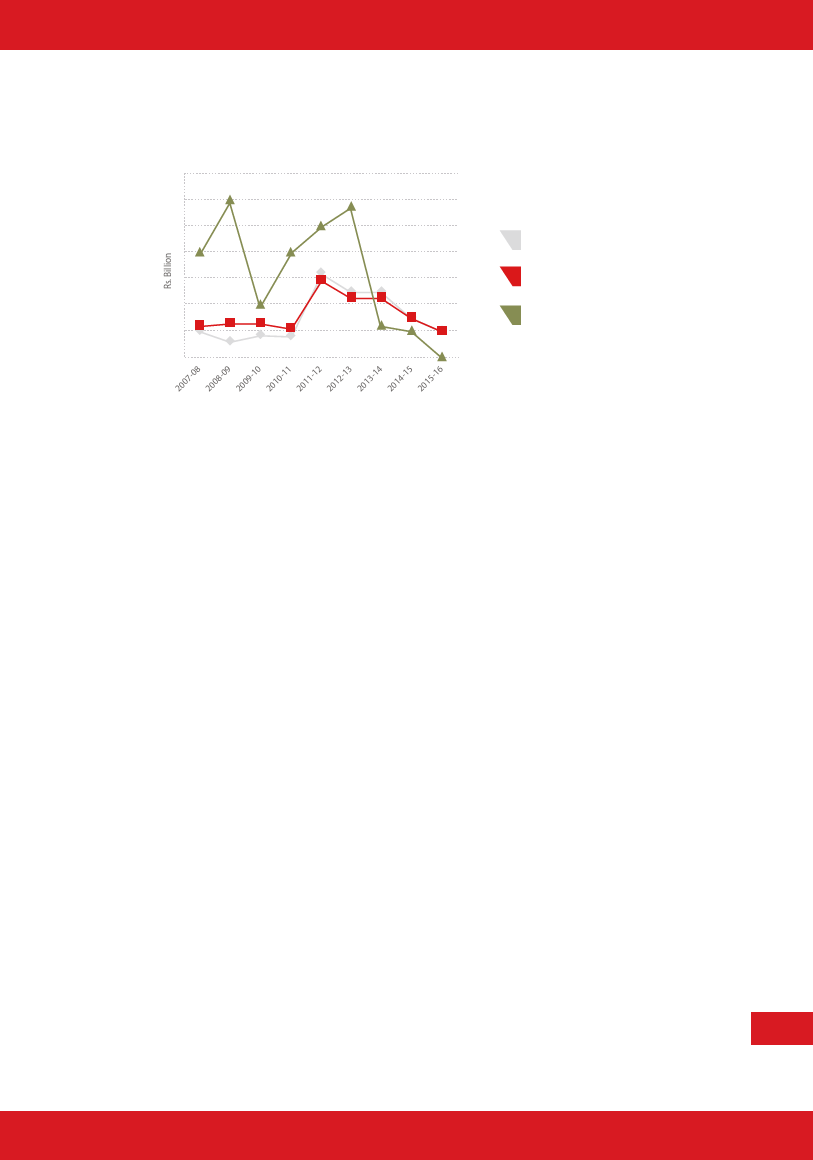
to meet the required support 5.3.5 T he trend of allocation of Central
towards realizing the FP 2020 goal.
Sector resources (Source B) is,
As Figure 5 shows, the allocation
however, discouraging, and at the
for FP through the NRHM flexipool,
current trend, there would be a
which has a sharp upward trend in
significant deficit to meet the required
the most recent budgets (2013/14-
support from this source. The
2015/16), would surpass the lower
declining trend is sharper in the last
limit of required finance (Option 3),
few years; for instance, the allocation
if the present trend is maintained.
through this source has reduced by
The flexipool allocation for FP has
54 per cent between 2013-14 and
increased by 47 per cent from 2013-
2015-16. Since the contraceptives and
14 to 2015-16 despite the fact that
IEC materials are obtained from this
the total flexipool allocation (in
source, the declining trend from 2011-
which FP is a part) reduced by 15
12, as shown in Figure 6, clearly raises
per cent during the same period.
serious concern about the feasibility
Notwithstanding the sharp increase
of attaining the FP2020 goals, if the
in allocation, it will, however, still
trend is sustained.
Figure 5. Projected Trend in Required and Actual Allocation through NRHM Flexipool
(Source A)
50
40
Required Flexipool
30
fund (Option 3)
20
Projected allocation
of exipool fund
10
Required Flexipool
0
fund (Option 4)
22
2013-14 2014-15 2015-16 2016-17 2017-18 2018-19 2019-20
Source: ROP’s of all states (2013/14- 2015/16) and authors’ calculation

3.7 Page 27

▲back to top


Figure 6.Trend in Actual Allocation of Resources through Central Sector (CS) Budget
(Source B)
3.5
3
2.5
2
1.5
1
0.5
0
2007-08 2008-09 2009-10 2010-11 2011-12 2012-13 2013-14 2014-15 2015-16
Source: Demand for Grants, DHFW, GoI (respective years)
Social Marketing of
Contraceptives
Free distribution of
contraceptives
Procurement of Supplies &
Materials
3.1. P rojected Trend and
5.4.2The above projection necessarily
Allocation of Resources in
implies that focus should be on
10 Selected States (8 EAG
states + Assam + HP)
CS support to states which, if the
same trend persists, would not only
counterbalance the gains of flexipool
5.4.1As mentioned earlier, the states obtain
direct resources from two sources:
(A) NRHM flexipool, and (B) Central
Sector support. The recent trend in
the NRHM flexipool allocation for
FP clearly reveals an encouraging
scenario for states in the context of
the FP2020 goals. Considering Option
3 as the lower and Option 4 as the
but also act as a strong barrier to
achieve the desired method mix in the
states. For example, if the CS support
of free contraceptives to the states
keep on declining, it would be harder
to achieve a higher share of the
spacing method (especially, oral pills
and condoms) or even to maintain the
current share.
upper limit of required public finance 5.4.3It is quite evident from the recent state
for FP 2020, all states except Bihar and
Chattishgarh are expected to cross
PIPs that most of the EAG states have
considerably raised their resource
the lower limit if the current trend in
envelope under the NRHM flexipool
flexipool allocation is maintained. It
for FP – a clear indication to push
is also evident that a few states, such
more resources to meet the FP2020
as Assam, Jharkhand, Rajasthan, and
goal. For example, the approved
Odisha, are expected to even reach
allocation in UP (through flexipool)
the upper limit (Table 12). Overall, the
has jumped up from Rs. 1.15 billion in
selected 10 states are expected to
2013-14 to Rs. 2.12 billion in 2015-16
cross the lower limit of requirement
– an increase of 84 per cent in just two
through this source by Rs. 10 billion
years. Similarly, the approved outlay in
but remain short of the upper limit by
Rs. 38 billion.
Odisha has increased by 88 per cent
23
- from Rs. 0.27 billion in 2013-14 to

3.8 Page 28

▲back to top


Table 12: Comparison between actual and required allocation
through NRHM flexipool (Source A) in 10 states, 2013-20
Projected Actual Al-
location, 2013-20
(Rs. Billion)
Required Resources through Flexipool
for FP2020 (Source A) - 2013-20
(Rs. Billion)
States
Option 3
(lower limit)
Assam
7.96
5.63
Bihar
13.14
18.85
Chhattisgarh
1.89
3.28
Jharkhand
9.22
5.77
MP
12.36
11.95
Odisha
5.87
4.36
Rajasthan
12.76
9.17
UP
24.15
18.37
Uttarakhand
1.43
1.04
HP
0.23
0.80
10 States
89.01
79.23
Source: ROPs of respective states and authors’ calculation
Option 4
(upper limit)
7.02
43.03
3.83
7.96
16.37
6.30
9.87
30.01
1.19
0.97
126.55
Rs. 0.51 billion. Bihar, on the other
incentives (to ASHAs for generating
hand, showed a comparatively sluggish
demand for sterilization and IUCD)
growth – just a 44 per cent increase
(Figure 7a). The share of these two
between 2013-14 and 2015-16. It is
items works out to 71 per cent if all
also noted that at least one of the EAG
direct resources (excluding the HR
states (UP) has explicitly mentioned
component) are considered (i.e., CS
FP2020 in one of the PIP cost items9.
support are added) (Figure 7b). The
skewness in fund allocation (towards
5.4.4The increased allocation to states
limiting methods, and more specifically
through flexipool should help
to female sterilization) would be
achieve the FP2020 quantitative goal
clearer if it was noted that more than
of additional users; however, there
three-quarters (77 per cent) of the
is hardly any evidence of planned
additional direct fund (excluding the
progress towards achieving the
HR component) allocated to the 10
desired method mix. For example, a
states between 2013-14 and 2015-
break-up of the most recent approved
16 through flexipool is targeted to
outlay through flexipool reveals
limiting methods, most of which is to
that about 82 per cent of flexi funds
be spent on paying compensation10.
(excluding the HR component) are
being used for compensation (to the 5.4.5It is not clear how much of the
users of sterilization and IUCD) and
additional direct resources are being
allocated by the states from their own
9 See p-149 of the ROP (2015-16) of UP where Rs. 5.2 million
was approved for “Enhanced private sector participation in
FP to contribute to FP2020 goals”. http://nrhm.gov.in/nrhm- 10Additional flexi fund to 10 states (excluding HR component)
24
in-state/state-program-implementation-plans-pips/uttar- between 2013-14 and 2015-16 was about Rs. 2.1 billion in
pradesh.html.
which the limiting method was allocated Rs. 1.6 billion.

3.9 Page 29

▲back to top


Figure 7a. Decomposition of NRHM Flexipool Fund, by Use (Source A) - 10 States 2015-16
Incentive
10%
IEC Procure
2% 3%
Training
4%
Other
9%
Compensation
72%
Figure 7b. Decomposition of Taotal Direct Support, by Use (Source A+B), 10 States 2015-16
Contraceptives
& supplies 5%
Procure 3%
IEC 2%
IEC 8%
Incentive 9%
Training 3%
Other 8%
Compensation 62%
resources to meet FP 2020 goals. The
support) where the outcome budget
budget documents of the states are
is available. For example, the 2013-14
yet to reflect any explicit additional
outcome budget of DHFW in Odisha
commitment from its own resources
explicitly allocated Rs. 150 million on
towards achieving the FP2020 goals
contraceptives through its Central
(in addition to the stipulated state’s
Plan component of the budget11.
share in NRHM flexipool allocation).
However, for a better understanding, a
Typically, more explicit commitments
more intensive study on state budgets
are available in the ‘outcome’ budgets
is required.
of respective departments; however,
except a few states, the outcome 5.4.6The projections made above, critically
budgets are yet to be published
depend on states’ ability to generate
by the state health departments
the stipulated state-share of NRHM
(DHFW). There are indications of
flowing additional resources from the
Central Plan account (outside NRHM
11http://www.odisha.gov.in/finance/Budgets/2013-14/
Outcome%20Budget_H_FW.pdf, p-23
25

3.10 Page 30

▲back to top


allocation. This is a challenging task
especially for the forthcoming years
since the stipulated share has recently
been increased to 40 per cent (from
25 per cent). While the recent
modifications in routing the funds for
Centrally Sponsored Schemes (CSS)
has apparently improved the overall
figures of the State Plan budget12,
the real picture about the states’
capacity to generate additional funds
for FP2020 looks grim, given the
increasingly tighter fiscal space in
most of them and the relatively low
priority to family planning activities. It
is important to study the forthcoming
budget of 2016-17 that may reflect the
intention and direction of the state
governments (towards FP2020 goals)
more clearly.
6. Key findings and
Recommendations
Key Findings
substantially much more than its usual
rate of growth (parallel with the increase
in public users), to meet the FP2020
goal. However, there is no scientific
evidence that the private providers
would be able to generate the additional
users required to meet FP 2020 goal on
their own resources. Hence, additional
initiatives are necessary to fill in the
‘private’ gap.
• Hence, the level of required public
finance for FP2020 depends crucially on
how the private market responds to this
need. The lower limit of the required
resource for the period 2013-20 works
out to Rs. 158 billion by assuming that
the private users completely match
up to the additional requirement on
their own, while the government uses
its resources only for the public users.
The upper limit for public finance is Rs.
233 billion where the private sector
fails to grow beyond its usual rate and
the government spends its resources to
bridge the ‘private gap’ as well.
The key findings of the study are summarized • Given the constraints in the
below:
infrastructural capacity of the public, a
better alternative is to involve the private
• To reach the committed goal of additional
players through the Social Franchise and
48 million contraceptive users along
Social Marketing mechanism to cover
with the desired method-mix, mCPR
the gap. The required resource in this
should increase to 66 in 2020. At its
case works out to Rs. 276 billion.
current rate of increase, India will have
about 32.8 million additional users by
2020, i.e., about 15 million short of the
committed FP2020 goal of 48 million.
• The recent trend in the allocation of
public funds for FP sends mixed signals.
On the one hand, the allocation to states
through NRHM flexipools reflects an
• Private users would need to increase
‘on track’ trend so far;while the product
12 Starting with 2014-15, funds for CSS (e.g., NRHM)
which were hitherto directly transferred to district rural
development agencies (DRDA) and independent societies
and other material support from the
central budget show a sharp declining
trend. Despite a visible and significant
are now being passed through the state budgets. Hence, the
routing of the CSS transactions through the state budgets has
contributed to the sharp increase in both revenue surplus
as well as capital outlay of states in the recent budgets. For
upward trend in the flexipool resources,
the progress in the forthcoming years
is marked by a serious concern about
details, see “State Finances: A study of Budgets, 2015”, p-23,
the changing pattern of the centre-state
26
published by Reserve Bank of India (https://www.rbi.org.in/
scripts/AnnualPublications.aspx?head=State%20Finances%20
allocation formula. According to this,
:%20A%20Study%20of%20Budgets)
the states, with their tight fiscal space,

4 Pages 31-40

▲back to top


4.1 Page 31

▲back to top


are expected to share 40 per cent of
programme funds from their own
resources.
• The trend in the use of resources at
the state level does not provide any
clear indication of desired change in the
method mix.
Recommendations
• Revise the Centre-state resource
sharing formula as pertaining to the
FP component to meet the FP2020
commitment. Ring-fence the resources
for FP2000 with maximum central share
to assure the fulfillment of commitments.
• Sustain recent trend of increasing
allocation to states through NRHM
flexipools, with additional allocation to
priority states, like Bihar.
• Reverse the declining trend of product
support (contraceptives) through the
Central Sector budget and align it with
the trend in flexipool support.
• Facilitate implementation of ideal
method mix in states (especially
the EAG states) through required
technical support. . In addition, develop
a comprehensive strategy to explore
or upscale the SM/SF mechanism in
selected priority states to involve the
private sector.
• Couple programme initiatives with
a process of generating scientific
evidences to fill in some critical
knowledge gaps, in particular those
related to: (1) understanding the role
of the private sector in family planning,
(2) quality assurance mechanisms at the
ground level, and (3) various options for
involvement of community in generating
demand. In addition, undertake a more
intensive analysis of state budgets,
which is necessary not only to identify
the actual and required contribution
through states’ own resources, but also
to suggest a mechanism to track the use
of resources for FP2020.
27

4.2 Page 32

▲back to top


ANNEXURES
ANNEX 1: PROJECTION OF USERS OF CONTRACEPTIVE
METHODS UNDER ALTERNATIVE SCENARIOS
INDIA
(All figures in millions)
Option 1: As usual, linear projections, unchanged public-
private mix, unchanged method mix
Specific
Contracep-
tive Method
Projected
mCPR (%)
2013
(AHS/ 2020
DLHS4)
Method Mix
Current
Share
(2012-
13)
2020
Share
(same)
Projected Mod-
ern Contra-
ceptive Users
(Million)
2013 2020
Additional Users (Mil-
lion)
(2013-20)
Public Private Total
Annual Unique Users
(differences in limiting
methods only) (Million)
(2013-20)
Public Private Total
Pill
4.2 4.8 8% 8% 10.02 12.65 0.61 2.01 2.63 18.79 61.52 80.32
Condom
6.5 7.4 12% 12% 15.42 19.45 0.95 3.09 4.04 28.91 94.62 123.53
IUD
1.1 1.3 2% 2% 2.70 3.41 0.16 0.55 0.71 4.98 16.69 21.67
Female
Sterilization
39.9 45.4 76% 76% 94.65 119.45 20.91 3.89 24.80 20.91 3.89 24.80
Male
Sterilization
0.7 0.7 1% 1% 1.56 1.97 0.34 0.06 0.41 0.34 0.06 0.41
Others
0.4 0.4 1% 1% 0.92 1.16 0.06 0.19 0.24 1.69 5.67 7.36
Any
Modern
Method
52.8 60.1 100% 100% 125.27 158.09 23.03 9.79 32.82 75.63 182.46 258.09
Option 2: Reaching target additional 48 million, linear projec-
tions, unchanged public-private mix, unchanged method mix
Projected mCPR
(%)
Specific Con-
Method Mix
traceptive
Method
2013
(AHS/
DLHS4)
2020
Current
Share
(2012-
13)
2020
Share
(same)
Projected Mod-
ern Contra- Additional Users (Million)
ceptive Users
(2013-20)
(Million)
2013 2020 Public Private Total
Annual Unique Users
(differences in limiting
methods only) (Million)
(2013-20)
Public Private Total
Pill
4.2 5.2 8% 8% 10.02 13.81 0.89 2.90 3.79 19.80 64.82 84.62
Condom
6.5 8.1 12% 12% 15.42 21.24 1.36 4.46 5.83 30.45 99.69 130.15
IUD
1.1 1.4 2% 2% 2.70 3.73 0.24 0.79 1.02 5.25 17.58 22.83
Female
Sterilization
39.9 49.6 76% 76% 94.65 130.43 30.16 5.62 35.78 30.16 5.62 35.78
Male
Sterilization
0.7 0.8 1% 1% 1.56 2.15 0.50 0.09 0.59 0.50 0.09 0.59
Others
0.4 0.5 1% 1% 0.92 1.27 0.08 0.27 0.35 1.78 5.97 7.75
Any
Modern
52.8 65.6 100% 100% 125.27 172.62 33.22 14.13 47.35 87.95 193.78 281.73
28
Method

4.3 Page 33

▲back to top


Option 3: Reaching target additional 48 million, reaching Minis-
try’s target method mix, unchanged public-private mix
Projected
Specific
mCPR (%)
Contracep-
tive Method 2013
(AHS/ 2020
DLHS4)
Method Mix
Projected Mod-
ern Contra-
ceptive Users
(Million)
Current
Share
(2012-
13)
2020
Share
(Target)
2013
2020
Additional Users (Mil-
lion)
(2013-20)
Public Private Total
Annual Unique Users
(differences in limiting
methods only) (Million)
(2013-20)
Public Private Total
Pill
4.2 6.3 8% 10% 10.02 16.47 1.51 4.94 6.45 22.03 72.11 94.14
Condom
6.5 8.9 12% 14% 15.42 23.41 1.87 6.12 8.00 32.29 105.70 137.99
IUD
1.1 4.0 2% 6% 2.70 10.40 1.77 5.93 7.70 10.12 33.86 43.98
Female
Sterilization
39.9 44.8 76% 68% 94.65 117.92 19.62 3.65 23.27 19.62 3.65 23.27
Male
Sterilization
0.7 1.3 1% 2% 1.56 3.47 1.61 0.30 1.91 1.61 0.30 1.91
Others
0.4 0.7 1% 1% 0.92 1.73 0.19 0.63 0.82 2.16 7.24 9.40
Any
Modern
Method
52.8 65.9 100% 100% 125.27 173.41 26.57 21.58 48.14 87.82 222.86 310.69
Option 4: Reaching target additional 48 million, reaching Ministry’s target
method mix, additional users (above Option 1) allocated to public sector
Projected Mod-
Specific
Projected mCPR
(%)
Method Mix
Contraceptive
Method
2013
(AHS/
DLHS4)
2020
Current
Share
(2012-
13)
2020
Share
(Target)
ern Contra-
ceptive Users
(Million)
2013 2020
Additional Users (Million)
(2013-20)
Public Private Total
Annual Unique Users
(differences in limiting
methods only) (Million)
(2013-20)
Public Private Total
Pill
4.2 6.3 8% 10% 10.02 16.47 4.44 2.01 6.45 32.62 61.52 94.14
Condom
6.5 8.9 12% 14% 15.42 23.41 4.90 3.09 8.00 43.36 94.62 137.99
IUD
1.1 4.0 2% 6% 2.70 10.40 7.15 0.55 7.70 27.29 16.69 43.98
Female
Sterilization
39.9 44.8 76% 68% 94.65 117.92 19.38 3.89 23.27 19.38 3.89 23.27
Male
Sterilization
0.7 1.3 1% 2% 1.56 3.47 1.85 0.06 1.91 1.85 0.06 1.91
Others
0.4 0.7 1% 1% 0.92 1.73 0.63 0.19 0.82 3.73 5.67 9.40
Any
Modern
Method
52.8 65.9 100% 100% 125.27 173.41 38.35 9.79 48.14 128.23 182.46 310.69
29

4.4 Page 34

▲back to top


Option 5: Reaching the target CPR, target method mix +
allocating additional users to SF/SM channels
Projected
mCPR (%) Method Mix
Specific
Contracep-
tive Method
2013
(AHS/ 2020
DLHS4)
Cur-
rent
Share
(2012-
13)
2020
Share
(Tar-
get)
Projected
Modern
Contracep-
tive Users
(Million)
2013 2020
Additional Users (Million)
(2013-20)
Public Private SF/SM Total
Annual Unique Users (dif-
ferences in limiting methods
only) (Million)
(2013-20)
Public Private SF/SM Total
Pill
4.2 6.3 8% 10% 10.02 16.47 1.51 2.01 2.93 6.45 22.03 61.52 10.59 94.14
Condom
6.5 8.9 12% 14% 15.42 23.41 1.87 3.09 3.03 8.00 32.29 94.62 11.08 137.99
IUD
1.1 4.0 2% 6% 2.70 10.40 1.77 0.55 5.38 7.70 10.12 16.69 17.18 43.98
Female
Sterilization
39.9 44.8 76% 68% 94.65 117.92 19.62 3.89 -0.24 23.27 19.62 3.89 -0.24 23.27
Male
Sterilization
0.7 1.3 1% 2% 1.56 3.47 1.61 0.06 0.24 1.91 1.61 0.06 0.24 1.91
Others
0.4 0.7 1% 1% 0.92 1.73 0.19 0.19 0.44 0.82 2.16 5.67 1.57 9.40
Any
Modern
Method
52.8 65.9 100% 100% 125.27 173.41 26.57 9.79 11.78 48.14 87.82 182.46 40.41 310.69
Option 6: Reaching target additional 48 million, higher share for spacing meth-
od (others), additional users (above Option 1) allocated to public sector
Addi-
Projected Mod- tional
Projected
mCPR (%)
Method Mix
ern Contra- Users
ceptive Users (Million)
Specific
(Million) (2013-
Contracep-
20)
tive Method
2013
(AHS/
DLHS4)
2020
Current 2020
Share Share
(2012- (Sug-
13) gested)
2013
2020
Public Private Total
Annual Unique Users
(differences in limiting
methods only) (Million)
(2013-20)
Public Private Total
Pill
4.2 6.3 8% 10% 10.02 16.47 4.44 2.01 6.45 32.62 61.52 94.14
Condom
6.5 8.9 12% 14% 15.42 23.41 4.90 3.09 8.00 43.36 94.62 137.99
IUD
1.1 4.0 2% 6% 2.70 10.40 7.15 0.55 7.70 27.29 16.69 43.98
Female
Sterilization
39.9 42.2 76% 64% 94.65 110.98 12.44 3.89 16.33 12.44 3.89 16.33
Male
Sterilization
0.7 1.3 1% 2% 1.56 3.47 1.85 0.06 1.91 1.85 0.06 1.91
Others
0.4 3.3 1% 5% 0.92 8.67 7.57 0.19 7.75 22.59 5.67 28.25
Any
Modern
Method
52.8 65.9 100% 100% 125.27 173.41 38.35 9.79 48.14 140.15 182.46 322.61
30

4.5 Page 35

▲back to top


Option 7: Reaching target additional 48 million, higher share for spacing method (others) +
allocating additional users to SF/SM channels
Projected
mCPR (%)
Specific
Contraceptive
Method
2013
(AHS/ 2020
DLHS4)
Projected
Method Mix
Modern
Contraceptive
Users (Million)
Additional Users (Million)
(2013-20)
Cur-
rent
Share
(2012-
13)
2020
Share
(Sug-
gested)
2013
2020
Public Private SF/SM
Total
Annual Unique Users (dif-
ferences in limiting methods
only) (Million)
(2013-20)
Public Private SF/SM Total
Pill
4.2 6.3 8% 10% 10.02 16.47 1.51 2.01 2.93 6.45 22.03 61.52 10.59 94.14
Condom
6.5 8.9 12% 14% 15.42 23.41 1.87 3.09 3.03 8.00 32.29 94.62 11.08 137.99
IUD
1.1 4.0 2% 6% 2.70 10.40 1.77 0.55 5.38 7.70 10.12 16.69 17.18 43.98
Female
Sterilization
39.9 42.2 76% 64% 94.65 117.92 19.62 3.89 -7.18 16.33 19.62 3.89 -7.18 16.33
Male
Sterilization
0.7 1.3 1% 2% 1.56 3.47 1.61 0.06 0.24 1.91 1.61 0.06 0.24 1.91
Others
0.4 3.3 1% 5% 0.92 1.73 0.19 0.19 7.38 7.75 2.16 5.67 20.43 28.25
Any Modern
Method
52.8 65.9 100% 100% 125.27 173.41 26.57 9.79 11.78 48.14 87.82 182.46 52.33 322.61
31

4.6 Page 36

▲back to top


ANNEX 2: PROJECTION OF USERS OF CONTRACEPTIVE
METHODS UNDER ALTERNATIVE SCENARIOS
10 STATES13
(All figures in millions)
Option 1: As usual, linear projections, unchanged pub-
lic-private mix, unchanged method mix
Projected mCPR
Specific
(%)
Contraceptive
Method
2013
(AHS/ 2020
DLHS4)
Projected Modern
Contraceptive
Users (Million)
2013 2020
Additional Users (Million)
(2013-20)
Annual Unique Users (differ-
ences in limiting methods only)
(Million)
(2013-20)
Public Private Total Public Private Total
Pill
4.1
5.1
4.58
6.31
0.38
1.35
1.73
9.00 29.61 38.61
Condom
8.0
10.1
8.92 12.56
0.73
2.92
3.64 17.22 59.04 76.26
IUD
Female
Sterilization
Male
Sterilization
Others
Any
Modern
Method
0.9
1.1
0.97
1.36
0.08
0.31
0.39
1.97
6.30
8.27
31.5
38.2 34.91 47.40 10.46
2.03 12.49 10.46
2.03 12.49
0.5
0.6
0.59
0.80
0.17
0.03
0.20
0.17
0.03
0.20
0.6
0.8
0.65
0.94
0.05
0.24
0.29
1.01
4.61
5.63
45.6 55.8 50.61 69.37 11.87 6.88 18.75 39.83 101.63 141.47
Option 2: Reaching the target CPR, linear projections, unchanged public-private mix,
unchanged method mix
Specific
Contraceptive
Method
Projected mCPR
(%)
Projected Modern
Contraceptive
Users (Million)
2013
(AHS/
DLHS4)
2020
2013
2020
Pill
4.1
6.0 4.58 7.51
Condom
8.0 11.8 8.92 14.71
IUD
0.9
1.3 0.97 1.61
Female
Sterilization
31.5 44.2 34.91 54.96
Male
Sterilization
0.5
0.7 0.59 0.91
Others
0.6
0.9 0.65 1.15
Any Modern
Method
45.6
65.1 50.61 80.84
Additional Users (Million)
(2013-20)
Annual Unique Users (dif-
ferences in limiting methods
only) (Million)
(2013-20)
Public Private Total Public Private Total
0.62
1.05
0.12
16.27
2.31 2.93 9.85 33.02 42.87
4.74 5.79 18.36 65.41 83.77
0.52 0.64 2.10 7.03 9.13
3.79 20.05 16.27 3.79 20.05
0.27 0.05 0.31 0.27 0.05 0.31
0.08 0.43 0.50 1.04 4.88 5.92
18.40 11.83 30.23 47.88 114.17 162.05
32
13 8 EAG states (Bihar, Chhattisgarh, Jharkhand, Madhya Pradesh, Odisha, Rajasthan, UP and Uttarakhand),Assam, and Himachal
Pradesh

4.7 Page 37

▲back to top


Option 3: Reaching the target CPR, target method mix, same public-private mix
Specific
Contraceptive
Method
Projected mCPR
(%)
Projected Modern
Contraceptive
Users (Million)
Additional Users (Million)
(2013-20)
2013
(AHS/
DLHS4)
2020
2013
2020 Public Private Total
Annual Unique Users (dif-
ferences in limiting methods
only) (Million)
(2013-20)
Public Private Total
Pill
4.1
7.0 4.58 8.74 0.89 3.28 4.17 10.78 36.22 46.99
Condom
8.0 12.1 8.92 15.00 1.07 5.01 6.08 18.39 66.19 84.58
IUD
0.9
3.3 0.97 4.04 0.71 2.37 3.07 3.89 12.58 16.47
Female
Sterilization
31.5 41.3 34.91 51.35 13.27 3.16 16.44 13.27 3.16 16.44
Male Sterilization
0.5
0.8 0.59 0.99 0.33 0.07 0.39 0.33 0.07 0.39
Others
0.6
0.6 0.65 0.72 0.01 0.06 0.08 0.88 3.94 4.83
Any Modern
Method
45.6 65.1 50.61 80.84 16.28 13.95 30.23 47.54 122.16 169.70
Option 4: Reaching the target CPR, target method mix +
allocating additional users to public sector
Specific
Contraceptive
Method
Projected mCPR
(%)
2013
(AHS/ 2020
DLHS4)
Projected
Modern Con-
traceptive Users
(Million)
2013 2020
Additional Users (Million)
(2013-20)
Public Private Total
Annual Unique Users
(differences in limiting
methods only) (Million)
(2013-20)
Public Private Total
Pill
4.1
7.0 4.58 8.74 2.82 1.35 4.17 17.38 29.61 46.99
Condom
8.0 12.1 8.92 15.00 3.16 2.92 6.08 25.53 59.04 84.58
IUD
0.9
3.3 0.97 4.04 2.77 0.31 3.07 10.17 6.30 16.47
Female
Sterilization
31.5 41.3 34.91 51.35 14.40 2.03 16.44 14.40 2.03 16.44
Male
Sterilization
0.5
0.8 0.59 0.99 0.37 0.03 0.39 0.37 0.03 0.39
Others
0.6
0.6 0.65 0.72 -0.17 0.24 0.08 0.21 4.61 4.83
Any
Modern
Method
45.6 65.1 50.61 80.84 23.34 6.88 30.23 68.06 101.63 169.70
33

4.8 Page 38

▲back to top


Option 5: Reaching the target CPR, target method mix +
allocating additional users to SF/SM channels
Specific
Contraceptive
Method
Projected
mCPR (%)
2013
(AHS/ 2020
DLHS4)
Projected
Modern
Contraceptive
Users (Million)
Additional Users (Million)
(2013-20)
2013 2020 Public Private SF/SM Total
Annual Unique Users (differ-
ences in limiting methods only)
(Million)
(2013-20)
Public Private SF/SM Total
Pill
4.1 7.0 4.58 8.74 0.89 1.35 1.93 4.17 10.78 29.61 6.61 46.99
Condom
8.0 12.1 8.92 15.00 1.07 2.92 2.09 6.08 18.39 59.04 7.15 84.58
IUD
0.9 3.3 0.97 4.04 0.71 0.31 2.06 3.07 3.89 6.30 6.27 16.47
Female
Sterilization
31.5 41.3 34.91 51.35 13.27 2.03 1.13 16.44 13.27 2.03 1.13 16.44
Male
Sterilization
0.5 0.8 0.59 0.99 0.33 0.03 0.04 0.39 0.33 0.03 0.04 0.39
Others
0.6 0.6 0.65 0.72 0.01 0.24 -0.18 0.08 0.88 4.61 -0.67 4.83
Any Modern
Method
45.6 65.1 50.61 80.84 16.28 6.88 7.06 30.23 47.54 101.63 20.52 169.70
* The results are aggregate of results derived from individual states.
** Option 6 and 7 were not considered for individual states.
34

4.9 Page 39

▲back to top


ANNEX 3: APPROVED ALLOCATION FOR FAMILY PLANNING
THROUGH NRHM FLEXIPOOL IN INDIA
(2013/14 – 2015/16)
(in Rs. Crore)
2013-14
2014-15
2015-16
Approved
Approved
Approved
States
Direct HR (10%) Total Direct HR(10%) Total Direct HR(10%) Total
Andhra Pradesh 56.3013 10.7285 67.0298 34.725 14.651 49.376 35.23 16.96 52.19
Haryana
12.754 3.383 16.137 14.435 9.52 23.955 20.016 9.32 29.336
Karnataka
34.244 3.877 38.121 29.495 12.77 42.265 31.456 14.62 46.076
Kerala
6.7026 4.657 11.3596 5.319 7.334 12.653 5.013 7.532 12.545
Maharashtra
43.486 16.467 59.953 41.993 28.7 70.693 46.953 27.13 74.083
Punjab
17.81 2.574 20.384 8.7075 6.85 15.5575 8.297 7.374 15.671
Tamil Nadu
30.3515 7.955 38.3065 20.3745 23.29 43.6645 28.71 22.98 51.69
Gujarat
36.212 5.777 41.989 37.979 8.364 46.343 66.4 9.31 75.71
West Bengal
36.73 13.987 50.717 46.703 21.738 68.441 27.218 22.748 49.966
Telengana
0
0
0 25.522 10.69 36.212 23.411 11.94 35.351
Tripura
3.169 0.441 3.61 3.468 0.94 4.408 2.88 1.21 4.09
Manipur
1.724 0.456 2.18 1.5073 1.498 3.0053 2.85 1.64 4.49
Meghalaya
1.4537 0.84 2.2937 1.51 2.07 3.58 2.262 2.39 4.652
Arunachal
2.446 0.583 3.029 1.46 1.59 3.05 0.989 2.807 3.796
Mizoram
1.3 0.89 2.19 1.218 2.03 3.248 1.887 2.57 4.457
Nagaland
1.807 1.347 3.154 1.403 2.218 3.621 1.203 2.43 3.633
Sikkim
0.344 0.446 0.79 0.589 0.876 1.465 0.247 0.995 1.242
Goa
0.763 0.318 1.081 0.419 0.565 0.984 0.469 0.68 1.149
Assam
25.32 11.16 36.48 29.13 28.67 57.8 37.35 30.84 68.19
Bihar
91.135 12.44 103.575 71.244 24.4 95.644 120.787 28.277 149.064
Chhattisgarh
28.239 4.286 32.525 30.3 7.816 38.116 17.326 10.5 27.826
Jharkhand
25.665 6.865 32.53 35.0242 11.656 46.6802 53.239 15.924 69.163
Madhya Pradesh 96.869 8.482 105.351 89.376 22.07 111.446 113.017 31.767 144.784
Odisha
22.424 4.775 27.199 30.551 8.38 38.931 41.072 10.27 51.342
Rajasthan
78.114 8.364 86.478 71.371 13.52 84.891 115.438 19.835 135.273
Uttar Pradesh 94.139 21.004 115.143 112.523 34.97 147.493 169.978 42.259 212.237
Uttarakhand
4.989 2.119 7.108 7.589 3.129 10.718 9.349 3.62 12.969
Himachal
4.841 1.2999 6.1409 7.815 0.73 8.545 6.22 2.38
8.6
Delhi
3.157 3.277 6.434 5.122 4.71 9.832 4.369 4.228 8.597
Chandigarh
0.1 0.55 0.65 0.2906 1.069 1.3596
0
35

4.10 Page 40

▲back to top


2013-14
2014-15
2015-16
Approved
Approved
Approved
States
Direct HR (10%) Total Direct HR(10%) Total Direct HR(10%) Total
A&N Islands
0.37 0.38 0.75 0.4133 0.78 1.1933 0.497 0.83 1.327
Dadra
0.21 0.218 0.428 1.022 0.523 1.545 0.6164 0.71 1.3264
Daman
0.85 0.226 1.076 0.099 0.514 0.613 0.1985 0.533 0.7315
Total
resources
through
NRHM
flexipool
764.02 160.17 924.19 768.70 318.63 1087.33 994.95 366.61 1361.56
Contraceptive
+ supply
298.65
200
100
IEC (Central)
230
252
150
Total Direct
Cost (Rs.
Crore), A+B
1452.84
1539.33
1611.56
Source: ROPs of individual states
36

5 Pages 41-50

▲back to top


5.1 Page 41

▲back to top


ANNEX 4: PROJECTED RESOURCE REQUIREMENT FOR FP
2020, 2013/14 – 2015/16) IN INDIA
(in Rs. Billion)
Option 1: As usual, linear projections, unchanged public-
private mix, unchanged method mix
Year
Unit cost in subsequent
years with 5% inflation
Estimated unique public
users
Requirement (in Rs.
billion )
Approved (in Rs. billion)
(CAGR 0.0532 from
2016/17)
2013-14 2014-15 2015-16 2016-17 2017-18 2018-19 2019-20 Total
1520.81 1596.86 1676.70 1760.53 1848.56 1940.99 2038.04
9756938 10086769 10427751 10780259 11144684 11521428 11910908
14.84
16.11
17.48
18.98
20.60
22.36
24.27 134.65
14.53
15.39
16.12
16.97
17.88
18.83
19.83 119.54
Option 2: Reaching target additional 48 million, linear projections,
unchanged public-private mix, unchanged method mix
Year
2013-14 2014-15 2015-16 2016-17 2017-18 2018-19 2019-20 Total
Unit cost in subsequent
years with 5% inflation
1520.81 1596.86 1676.70 1760.53 1848.56 1940.99 2038.04
Estimated unique public
users
10905448 11416613 11951738 12511946 13098412 13712367 14355100
Requirement (in Rs.
billion )
16.59
18.23
20.04
22.03
24.21
26.62
29.26 156.97
Approved (in Rs. billion )
14.5
15.4
16.1
17.0
17.9
18.8
19.8
119.5
Option 3: Reaching target additional 48 million, reaching Ministry’s
target method mix, unchanged public-private mix
Year
2013-14 2014-15 2015-16 2016-17 2017-18 2018-19 2019-20 Total
Unit cost in subsequent
years with 5% inflation
1520.81 1596.86 1676.70 1760.53 1848.56 1940.99 2038.04
Estimated unique public
users
10036905 10740188 11512572 12363727 13305035 14349934 15514327
Requirement (in Rs.
billion )
15.26
17.15
19.30
21.77
24.60
27.85
31.62 157.55
Approved (in Rs. billion )
14.53
15.39
16.12
16.97
17.88
18.83
19.83 119.54
37

5.2 Page 42

▲back to top


Option 4: Reaching target additional 48 million, reaching Ministry’s target
method mix, additional users (above Option 1) allocated to public sector
Year
2013-
14
2014-
15
2015-
16
2016-
17
2017-
18
2018-
19
2019-
20
Unit cost in subsequent
years with 5% inflation
1520.81 1596.86 1676.70 1760.53 1848.56 1940.99 2038.04
Estimated unique public
users
11077331 12990390 15159327 17623972 20431452 23637657 27309001
Requirement
(in Rs. billion )
16.85
20.74
25.42
31.03
37.77
45.88
55.66
Approved (in Rs. billion )
14.53
15.39
16.12
16.97
17.88
18.83
19.83
Total
233.34
119.54
Option 5: Reaching the target CPR, target method mix +
allocating additional users to SF/SM channels
Year
2013-14 2014-15 2015-16 2016-17 2017-18 2018-19 2019-20
Unit cost of public users
in subsequent years with
5% inflation
1520.81 1596.86 1676.70 1760.53 1848.56 1940.99 2038.04
Estimated unique public
users
10036905 10740188 11512572 12363727 13305035 14349934 15514327
Unit cost of SF/SM users
in subsequent years with
5% inflation
2379
2498
2623
2754
2892
3036
3188
Estimated unique SF/SM
users
1040425 2250203 3646755 5260245 7126417 9287723 11794674
Requirement of public
fund (in Rs. billion )
15.26
17.15
19.30
21.77
24.60
27.85
31.62
Requirement of SF/SM
fund (in Rs. billion )
2.48
5.62
9.56
14.49
20.61
28.20
37.60
Total requirement
17.74
22.77
28.87
36.25
45.20
56.05
69.22
Approved (in Rs. billion )
14.53
15.39
16.12
16.97
17.88
18.83
19.83
Total
157.55
118.55
276.10
119.54
Option 6: Reaching target additional 48 million, higher share for spacing method
(others), additional users (above Option 1) allocated to public sector
Year
2013-14 2014-15 2015-16 2016-17 2017-18 2018-19 2019-20
Unit cost in subsequent
years with 5% inflation
1520.81 1596.86 1676.70 1760.53 1848.56 1940.99 2038.04
Estimated unique public
users
10495083 12744906 15420562 18629370 22511732 27252375 33095581
Requirement (in Rs.
billion )
15.96
20.35
25.86
32.80
41.61
52.90
67.45
Approved (in Rs. billion )
14.53
15.39
16.12
16.97
17.88
18.83
19.83
Total
256.93
119.54
38

5.3 Page 43

▲back to top


Option 7: Reaching target additional 48 million, higher share for spacing
method (others) + allocating additional users to SF/SM channels
Year
2013-14 2014-15 2015-16 2016-17 2017-18 2018-19 2019-20 Total
Unit cost of public users
in subsequent years with
5% inflation
1520.81 1596.86 1676.70 1760.53 1848.56 1940.99 2038.04
Estimated unique public
users
10036905 10740188 11512572 12363727 13305035 14349934 15514327
Unit cost of SF/SM users
in subsequent years with
5% inflation
2379
2498
2623
2754
2892
3036
3188
Estimated unique SF/SM
users
458177 2004718 3907990 6265643 9206697 12902441 17581254
Requirement of public
fund (in Rs. billion )
15.26
17.15
19.30
21.77
24.60
27.85
31.62 157.55
Requirement of SF/SM
fund (in Rs. billion )
1.09
5.01
10.25
17.25
26.62
39.17
56.05 155.44
Total requirement
16.35
22.16
29.55
39.02
51.22
67.03
87.67 312.99
Approved (in Rs. billion)
14.53
15.39
16.12
16.97
17.88
18.83
19.83 119.54
39

5.4 Page 44

▲back to top


ANNEX 5: PROJECTED RESOURCE REQUIREMENT FOR FP
2020, 2013/14 – 2015/16), 10 States (in Rs. billion)
Option 1: As usual, linear projections, unchanged public-
private mix, unchanged method mix
Year
Unit cost in subsequent
years with 5% inflation
Estimated unique public
users
Requirement
(in Rs. billion )
Approved (in Rs. billion)
(CAGR 0.01305 from
2016/17)
2013-14 2014-15 2015-16 2016-17 2017-18 2018-19 2019-20
1648.15 1730.56 1817.09 1907.94 2003.34 2103.51 2208.68
4969177 5190836 5423203 5666832 5922306 6190242 6471292
8.19
8.98
9.85
10.81
11.86
13.02
14.29
7.67
8.22
9.80
12.09
14.98
18.62
23.20
Total
77.02
94.57
Option 2: Reaching target additional 48 million, linear projections,
unchanged public-private mix, unchanged method mix
Year
Unit cost in subsequent
years with 5% inflation
Estimated unique public
users
Requirement
(in Rs. billion )
Approved
(in Rs. billion )
2013-14 2014-15 2015-16 2016-17 2017-18 2018-19 2019-20
1648.15 1730.56 1817.09 1907.94 2003.34 2103.51 2208.68
5594363 5958351 6349970 6771530 7225544 7714747 8269187
9.22
10.31
11.54
12.92
14.48
16.23
18.26
7.67
8.22
9.80
12.09
14.98
18.62
23.20
Total
92.96
94.57
Option 3: Reaching target additional 48 million, reaching Ministry’s
target method mix, unchanged public-private mix
Year
Unit cost in subsequent
years with 5% inflation
Estimated unique public
users
Requirement
(in Rs. billion )
Approved
(in Rs. billion )
2013-14 2014-15 2015-16 2016-17 2017-18 2018-19 2019-20
1648.15 1730.56 1817.09 1907.94 2003.34 2103.51 2208.68
5349514 5747378 6187581 6676514 7221909 7833191 8521952
8.82
9.95
11.24
12.74
14.47
16.48
18.82
7.67
8.22
9.80
12.09
14.98
18.62
23.20
Total
92.51
94.57
40

5.5 Page 45

▲back to top


Option 4: Reaching target additional 48 million, reaching Ministry’s target
method mix, additional users (above Option 1) allocated to public sector
Year
Unit cost in subsequent
years with 5% inflation
Estimated unique public
users
Requirement
(in billion Rs.)
Approved (in billion Rs)
2013-14 2014-15 2015-16 2016-17 2017-18 2018-19 2019-20 Total
1648.15 1730.56 1817.09 1907.94 2003.34 2103.51 2208.68
5910186 6869425 7983561 9280698 10795124 12568949 14654246
9.74
11.89
14.51
17.71
21.63
26.44
32.37 134.27
7.67
8.22
9.80
12.09
14.98
18.62
23.20
94.57
Option 5: Reaching the target CPR, target method mix +
allocating additional users to SF/SM channels
Year
Unit cost of public users
in subsequent years with
5% inflation
2013-14 2014-15 2015-16 2016-17 2017-18 2018-19 2019-20
1648.15 1730.56 1817.09 1907.94 2003.34 2103.51 2208.68
Total
Estimated unique public
users
Unit cost of SF/SM users
in subsequent years with
5% inflation
5349514
2379
5747378 6187581
2498
2623
6676514
2754
7221909 7833191
2892
3036
8521952
3188
Estimated unique SF/SM
users
Requirement of public
fund (in Rs. billion )
560672 1122047 1795981 2604184 3573215 4735758 6132294
8.82
9.95
11.24
12.74
14.47
16.48
18.82
92.51
Requirement of SF/SM
fund (in Rs. billion )
1.33
2.80
4.71
7.17
10.33
14.38
19.55
60.28
Total requirement
10.15
12.75
15.95
19.91
24.80
30.86
38.37 152.79
Approved (in Rs. billion )
7.67
8.22
9.80
12.09
14.98
18.62
23.20
94.57
* The results are aggregate of results derived from individual states.
** Options 6 and 7 were not considered for individual states
41

5.6 Page 46

▲back to top


5.7 Page 47

▲back to top


5.8 Page 48

▲back to top


B-28, Qutab Institutional Area, New Delhi-110016, India