Impact of COVID-19 on Young People _ Rapid Assessment in Three States%2C May 2020%2C Bihar%2C Rajasthan and Uttar pradesh Full Report %28English%29

Impact of COVID-19 on Young People _ Rapid Assessment in Three States%2C May 2020%2C Bihar%2C Rajasthan and Uttar pradesh Full Report %28English%29


1 Pages 1-10

▲back to top


1.1 Page 1

▲back to top


Impact of COVID-19
on young people:
Rapid assessment in three states, May 2020
(Bihar, Rajasthan and Uttar Pradesh)

1.2 Page 2

▲back to top


Contents
Executive Summary
1
1.
Introduction
5
1.1 Background and Context
5
1.2 Objectives of the Study
6
1.3 Research Methodology and Sampling
6
1.4 Challenges and Limitations
7
2.
Socio-Demographic Characteristics of Respondents
8
2.1 Response Rate
8
2.2 Age of Respondents
8
2.3 Sex Composition of Respondents
8
2.4 Social Categories
9
2.5 Education Status and Level
9
2.6 Marital Status
9
2.7 Occupation
10
3.
Facing the Pandemic: Knowledge, Attitudes and Practices of COVID-19
among Young People in three States
11
3.1 Awareness on COVID-19 Symptoms
11
3.2 Awareness of and Abiding by Basic Prevention Practices
12
3.3 Sources of Information
12
3.4 Measures to Take if Exhibiting COVID-19 Symptoms
13
3.5 Key Findings
15
4.
Facing the Pandemic: Challenges and Impacts of COVID-19 among Young People in India
16
4.1 Changes in Routines, Interactions and Moods
16
4.2 Awareness of and Access to Reproductive Healthcare Services and Coping Mechanism
22
4.3 Mental Health Services
24
4.4 Key Findings
26
5.
Needs and Priorities
27
5.1 Key Findings
27
5.2 Needs and Priorities
28
5.3 Way Forward–Short and Long Term Strategies
29
Annexure
31

1.3 Page 3

▲back to top


Abbreviations
COVID-19
EE
FP
FLW
GOI
IFA
MoHFW
NGO
PFI
PSA
RH
SBCC
SC
ST
Coronavirus Disease
Entertainment Education
Family Planning
Front-line Workers
Government of India (GoI)
Iron and Folic Acid
Ministry of Health and Family Welfare
Non-government Organization
Population Foundation of India
Public Service Announcement
Reproductive Health
Social and Behavioural Change Communication
Scheduled Caste
Schedule Tribe

1.4 Page 4

▲back to top


Executive Summary
The COVID-19 pandemic has engulfed countries
across the world in a short span of time. For India,
it was and continues to be the biggest health
and humanitarian crisis since independence. The
Government of India declared COVID-19 as a
national disaster and, to contain the spread of the
disease, imposed a complete lockdown across the
country on March 25, 2020. This continues till date,
in myriad forms and with variations across states
and zones.
The pandemic and the prolonged lockdown have
adversely impacted a wide range of areas, including
health, economy, livelihood, social and professional
interactions. It led to loss of livelihoods for millions
of people, and an exodus of migrants from cities
back to their villages, with a devastating cost of
human lives and suffering.
Although the Ministry of Health and Family Welfare,
Government of India, included reproductive health
and family planning as essential health services in its
guidelines, the lockdown and the focus of the public
health machinery on containing the pandemic,
restricted women’s mobility and access to health
services.
Slowly but steadily, the adverse impact of COVID-19
on mental health are beginning to emerge globally.
There was a surge in gender-based, and intimate
partner violence across countries such as China,
UK, USA, and India, and a high prevalence of
psychological distress, anger, depression and post-
traumatic stress disorder.
The implications of interrupted reproductive
healthcare and on mental health have to be critically
explored among young people in India. Constituting
nearly one-fifth of the country’s population,
adolescents face educational uncertainties (with the
closure of schools and colleges, and a patchy access
to digital learning), restrictions on their mobility,
freedom and socialisation, an increase in domestic
chores and household conflict (disproportionately
borne by women), and anxieties around their
employment prospects, among others.
To understand how India’s young people are
coping with these challenges, in May 2020,
Population Foundation of India (PFI) conducted
a rapid assessment to understand the level of
knowledge and attitude of young population (15-
24 years) towards COVID-19, how it has impacted
their lives and mental health, and their needs and
priorities. The responses thus generated would be
analysed to advocate for measures that can best
address these needs, both during the COVID-19
outbreak and continuing after that.
Mindful of the limitations on inter-personal
interactions during the lockdown, a telephonic
survey was deemed to be the most appropriate
method of data collection. The survey questionnaire
was developed and digitised for use on Collect, a
mobile data collection platform. The survey was
conducted in the three states of Uttar Pradesh,
Rajasthan and Bihar, where PFI has state offices and
has ongoing initiatives with young people.
The selection of districts, blocks and respondents
in three states was purposive in nature, based on
presence of NGO partners and availability of contact
details of young people with them. The objective was
to ensure seeking varied perspectives and insights
from the respondents on research questions.
Key Findings
The rapid assessment revealed that young people
in India were well aware of COVID-19, its symptoms,
care, and safety measures, but they continue to
face certain challenges during the accompanying
lockdown, including in their access to reproductive
1

1.5 Page 5

▲back to top


Impact of COVID-19 on young people: Rapid assessment in three states, May 2020
health and mental well-being. Key findings are
summarized below:
Awareness
z Respondents’ awareness on the symptoms of
COVID-19 was high; a majority were able to
identify at least two key symptoms, such as
cough, fever, breathing difficulties and body
ache. Respondents were also very well-informed
on the basic safety and prevention practices,
such as washing hands frequently, covering
faces, and practicing social distancing. An
overwhelming majority also reported following
these practices diligently. The lockdown, which
was in effect nationwide at the time of the study,
was being followed by most of them.
z Generally, males, those who were older, and
with higher levels of education were better
informed than females, younger cohort and
those with lower levels of education. The
awareness of symptoms was lower among
socially marginalised groups, like SCs and STs.
z The primary sources of information for young
people continue to be traditional media such
as TV and policy briefings, and face-to-face
interactions with FLWs. WhatsApp was another
common medium although other digital
technology-dependent portals such as Twitter,
Arogya Setu app, and Facebook were not
common sources of information.
z Schools were rarely listed as a source of
information, indicating the inability of
educational institutions to transcend the
boundaries of school premises and the
academic session to stay connected with
students. But here, states can learn from one
another to emulate best practices: in Rajasthan,
for example, one-fourth of the total respondents
listed schools as a reliable source of information
on COVID-19.
z A majority of the respondents also noted that
they would contact a doctor, self-isolate, and
facilitate contact tracing, if they or someone they
knew exhibited symptoms. A sizeable number
also said that they would contact a FLW or the
Pradhan to relay their symptoms and seek
advice on the way forward.
z The continued relevance of local on-ground
persons and institutions, like FLWs, as reliable
sources of information and as persons to
contact in case of suspected COVID-19 reiterate
the importance of these institutions in handling
a public health emergency. Going forward, it
is essential to empower, equip and strengthen
these as much as possible.
Challenges
z One of the primary challenges that young
people experienced with the nationwide
lockdown was the increase in their workload of
domestic chores. Expectedly, more females than
males reported an increase in their domestic
workload.
z Increase in domestic conflicts or fights at
home were only reported by one-fourth of the
participants. Many of those who did report an
increase in domestic fights were women.
z A small number of respondents reported about
economic anxieties during the lockdown, and
most of these were those who were already
employed, followed closely by those who were
unemployed and actively looking for a job.
z A little more than half the total respondents
reported watching more TV during the lockdown
while a little less than half reported an increase
in their social media use. However, many of
those who reported a decrease in their TV
watching or social media use were women.
z A small fraction of the total respondents
reported feeling depressed, frustrated and
irritable. Interestingly, there was a coincidence
whereby a greater number of those feeling
depressed or frustrated and irritable also
reported an uptick in their TV and social media
consumption during the lockdown. More
in-depth qualitative research is needed to
understand what this trend signifies.
2

1.6 Page 6

▲back to top


Access to Reproductive Healthcare
z Although nearly 3 out of 5 respondents reported
having had some contact with FLWs during
the lockdown, their access to reproductive
healthcare was interrupted during the lockdown.
z More than half the women reported an unmet
need for sanitary pads and only one-third of the
young people confirmed their receipt of IFAs
during the lockdown. A majority of young people
were also not aware that FLWs could provide
contraceptives during the lockdown
Mental Health Services
z More than half the young people confirmed
that they had access to information on mental
health, and nearly half among them said that
they had used some form of mental health
service or resource. In Uttar Pradesh, 89%
women reported having used some mental
health service during the lockdown.
z Nearly all of those who sought mental health
services found the assistance offered to be
either helpful or very helpful.
z Among the different resources that were used,
most common were face to face interaction
with healthcare providers, interactions with
friends, and TV. The high prevalence of informal
channels of information on healthcare, such
as friends or TV shows, is not ideal as the care
provided is not vetted for accuracy and those
delivering it are not trained to do so.
Needs and Priorities
Based on the rapid assessment findings, we have
identified the following core needs and priorities of
young people, during the pandemic and sustaining
them beyond.
z Access to Reproductive Health: As the
pandemic has shown, and our assessment
reiterated, access to reproductive healthcare
services suffered a blow during the COVID-19
outbreak. Young people reported unmet
needs for such services as the focus of India’s
public health system shifted to managing and
containing the pandemic.
z Mental Health Care: Young people have
expressed the need for mental health care
services, and those who have used these, have
found them to be positively influential. However,
for many young people, informal channels
for mental health–such as conversations with
friends–dominate the available resources.
These informal channels are not necessarily
verified and the information or mediation they
offer are not necessarily vetted or appropriate.
Hence, there is an urgent need to develop and
streamline formal channels of mental health
services that are trained, reliable and that are
easily accessible to young people.
z Double Care Burden on Women: A greater
proportion of female participants than male
participants reported an increase in their
domestic work as well as fights at home. This
is also mirrored in related figures, such as
more women reporting a decrease in their
TV consumption and social media usage
(presumably because of their increased workload,
which leaves less recreational time available), and
a large proportion of women in Uttar Pradesh
reported having sought and used some mental
health services during the pandemic. There is
an immediate need to address these through
social messaging on sharing domestic work
responsibilities and through easy availability of
mental healthcare services.
z Economic Anxieties among Men: Some men
reported being anxious about the economic
fallout of the pandemic; mostly, men who were
already employed showed concern, followed
by those who were unemployed but actively
seeking employment. The strengthening of
mental healthcare services in the wake of
COVID-19 must factor in economic anxiety and
be equipped to address it.
Recommendations
To address the aforementioned needs of young
people, the following strategies are suggested:
z Strengthen Information and its Dissemination
among Socially Marginalised Communities:
3

1.7 Page 7

▲back to top


Impact of COVID-19 on young people: Rapid assessment in three states, May 2020
There is a need to strengthen the messaging of
core information that is disseminated for public
consumption during a public health emergency,
like the current pandemic. A concerted
effort needs to be made to ensure that this
information reaches socially marginalized
communities, like SCs and STs. Targeted PSAs
on TV, communication through WhatsApp, and
door-to-door visits by FLWs can achieve this.
z Train Frontline Workers: FLWs were critical in
multiple roles: as sources of information, to
access primary healthcare facilities, for reporting
suspected symptoms, and as sources for mental
health related information. As multifaceted
and on-the-ground personnel, FLWs represent
the foundation of India’s public health system.
Investing time and resources in strengthening,
training and empowering them will serve us well
both during the pandemic and going ahead.
z Prioritize Reproductive Health Services: As
the pandemic has shown, and our assessment
reiterated, access to reproductive health
services and family planning-related services,
suffered a blow during the COVID-19 outbreak.
Young people reported unmet needs for such
services as the focus of India’s public health
system shifted to managing and containing
the pandemic. There is therefore, a need
to advocate for a continued priority for
reproductive health. FLWs need to be equipped
with better resources to effectively and
continually deliver reproductive health services.
Furthermore, to ensure that reproductive
health services are not interrupted, there is
a need to continually reiterate at the level of
public discourse that reproductive health is a
fundamental and inalienable aspect of public
health, and that its quality delivery is not a
choice but a requirement, especially in times of
a public health emergency. Relevant civil society
organizations need to collaborate and work with
different levels of governance toward this end.
z Social and Behavioural Change
Communication for Equitable Gender Norms:
Our research highlighted that more women
than men experienced an increase in their
workload, reported domestic fights, and used
mental health care services. These are related
statistics that demonstrate the double burden
of care on women during any public health
emergency. Government agencies and civil
society organizations need to continue making
concerted efforts to address and challenge
social norms that traditionally put the burden
for caregiving on women, with mental health
consequences. Employing edutainment –
educational entertainment – for social and
behavioural change is a step in the right
direction, given the high prevalence of TV
viewership among both men and women.
z Mental Healthcare Services: The delivery of
mental healthcare services through formal
and trained channels needs to be expanded
in response to young people’s growing need
for and use of it. There is a need to identify
and include more resources that can serve
young people, such as self-help kits, WhatsApp
communities, phone helplines and by training
lay counsellors and educators. FLWs, who were
one of the most reliable and commonly sources
for addressing mental health concerns, can be
further trained to effectively address young
people’s mental health concerns. Various civil
society organizations are already working in this
sphere, and their collaboration with relevant
government agencies is highly recommended.
z Reimagine Educational Institutions: Schools
were not a widely used source for reliable
information, and nor were they critical to the
continued delivery of mental health care or
access to IFAs. There is a need to reimagine
educational institutions in a way that fosters
deeper connections and interactions with
students that are not limited to them being in
school or the school being in academic session.
One way forward is to explore WhatsApp groups
and communities. Training educators to deliver
mental healthcare can strengthen a closer
interaction between students and educational
institutions.
4

1.8 Page 8

▲back to top


1 Introduction
1.1 BACKGROUND AND CONTEXT
The global pandemic COVID-19 is the biggest health
and humanitarian crisis for the country since
independence. The Government of India declared
COVID-19 as a national disaster and imposed
complete lockdown across the country on March 25,
2020 in order to contain the spread of the pandemic.
The COVID-19 outbreak and prolonged lockdown
have adversely impacted a wide range of areas,
including health, economy, livelihoods, social and
professional interactions. While the lockdown to
curb the transmission of COVID-19 helped contain
the immediate spread of the virus, it has significantly
affected the poor and marginalised men and
women, who represent nearly two thirds of India’s
population. It led to loss of livelihoods for millions
of people, leading to exodus of migrants from cities
back to their villages.
Evidence from past epidemics, including Ebola
and Zika, indicate that efforts to contain outbreaks
diverted resources from routine health services
including pre- and post-natal health care and
contraceptives,1 and exacerbate already limited
access to sexual and reproductive health services.2
Restricted availability of sexual and reproductive
health services will contribute to a rise in maternal
and newborn mortality, increased unmet need for
contraception, and increased number of unsafe
abortions and sexually transmitted infections.3
Though the Ministry of Health and Family Welfare,
Government of India included reproductive health
and family planning as essential health services in
its guidelines, the lockdown and other preventive
measures restricted women’s mobility and access
to health services at the healthcare facilities and in
outreach.
The COVID-19 pandemic and subsequent lockdowns
led to an increase in instances of gender-based
violence globally. WHO has already reported a
surge in the instances of reported violence in China,
the United Kingdom, the United States, and other
countries. The COVID-19 pandemic has caused a
parallel epidemic of fear, anxiety, and depression. A
review of different studies published this February in
the Lancet finds a high prevalence of psychological
distress, anger, depression and post-traumatic stress
disorder (PTSD) after episodes of people living in
isolation or quarantine in the face of epidemics such
as severe acute respiratory syndrome (SARS).4
UNESCO estimates that nearly 158 million girls5
enrolled in school or university in India, are currently
out of school because of COVID-19 closures. The
nationwide lockdown has resulted in restricted access,
mobility and freedom for all, including adolescents
and youths. The young population have conflicting
emotions around their studies, job insecurity,
obsessive compulsive disorder and uncertainties in
the wake of the pandemic outbreak, which are being
reported from different parts of the country.
1UNGA A/70/723. Protecting Humanity from Future Health Crises: Report of the High Level Panel on the Global Response to Health Crises.
Measure Evaluation (2017). The Importance of Gender in Emerging Infectious Diseases Data. Smith, Julia (2019). Overcoming the ‘tyranny of the urgent’: integrating
gender into disease outbreak preparedness and response, Gender and Development 27(2).
2Smith, Julia (2019). Overcoming the ‘tyranny of the urgent’: integrating gender into disease outbreak preparedness and response, Gender and Development 27(2).
3https://www.unfpa.org/resources/covid-19-gender-lens
4https://www.thelancet.com/coronavirus?dgcid=hubspot_landing-page_tlcoronavirus20_updates
5Source: UNESCO data https://en.unesco.org/covid19/educationresponse
5

1.9 Page 9

▲back to top


Impact of COVID-19 on young people: Rapid assessment in three states, May 2020
Population Foundation of India (PFI) has conducted
a rapid assessment to understand the level of
knowledge and attitude of young people towards
COVID-19, how it has impacted their lives, and which
of their needs/priorities need to be addressed post
COVID-19. The survey was carried out in the states of
Rajasthan, Bihar and Uttar Pradesh.
1.2 OBJECTIVES OF THE STUDY
The study seeks to understand the impact of the
COVID-19 pandemic and lockdown measures on
young people (15-24 years) in three states in India.
More specifically, the study had following objectives:
z To understand the level of knowledge, attitude
and practices of young people with regard
to COVID-19 outbreak, perception of risk to
disease, guidelines issued by the government
and measures taken at their household,
community and administrative levels.
z To understand the impact and challenges
of COVID-19 on young people (loss of study
and jobs, domestic violence, mental health
issues, access to health services, especially
Reproductive Health and Family Planning), their
coping mechanisms and immediate needs/
priorities.
1.3 RESEARCH METHODOLOGY AND SAMPLING
A rapid phone survey over a period of one week
(May 18-24, 2020) was conducted with a sample of
respondents (young people) in selected districts
from three states.
The following selection criteria were used for
selection of respondents.
z Respondents from the PFI’s project areas in
three states
z Respondents in the age group of 15-24 years
(young people)
z Respondents with access to phone connection,
either their own or belonging to someone in the
family
The selection of districts, blocks and respondents in
three states was purposive in nature, based on the
presence of NGO partners and availability of contact
details of young people with them. The objective was
to ensure seeking varied perspectives and insights
from the respondents on research questions. The
due consent of the respondents and parents, in
case of minor respondents, was sought before
the interview. For adult youth, the consent of the
respondents was sought.
The NGO partner organizations in Bihar (Darbhanga
and Nawada), UP (Sitapur) and Rajasthan (Bundi,
Karauli, Dungarpur and Tonk) had the contact
details of 1,504 young people in the age group
of 15-24 years. These were used to reach out to
the respondents in order to cover the required
sample size (812). 20 respondents (1 in Bihar, 15 in
Rajasthan and 4 in UP), who gave their consent for
the survey, turned out to be below the age of 15
years and were dropped from the survey. Finally,
we could reach out to 801 respondents. The details
of Listing, planned and covered sample sizes in the
survey are presented in the table below.
Table 1: Listing, sample size planned and sample size covered
Bihar
Rajasthan
Uttar Pradesh
Total
Listing
Boys
Planned
sample
266
157
184
125
450
282
Girls
Actual Listing Planned
sample
sample
covered
311
172
147
541
225
124
202
133
271
1054
530
Actual
sample
covered
184
215
131
530
Listing
311
807
386
1504
Total
Planned
sample
172
382
258
812
Actual
sample
covered
184
362
255
801
6

1.10 Page 10

▲back to top


The survey questionnaire was developed and
digitized for use on Collect, a mobile data
collection platform. The data collection teams
from three states received detailed orientation
on the questionnaire and mobile data collection
application. The questionnaire was field-tested and
refined before the actual survey.
1.4 CHALLENGES AND LIMITATIONS
z Given the purposive nature of study, the
perspectives and insights on knowledge,
awareness, impact & challenges of COVID-19
among young people were sought. The findings
are not generalizable and cannot be applied in
other settings.
z In Bihar, young boys could not be included in
the survey. The list provided by NGO partners,
who had project interventions with them, only
included girls.
z Due to the nature of the survey (phone), the
questions were short and mostly closed-ended
for easy comprehension and completion, thus,
some qualitative information on ‘how’ and ‘why’
could not collected.
z Majority of respondents did not own mobile
phones, hence the timing of the survey
depended on their accessibility to the mobile
(mainly early morning or evening). At times,
parents had to be persuaded to allow their
ward/child to take part in the survey.
z A few respondents did hang up the phone when
they did not feel comfortable with few questions
(such as `Have you or anyone in your family
exhibited symptoms of CORONA’), so interviewer
had to call back and explain, which took longer
time to complete the survey.
z Behavior and body language could not be
observed in telephonic interviews. Hence, it was
difficult to understand if the respondents were
comfortable with all the questions.
z The observed response rate was 64%. The major
reason for low response rate was difficulty to
contact respondents (not responded, mobile
switch off, mobile was not reachable and wrong
mobile number).
7

2 Pages 11-20

▲back to top


2.1 Page 11

▲back to top


2 Socio-Demographic Characteristics of Respondents
2.1 RESPONSE RATE
In order to cover the planned sample size of 812
(282 boys and 530 girls) in three states, we used
the available listing of 1,504 young people (450
boys and 1,054 girls) shared by the NGO partners.
In the process we tried to reach out to 1,260
potential respondents. Out of 1,260 people, 898
either provided their consent or declined and 342
of them could not be reached (did not respond,
mobile switched off, mobile not reachable, wrong
contact number, call not received). Additional 20
respondents whom we contacted turned out to be
below the age of 15 years and had to be removed
from the survey.
Finally, we could interview 801 young people (271
boys and 530 girls) in the age group of 15-24 years
against the planned sample size of 812.
As shown in Table 2, the total response rate was
64%. The response rate was the highest in Uttar
Pradesh with 83% and the lowest in Rajasthan with
54%. Bihar recorded a response rate of 65%
2.2 AGE OF RESPONDENTS
Of the total respondents, 71% were below the age
of 18 years. The percentage of respondents below
the age of 18 years was 50%, 83% and 67% in Bihar,
Rajasthan and Uttar Pradesh respectively.
The overall percentage of respondents in the
age group of 18 years and above was 29%. 50%
respondents were in Bihar, 17% in Rajasthan and 33%
in Uttar Pradesh. Please see table 3 in Annexure.
2.3 SEX COMPOSITION OF RESPONDENTS
Of the respondents in the survey, 66% were female
and 34% male. In Bihar, 100% respondents were
female as the NGO partner had project interventions
with girls alone. It was almost equally divided in
female (51%) and male (49%) respondents in Uttar
Pradesh. Rajasthan had 59% female and 41% male
respondents (Table 4 in Annexure).
Overall, 70% female and 72% male respondents
were in the age group of 18 and less. In the
survey, 30% female and 28% male respondents
were adults (18 years and above). The female
respondents were equally divided in the age
groups - <18 years and >= 18 years in Bihar.
Rajasthan had 86% male and 81% respondents in
the age group of less than 18 years. Uttar Pradesh
had 79% female and 55% male respondents in the
age group of less than 18 years.
Table 2: potential respondents reached and interviewed
States
Bihar
Total Adolescents
consent taken
(yes/no)
189
Total adolescent Adolescents age
(Unable to
below 15 years
access)*
interviewed
92
1
Adolescents and youths
(15-24 yrs) interviewed
post consent
184
Response
rate in %
65
Rajasthan
449
206
15
362
54
Uttar Pradesh
260
44
4
255
83
Total
898
342
20
801
64
8

2.2 Page 12

▲back to top


Table 5: Sex and Age Composition
Sex v Age groups (%)
Variable
<18 years
>=18 years
Overall
Female Male
70
72
30
28
Bihar
Female Male
50
NA
50
NA
Rajasthan
Female Male
81
86
19
14
Uttar Pradesh
Female
Male
79
55
21
45
2.4 SOCIAL CATEGORIES
The details of respondents in social categories
are given in table 6 in Annexure. The highest
percentage of respondents in the survey was
from other backward class-OBC (40%). The next
highest participation was of respondents from
Scheduled Caste (33%). 15% and 9% respondents
were from General and Scheduled Tribe categories
respectively. In Bihar and Rajasthan there was
higher representation of OBC in the respondents.
More than half of the respondents in UP were from
Scheduled Caste category.
2.5 EDUCATION STATUS AND LEVEL
In the survey, 91% respondents in three states
were students attending school/college and 9%
respondents were out of school/college. Rajasthan
had the highest percentage of school/college going
respondents (96%), while Bihar the lowest (86%).
Of the respondents in the three states, 43% had
education up to secondary level,31% respondents
up to senior secondary level, 6% were graduates
and 2% respondents were illiterate. Majority of
respondents in three states had education up to
secondary level and above. One respondent each in
UP and Rajasthan had Master’s degree (Table 7 in
Annexure).
Further, 91% female and 90% male respondents
were attending school/college. Only 9% female and
10% male respondents were out of school/college.
Rajasthan had the highest number of male and
female (96% each) respondents who were going to
school/college. Uttar Pradesh had 91% female and
83% male respondents who were going to school/
college. 86% female respondents in Bihar were
attending the school/colleges. Finally, 13% female
respondents were out of school/college.
Amongst the female respondents, 15% had
education up to upper primary level, 44% had
education up to secondary level, and 33% up to
senior secondary level. Only 6% female respondents
had bachelor degree.
Amongst the male respondents 22% had education
up to upper primary level, 41% had education up to
secondary level, and 29% had education up to senior
secondary level. Only 5% female respondents had
bachelor degree.
2.6 MARITAL STATUS
Of the total 801 respondents, 94% in three states
were unmarried. Rest 6% were married. The
percentage of married respondents in each state
was over 93% or above. Please see the details of
marital status in states in Table 8 in the Annexure.
Overall, 97% respondents in the age group of less
than 18 years were unmarried. Only 3% respondents
in the age group of less than 18 years were married.
88% respondents in the age group of 18 years and
above were unmarried. 12% respondents in age
group of 18 years and above were married. In all
states, over 85% respondents in two age groups
(less than 18 years and 18 years and above) were
unmarried (Table 9).
Further 94% female and similar percent of male
respondents were unmarried. 5% female and 6%
9

2.3 Page 13

▲back to top


Impact of COVID-19 on young people: Rapid assessment in three states, May 2020
Table 9: Marital status and age groups
Marital Status v
Age groups (%)
Variable
Bachelor
Married
Separated/Divorced
Widow/Widower
Overall
<18
years
97
3
0
0
>=18
years
88
12
0
0
Bihar
<18
years
99
1
0
0
>=18
years
87
12
1
0
Rajasthan
<18
years
94
6
0
0
>=18
years
87
13
0
0
Uttar Pradesh
<18
years
99
1
0
0
>=18
years
90
10
0
0
male respondents were married. In Bihar, 93%
female respondents were unmarried. Additionally,
6% female respondents were married. In Rajasthan,
92% female and 95% male respondents were
unmarried. 8% female and 5% male respondents
in the state were married. In Uttar Pradesh, 100%
female and 92% male respondents were unmarried.
8% male respondents were married in the stated
(Table 10 in Annexure).
2.7 OCCUPATION
The analysis of data shows that 90% respondents in
three states of Bihar, Rajasthan and Uttar Pradesh were
currently studying. Rajasthan has 96% respondents
who are studying at the time of survey. Only 1% of
respondents were employed. 3% respondents are
home makers. 2% respondents were unemployed and
looking for jobs (Table 11 in Annexure)
10

2.4 Page 14

▲back to top


Facing the Pandemic:
3 Knowledge, Attitudes and Practices of
COVID-19 among Young People in three States
This chapter presents assessment findings on young
people’s levels of knowledge about the ongoing
COVID-19 pandemic. To assess this, four parameters
were used: i. awareness of COVID-19 symptoms;
ii. awareness of and abiding by basic prevention
practices; iii. source of information on COVID-19; and
iv. measures to take if COVID-19 symptoms exhibit.
Six survey questions, with sub-questions were
framed on these topics and responses analysed to
gauge young people’ knowledge on COVID-19, their
understanding of prevention and safety measures,
and their sources of information.
3.1 AWARENESS ON COVID-19 SYMPTOMS
To assess young people’s awareness on COVID-19,
participants were asked to list some symptoms they
knew of. No cues or prompts were given.
Graph 1: Awareness level for 2 primary symptoms
Awareness level for Covid-19 symptoms (%)
Other symptom 1
Diarhoea 3
Weakness
12
Running nose
15
Body pain
16
Headache
24
Common cold
38
Sore throat
40
Sneezing
42
Breathing difficulties
50
Cough
84
Fever
88
At least 2 key symptoms
89
0 10 20 30 40 5060 70 8090 100
From a total of 801 respondents, 710 (nearly
89%) were able to identify at least two symptoms
among fever, cough, body pain, and difficulty in
breathing. This trend of high levels of awareness on
COVID-19 symptoms was mirrored across the three
states. However, there were variations across certain
parameters.
Graph 2: Awareness level for Covid 19 symptoms
in states
Awareness level for 2 key symtoms in states
(fever/cough/breathing difficulty/body pain)
100
92
90
90
85
80
70
60
50
40
30
20
10
0
Bihar
Rajasthan
Uttar Pradesh
Knowledge about the key symptoms of COVID-19
varied along social parameters:
a. Sex: Overall, males (92%) were better informed
on COVID-19 symptoms in comparison to
females (87%); this trend was visible across
states as well, and was most stark in Uttar
Pradesh where 96% males identified the key
symptoms of COVID-19 in comparison to 74%
females.
b. Age: Although age was not a major factor
in shaping awareness about COVID-19,
respondents aged 18 years and above (92%)
were marginally better informed than their
11

2.5 Page 15

▲back to top


Impact of COVID-19 on young people: Rapid assessment in three states, May 2020
younger counterparts (87%). The states mirrored
these trends as well with more than 80% people
across age group identifying at least two key
symptoms of COVID-19.
c. Social Indices: Although awareness of COVID-19
symptoms was high across social indices (85-
96% respondents identified at least two of the
key symptoms), it was lowest among socially
marginalised groups, like SCs (85%) and STs
(86%).
d. Education: There was a correlation between
the level of education and awareness about the
symptoms of COVID-19. Overall, 92% of those
who had studied above Class 10 identified at
least two key symptoms, 88% of those who had
studied till Class 10 identified the key symptoms,
and 84% of those who had studied up to Class 8
identified these symptoms. This difference was
further accentuated in Uttar Pradesh, where
only 78% of those who had studied up to Class
8 could identify at least two key symptoms, in
comparison to 83% of those who had studied
till Class 10, and 91% of those who had studied
above Class 10.
These were: washing hands frequently, covering
their face, and observing the lockdown that was
in effect during the survey. Those who responded
in the negative were asked to explain why.
These responses would provide insights into the
constraints that people face in following basic
prevention measures.
Overall, nearly all the participants reported following
these prevention measures. 100% said they washed
their hands frequently, and 96% each said they
wore a mask or covered their face, and observed
the lockdown diligently. The lowest figures, which
were still in the high range of 89% and above, were
reported from Uttar Pradesh: here, 89% respondents
said that they covered their faces or wore a mask,
and 92% said they observed the lockdown.
The major reason for not covering face or wearing a
mask was that people did not go outside the house.
Among the 31 respondents who did not observe the
lockdown, 27 said that they had to go out to work or to
buy ration, and the remaining 4 said that their mother
worked as an ASHA and, as a FLW, she had to be active
in the field. (Table 14 in annexure)
Refer Table 12 in Annexure for more details
3.2 AWARENESS OF AND ABIDING BY BASIC
PREVENTION PRACTICES
Respondents’ knowledge of COVID-19 was also
gauged by seeking their response on some basic
safety and prevention practices. A list of such
practices was read out to the participants and they
were asked to respond to them with a Yes or No on
whether they followed these practices.
Table 13: Preventive practices for COVID 19
Preventive
measures
Followed (%)
Frequent
handwashing
Wearing Mask
Follow lockdown
(staying at
home and social
distancing)
Overall
100
96
96
Bihar Rajasthan Uttar
Pradesh
100
99
100
100
98
89
98
98
92
3.3 SOURCES OF INFORMATION
Respondents were asked about the sources from
where they received information on COVID-19.
This was meant to help assess which informational
channels are most used by young people in
India, especially for critical public health-related
information.
Traditional and face-to-face channels of information
emerged as most important for young people.
Overall, TV (61%), frontline workers (FLWs),
comprising ANMs, ASHA, AWWs and counsellors
(49%), and government press briefings (41%) were
the top-three sources of information. In Bihar
(58%) and Uttar Pradesh (54%), FLWs were the
primary source of information for respondents.
Twitter (1%), Radio (4%), Arogya Setu (6%) and
Facebook (7%) were the least used sources of
information. Of these, Twitter, Arogya Setu app
12

2.6 Page 16

▲back to top


Graph 3: Information Source for COVID 19 related information
Information source for COVID 19 related information(%)
100
90
80
70
61
60
49
50
42
40
30
29
30
21
19
20
10
11
7
6
5
4
1
1
0
TV
FLWS Press Whatsapp Family Friends Website School Facebook Arogya Any other Radio
No Twitter
briefings
members
Information
Setu source
body/No
where
and Facebook are all digital technology-dependent
portals of information. However, it is worth noting
that WhatsApp was a source of information for
30% respondents; this attests to the platform’s
wide use and prevalence in India and the steady
formalization of WhatsApp messages and forwards
as a genre of information.
School as a medium of information was poorly
used; overall, only 11% of respondents of total
respondents said they received information from
schools. In Rajasthan though, 23% respondents
listed school as a source of information on
Coronavirus; the figures for Bihar and Uttar Pradesh
were 1 and 0 respectively. This could be attributed
to the fact that schools were first to close when the
COVID-19 pandemic started to spread across India.
However, the limitations of school to be able to
reach its students when not in session are worth
addressing and rectifying. WhatsApp communities
could be one way forward.
Refer Table 15 in Annexure for more details.
3.4 MEASURES TO TAKE IF EXHIBITING
COVID-19 SYMPTOMS
Finally, to assess the implementation of the
knowledge and information that young people had
about COVID-19, we asked them to outline if they
knew of someone who has/or had COVID-19, and
the measures they would follow if they developed
any symptoms associated with Coronavirus. A list of
options was read out, such as, go to a doctor, self-
isolate, inform those you have been in contact with
(to facilitate contact tracing), and respondents were
asked to answer to each with a Yes or No.
Overall, 91% respondents said that they had not
experienced any COVID-19 symptoms and did
not know anyone who had experienced such
symptoms. 4% chose not to answer this question.
The high response rate of those saying they had not
experienced COVID-19 symptoms or did not know
of anyone who did so need to be analysed with
caution: there is stigma attached to COVID-19, and
people may be scared to openly talk about it even if
they have exhibited mild symptoms.
5% answered in the affirmative: they had either
experienced these symptoms or knew of someone
who did. This 5% was entirely from Rajasthan where
40 respondents said they had either experienced
Coronavirus symptoms or knew someone who did.
All the respondents who reported having symptoms
or knowing someone who did, said they either went
to the doctor or hospital to seek medical help. (Refer
Table 16 in annexure)
When presented with a hypothetical scenario of
what the young people would do if they or someone
13

2.7 Page 17

▲back to top


Impact of COVID-19 on young people: Rapid assessment in three states, May 2020
they knew exhibited symptoms of Coronavirus, 86%
said they would contact a doctor or hospital, 91%
said they would self-isolate, and 92% said they
would facilitate contact tracing by informing those
with whom they previously had close contact
about their symptoms. However, in this high
affirmative response rate, there were some state-
wise discrepancies: in Bihar, for instance, only 53%
said that they would call the doctor or a hospital.
(Refer Table 17 in annexure)
17% of respondents said they would “do
something else”. Among those who said they would
“do something else”, most said they would:
z Practice social distancing from outsiders (44%)
z Advise for getting tested (15%).
z Create awareness for COVID 19 (10%)
Among the three listed practices–Seek medical care
(Doctor/Hospital/FLWs), self-isolate, and facilitate
contact tracing–social parameters presented some
variations:
Call the Doctor/hospital
Sex: 95% male and 82% female said they would
call the doctor in case of Coronavirus symptoms; in
Bihar, only 53% females said that they would call
the doctor.
Age: Overall, 81% of those who were 18 years and
older, and 88% of those under 18 years of age,
said they would call the doctor or visit a hospital.
In Rajasthan and Uttar Pradesh, 98% and 94% of
respondents said they would call the doctor; the gap
between age groups was minimal here. However,
Bihar presented numbers that were considerably
lower than the average and the other two states.
Here, 59% of those who were 18 years and above said
they would call the doctor and 48% of those below 18
years of age said they would call the doctor.
Social Indices: With reference to social indices of
caste, tribe and religion, only 52% of those classified
as Others (BC1, EBC and Muslims) said they would
call the doctor. In Bihar, only 39% of those classified
as Others said that they would call a doctor or
hospital. This was much lower than other groups of
General, SC, ST, OBCs, among whom 83-92% said
they would call the doctor.
Education: Curiously, 92% of those who had studied
up to Class 8 said they would call the doctor, in
comparison to 85% each of those who had studied
up to Class 10 or higher. But a closer examination
of the data reveals that this incongruence was
solely due to Bihar. In this state, 75% of those with
education of Class 8 or lower said they would call
a doctor while only 49% and 51% of those who
had studied up to Class 10 or higher, respectively,
said they would call the doctor. In other states,
education level did not make much of a difference
and affirmative responses were consistently high
(92% and above) across levels of education.
Refer Table 18 in annexure for details.
Self-Isolate
Overall, participants across age, sex, education and
social indices, had a high affirmative response for
practicing self-isolation if they or someone they
knew exhibited symptoms of Coronavirus (most in
92-94% range with Others at 83%). However, there
were some regional variations. Bihar recorded
the lowest affirmative responses to self-isolation
across categories in comparison with the other two
states. In Rajasthan, affirmative responses were
consistently high, in the range of 90-94%. In Uttar
Pradesh, 75% STs said they would self-isolate;
this was the lowest affirmative response for self-
isolating in the state.
Refer Table 19 in annexure for details.
Inform Others Who Have Been in Contact/Facilitate
Contact Tracing
The responses here were high affirmative overall
and across states, ranging from 86-96%. In Bihar,
Others (83%) STs (88%), and those with education
more than Class 10 (88%) represented the lowest
affirmative numbers. Rajasthan was consistently
above the overall average. And in Uttar Pradesh, STs
(71%), SCs (81%), those with education up to Class
8 (74%), and Males (81%) represented the lowest
affirmative numbers.
14

2.8 Page 18

▲back to top


Refer Table 20 in annexure for details.
3.5  KEY FINDINGS
Respondents displayed a high level of awareness on the symptoms of COVID-19, and were able to
identify at least two key symptoms.
Males, those who were older, and those with higher levels of education were better informed than
females, younger cohort and those with lower levels of education.
The awareness of symptoms was relatively lower among socially marginalized groups.
Respondents were also very well-informed on basic safety and prevention practices, and reported
following them diligently. 100% said they washed their hands frequently, and 96% said they covered
their face and observed the lockdown diligently.
The primary sources of information were traditional media, like TV and policy briefings, as well as
face-to-face interactions with FLWs. Digital technology-dependent portals of information, like Twitter,
Arogya Setu app, and Facebook were used the least. WhatsApp however, was a popular source of
information.
Schools were rarely listed as a source of information, indicating the inability of educational
institutions to stay connected with students outside of the school premises and academic session.
Only in Rajasthan was school a reliable medium of information, reported by 23% respondents.
Although most respondents had not experienced or did not know of anyone who experienced
COVID-19 related symptoms, a majority of them noted that they would contact a doctor, self-isolate,
and facilitate contact tracing, if they or someone they knew exhibited symptoms.
However, there were regional variations and variations along different parameters of age, sex,
education and social indices.
More males than females said that they would seek medical help in case of symptoms.
Bihar was an anomaly in many ways: here, only about half the respondents said that they would
contact a doctor or hospital; only one-third of those classified as Others would seek a doctor; and
those who were older and more educated were less likely to seek a doctor or hospital than their
younger counterparts and those with lower levels of education.
Most participants across states and parameters had a high affirmative response to practicing self-
isolation.
Bihar recorded the lowest affirmative responses to self-isolation across categories in comparison with
the other two states. In Rajasthan, affirmative responses were consistently high and in Uttar Pradesh,
75% STs said they would self-isolate; this was the lowest affirmative response for self-isolating in the
state.
Most participants agreed that they would facilitate contact tracing and inform those with whom they
have had recent contact about their symptoms. In Uttar Pradesh, STs (71%), SCs (81%), those with
education up to Class 8 (74%), and Males (81%) represented the lowest affirmative numbers.
15

2.9 Page 19

▲back to top


Facing the Pandemic:
4 Challenges and Impacts of COVID-19
among Young People in India
This chapter examines the impacts of the COVID-19
outbreak and lockdown on the everyday lives of
young people and their mental well-being, as well
as the coping mechanisms that they were aware
of and used. To assess this, we developed the
following parameters: i. changes in their everyday
routines, interactions, and moods; ii. impact on
their awareness of and access to primary healthcare
services; and iii. access to and use of mental health
services. Responses along these parameters were
then analyzed to assess the challenges faced by
young people during COVID-19 outbreak and the
ensuing lockdown, as well as the coping mechanisms
that were available to them.
4.1 CHANGES IN ROUTINES, INTERACTIONS
AND MOODS
A list of activities was read out to the participants
and they were asked to respond with a Yes or
No to indicate if these had increased during the
Coronavirus lockdown. (Refer Table 21 in annexure)
Graph 4: Impact of Lockdown
Impact on adolescent and youth during lockdown (%)
Family pressure
for discontinue of study 2
for job search
Family pressure
for discontinue of study
3
for marriage
Irritability and frustation
due to lack of privacy
7
Increase in worries about
finding descent job
11
Feeling of
depression
22
Increase in the
conflicts at home
23
Increase in workload
related to domestic chores
42
0 10 20 30 40 50 60 70 80 90 100
Domestic Chores
Overall 42% respondents reported that their
workload of domestic chores had increased during
the lockdown.
Overall, 51% females said they experienced an
increase in their workload compared to 23%
males. There were regional variations: in Bihar,
only 26% women said that their workload had
increased while in Uttar Pradesh, a whopping 96%
female respondent reported an increase in their
workload. (Table 22 in annexure)
Less than half the respondents reported an increase
in their workload in the two age cohorts of those
below 18 years (41%) and those who were 18 years
and older (43%). This was the highest in Uttar
Pradesh where 67% of those who were below 18
years reported an increase in workload and 55%
of those who were 18 years and older reported an
increase in workload.
People across social groups reported an increase
in workload. This was highest among SCs (50%),
followed by STs and OBCs at 40% each, and General
at 35%. Only 17% of Others reported an increase but
this could be attributed to a significantly low number
of their representation (23) in the survey sample.
However, in Bihar, only 7% of those identified as
General, experienced an increase in workload in
comparison to the average of 35% that was nearly
equivalent to the other two states (33% each).
Overall, the least increase in their workload was
reported by Others at 17% and Males at 23%
reported.
16

2.10 Page 20

▲back to top


Refer Table 22 in annexure.
Conflicts at Home
Out of a total of 801 respondents, nearly one out of
four respondents reported an increase in fights at
home (total 187, 23%. See table 22). Overall, more
women (26%) than men (19%) said that fights at
home had increased during the lockdown, expect
in Uttar Pradesh, where an equal number of males
and females (12 male and 13 female out of 255
respondents) reported an increase in fights at home.
Both these figures however, were equally low (10%
each) compared to the three-state average mentioned
above. In Rajasthan, 38% women reported an
increase in fights at home, presenting the highest
figures across different social groups (of sex, age,
education, social indices) in the three states.
In the overall sample, an increase in domestic fights
was least reported by respondents in the General
category (13%), followed by Others (17%), SCs (19%),
and those with education till Class 8 (16%). In Bihar
however, 36% SCs reported increase in fights at home,
significantly higher than the overall average of 19%
among SCs. In Rajasthan, 33% of those in the General
category reported an increase in fights at home–the
highest in this category among all states and much
higher than the overall average of 13%. However, this
was also a small sample, of only 23 people.
Among the three states, Uttar Pradesh had the
lowest number of respondents who reported an
increase in fights at home (25 out of 255 in Uttar
Pradesh and out of a total of 801 in the three states.
Refer Table 23 in annexure
Economic Anxieties
Out of the total of 801 respondents, 460 identified
themselves as those who were employed,
unemployed but actively looking for a job, or about
to enter the job market soon.
pandemic and lockdown, out of 460, 51 answered
in the affirmative. Among these, 43% were those
who were already employed and 31% were those
who were unemployed and actively looking for
employment.
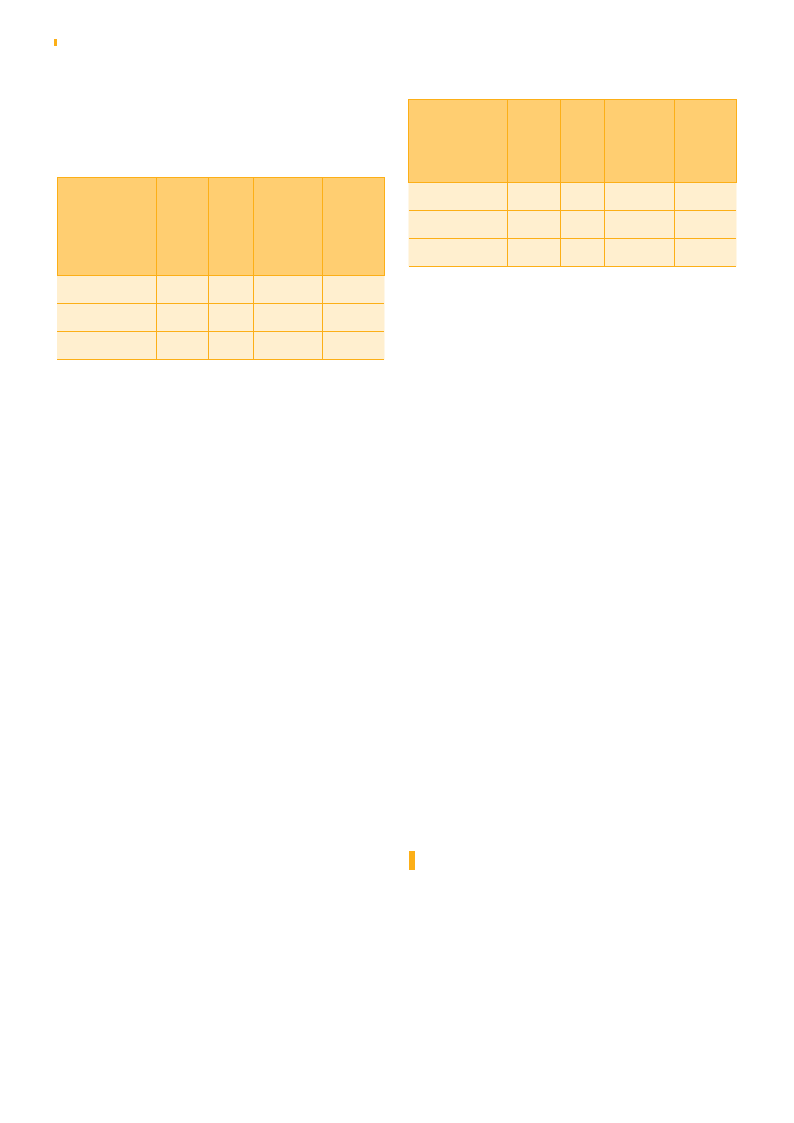
Table 24: Adolescents and youths who have
Increase in worries for finding decent job by
occupation category
Occupation
category
Overall
# of
respondents
with increase
in worries
Already
9
employed
Un-
8
employed
Homemaker
2
Currently
32
studying
Total
51
# of
respondents
applicable
for the
question
21
26
16
397
460
% of
respondents
among
category
43
31
13
8
11
A very low number (10 out of 677 school going
respondents) reported facing an increased pressure
from family to discontinue their education and find
a job instead. Similarly, only 19 out of 599 female
respondents said that they were facing familial
pressures to discontinue their education and get
married (Table 21 in annexure).
“Ek achi naukari nahi milegi to samsya ho
saktihai.” If I don’t get a decent job, it’ll be a
problem.
“Ghar per hai, kharcha nahi chal pa raha hai.”
I am home [not working] and not able to
meet the daily expenses.
“Lockdown me Naukri chali gayi toh baad me
pata nhi kya hoga.” If I lose my job during the
lockdown, I don’t know what will happen later.
Feelings of Depression and Frustration
When they were asked if their worries about getting
a decent job had increased during the ongoing
A small cohort – 179 out of 801 respondents – said
that they were experiencing feelings of depression,
17

3 Pages 21-30

▲back to top


3.1 Page 21

▲back to top


Impact of COVID-19 on young people: Rapid assessment in three states, May 2020
while an even smaller cohort – 53 out of 801
respondents–said they were feeling irritable or
frustrated due to lack of privacy at home during
the lockdown. Some variations across social
indicators and states are presented below:
a. Sex: Among these, an equivalent number of
males and females across the three states
(overall, 22% females and 24% males) reported
feelings of depression. The highest was
29% males in Uttar Pradesh who responded
feeling depressed during the Coronavirus and
lockdown.
b. Age: Nearly twice as many young people who
were below 18 years of age (117 out of 565)
reported feeling depressed in comparison to
their counterparts who were 18 years or older
(62 out of 236).
c. Social Indices: Nearly 2 to 3 people out of 10
(20-27%) reported feeling depressed across
different social groups. Others was an outlier
category where 43%, or 4 out of 10 people,
reported feeling depressed; this number was
highest in Uttar Pradesh where 67% Others
reported feeling depressed. However, this was a
small sample of only 23 persons. Again, in Uttar
Pradesh, 75% STs (comprising 3 respondents)
reported feeling depressed.
d. Education: Overall, feelings of depression did
not vary with level of education; nearly every
2 out of 10 people said they were feeling
depressed. Uttar Pradesh, however, presented
a major state-variation: here, among 66
respondents who reported feeling depressed,
64% had studied up to Class 8, 57% had studied
up to Class 10, and 48% had studied beyond
Class 10.
Refer Table 25 in annexure.
When probed further, many feelings of anxiety or
depression could be traced to economic uncertainty,
the inability to move outside and socialise, and fears
of Coronavirus itself. A few of these are captured in
the quotes below:
“Aamdani band hone ke karan ghar mein
samsaya ho rahi hai jise dekh kar hum udaas
rahte hai.” My earnings have stopped
because of which, we are facing problems at
home. Seeing that, I feel sad.
“Kyonki bahar ghumne nahi ja pate hai
aur doston se bhi nahi mil pate hai.” I am
depressed because I cannot go outside and
meet friends.
“Ghar per baitey hai, kaam kuch hai nahin,
pehle padhai ke saath majdoori bhi kar lete
the aur ek din mein Rs. 250 mil jaata tha.” I am
sitting at home and there is no work. Earlier,
along with studying, I used to do some work
and earn INR 250 daily.
“Kahin ghar mein kisi ko ya khud ko Corona na
ho jaye.” What if I or someone at home gets
Corona.
TV and Social Media
Of the 801 respondents, 566 respondents reported
watching TV and 589 reported using one or more
social media platforms. The highest among these
were from Rajasthan (312 and 320 respectively).
Table 26: TV and social media
TV watchers
and Social
media
Users (#)
Overall
TV Watcher
566
Bihar
138
Rajasthan Uttar
Pradesh
312
116
Social Media
User
589
120
320
149
TV
64% respondents who watched TV reported an
increase in the time they spent on watching TV, 13%
said they watched less TV than before, and 23%
reported the same time spent watching TV before
and during the lockdown.
18

3.2 Page 22

▲back to top


Graph 5: TV watching among adolescents and youth
Status of TV watching among Adolescents and Youth (%)
100
90
23
23
80
70
60
50
40
64
58
30
20
10
13
19
0
Overall
Bihar
Less
More
12
26
59
86
15
Rajasthan
Same as before
2
Uttar Pradesh
There were however, some state-based variations:
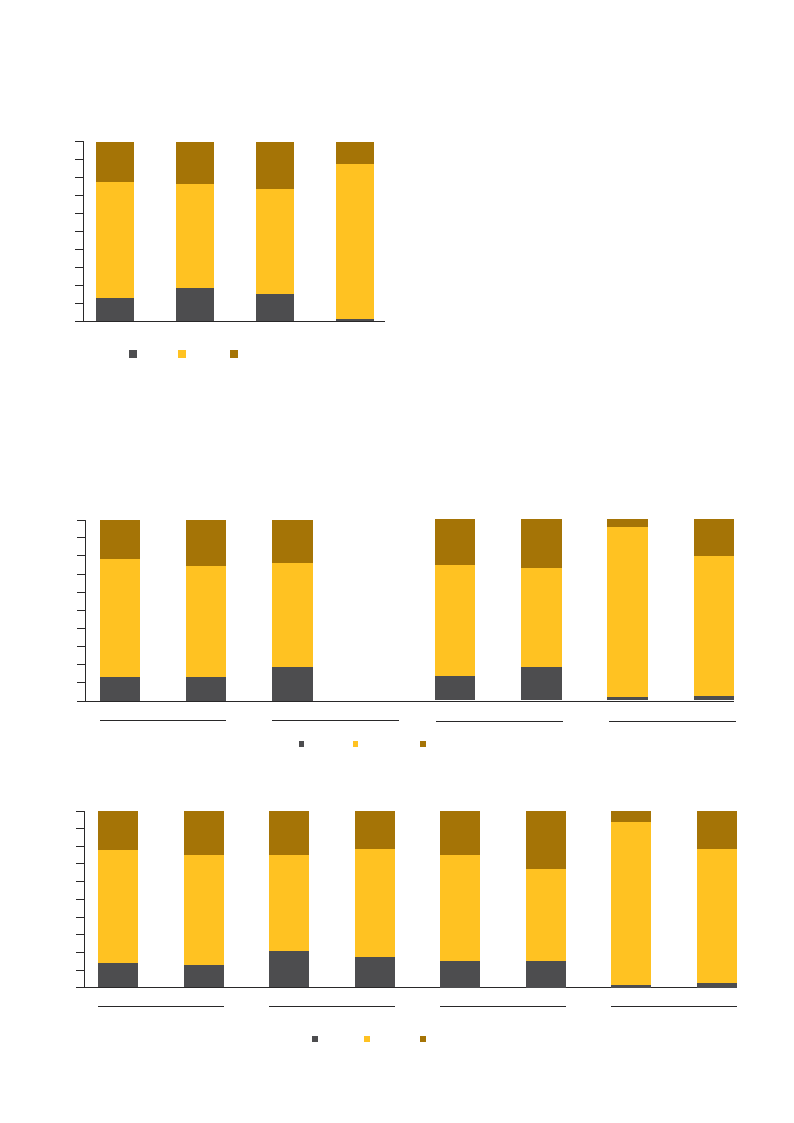
86% respondents in Uttar Pradesh said they watched
more TV, in comparison to 58% in Bihar and 59% in
Rajasthan. Variations along social indicators are as
follows:
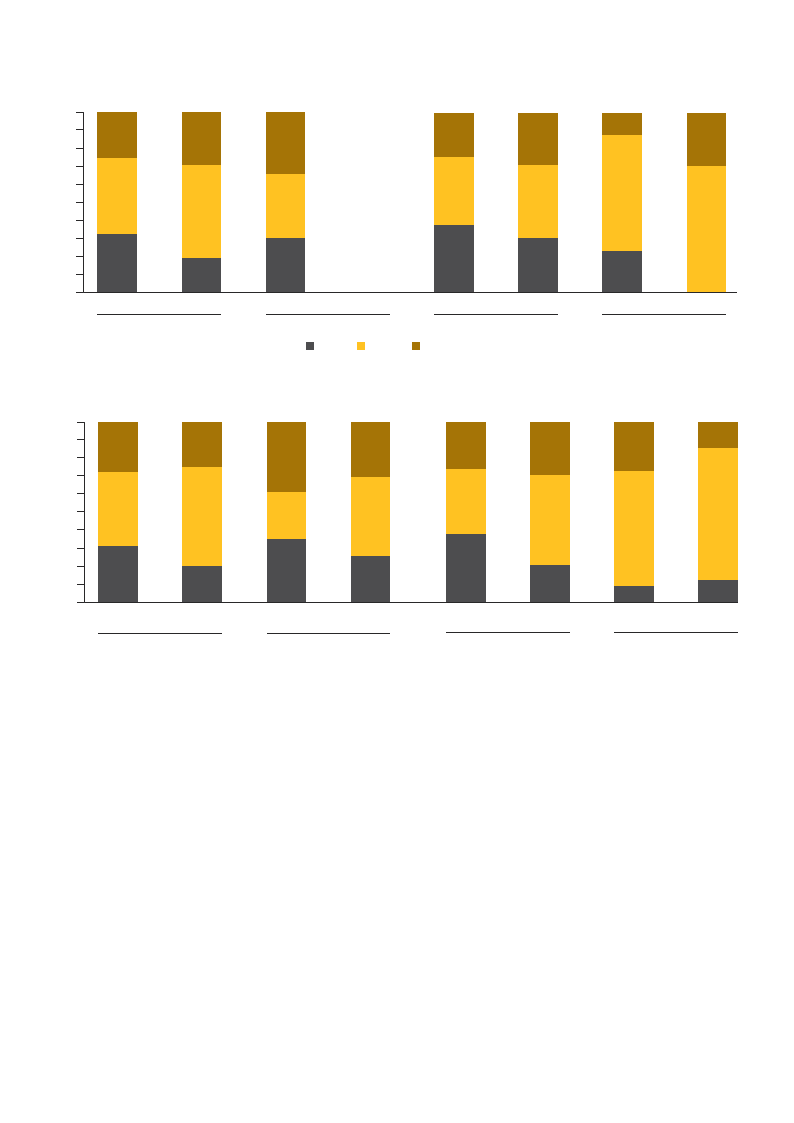
a. Sex: Overall, there were no major variations in
the percentage of males and females and their TV
consumption patterns. 13% of males and females
each reported watching less TV, 65% females and
61% males reported watching more TV, and 21%
females and 21% males reported watching TV for
the same amount of time as before. However,
there were state-based variations. In Uttar
Pradesh, 94% females reported watching more
TV in comparison to 77% males.
b. Age: Overall, 63-65% young people reported
watching more TV, with the younger cohort
marginally ahead. In Rajasthan, 52% of those
who were 18 years or older reported watching
more TV, while in Uttar Pradesh, 93% of those
Graph 6 : TV watching by Sex
100
90
21
25
80
70
60
50
40
65
61
30
20
10
13
13
0
Female
Male
Overall
23
58
19
Female
Bihar
Less
0
Male
More
Graph 7: TV watching by Age category
100
90
22
25
80
70
60
50
40
65
63
30
20
10
14
0
<18 years
12
>=18 years
Overall
25
21
54
61
21
17
<18 years
>=18 years
Bihar
Less
More
26
27
61
55
13
18
Female
Male
Rajasthan
Same as before
25
33
60
52
15
15
<18 years
>=18 years
Rajasthan
Same as before
5
21
94
77
2
2
Female
Male
Uttar Pradesh
6
21
93
77
1
2
<18 years
>=18 years
Uttar Pradesh
19

3.3 Page 23

▲back to top


Impact of COVID-19 on young people: Rapid assessment in three states, May 2020
who were under 18 years of age reported
watching more TV and 77% of those who were
18 years or above reported watching more TV.
c. Social Indices: No clear pattern in social
categories was visible in TV consumption
patterns; overall 52-75% of those classified
as General, OBC, SC, ST and Others reported
watching more TV. In Uttar Pradesh, this
percentage was higher than the average: 81-
100% of persons across all social categories
reported watching more TV. (refer table 27 in
annexure )
d. Level of education: Again, no discernible
pattern of TV watching emerged along the
parameter of education with 49-52% of
respondents across levels of education reported
spending more time watching TV during the
lockdown. Again, in Uttar Pradesh, this number
was higher than the average and as reported
in the other two states: here, 63-70% reported
watching more TV, with those who had studied
till Class 10 at the highest end of the spectrum.
Social Media
Overall, 46% respondents who were social media
users reported spending more time on social media
during the lockdown. 27% said they used social
media for the same amount of time as before while
28% said they used social media less than before.
Graph 9: Social media Use among Adolescent and
youth
Status of Social Media Use among Adolescents and Youth (%)
100
90
27
27
22
80
34
70
60
50
46
36
39
40
68
30
20
10
28
30
0
Overall
Bihar
Less
More
35
10
Rajasthan
Uttar Pradesh
Same as before
Again, in Uttar Pradesh, 68% social media users
reported spending more time on it in comparison to
36% in Bihar and 39% in Rajasthan. Other variations
were as follows:
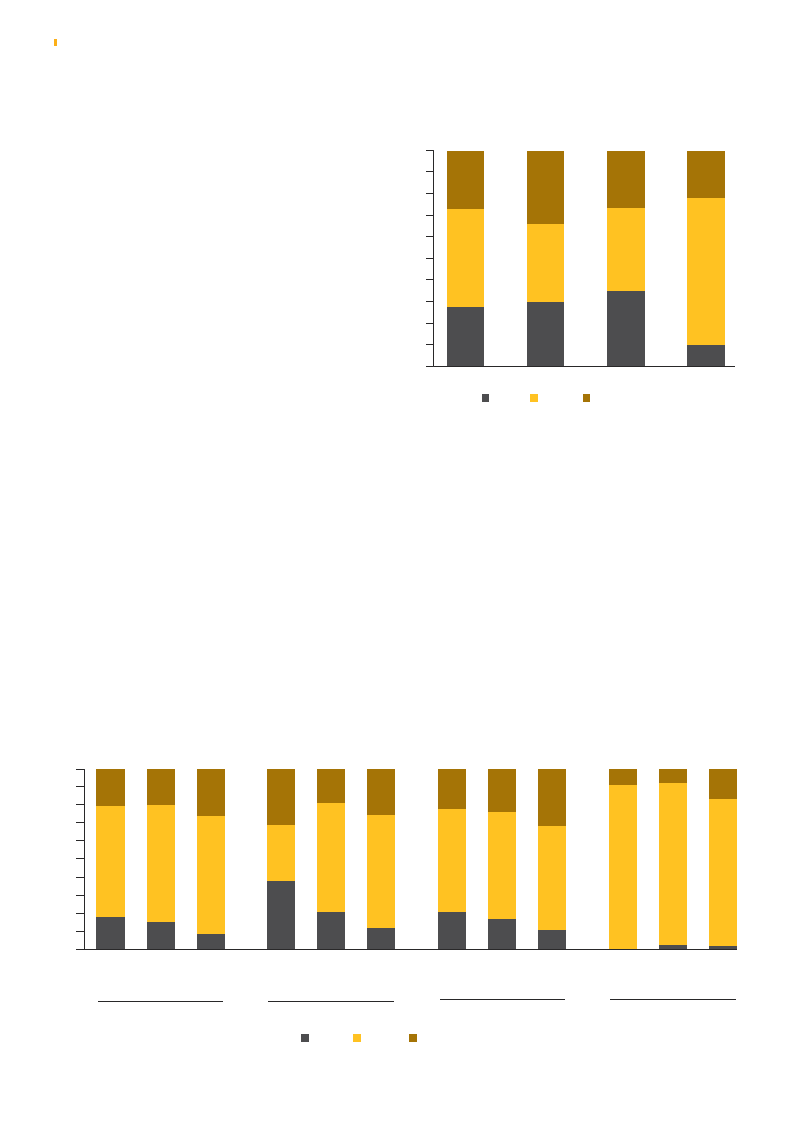
a. Sex: Overall, more males (52%) than females
(42%) reported spending more time on social
media. In Uttar Pradesh, increased use of social
media was higher than the average among
both males (70%) and females (65%), although
in keeping with the trend, more males than
females reported an increase in social media
use.
Graph 8: TV watching by Education level
100
90
20
80
70
60
50
61
40
30
20
10
18
0
Upto
8th
Class
20
65
15
Upto
10th
Class
26
65
9
Above
10th
Class
19
31
31
61
38
Upto
8th
Class
20
Upto
10th
Class
Overall
Bihar
Less
26
62
12
Above
10th
Class
More
22
24
32
57
60
58
20
Upto
8th
Class
17
Upto
10th
Class
10
Above
10th
Class
Rajasthan
Same as before
20
9
8
17
91
90
81
0
Upto
8th
Class
3
Upto
10th
Class
2
Above
10th
Class
Uttar Pradesh

3.4 Page 24

▲back to top


Graph 10: Social media use by Sex
100
90
26
29
80
70
60
50
42
40
52
30
20
33
10
19
0
Female
Male
Overall
34
36
30
Female
Bihar
Less
0
Male
More
25
29
37
41
38
30
Female
Male
Rajasthan
Same as before
Graph 11: Social Media use by Age
100
90
28
80
70
60
50
41
40
30
20
10
31
0
<18 years
25
55
20
>=18 years
Overall
39
30
26
44
35
25
<18 years
>=18 years
Bihar
26
30
36
50
38
20
<18 years
>=18 years
Rajasthan
12
30
65
70
23
0
Female
Male
Uttar Pradesh
14
27
73
65
9
<18 years
13
>=18 years
Uttar Pradesh
More women (33%) than men (19%) reported
a decrease in their social media use. The gap
between men and women was the starkest in Uttar
Pradesh where 23% women reported a decrease in
their social media use compared to zero men.
b. Age: Those who were 18 years and above (55%)
reported an increase in social media use more
than their younger cohort, where 41% reported
an increase in social media use.
c. Social indices: More than half the SCs (56%)
and Others (53%) reported an increase in their
social media use. In other groups, less than half
the people reported increase in social media
use, with those classified as General at 43% and
STs and OBCs at 39% each. (refer Table 28 in
annexure)
There were some state-based variations. Uttar
Pradesh was consistently higher than the average
with 100% of STs and Others reporting increased
social media use. In Bihar however, only 17% of
those classified as General reported an increase in
social media use.
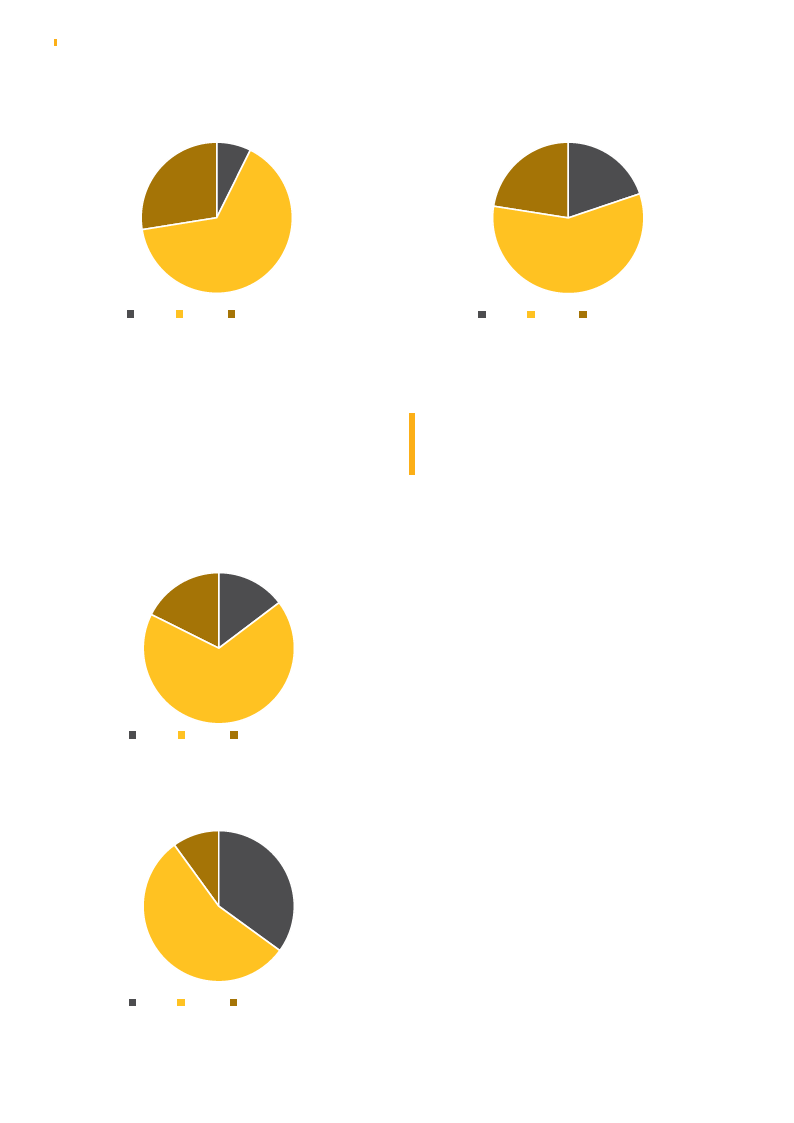
A curious coincidence was between those who
reported feeling depressed and those who
reported spending more time watching TV. To
summarize, 65% of those respondents who
said that they were feeling depressed, reported
watching more TV. (graph 12).
58% of those respondents who said that they were
feeling depressed, reported an increase in their
social media use.
21

3.5 Page 25

▲back to top


Impact of COVID-19 on young people: Rapid assessment in three states, May 2020
Graph 12: TV watching pattern among
respondents feeling depressed
Graph 13 : Social Media use pattern among
respondents feeling depressed
7%
28%
65%
22%
20%
58%
Less
More
Same as before
Less
More
Same as before
Similarly, 68% of those respondents who said that
they were feeling frustrated and irritable with
their lack of privacy during the lockdown, reported
watching more TV. And 55% of those respondents,
who said they were feeling frustrated and irritable
with their lack of privacy during the lockdown,
reported an increase in their social media use.
Graph 14: TV watching pattern
18% 15%
67%
Less
More
Same as before
More in-depth and qualitative research is needed to
understand the reasons behind this coincidence.
4.2 AWARENESS OF AND ACCESS TO
REPRODUCTIVE HEALTHCARE SERVICES AND
COPING MECHANISM
Young people’s access to healthcare and coping
mechanisms for mental health were also assessed.
In the first part, we tried to establish how their
access to reproductive healthcare had been
impacted during the COVID-19 outbreak and
lockdown. This included contact with FLWs, unmet
needs for sanitary pads for women, receipt of IFA
tablets, access to contraceptives, and awareness
of FP counselling. These would help us understand
how the delivery of reproductive healthcare for
young people was impacted during the current and
ongoing public health pandemic.
Graph 15: Social media use pattern
10%
35%
55%
Less
More
Same as before
In the second part, we tried to gauge if young people
had access to mental healthcare services. This line
of inquiry was critical as the pandemic’s impact on
people’s mental health is steadily being recognized.
Here, we assessed if young people had access
to information on mental health and emotional
wellbeing, what the sources of such information
and assistance were, if they had actually used any of
these sources, and if they had found the help they
got useful or not.
22

3.6 Page 26

▲back to top


Reproductive Healthcare Services
Front Line Workers–Contact and Awareness of Reproductive
Healthcare services:
3 out of 5 (65%) young people reported having
some contact with FLWs, with no major variations
across sex or age, except for in Uttar Pradesh where
93% females had contact with FLWs in comparison
with 78% males.
Along social indices, STs (55%), OBCs (56%) and
Others (57%) reported contact with FLWs. This
was significantly lower than for those classified
as General (77%) and SCs (73%). The STs in Bihar
however, bucked this trend with 88% among them
reporting having had contact with FLWs. Similarly,
all the respondents classified as Others in Uttar
Pradesh reported having contact with FLWs.
However, the samples were very small with 7 STs in
Bihar and 3 Others in Uttar Pradesh.
With respect to education level, those who had
studied till Class 8 (70%) reported more contact with
FLWs than those who had studied more. (Refer Table
29 in annexure).
More than half the respondents (58%) were aware
that FLWs were providing FP counselling services
during the lockdown. This trend was mirrored
across social indicators of sex, age and social indices,
although those with education up to Class 10 and
above were better informed than those with lower
levels of education. In Rajasthan, a little less than
half the number of respondents were aware that
FLWs were providing FP counselling services during
the pandemic. In Bihar, those who had studied till
Class 8 were better informed (90%). (Refer Table 29
in annexure)
A majority of respondents, however (416 out of
596), were not aware that FLWs were providing
contraceptives.
Among those who were aware, the majority were
categorized as Other (64%), General (49%) and those
who were 18 years and older (41%). Rajasthan
represented the poorest statistics with 12% STs
who were aware of FLWs providing contraceptives
as being the highest category. (Refer Table 30 in
annexure)
Unmet Need for Sanitary Pads
From a total of 530 female respondents, 40 said that
they did not use sanitary pads. From the remaining
490, a little more than half (275) reported having
an unmet need for sanitary pads, with the highest
Graph 18: Status of Contact with Frontline workers by respondents
1000
900
801
800
700
600
517
500
400
284
300
200
100
0
Overall
Information source for COVID 19 related information(%)
184
109 75
362
189 173
Bihar
Rajasthan
Yes
NO
Total
255
219
36
Uttar Pradesh
23

3.7 Page 27

▲back to top


Impact of COVID-19 on young people: Rapid assessment in three states, May 2020
number of females from Rajasthan (159) and the
least number from Uttar Pradesh (19) reporting an
unmet need.
Table 31: unmet need for sanitary pads
Status of
unmet need of
sanitary pads
for female
Adolescent and
youths (#)
Overall
Bihar
Rajasthan
Uttar
Pradesh
Yes
275
98
158
19
No
215
79
57
79
Total
490 177
215
98
The following variations across social indicators were
observed:
a. Age: Overall, 58% of the younger cohort of
women who were under 18 years reported an
unmet need in comparison to 51% of those who
were 18 years and older. In Rajasthan, this trend
was reversed and higher than average, with 85%
among the older cohort reporting unmet needs
in comparison to 71% of the younger cohort.
Uttar Pradesh had the lowest numbers, with
22% of the older cohort and 19% of the younger
cohort reporting an unmet need.
b. Social indices: Overall, lowest number of SCs
(47%) reported an unmet need for sanitary pads,
followed by OBCs (54%), General (64%), Others
(68%), and STs (69%).
c. In Bihar, the unmet need for sanitary napkins was
higher than the average, but with only 30% OBCs
reporting the lowest unmet need in the state.
d. Uttar Pradesh reported the lowest unmet need
for sanitary napkins across social groups and
states.
Refer Table 32 in annexure for details.
Iron Folic Acid (IFA)
Regarding receipt of IFAs during the lockdown, only
one-third (202 out of 660) respondents confirmed
that they had received IFAs, with Rajasthan
presenting the worst figures: here, only 12 out of
281 respondents said that they had received IFAs.
Table 33: IFA receiving status
Status of
Overall
Receipt of
IFA among
adolescents
(15-19 years) (#)
Bihar
Rajasthan
Uttar
Pradesh
Yes
202
49
12
141
NO
458 115
269
74
Total
660 164
281
215
Other notable variations are as follows:
a. Sex: More females (33%) than males (24%)
reported getting IFAs. This difference was most
stark in Uttar Pradesh where 78% females said
they had received IFAs in comparison to 48%
males.
b. Social indices: Overall, 48% of those classified
as General received IFAs, followed by SCs (39%),
STs (26%), and OBCs and Others (19% each).
c. Rajasthan presented the worst statistics, with only
20% STs reporting that they had received IFAs.
d. Uttar Pradesh presented the best statistics
with 64-66% people across social indices
reporting that they had received IFAs.
e. There was no major variation among those who
received IFAs vis-à-vis their enrolment in an
educational institution; nearly 1/3rd of those who
were in school or college (30%) reported receiving
IFAs. Only in Uttar Pradesh, 68% of those who
were enrolled in school or college reported
receiving IFAs in comparison to 48% of those who
were not enrolled in a school or college.
Refer Table 34 in annexure for details.
4.3 MENTAL HEALTH SERVICES
Access to information on Mental Hhealth
More than half (444 out of 801) the number of
respondents said they had access to information
on mental health. Rajasthan marginally reversed
this trend where more young people (200) said they
did not have access to mental health than those who
did (162).
24

3.8 Page 28

▲back to top


Table 35: access to information on mental health
Access to
information
on mental
health and
emotional
well beings
among
adolescents
& youths (#)
Overall Bihar Rajasthan Uttar
Pradesh
Yes
NO
Total
444
100
162
182
357
84
200
73
801
184
362
255
More women (60%) than men (47%) were aware
of information on mental health, and those who
had studied till Class 10 or more, were more aware
(62%) than their counterparts with lower levels of
education. (refer table 36 in annexure)
“Andruni samsya ke bare mein kisi se nahi bol
pana, saath hi koi bhi jankari nahin mil pana
samsya hai.” Not being able to tell anyone
about your problems and not getting any
information about it is a problem.
“Ration nahin mil raha hai na padhai ho rahi
hai bas usi ko le kar tension ho rahi hai.” We
are not getting ration and studies have also
stopped. These are causing tension.
“Corona se darr lagta hai.” I am scared of
Corona.
Table 37: source of information
Adolescent and
youths used
any source of
information on
mental health
and emotional
well being(#)
Overall Bihar Rajasthan Uttar
Pradesh
Yes
395 58
159
178
NO
406 126
203
77
Total
801 184
362
255
Among the different resources, most commonly
used ones were face to face interaction with
healthcare providers (37%), interactions with
friends (35%) and TV (33%).
Least used were comics and posters (4%) and face
to face interactions with teachers (6%).
Only in Rajasthan, 35% young people also reported
using phone helplines. (Refer Table 38 in annexure).
Graph 19: Information resource for mental health.
Source for information related to mental health (%)
Comics and posters 2
Any other
4
Face-to-face interaction
with Teacher
6
Phone Helpline
17
Social media
27
Use of Mental Health Resources
Overall, nearly half the young people said that
they had used some resource for mental health.
This trend was repeated across social indicators and
across states although Uttar Pradesh represented
consistently higher statistics than other states across
all categories. Here, 89% women reported having
used some mental health resource–the highest
across all social indicators and states.
TV
33
Friends
35
Face-to-face interaction
with Health care provider
0
37
10 20 30 40 50
Status of Help Received
98% of those who used resources for mental
health said that they found the assistance received
to be very helpful.
25

3.9 Page 29

▲back to top


Impact of COVID-19 on young people: Rapid assessment in three states, May 2020
Refer Table 20 in annexure for details.
4.4  KEY FINDINGS
Increase in domestic chores was one of the major challenges with the lockdown; nearly half the
number of young people reported an increase in their domestic workload.
Expectedly, more females than males reported an increase in their domestic workload.
Although only one-quarter of the participants reported an increase in domestic fights, most of these
were women.
A small number of people reported feeling economic anxieties during the lockdown, and most of
these were those who were already employed, followed closely by those who were unemployed and
actively looking for a job.
A small fraction of the total respondents reported feelings of depression, and frustration or irritability
but there was a coincidence whereby a greater number of those feeling depressed or frustrated and
irritable also reported an uptick in the TV and social media consumption during the lockdown.
A little more than half the total respondents reported watching more TV during the lockdown while a
little less than half reported an increase in their social media use.
More women (33%) than men (19%) reported a decrease in their social media use during the
lockdown.
Although nearly 3 out of 5 respondents reported having had some contact with FLWs during the
lockdown, their access to reproductive healthcare was affected with the lockdown.
More than half the number of women reported an unmet need for sanitary pads, and only one-
third of the total respondents confirmed their receipt of IFAs during the lockdown. A majority of
respondents were also not aware that FLWs could provide contraceptives during the lockdown.
With respect to mental health services, more than half the respondents confirmed that they had
access to information on mental health, and nearly half among them said that they had used some
form of mental health service or resource.
Among the different resources, most commonly used ones were face to face interaction with
healthcare providers, interactions with friends, and TV.
In Rajasthan, one-third of young people among respondents also reported using phone helplines.
In Uttar Pradesh, 89% women reported having used some mental health service during the lockdown.
Nearly all of those who sought mental health services found the assistance offered to be either
helpful or very helpful.
26

3.10 Page 30

▲back to top


5 Needs and Priorities
PFI conducted a rapid assessment among young
people to assess their awareness of COVID-19 and to
understand the challenges they face, and the coping
mechanisms that they employ to deal with these.
5.1 KEY FINDINGS
Awareness
z Respondents’ awareness on the symptoms of
COVID-19 was high; a majority were able to
identify at least two key symptoms, such as
cough, fever, breathing difficulties and body
ache.
z Males, those who were older, and those with
higher levels of education were better informed
than females, younger cohort and those with
lower levels of education. The awareness of
symptoms was also lower among socially
marginalized groups, like SCs and STs.
z Respondents were also very well-informed
on the basic safety and prevention practices,
such as washing hands frequently, covering
faces, and practicing social distancing. An
overwhelming majority also reported following
these practices diligently. The lockdown, in effect
nationwide at the time of the study, was being
followed by most of them.
z The primary sources of information for young
people continue to be traditional media,
like TV and policy briefings, and face-to-face
interactions with FLWs.
z WhatsApp was another common medium
although other digital technology-dependent
portals, like Twitter, Arogya Setu app, and
Facebook were not common sources of
information.
z Schools were rarely listed as a source of
information, indicating the inability of
educational institutions to transcend the
boundaries of the school premises and the
academic session to stay connected with
students. But here, states can learn from one
another to emulate best practices: in Rajasthan,
for example, one-fourth of the total respondents
listed schools as a reliable source of information
on Coronavirus.
z A majority of the respondents also noted that
they would contact a doctor, self-isolate, and
facilitate contact tracing, if they or someone they
knew exhibited symptoms. A sizeable number
also said that they would contact a FLW or the
Pradhan to relay their symptoms and seek
advice on the way forward.
z The continued relevance of local on-ground
persons and institutions, like FLWs, as reliable
sources of information and as persons to
contact in case of suspected COVID-19 reiterate
the importance of these institutions in handling
a public health emergency. Going forward, it
is essential to empower, equip and strengthen
these as much as possible.
Challenges
z One of the primary challenges that young
people experienced with the nationwide
lockdown was the increase in their workload of
domestic chores. Expectedly, more females than
males reported an increase in their domestic
workload.
z Increase in domestic conflicts or fights at home
were reported by one-fourth of the participants.
Among those who did report an increase in
domestic fights, most were women.
27

4 Pages 31-40

▲back to top


4.1 Page 31

▲back to top


Impact of COVID-19 on young people: Rapid assessment in three states, May 2020
z A small number of participants reported feeling
economic anxieties during the lockdown, and
most of these were those who were already
employed, followed closely by those who were
unemployed and actively looking for a job.
z A little more than half the total number of
respondents reported watching more TV
during the lockdown while a little less than half
reported an increase in their social media use.
However, among those who reported a decrease
in their TV watching or social media use, most
were women.
z A small fraction of the total respondents
reported feelings of depression and frustration
or irritability, and interestingly, there was a
coincidence whereby a greater number of those
feeling depressed or frustrated and irritable
also reported an uptick in their TV and social
media consumption during the lockdown.
More in-depth qualitative research is needed to
understand what this trend signifies.
Access to Family Planning Related Healthcare
z One of the challenges we wanted to evaluate in
this research was how access to reproductive
healthcare had been impacted during the
pandemic and lockdown. We inquired about
the availability of contraceptives, counselling,
sanitary napkins and the availability of IFA
tablets, as some parameters.
z Our findings suggest that although nearly 3 out
of 5 respondents reported having had some
contact with FLWs during the lockdown, their
access to reproductive healthcare was indeed
interrupted during the lockdown.
z More than half the number of women reported
an unmet need sanitary pads and only one-third
of the respondents confirmed their receipt of
IFAs during the lockdown. A majority of them
were also not aware that FLWs could provide
contraceptives during the lockdown.
Mental Health Services
z In order to assess what coping mechanisms
were available to young people, we enquired
into their access to and use of mental health
services. On a promising note, more than half
the respondents confirmed that they had access
to information on mental health, and nearly
half among them said that they had used some
form of mental health service or resource. In
Uttar Pradesh, 89% women reported having
used some mental health service during the
lockdown.
z Among the different resources that were used,
most common were face to face interaction with
healthcare providers, interactions with friends,
and TV. In Rajasthan, one-third young people
also reported using phone helplines. Nearly
all of those who sought mental health services
found the assistance offered to be either helpful
or very helpful.
5.2 NEEDS AND PRIORITIES
Based on the rapid assessment findings, we have
identified the following core needs and priorities
of young people, both during the pandemic and
continuing after that.
z Access to Reproductive Health: As the pandemic
has shown, and our assessment reiterated,
access to reproductive healthcare services
suffered a blow during the COVID-19 outbreak.
Young people reported unmet needs for such
services as the focus of India’s public health
system shifted to managing and containing the
pandemic.
z Mental Health Care: Young people have
expressed the need for mental health care
services, and those who have used these, have
found them to be positively influential. However,
for many young people, informal channels
for mental health–such as conversations with
friends–dominate the available resources.
These informal channels are not necessarily
verified and the information or mediation they
offer are not necessarily vetted or appropriate.
Hence, there is an urgent need to develop and
streamline formal channels of mental health
services that are trained, reliable and that are
easily accessible to young people.
28

4.2 Page 32

▲back to top


z Double Care Burden on Women: A greater
proportion of women participants than male
participants reported an increase in their
domestic work as well as fights at home. This
is also mirrored in related figures, such as
more women reporting a decrease in their
TV consumption and social media usage
(presumably because of their increased
workload, which leaves less recreational time
available), and a large proportion of women
in Uttar Pradesh reported having sought and
used some mental health services during the
pandemic. There is an immediate need to
address these through social messaging on
sharing the domestic, and through the easy
availability of mental healthcare services.
z Economic Anxieties among Men: Some men
reported being anxious about the economic
fallout of the pandemic; mostly, men who were
already employed were concerned, followed
by those who were unemployed but actively
seeking employment. The strengthening of
mental healthcare services in the wake of
COVID-19 must factor in economic anxiety and
be equipped to address it.
5.3 WAY FORWARD–SHORT AND LONG TERM
STRATEGIES
To address the aforementioned needs of young
people, the following strategies are suggested:
z Strengthen Information and its Dissemination
among Socially Marginalised Communities:
There is a need to strengthen the messaging of
core information that is disseminated for public
consumption during a public health emergency,
like the current pandemic. A concerted effort
needs to be made to ensure this information
reaches socially marginalized communities,
like SCs and STs. Targeted PSAs on TV,
communication through WhatsApp, and door-
to-door visits by FLWs can achieve this.
z Train Frontline Workers: FLWs were critical in
multiple roles: as sources of information, to
access primary healthcare facilities, for reporting
suspected symptoms, and as sources for mental
health related information. As multifaceted
and on-the-ground personnel, FLWs represent
the foundation of India’s public health system.
Investing time and resources in strengthening,
training and empowering them will serve us well
both during the pandemic and going ahead.
z Prioritize Reproductive Health Services: As
the pandemic has shown, and our assessment
reiterated, access to reproductive health
services and family planning-related services,
suffered a blow during the COVID-19 outbreak.
Young people reported unmet needs for such
services as the focus of India’s public health
system shifted to managing and containing
the pandemic. There is therefore, a need
to advocate for a continued priority for
reproductive health. FLWs need to be equipped
with better resources to effectively and
continually deliver reproductive health services.
Furthermore, to ensure that reproductive
health services are not interrupted, there is
a need to continually reiterate at the level of
public discourse that reproductive health is a
fundamental and inalienable aspect of public
health, and that its quality delivery is not a
choice but a requirement, especially in times of
a public health emergency. Relevant civil society
organizations need to collaborate and work with
different levels of governance toward this end.
z Social and Behavioural Change
Communication for Equitable Gender Norms:
Our research highlighted that more women
than men experienced an increase in their
workload, reported domestic fights, and
used mental health care services. These are
related statistics that demonstrate the double
burden of care on women during any public
health emergency. Government agencies and
civil society organizations need to continue
making concerted efforts to address and
challenge social norms that traditionally put
the burden for caregiving on women, with
mental health consequences. Employing
edutainment–educational entertainment–for
29

4.3 Page 33

▲back to top


Impact of COVID-19 on young people: Rapid assessment in three states, May 2020
social and behavioural change is a step in the
right direction, given the high prevalence of TV
viewership among both men and women.
z Mental Healthcare Services: The delivery of
mental healthcare services through formal
and trained channels needs to be expanded
in response to young people’s growing need
for and use of it. There is a need to identify
and include more resources that can serve
young people, such as self-help kits, WhatsApp
communities, phone helplines and by training
lay counsellors and educators. FLWs, who were
one of the most reliable and commonly sources
for addressing mental health concerns, can be
further trained to effectively address young
people’s mental health concerns. Various civil
society organizations are already working in this
sphere, and their collaboration with relevant
government agencies is highly recommended.
z Reimagine Educational Institutions: Schools
were not a widely used source for reliable
information, and nor were they critical to the
continued delivery of mental health care or
access to IFAs. There is a need to reimagine
educational institutions in a way that fosters
deeper connections and interactions with
students that are not limited to them being in
school or the school being in academic session.
One way forward is to explore WhatsApp groups
and communities. Training educators to deliver
mental healthcare can strengthen a closer
interaction between students and educational
institutions.
30

4.4 Page 34

▲back to top


Annexure
Table 3: Age profile
Age
<18 years
Age
>=18 years
Overall
%
#
565
71
236
29
Bihar
%
#
92
50
92
50
Rajasthan
%
#
302
83
60
17
Uttar Pradesh
%
#
171
67
84
33
Table 4: Sex Composition
Sex Composition
Female
Sex
Male
Overall
%
#
530
66
271
34
Bihar
%
#
184
100
0
0
Rajasthan
%
#
215
59
147
41
Uttar Pradesh
%
#
131
51
123
49
Table 5: Sex and Age Composition
Sex v Age groups (%)
Variable
<18 years
>=18 years
Overall
Female Male
70
72
30
28
Bihar
Female Male
50
NA
50
NA
Rajasthan
Female Male
81
86
19
14
Uttar Pradesh
Female Male
79
55
21
45
Table 6: Social Categories
Social Categories
Social
Category
Scheduled Caste
Scheduled Tribe
Other Backward
Class
General
Other
Overall
%
#
263
33
73
9
318
40
124
15
23
3
Bihar
%
#
28
15
8
4
84
46
46
25
18
10
Rajasthan
%
#
94
26
61
17
184
51
21
6
2
1
Uttar Pradesh
%
#
141
55
4
2
50
20
57
22
3
1
Table 7: Education status and level
Education status and level
Current
Education
Status
Highest level
of education
School/College going
Out of School/College
Illiterate
Upto Primary level
Upto Upper Primary level
Upto Secondary level
Upto Senior Secondary level
Bachelor’s degree
Master’s degree
Overall
%
#
728
91
73
9
4
0
15
2
140
17
342
43
252
31
46
6
2
0
Bihar
%
#
159
86
25
14
2
1
2
1
20
11
83
45
55
30
22
12
0
0
Rajasthan
%
#
347
96
15
4
2
1
8
2
53
15
176
49
109
30
13
4
1
0
Uttar Pradesh
%
#
222
87
33
13
0
0
5
2
67
26
83
33
88
35
11
4
1
0

4.5 Page 35

▲back to top


Impact of COVID-19 on young people: Rapid assessment in three states, May 2020
Table 8: Marital status
Marital Status
Bachelor
Married
Marital Status
Separated/ Divorced
Widow/Widower
Overall
%
#
753
94
46
6
1
0
1
0
Bihar
%
#
171
93
12
7
1
1
0
0
Rajasthan
%
#
336
93
25
7
0
0
1
0
Uttar Pradesh
%
#
246
96
9
4
0
0
0
0
Table 9: Marital status and age groups
Marital Status v Age groups (%)
Variable
Bachelor
Married
Separated/Divorced
Widow/Widower
Overall
<18
years
>=18
years
96
88
3
11
0
0
0
0
Bihar
<18
years
>=18
years
99
87
1
12
0
1
0
0
Rajasthan
<18
years
>=18
years
94
87
6
13
0
0
0
1
Uttar Pradesh
<18
years
>=18
years
99
90
1
10
0
0
0
0
Table 10: Marital status and sex
Marital Status v Sex (%)
Variable
Bachelor
Married
Separated/Divorced
Widow/Widower
Overall
Female Male
94
94
5
6
0
0
0
0
Bihar
Female Male
93
NA
6
NA
1
NA
0
NA
Rajasthan
Female Male
92
95
8
5
0
0
0
1
Uttar Pradesh
Female Male
100
92
0
8
0
0
0
0
Table 11: Occupation status
Occupation
Occupation
Currently Studying
Employed
Un-employed(Looking for job)
Un-employed(Not looking for job)
Self employed
Home maker
Not able to work
Overall
%
#
717
90
11
1
18
2
10
1
16
2
26
3
3
0
Bihar
%
#
157
85
2
1
5
3
3
2
1
1
15
8
1
1
Rajasthan
%
#
346
96
2
1
3
1
0
0
4
1
6
2
1
0
Uttar Pradesh
%
#
214
84
7
3
10
4
7
3
11
4
5
2
1
0

4.6 Page 36

▲back to top


Table 12 : Adolescents and youths who have knowledge at least 2 key symptoms by Socio-
demographic characteristics.
Socio-demographic Characteristics
Female
Sex
Male
<18 years
Age
>=18 years
General
Other
Social Category Other Backward Class
Scheduled Caste (SC)
Scheduled Tribe (ST)
Highest level of
eduction
Upto 8th Class
Upto 10th class
Above 10th class
Overall
%
#
460
87
250
92
493
87
217
92
110
89
22
96
292
92
223
85
63
86
134
84
300
88
276
92
Bihar
%
#
169
92
NA
NA
84
91
85
92
36
78
17
94
80
95
28
100
8
100
23
96
74
89
72
94
Rajasthan
%
#
194
90
131
89
269
89
56
93
19
90
2
100
167
91
86
91
51
84
55
87
157
89
113
92
Uttar Pradesh
%
#
97
74
119
96
140
82
76
90
55
96
3
100
45
90
109
77
4
100
56
78
69
83
91
91
Table 14: Major reasons for not following lockdown
Major reasons
#
Go outside for farming
14
Go outside for work
11
Mother working as ASHA
4
Go to field and market
2
Table 15: Sources of information for COVID 19 related information
Source of information
FLWs
Arogya Setu
Press briefings
Website
Family members
Friends
WhatsApp
Twitter
Facebook
School information channel
TV
Radio
Any other source
No body/Nowhere
Overall
#
%
392
49
48
6
334
42
156
19
231
29
165
21
237
30
6
1
60
7
87
11
491
61
31
4
41
5
9
1
Bihar
#
%
106
58
20
11
50
27
10
5
51
28
5
3
47
25
2
1
15
8
1
1
88
48
14
8
10
5
1
1
Rajasthan
#
%
153
42
7
2
264
73
91
25
135
37
93
26
135
37
4
1
39
11
84
23
305
84
10
3
29
8
3
1
Uttar Pradesh
#
%
138
54
22
8
17
7
54
21
44
17
66
26
54
21
0
0
5
2
0
0
96
37
8
3
2
1
3
1

4.7 Page 37

▲back to top


Impact of COVID-19 on young people: Rapid assessment in three states, May 2020
Table 16: Experiencing COVID-19 symptoms
Experienced Corona related
symptoms
Yes
No
Prefer not to answer
Overall
#
%
40
5
732 91
29
4
Bihar
#
%
0
0
172 93
12
7
Rajasthan
#
%
40 11
310 86
12
3
Uttar Prades
#
%
0
0
250 98
5
2
Table 17: Measures to take if facing COVID 19 symptoms
Attitude/View point in case of
Corona infection
Call the doctor/helpline
Self-Isolation
Inform others whom contacted
Something else
Overall
#
%
690 86
731 91
739 92
297 37
Bihar
#
%
98 53
154 84
167 91
71 39
Rajasthan
#
%
350 97
343 95
350 97
136 38
Uttar Pradesh
#
%
242 95
234 92
222 87
90 35
Table 18: Adolescents and youths who said they will prefer to Call the doctor by Socio- demographic
characteristics
Socio-demographic characteristics
Sex
Age
Social Category
Highest level of
eduction
Female
Male
<18 years
>=18 years
General
Other
Other Backward Class
Scheduled Caste (SC)
Scheduled Tribe (ST)
Upto 8th Class
Upto 10th class
Above 10th class
Overall
%
#
432
82
258
95
498
88
192
81
109
88
12
52
263
83
241
92
65
89
146
92
290
85
254
85
Bihar
%
#
93
53
NA
NA
44
48
54
59
31
67
7
39
42
50
15
54
3
38
18
75
41
49
39
51
Rajasthan
%
#
205
95
145
99
291
96
59
98
21
100
2
100
177
96
92
98
58
95
62
98
169
96
119
97
Uttar Pradesh
%
#
129
98
113
91
163
95
79
94
57
100
3
100
44
88
134
95
4
100
66
92
80
96
96
96
Table 19: Adolescents and youths who said they will prefer to Self-Isolation by Socio-demographic
characteristics
Socio-demographic characteristics
Female
Sex
Male
<18 years
Age
>=18 years
Overall
%
#
485
92
246
91
513
91
218
92
Bihar
%
#
154
84
NA
NA
76
83
78
85
Rajasthan
%
#
203
94
140
95
284
94
59
98
Uttar Pradesh
%
#
128
98
106
85
153
89
81
96

4.8 Page 38

▲back to top


Socio-demographic characteristics
Social Category
Highest level of
eduction
General
Other
Other Backward Class
Scheduled Caste (SC)
Scheduled Tribe (ST)
Upto 8th Class
Upto 10th class
Above 10th class
Overall
%
#
116
94
19
83
289
91
240
91
67
92
143
90
313
92
275
92
Bihar
%
#
44
96
14
78
71
85
20
71
5
63
21
88
73
88
60
78
Rajasthan
%
#
19
90
2
100
171
93
92
98
59
97
61
97
164
93
118
96
Uttar Pradesh
%
#
53
93
3
100
47
94
128
91
3
75
61
85
76
92
97
97
Table 20: Adolescents and youths who said they will prefer to Inform others whom contacted by Socio-
demographic characteristics
Socio-demographic characteristics
Sex
Age
Social Category
Highest level of
education
Female
Male
<18 years
>=18 years
General
Other
Other Backward Class
Scheduled Caste (SC)
Scheduled Tribe (ST)
Upto 8th Class
Upto 10th class
Above 10th class
Overall
%
#
496
94
243
90
521
92
218
92
119
96
20
87
301
95
231
88
68
93
137
86
315
92
287
96
Bihar
%
#
167
91
NA
NA
84
91
83
90
44
96
15
83
75
89
26
93
7
88
23
96
76
92
68
88
Rajasthan
%
#
208
97
142
97
293
97
57
95
20
95
2
100
179
97
91
97
58
95
61
97
169
96
120
98
Uttar Pradesh
%
#
121
92
101
81
144
84
78
93
55
96
3
100
47
94
114
81
3
75
53
74
70
84
99
99
Table 21: Changes in routines, interactions and moods after Lock do
Impact on adolescent and
youth during lockdown
Increase in workload related
to household and domestic
chores
Increase in the fights at home
Increase in worries about
finding descent job
Family pressure for
discontinue of study for job
search
Family pressure for
discontinue of study for
marriage
Feeling of depression
Irritability and frustation due
to lack of privacy
Overall
Yes No Total
334 467 801
187 614 801
51 409 460
10 617 627
19 599 618
179 622 801
53 748 801
Bihar
Rajasthan
Yes No Total Yes No Total
48 136 184 126 236 362
42 142 184 120 242 362
11 106 117 23 162 185
5 124 129 2 329 331
0 139 139 3 309 312
42 142 184 71 291 362
17 167 184 13 349 362
Uttar Pradesh
Yes No Total
160 95 255
25 230 255
17 141 158
3 164 167
16 151 167
66 189 255
23 232 255

4.9 Page 39

▲back to top


Impact of COVID-19 on young people: Rapid assessment in three states, May 2020
Table 22: Adolescents and youths who said Yes for Increase in workload related to household and
domestic chores by socio-demographic characteristics
Socio-demographic characteristics
Female
Sex
Male
<18 years
Age
>=18 years
General
Other
Social Category Other Backward Class
Scheduled Caste (SC)
Scheduled Tribe (ST)
Highest level
of eduction
Upto 8th Class
Upto 10th class
Above 10th class
Overall
%
#
271
51
63
23
233
41
101
43
43
35
4
17
126
40
132
50
29
40
63
40
136
40
135
45
Bihar
%
#
48
26
NA
NA
18
20
30
33
3
7
1
6
32
38
10
36
2
25
7
29
18
22
23
30
Rajasthan
%
#
97
45
29
20
101
33
25
42
7
33
0
0
69
38
26
28
24
39
14
22
60
34
52
42
Uttar Pradesh
%
#
126
96
34
27
114
67
46
55
33
58
3
100
25
50
96
68
3
75
42
58
58
70
60
60
Table 23: Adolescents and youths who said Yes for Increase in the fights at home by socio-
demographic characteristics
Socio-demographic characteristics
Female
Sex
Male
<18 years
Age
>=18 years
General
Other
Social Category Other Backward Class
Scheduled Caste (SC)
Scheduled Tribe (ST)
Highest level
of eduction
Upto 8th Class
Upto 10th class
Above 10th class
Overall
%
#
136
26
51
19
128
23
59
25
16
13
4
17
103
32
49
19
15
21
26
16
81
24
80
27
Bihar
%
#
42
23
NA
NA
13
14
29
32
4
9
3
17
24
29
10
36
1
13
5
21
17
20
20
26
Rajasthan
%
#
81
38
39
27
99
33
21
35
7
33
1
50
73
40
25
27
14
23
14
22
55
31
51
41
Uttar Pradesh
%
#
13
10
12
10
16
9
9
11
5
9
0
0
6
12
14
10
0
0
7
10
9
11
9
9

4.10 Page 40

▲back to top


Table 25: Adolescents and youths who said Yes for Feeling of depression by socio-demographic
characteristics
Socio-demographic characteristics
Sex
Age
Social
Category
Highest level
of education
Female
Male
<18 years
>=18 years
General
Other
Other Backward Class
Scheduled Caste (SC)
Scheduled Tribe (ST)
Upto 8th Class
Upto 10th class
Above 10th class
Overall
%
#
114
22
65
24
117
21
62
26
25
20
10
43
64
20
60
23
20
27
25
16
79
23
75
25
Bihar
%
#
42
23
NA
NA
16
17
26
28
8
17
8
44
20
24
4
14
2
25
2
8
20
24
20
26
Rajasthan
%
#
42
20
29
20
60
20
11
18
5
24
0
0
31
17
20
21
15
25
6
10
30
17
35
28
Uttar Pradesh
%
#
30
23
36
29
41
24
25
30
12
21
2
67
13
26
36
26
3
75
46
64
47
57
48
48
Table 26: Adolescents and youths who had contact with FLWs by socio-demographic characteristics
Socio-demographic characteristics
Sex
Age
Social
Category
Highest level
of education
Female
Male
<18 years
>=18 years
General
Other
Other Backward Class
Scheduled Caste (SC)
Scheduled Tribe (ST)
Upto 8th Class
Upto 10th class
Above 10th class
Overall
%
#
340
64
177
65
363
64
154
65
95
77
13
57
178
56
191
73
40
55
112
70
199
58
206
69
Bihar
%
#
109
59
NA
NA
58
63
51
55
33
72
9
50
43
51
17
61
7
88
21
88
40
48
48
62
Rajasthan
%
#
109
51
80
54
159
53
30
50
12
57
1
50
92
50
54
57
30
49
33
52
90
51
66
54
Uttar Pradesh
%
#
122
93
97
78
146
85
73
87
50
88
3
100
43
86
120
85
3
75
58
81
69
83
92
92
Table 27: Status of TV watching by Adolescents and youths by social category among TV Watchers (%)
Socio-demographic
characteristics
Overall
Bihar
Rajasthan
Uttar Pradesh
General
Other
Social
Category
Other
Backward Class
Scheduled Caste (SC)
Scheduled
Tribe (ST)
24 52 25 41 32 27 20 40 40
7 73 20 9 73 18 0 50 50
11 65 24 6 73 21 15 59 26
7 75 18 13 56 31 11 69 20
21 51 28 50 50 0 19 50 31
6 81 14
0 100 0
0 84 16
0 90 10
0 100 0

5 Pages 41-50

▲back to top


5.1 Page 41

▲back to top


Impact of COVID-19 on young people: Rapid assessment in three states, May 2020
Table 28: Status of Social Media use By Adolescents and youths by social category among social media
users (%)
Socio-demographic
characteristics
Overall (589)
Bihar (120)
Rajasthan (320) Uttar Pradesh (149)
General
37 43 20 56 17 28 55 30 15 12 73 15
Other
24 53 24 23 46 31 50 50 0
0 100 0
Other Backward Class 27 39 33 14 43 43 35 31 34 10 77 13
Social
Category
Scheduled Caste (SC)
20
56
24
38
38
25 26 56 18
9
60 31
Scheduled Tribe (ST) 37 39 24 0 75 25 41 35 24 0 100 0
Upto 10th class
34 39 28 37 30 33 39 34 27 10 69 21
Above 10th class
23 52 25 20 46 34 29 43 28 16 70 13
Table 29: Adolescents and youths who have awareness for FP Counselling by FLWs by socio-
demographic characteristics
Socio-demographic
characteristics
Total
Female
Sex
Male
<18 years
Age
>=18 years
General
Other
Social Category Other Backward Class
Scheduled Caste (SC)
Scheduled Tribe (ST)
Highest level of
education
Upto 8th Class
Upto 10th class
Above 10th class
Overall
%
#
370
58
243
59
127
56
258
58
112
58
67
66
14
82
139
59
127
56
23
38
79
60
136
51
155
64
Bihar
%
#
92
61
92
61
NA
NA
49
64
43
57
26
68
12
80
32
49
18
69
4
50
18
90
33
52
41
59
Rajasthan
%
#
125
46
68
42
57
52
107
47
18
40
8
53
2
100
76
60
22
28
17
35
22
45
53
41
50
54
Uttar Pradesh
%
#
153
70
83
84
70
59
102
70
51
71
33
69
0
0
31
72
87
71
2
50
39
62
50
68
64
79
Table 30: Adolescents and youths who have awareness for Contraceptive distribution by FLWs by
socio-demographic characteristics
Socio-demographic characteristics
Total
Sex
Age
Female
Male
<18 years
>=18 years
Overall
%
#
180
30
131
33
49
24
103
25
77
41
Bihar
%
#
65
43
65
43
NA
NA
30
39
35
48
Rajasthan
%
#
11
5
5
4
6
7
9
5
2
5
Uttar Pradesh
%
#
104
47
61
58
43
37
64
44
40
53

5.2 Page 42

▲back to top


Socio-demographic characteristics
General
Other
Social Category Other Backward Class
Scheduled Caste (SC)
Scheduled Tribe (ST)
Highest level of
eduction
Upto 8th Class
Upto 10th class
Above 10th class
Overall
%
#
48
49
9
64
38
18
75
35
10
19
33
27
62
26
85
37
Bihar
%
#
22
58
9
64
19
29
12
48
3
38
14
67
19
32
32
46
Rajasthan
%
#
1
9
0
0
3
3
2
3
5
12
1
3
4
4
6
8
Uttar Pradesh
%
#
25
52
0
0
16
36
61
49
2
50
18
28
39
55
47
54
Table 32: Female Adolescent and youths who said Yes for Unmet need of sanitary pads by socio-
demographic characteristics
Socio-demographic characteristics
<18 years
Age
>=18 years
General
Other
Social Category Other Backward Class
Scheduled Caste (SC)
Scheduled Tribe (ST)
Highest level of
eduction
Upto 8th Class
Upto 10th class
Above 10th class
Overall
%
#
197
58
78
51
54
64
15
68
109
54
63
47
34
69
39
53
128
60
108
53
Bihar
%
#
59
68
39
43
38
84
13
76
24
30
18
69
5
63
14
70
50
62
34
45
Rajasthan
%
#
124
71
34
85
8
62
2
100
83
75
36
72
29
73
20
61
75
74
63
79
Uttar Pradesh
%
#
14
19
5
22
8
30
0
0
2
20
9
16
0
0
5
24
3
10
11
24
Table 34: Adolescents and youths of age 15-19 years who said Yes for Receipt of IFA by socio-
demographic characteristics
Socio-demographic Characteristics
Sex
Social
Category
Education
status
Female
Male
General
Other
Other Backward Class
Scheduled Caste (SC)
Scheduled Tribe (ST)
Out of school/College
School/college going
Overall
%
#
159
33
43
24
48
46
4
19
47
19
88
39
15
26
18
33
184
30
Bihar
%
#
49
30
NA
NA
19
44
1
6
21
28
3
13
5
71
6
30
43
30
Rajasthan
%
#
12
6
0
0
0
0
0
0
3
2
0
0
9
20
1
9
11
4
Uttar Pradesh
%
#
98
78
43
48
29
66
3
100
23
64
85
66
1
25
11
48
130
68

5.3 Page 43

▲back to top


Impact of COVID-19 on young people: Rapid assessment in three states, May 2020
Table 36: Adolescents & youths who have access to information on mental health and emotional well
being by socio-demographic characteristics
Socio-demographic characteristics
Female
Sex
Male
<18 years
Age
>=18 years
General
Social
Category
Other
Other Backward Class
Scheduled Caste (SC)
Scheduled Tribe (ST)
Highest level
of eduction
Upto 8th Class
Upto 10th class
Above 10th class
Overall
%
#
316
60
128
47
313
55
131
56
78
63
17
74
163
51
152
58
34
47
82
52
175
51
187
62
Bihar
%
#
100
54
NA
NA
53
58
47
51
22
48
13
72
42
50
16
57
7
88
13
54
42
51
45
58
Rajasthan
%
#
96
45
66
45
134
44
28
47
10
48
2
100
89
48
36
38
25
41
23
37
74
42
65
53
Uttar Pradesh
%
#
120
92
62
50
126
74
56
67
46
81
2
67
32
64
100
71
2
50
46
64
59
71
77
77
Table 38: Different resource used by Adolescent & youth for those who used any source of information
related to mental health
Source of information
Face-to-face interaction with Teacher
Face-to-face interaction with
Healthcare provider
Friends
Phone Helpline
TV
Social media
Comics and posters
Any other
Overall
#
%
22
6
146
37
139
35
67
17
132
33
105
27
8
2
17
4
Bihar
#
%
0
0
11
19
6
10
10
17
28
48
21
36
7
12
1
2
Rajasthan
#
%
17
11
56
35
28
18
56
35
50
31
39
25
0
0
4
3
Uttar Prades
#
%
5
3
79
44
105
59
1
1
54
30
45
25
1
1
12
7

5.4 Page 44

▲back to top


Head Office:
B-28, Qutab Institutional Area, New Delhi – 110016
T: +91 11 43894 100
State Offices: Bihar | Rajasthan | Uttar Pradesh
populationfoundation.in
PopFoundIndia
PopFoundIndia
popfoundind