Changigarh Profile - Population Health and Social Development Punjab Haryana HP Chandigarh PFI

Changigarh Profile - Population Health and Social Development Punjab Haryana HP Chandigarh PFI


1 Pages 1-10

▲back to top


1.1 Page 1

▲back to top


POPULATION, HEALTH AND SOCIAL
DEVELOPMENT
Punjab
Haryana
Himachal Pradesh
Chandigarh

1.2 Page 2

▲back to top


Population, Health & Social Development
Punjab
Haryana
Himachal Pradesh
Chandigarh

1.3 Page 3

▲back to top


1.4 Page 4

▲back to top


Population Foundation of India
© October 2008
Contributors :
Dr. Almas Ali
Dr. Lalitendu Jagatdeb
Mr. Nihar Ranjan Mishra
Mr. Shailendra Singh Negi
Ms. Lopamudra Paul
Impression Communications
2/8-A, Ansari Road, Darya Ganj
New Delhi-110 002, Tel : 9811116841
ii

1.5 Page 5

▲back to top


Regional Conference on
Health, Population and Social Development with focus on
the Child Sex Ratio/Female Foeticide
23 - 24 October, 2008
at
Grand Ball Room, Hotel Taj, Chandigarh
OBJECTIVES
• To get a clear perspective of the demographic and health transition process in Punjab, Haryana and
Himachal Pradesh.
• To draw attention to the issue of child sex ratio and review efforts to curb sex selective practices
and pre-birth elimination of females
• To recapitulate initiatives by the State Governments on population and health issues
10.00 – 10.45
10.00 – 10.05
10.05 – 10.15
10.15 – 10.20
10.20 – 10.40
10.40 - 10.45
10.45 – 11.00
11.00—11.45
11.00—11.20
11.20—11.40
11.40 – 11.45
11.45 – 1.00
11.45 – 12.05
PROGRAMME
DAY 1 – October 23, 2008
Guests are requested to be seated by 9.50 AM
Chief Guest arrives at 9.55AM
Inaugural Session
Welcome Speech – Mr. A.R.Nanda, Executive Director, PFI
Speech by Mr. B.G. Deshmukh, Vice-Chairman, Governing Board, PFI
Release of publications by Chief Guest
Inaugural Address by Chief Guest –His Excellency General (Retd.) S.F.
Rodrigues, Governor of Punjab & Administrator, UT Chandigarh
Vote of Thanks-Mr B.G. Verghese, Member, Governing Board, PFI
Tea Break
Key note addresses
Chairperson:Prof. Ranjit Roy Chaudhury,Member, Governing Board, PFI
Keynote Address: I
Demographic transition in Punjab, Haryana and Himachal Pradesh: Issues &
Challenges for Population Stabilization by Dr. Almas Ali & Mr. Nihar Ranjan
Mishra, PFI
Keynote Address: II
Health and Epidemiological transition in Punjab, Haryana and
Himachal Pradesh by Dr. Rajesh Kumar, PGI
Chairperson’s remarks
Session 1 – Demographic & Health Transition in Himachal Pradesh
Chairperson:Ms. Nina Puri, Member, Governing Board, PFI
Co-Chair: Mr. Subhash Mendhapurkar, Director, SUTRA
Demographic Transition in Himachal Pradesh: Ms. C.P. Sujaya
iii

1.6 Page 6

▲back to top


12.05 – 12.25
12.25 – 1.00
1.00 – 2.00
2.00- 3.30
2.00 – 2.20
2.20 – 2.40
2.40 – 3.30
3.20 – 3.40
3.40 - 5.00
3.40-4.00
4.00—4.20
4.20– 5. 00
7.30-9.30
7.30-7.50
7.55
8.10-8.25
8.25 onwards
9.30-10.15
9.30 – 9.55
9.55 – 10.00
10.00 –10.15
10.15 - 01.00
10.15 – 10.35
Presentation on “Policies and programme initiatives in Himachal Pradesh on
Population/RCH by Mr. Deepak Sanan, Principal Secretary, Health, Himachal
Pradesh
Plenary discussion & Chairperson’s/Co-chairperson’s remarks.
Lunch Break
Session 2– Demographic & Health Transition in Haryana
Chairperson: Mr. J.C. Pant, Member, Governing Board, PFI
Co-Chair: Mr. C.B. Satpathy, Advisor, SUKARYA
Demographic Transition in Haryana: Mr Sunil Gulati, Former Director of
Census Operations, Haryana & at present Commissioner, Command Area
Development Authority, Haryana
Presentation on “Policies and programme initiatives in Haryana on Popula-
tion/RCH” by Principal Secretary, Health
Plenary discussion & Chairperson’s/Co-chairperson’s remarks.
Tea Break
Session 3– Demographic & Health Transition in Punjab
Chairperson: Mr. K.L. Chugh, Member, Governing Board, PFI
Co-Chair: Mr. Manmohan Sharma, Executive Director, VHAP
Fertility Transition in Punjab by Prof. Ashwini Nanda, Director, Population
Research Center, CRRID, Chandigarh
Presentation on “Policies and programme initiatives in Punjab on Population/
RCH” by Principal Secretary, Health
Plenary discussion & Chairperson’s/Co-chairperson’s remarks.
Reception Dinner
Arrival of Guests
Arrival of Chief Guest, His Excellency Dr. A.R. Kidwai, Governor of Haryana
Address by Chief Guest
Dinner
DAY 2 – October 24, 2008
Session 4 – Child Sex Ratio in Haryana, Himachal Pradesh and Punjab:The
issue of female foeticide
Chairperson: Mr. B.G. Verghese, Member, Governing Board, PFI
Keynote: Gender Discrimination, Sex Selection and the State: Contradictions,
Contestation and Challenges by Ms. Bijayalaxmi
Chairperson’s/Co-chairperson’s remarks.
Tea Break
Session 5 – Initiatives by Civil Societies/State govt to address the Missing
Girls issue
Chairperson: Ms. Ena Singh, Asst. Representative, UNFPA
Co-Chair- Ms. Nina Puri, Member, Governing Board, PFI
Overview of advocacy efforts on Missing Girls by PFI in Punjab, Haryana &
Himachal Pradesh – Ms. Sona Sharma, PFI
iv

1.7 Page 7

▲back to top


10.35 – 11.00
11.00 – 11.20
11.20—11.40
11.40 – 12.05
12.05—12.25
12.25—01.00
1.00 – 2.00
2.00 – 2.45
2.00-2.20
2.20—2.45
2.45-3.45
2.45—3.05
3.05—3.45
3.45-4.15
3.45—4.00
4.00—4.10
4.10—4.20
4.20
4.25
Advocacy to Action : Missing Girls Interventions in Haryana & Punjab –
Mr. Manmohan Sharma, ED, VHAP
Presentation on Haryana government initiatives to improve child sex ratio by
State Govt. Representative
Presentation on Punjab government initiatives to improve child sex ratio by
State Govt. Representative
Advocacy to Action : Missing Girls Interventions in Himachal Pradesh –
Mr. Subash Mendhapurkar, Director, SUTRA
Presentation on Himachal government initiatives to improve child sex ratio by
Dr Sunite Ganju, Nodal Officer (PNDT)
Plenary discussion & Chairperson’s/Co-chairperson’s remarks.
Lunch Break
Session-6—Corporate Social Responsibility on the issue of sex selection/
female foeticide
Chairperson- Mr. K.L. Chugh, Member, Governing Board, PFI
Corporate Social Responsibility on the issues of RCH & Sex selection/female
foeticide-Presentation by Dr. Upma Sharma, Ranbaxy Community Health
Services, Chandigarh
Plenary discussion & Chairperson’s remarks.
Session 7—Role and Impact of media in addressing child sex ratio
Chairperson—Mr HK Dua, Editor, Tribune
Co-chair- Mr. B.G. Verghese, Member, Governing Board, PFI
Media response and impact—presentation by Ms. Usha Rai
Plenary discussion & Chairperson’s/Co-chairperson’s remarks.
Closing Session
Chairperson: Mr. B.G. Deshmukh, Vice-Chairman, Governing Board, PFI
Co-chair: Mr. J.C. Pant,Member, Governing Board, PFI
Summarizing 2 day deliberations by Dr Kumudha Aruldas, PFI
Remarks by Co-chairperson
Adress by the Chairperson
Vote of Thanks — Mr. S. Ramaseshan, PFI
TEA
End of The Conference
v

1.8 Page 8

▲back to top


vi

1.9 Page 9

▲back to top


Foreword
Population Foundation of India (PFI) has been engaged in systematic analysis and
dissemination of data on population, health and social development aspects at different
levels, viz., national, state, and district level. This information is useful to formulate
policies, design programmes, and develop strategies that would result in effective
implementation of interventions in reproductive and child health, family planning and
other issues like child sex ratio that impact a balanced population stabilization and
social development.
One of the features of the state advocacy conference on Population, Health and Social
Development in different states is release of publications like wall chart and district
profiles for respective states. PFI in the past has organized conferences with such
publications in states like Rajasthan, Uttar Pradesh, Madhya Pradesh, Uttaranchal,
Maharashtra, Bihar, Jharkhand, Orissa, Chhattisgarh, Andhra Pradesh, Karnataka, Kerala
and Tamil Nadu.
The regional advocacy conference being held in Chandigarh this year focuses on the
perspective and dynamics of demographic and health transition specifically in Punjab,
Haryana, Himachal Pradesh, and Chandigarh. The present publication ‘Population,
Health and Social Development: Punjab, Haryana, Himachal Pradesh and Chandigarh’,
contains papers on health and demographic transition as well as the issues for female
foeticide and also state and district profiles with state and district maps.
The Foundation has made an effort to help policy makers, planners, programmers and
Non-Governmental Organizations (NGOs) by providing information through this report
for improving health and social conditions. We hope this publication will be useful for
formulation, monitoring, and implementation of policies and programmes.
October, 2008
New Delhi
A. R. Nanda
Executive Director
Population Foundation of India
vii

1.10 Page 10

▲back to top


viii

2 Pages 11-20

▲back to top


2.1 Page 11

▲back to top


CONTENTS
Particulars
Page No.
KEY NOTES FOR THE CONFERENCE .......................................................................................... 1
Key Note - I ................................................................................................................................... 3
DEMOGRAPHIC TRANSITION IN PUNJAB, HARYANA & HIMACHAL PRADESH : .............. 3
Issues and Challenges for Population Stabilization
Dr. Almas Ali, Mr. Nihar Ranjan Mishra
Key Note - II ................................................................................................................................ 29
HEALTH AND EPIDEMIOLOGICAL TRANSITION IN PUNJAB, HARYANA & ...................... 29
HIMACHAL PRADESH
Dr. Rajesh Kumar
Key Note - III
GENDER DISCRIMINATION, SEX SELECTION AND THE STATE : .......................................... 31
CONTRADICTIONS, CONTESTATIONS AND CHALLENGES
Ms. Bijayalaxmi Nanda
PUNJAB ..................................................................................................................................... 49
State at a glance .......................................................................................................................... 49
Districts at a glance ..................................................................................................................... 53
HARYANA ................................................................................................................................. 89
State at a glance .......................................................................................................................... 89
Districts at a glance ..................................................................................................................... 93
HIMACHAL PRADESH ............................................................................................................ 133
State at a glance ........................................................................................................................ 133
Districts at a glance ................................................................................................................... 137
CHANDIGARH UT ................................................................................................................. 163
State at a glance ........................................................................................................................ 163
Districts at a glance ................................................................................................................... 167
GLOSSARY ............................................................................................................................... 171
REFERENCES ............................................................................................................................. 173
ix

2.2 Page 12

▲back to top


x

2.3 Page 13

▲back to top


Abbreviation
ANC
ART
ASFR
CASSA
CAPF
CBR
CDR
CEHAT
CHC
CPR
CSR
CWDS
FASDSP
GFR
HDI
HMIS
ICPD
ICTC
IEC
IFA
IMR
MTP
MMR
NFHS
NPP
NRHM
NHP
PFI
PHC
PIL
PNDT
PPTCT
RCH
RGI
UNFPA
SC
SDI
SRSS
STD
TFR
VHAI
Ante Natal Care
Anti Retroviral Therapy
Age-specific Fertility Rate
Campaign Against Sex Selective Abortion
Campaign Against Pre-birth Elimination of Females
Crude Birth Rate
Crude Death Rate
Centre for the Enquiry of Health and Allied Themes
Community Health Centre
Contraceptive Prevalence Rate
Child Sex Ratio
Centre for Women’s Development Studies
Forum Against Sex Determination and Sex Pre-Selection
General Fertility Rate
Human Development Index
Health Management Information System
International Conference on Population and Development
Integrated Counseling and Testing Centre
Information Education and Communication
Iron Folic Acid
Infant Mortality Rate
Medical Termination of Pregnancy
Maternal Mortality Ratio
National Family Health Survey
National Population Policy
National Rural Health Mission
National Health Policy
Population Foundation of India
Primary Heath Centre
Public Interest Litigation
Pre Natal Diagnostic Tests
Prevention of Parent to Child Transmission
Reproductive and Child Health
Registrar General, India
United Nation Fund for Population Activities
Sub Centre
Social Development Index
Sample Registration System
Sexually Transmitted Diseases
Total Fertility Rate
Voluntary Health Association of India
xi

2.4 Page 14

▲back to top


xii

2.5 Page 15

▲back to top


2.6 Page 16

▲back to top


Key Note-I
2

2.7 Page 17

▲back to top


Key Note-I
Demographic Transition in Punjab, Haryana & Himachal Pradesh
Issues and Challenges for Population Stabilization
Dr. Almas Ali*
Nihar Ranjan Mishra**
As the title indicates the present paper is divided into two distinct parts;
1. Demographic Transition in Punjab, Haryana, and Himachal Pradesh and
2. Population Stabilization: Issues and Challenges
1. Demographic Transition:
I. Introduction:
Population growth occurs naturally and has taken place everywhere in all regions of the world and
India is no exception. In order to understand this in its correct perspective, there is a need to
understand the concept of demographic transition. The theory of demographic transition is usually
presented in terms of three stages of demographic evolution:
First stage of high birth rates and high death rates (high balance),
Second (intermediate) stage of high birth rates and low death rates (high rate of natural increase),
and
Third stage of low birth rates and low death rates (low balance).
With the advancement of economic and material progress, education, women’s empowerment
and availability of contraceptives, birth rates start declining slowly at first and rapidly thereafter,
and soon a stage is reached (that is, the third) stage where birth and death rates are equal once
again (low balance). This cycle of changes, which occurs in any population, is known as demographic
transition. The second (intermediate) stage of development is characterized by high rates of natural
increase as a result of faster decline in death rates (mortality) with birth rates maintaining their
initial high levels.
In the second half of the 20th century, the world witnessed an unprecedented population growth
rate. The world’s population doubled from 3 to 6 billion in less than 40 years between 1960 and
1999. It increased from 5 to 6 billion in just 12 years (from 1987 to 1999) while it had taken four
times as many years to double from 1.5 to 3 billion and nearly a millennium to reach the first
billion. What triggered this growth in the second half of 20th century starting from 1950 onwards,
shortly after the Second World War, was the rapid and steep fall in the death rates. This sudden
decline in death rates (mortality) was primarily the result of advances in health technology (including
the discovery of antibiotics), and public health interventions. Knowledge acquired in curbing the
spread of killer diseases and epidemics was transferred to the developing countries whose natural
growth rate was governed by high mortality and high fertility. As a result, the death rates fell
drastically, while fertility and birth rates maintained their high levels. This resulted in an
unprecedented high level of natural growth. India was no exception to this phenomenon: with
sharp declines in death rates brought about by advances in health technology, while birth rates
continued to remain high.
According to 2001 Census, India’s population was 1,028,737,436 (102.9 crores). Viewed globally
India constitutes 16.9% of world’s population and 2.4% of the global land area. Currently (2008)
India’s population is estimated at 114.7 crores. India is a country of striking demographic diversity.
Substantial differences are visible between states in achievement of basic demographic indices.
This has led to significant disparity in current population size and the potential to influence India’s
population increase in future. There is already a “North-South Demographic Divide” as Prof.
Asish Bose rightly terms it. As a matter of fact, all the Southern states namely; Kerala, Tamil Nadu,
* Senior Adviser, Population Foundation of India
** Programme Officer (Monitoring & Evaluation), Population Foundation of India
3

2.8 Page 18

▲back to top


Key Note-I
Andhra Pradesh and Karnataka are doing well in reduction of fertility, whereas in the four large
states namely; Bihar, Uttar Pradesh, Madhya Pradesh and Rajasthan growth rates continue to be
high and are lagging far behind, thus the crux of India’s population problem lies in these four
states. These states with high fertility rates are the very states, which have low literacy rates and
low health indicators with high infant mortality and high maternal mortality. These states account
for nearly 40% of country’s population and will contribute well over 50% of growth in coming
decades. The performance and the demographic outcomes of these states will determine the time
and the size of population at which India will achieve population stabilization.
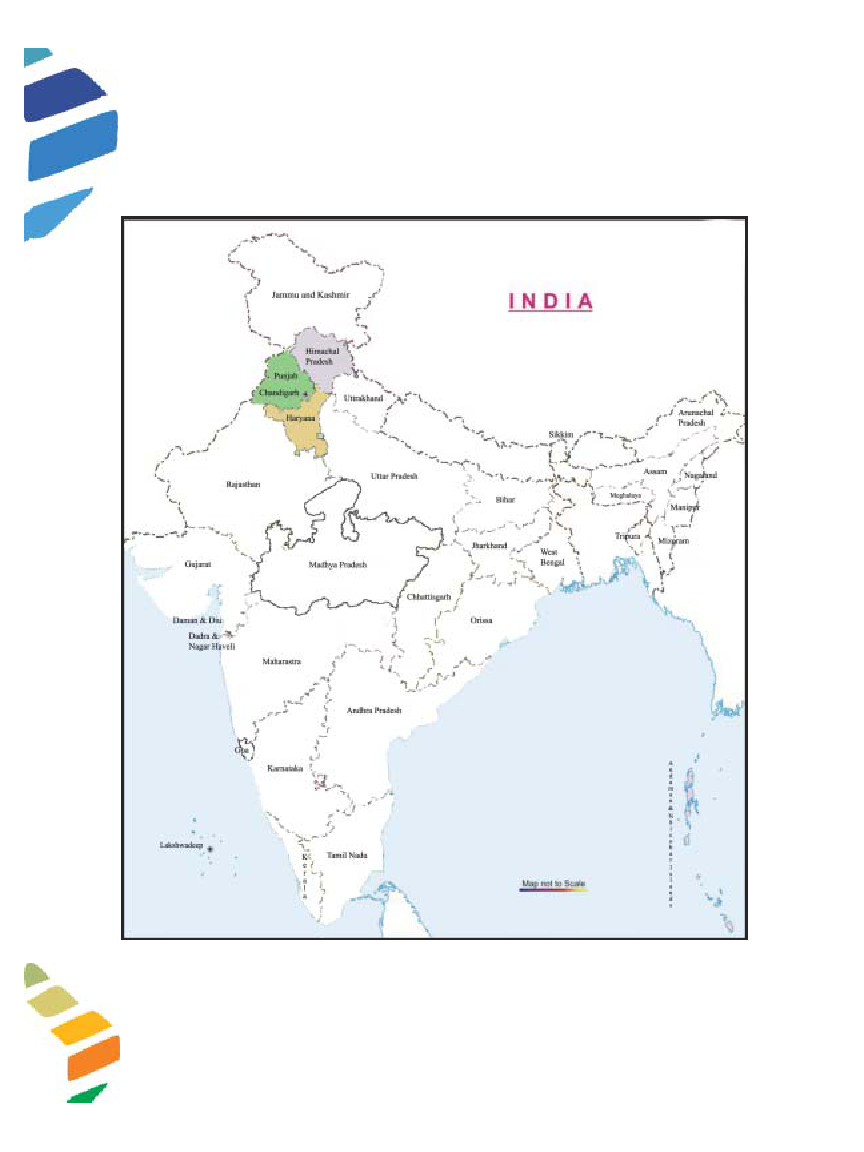
The focus of the paper is on the three North-Western States of India namely-Punjab, Haryana and
Himachal Pradesh which constitutes around 4.5 percent of the total land area of the country but
has about 5 percent of it’s total population (Census, 2001). Fortunately enough, in these three
states excepting perhaps Haryana other two states are in a relatively better off in the area of fertility
reduction. Out of these three states two states have already completed their fertility transition.
Table-1: Year by which Replacement Level of Fertility (Total Fertility of 2.1) will be Achieved
India and Major States
Year by which projected TFR will be 2.1
India
Andhra Pradesh
Assam
Bihar
Chhattisgarh
Delhi
Gujarat
Haryana
Himachal Pradesh
Jammu & Kashmir
Jharkhand
Karnataka
Kerala
Madhya Pradesh
Maharashtra
Orissa
Punjab
Rajasthan
Uttar Pradesh
Uttarakhand
Tamil Nadu
West Bengal
North East (Excl. Assam)
2015
Achieved in 2002
2019
2021
2022
Achieved in 2001
2012
2012
Achieved in 2002
NA
2018
Achieved in 2005
Achieved in 1998
2025
2009
2010
Achieved in 2006
2021
2027
2022
Achieved in 2000
Achieved in 2003
Achieved in 2005
Source: the Technical Group on Population Projections by the Office of the RGI, 2006
As per the recent projection made by the Registrar General,India,2006, Punjab and Himachal
Pradesh, have already reached below replacement level of fertility i.e., Total Fertility Rate(TFR)
of 2.1(which is the average number of children born to the woman after allowing for a slight
mortality factor).The state of Haryana is expected to achieve replacement level of fertility i.e.,
TFR of 2.1 by the year 2012.With a TFR around 2.8, the state of Haryana is far behind the
other two states in achieving fertility transition.
4

2.9 Page 19

▲back to top


Key Note-I
II. Population Dynamics:
States in India are experiencing the phenomenon of demographic transition, the routes of transition
being determined largely by local living conditions. Changes in the natural increase of population,
has been brought about primarily by decline in mortality rather than a big increase in fertility. The
North Western states of Punjab and Himachal Pradesh are no exception to this process.
As per the 2001 Census the population of Punjab 24.3 million followed by Haryana (21.1 million)
and Himachal Pradesh (6.1 million) respectively. As per the current (2008) projection the estimated
population of Punjab is 26.5 million, Haryana is 23.7 million and Himachal Pradesh is 6.5 million.
The density of population was 484 per per sq. km. in Punjab, 478 per sq. km. in Haryana and 109
per sq. km. in Himachal Pradesh
Table-2: Population from 1971 to 2001 and 2008 in Punjab, Haryana, Himachal Pradesh and
India (population figures in 000’s)
State/Country
Population
1971
1981
1991
2001
2008
Punjab
13551
16789
20282
24289
26591
Haryana
10037
12922
16464
21083
23772
HP
3460
4281
5171
6077
6550
India
548160
683329
846388
1027015
1147677
Source: Census of India-1971, 1981, 1991, 2001 and RGI Projected figure
The highest decline in the decadal growth rate was in Himachal Pradesh i.e, 3.25 percent points,
followed by Punjab (0.71 percent points). In contrast Haryana has registered an increase of 1.02
percent points in the decadal growth rate during the last decade (1991-2001). The other two major
states registered increase are Bihar (5.24 percent points) and a slight increase in Uttar Pradesh
(0.24 per cent points). As in the case of decadal growth rate, similar trend was observed in the
case of average annual exponential growth rate in Haryana. The average annual exponential growth
rate rose from 2.42(1981-1991) to 2.47(1991-2001). In the states of Punjab and Himachal Pradesh
a declining trend was found for the average annual exponential growth rate.
Table-3: Decadal Growth Rate and Average Annual Exponential Growth Rate,
1971-81, 1981-91, 1991-2001
State/Country
Decadal Growth Rate
Average annual
exponential growth rate
1971-81 1981-91 1991-2001 1971-81 1981-91 1991-2001
Punjab
23.89
20.81
20.10
2.16
1.89
1.80
Haryana
28.75
27.41
28.43
2.55
2.42
2.47
Himachal Pradesh
23.73
20.79
17.54
2.15
1.89
1.62
India
24.66
23.86
21.53
2.22
2.14
1.93
Source: Census of India-1971, 1981, 1991, 2001 and RGI Projected figure
With change in population size there is shift in age structure of the population. With decline in
fertility there is a decline in young age population and the elderly population not rising
5

2.10 Page 20

▲back to top


Key Note-I
commensurately to offset this fall, it is often said that the countries enjoy ‘Demographic Bonus’
during the course of demographic transition. Out of these three North Western states Haryana is
the only exception to this effect.
Table-4: Population Distribution (in percentage), 2001
State/Country
Punjab
Population Adolescents
(0-6 years) (10-19 years)
(Percent)
(Percent)
Young
People
(10-24 years
)(Percent)
13.0
22.2
31.8
Working
Age
Population
(15-59 yrs.)
(Percent)
Women in
Reproductive
Age Group
(15-44 yrs)
(Percent)
59.56
48.5
Elderly
Population
(60 and
above yrs.)
(Percent)
9.0
Haryana
15.8
23.5
32.7
56.49
47.3
7.5
HP
13.0
22.0
31.6
59.89
47.9
9.0
India
15.9
21.9
30.7
57.08
46.2
7.47
Source: Computed from Census, 2001
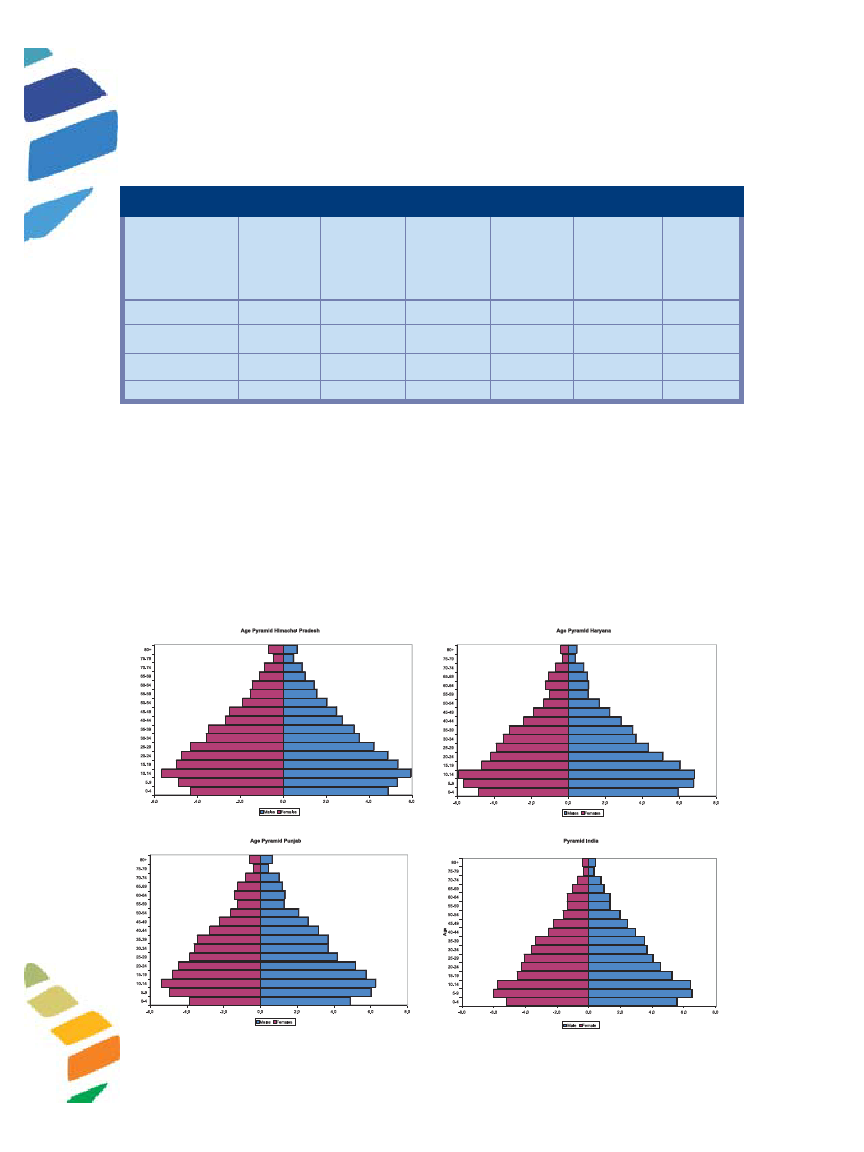
Analyzing the age structure of the population in these three states shows that Population (0-6
years) in the age group constitutes the highest proportion (15.8 percent) of the state’s total population.
In case of Himachal Pradesh and Punjab the corresponding figure is 13 percent. The population in
the age group of (0-6) is a proxy indicator for fertility. Concentration of population in this age
group implies that the fertility transition in Haryana is much slower than the other two states.
Similarly the proportion of adolescents and young people is also higher in the case of Haryana as
compared to the other two states. Because of fertility decline the states of Punjab and Himachal
Pradesh already started experiencing the phenomenon of population ageing. There is substantial
increase in the elderly Population (60+) in these two states.
Age Pyramids: Punjab, Haryana, Himachal Pradesh and India:
6

3 Pages 21-30

▲back to top


3.1 Page 21

▲back to top


Key Note-I
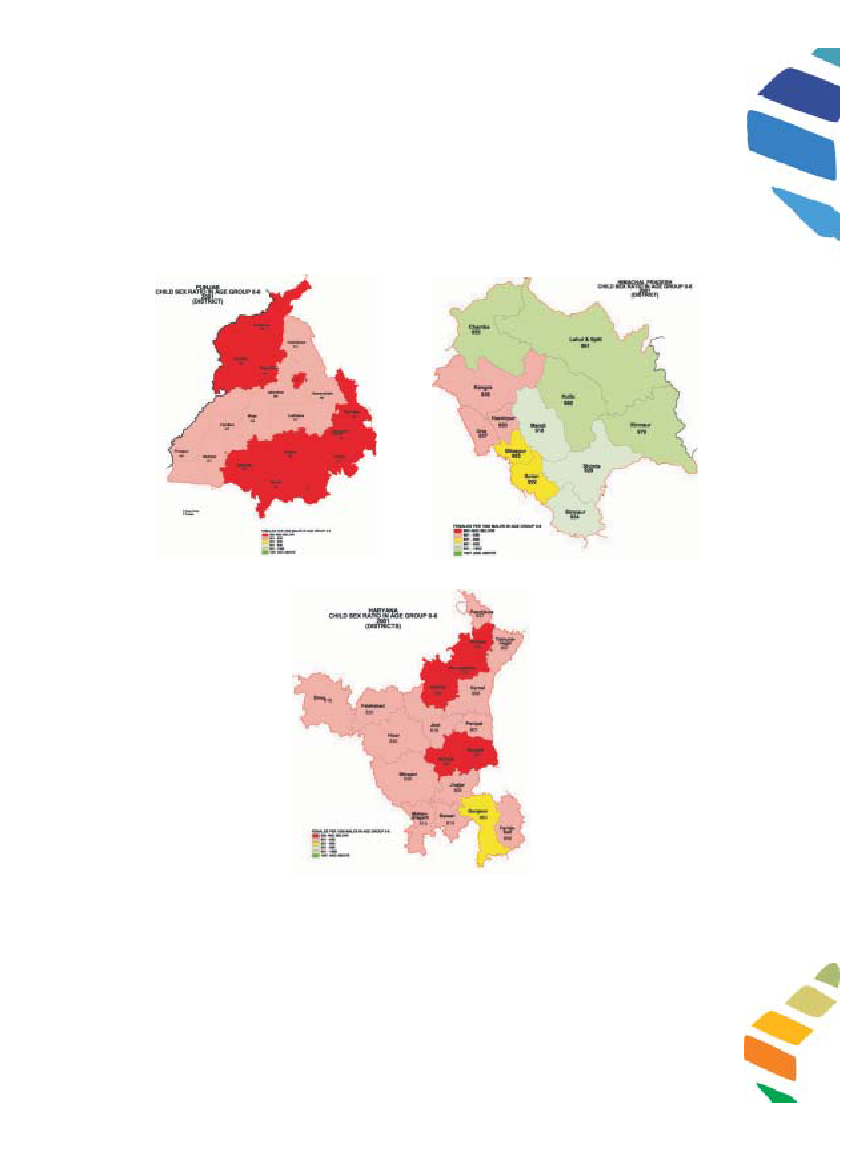
Sex Ratio and Child Sex Ratio (0-6 Years):
Sex Ratio (females per 1000 males) was highest in Himachal Pradesh 968 followed by Punjab 876
and Haryana 861.In all the three states the sex ratio declined over the decade (1991-01),the highest
decline was registered in Himachal Pradesh 8 points, Punjab 6 points and Haryana 4 points.
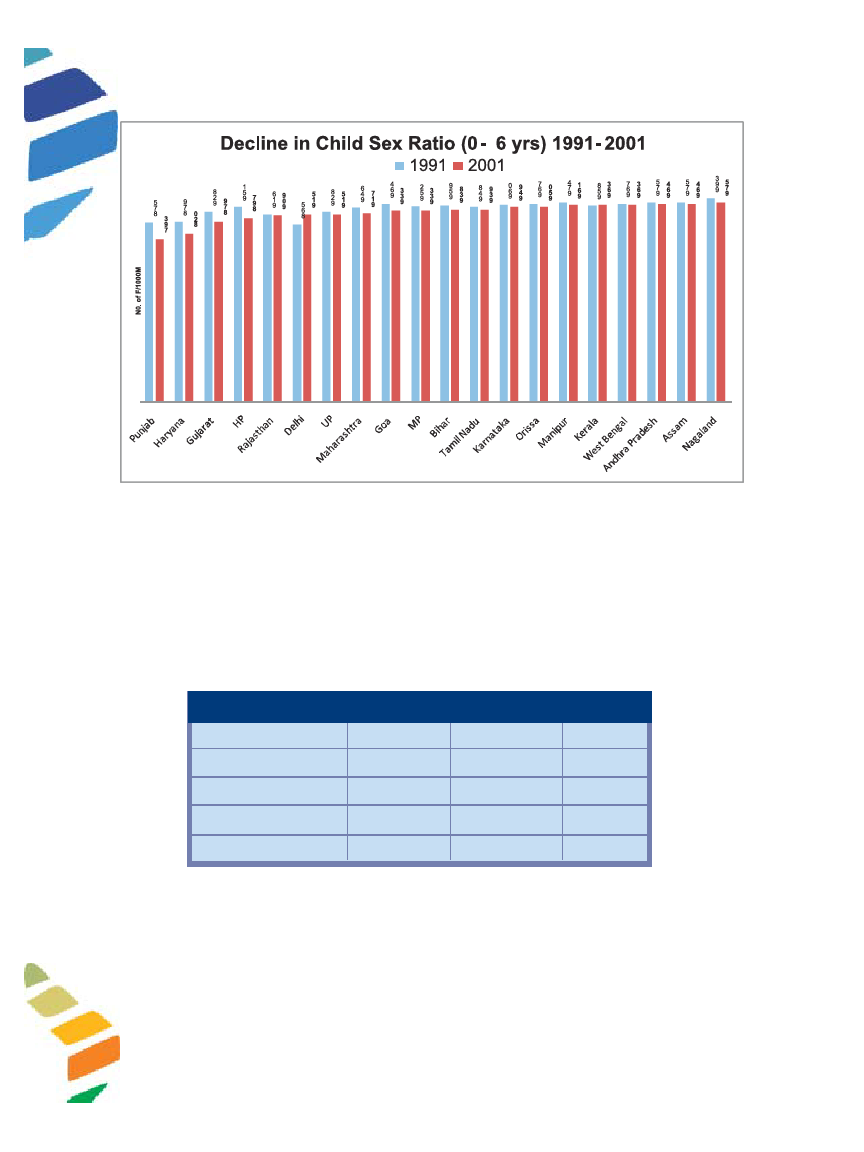
Child Sex Ratio (0-6 Years) (girls per 1000 boys) declined sharply in Punjab (77 points), Haryana
(60 points) and Himachal Pradesh (50 points) during the last decade.
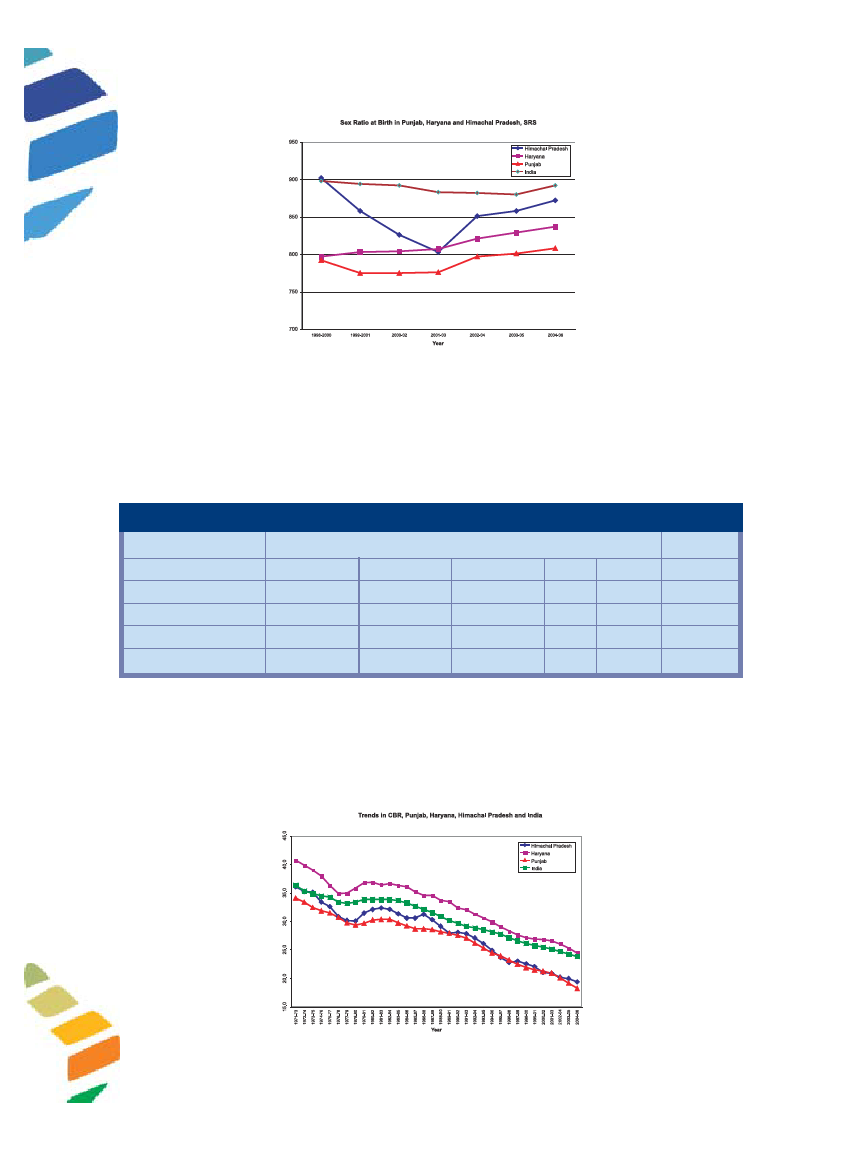
Sex Ratio at Birth:
The sex ratio at shows a declinining trend in Punjab and Himachal Pradesh till, 2001-2003.Among
the three states the sex ratio at birth in Punjab was found to be the lowest. After 2001-03 sex ratio
at birth showed somewhat improvement in these three states and India. In case of Punjab still it is
a concern, as the lowest sex ratio at birth was recorded in Punjab.
7

3.2 Page 22

▲back to top


Key Note-I
III. Fertility Transition:
Before the Sample Registration System (SRS) was introduced by the Registrar General, India
information on fertility levels and trends consisted mainly of indirect estimates prepared by various
demographers using age and sex distribution from the census data. Since 1971 SRS has been
providing for estimating fertility measures and is considered to be most accurate and reliable. The
fertility indicators used for analysis are: Crude Birth Rate (CBR), General Fertility Rate (GFR),Age
Specific Fertility Rate(ASFR) and Total Fertility Rate(TFR).
Table-5: Crude Birth Rate (CBR) in Punjab, Haryana and Himachal Pradesh
State
Punjab
Haryana
HP
India
1971
34.2
42.1
37.3
36.9
1981
30.3
36.5
31.5
33.9
CBR
1991
27.7
33.1
28.5
29.5
2001
21.2
26.8
21.2
25.4
Difference
2006 1971-2006
17.8
16.4
23.9
18.2
18.8
18.5
23.5
13.4
Source: SRS
CBR at all India level declined from 36.9 in 1971 to 23.5 in 2006.In all the three north western
states the CBR declined in between 1971 and 2006.The difference in CBR was found to be highest
(18.5) in case of Himachal Pradesh, followed by Haryana (18.2) and Punjab recorded the least
decline(16.4) among these three states. The decline from 1971-2006 in all these three states is
above the all India level (13.4).
8

3.3 Page 23

▲back to top


Key Note-I
As per SRS, 2006 the GFR for India is 93.3.The corresponding figures for Punjab, Haryana and
Himachal Pradesh are 68.9,94.1 and 67.5 respectively.
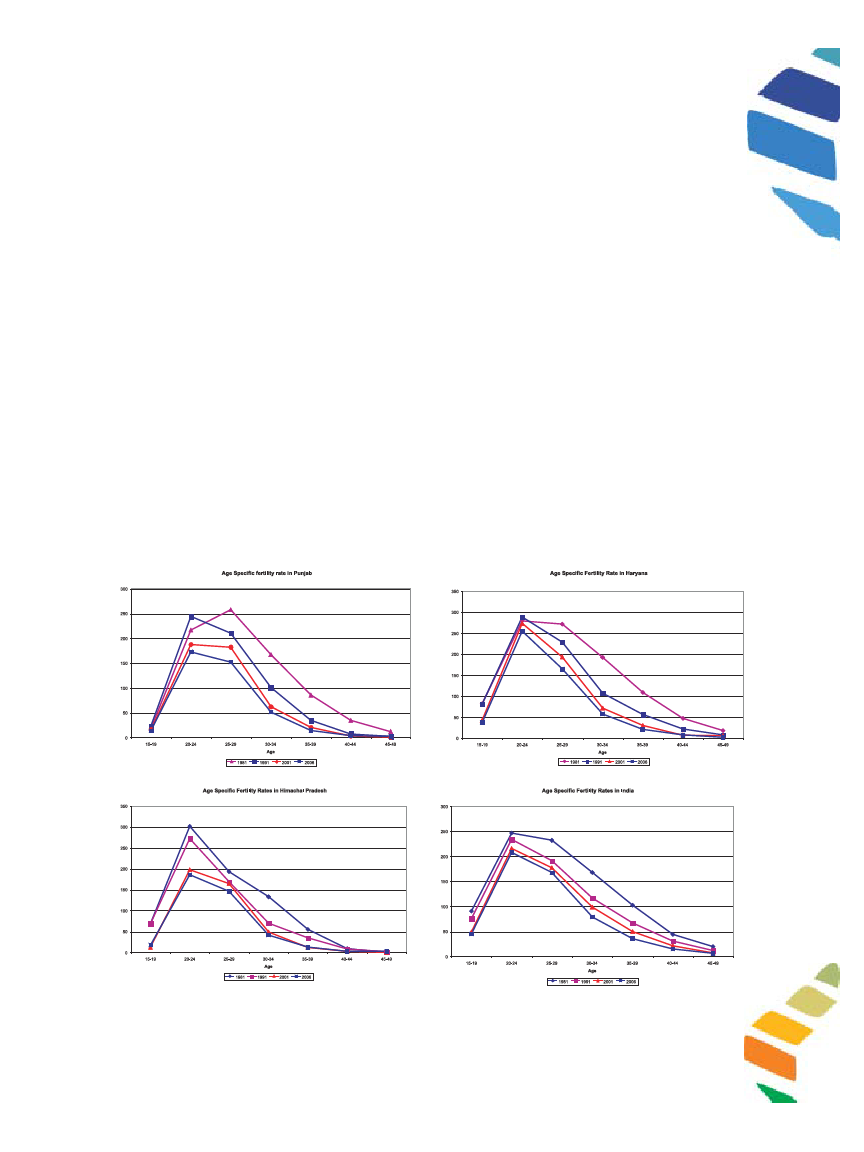
Age Pattern of Fertility:
The age pattern of childbearing in these states has undergone a change during twentieth century,
with fertility limitations being increasingly common at relatively old ages. Though fall in fertility
has been observed among women in all ages between 1981 and 2006.In case of Himachal
Pradesh, the contribution to fertility decline has mostly from women in very early age (15-19) as
well as late reproductive years (35-39).In case of Punjab and Haryana the contribution is much
more in the late reproductive years (40-44) and (45-49). Overall, during the past 13 years, since
NFHS-1(1992-93), there has been continuous fertility decline among the five states (Punjab,
Maharashtra, Chhatisgarh, Gujarat, and Orissa). The trend in between three successive National
Family Health Surveys suggests a clear slowdown in fertility decline in the seven years between
NFHS-2 and NFHS-3 compared with earlier period between NFHS-1 and NFHS-2. This slowdown
in fertility decline is mainly due to plateauing of fertility in rural areas. Three Successive rounds of
National Family and Health Survey (NFHS), recording a rapid fall in fertility in Punjab and Himachal
Pradesh during the nineties and early twentieth century. The fall in fertility in Himachal Pradesh
during the 1990s , higher than the national decline, also document lesser contribution by younger
women (15-29) than by older women(30-44) to overall decline in fertility. Both SRS and NFHS
report almost no childbearing among women in age group 45-49 in Himachal Pradesh. Punjab
have reached the replacement level of fertility, i e, around two children per woman. The urban
areas of the state of Punjab have reached below replacement level fertility
9

3.4 Page 24

▲back to top


Key Note-I
The age specific fertility rate (ASFR), for the three states shows that the greatest fall in fertility
occurred after 29 years of age. This may be because of fertility regulation with in marriage through
the adoption of contraception.
Levels and Trends:
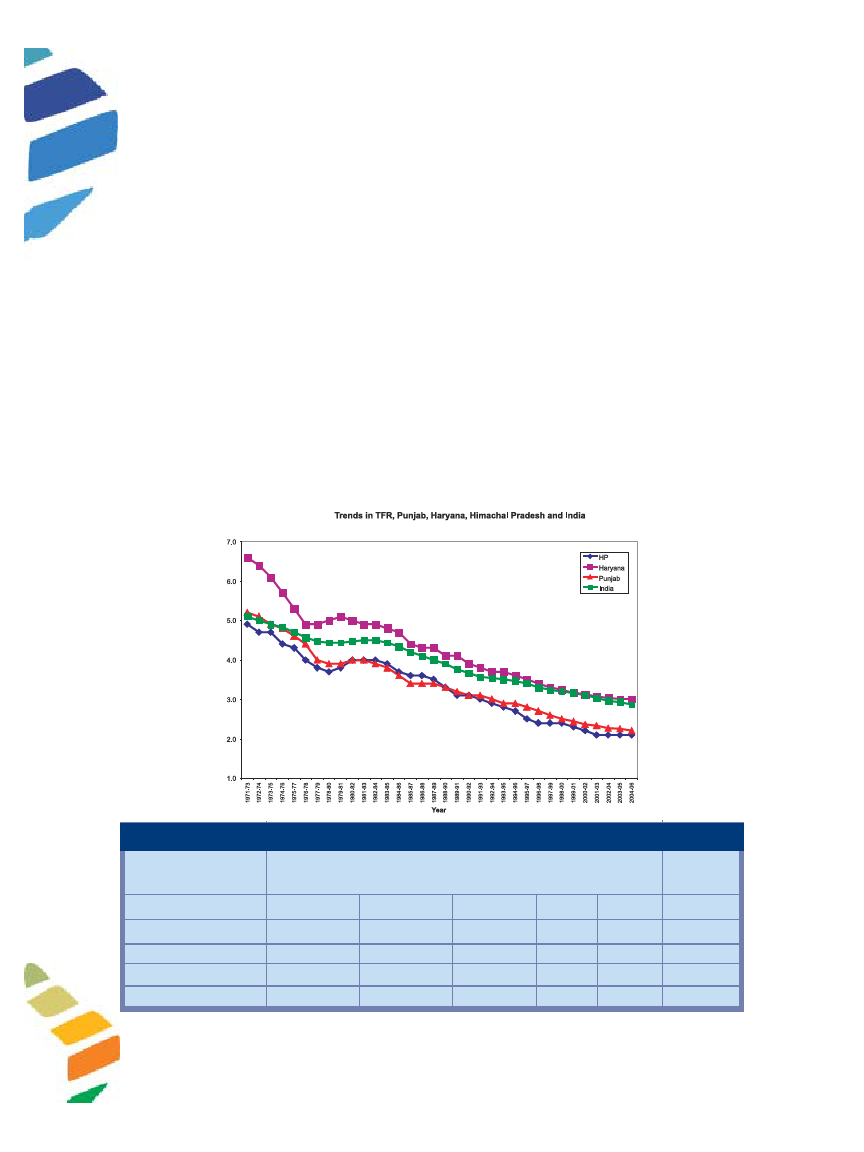
Fertility has been consistently declining in these three north western states as indicated by trends
in total fertility rate (TFR) since the beginning of the 1970s for the major Indian states (Table).
Though the Southern states are ahead in fertility transition and have total fertility rates lower than
the northern counterparts, Himachal Pradesh is an example that blurs this north-south divide. The
pace of fertility decline is very fast in Himachal Pradesh as compared to the other states like
Punjab and Haryana. The Total Fertility Rate (TFR) remains a concern for the state of Haryana
among these three states. The decline in fertility in case of Himachal Pradesh accentuated in the
1980 s as compared to the 1970s, and remained consistent till the end of the 1990s.Substantial
fertility decline in Himachal Pradesh and Punjab despite some of the key social indicators such as
son preference, gender inequality, socio-economic backwardness and relatively higher infant
mortality rate is mainly due to the effective implementation of the family welfare programme,
female literacy, health care delivery and economic prosperity of the households. The rural-urban
fertility differential shows that in the two states of Punjab and Himachal Pradesh, the urban fertility
declined too much and it attained below replacement level fertility resulting further decline in
fertility. In Haryana the urban fertility reached near replacement level, but the fertility in rural areas
still above replacement level (NFHS-3, 2005-06).
State
Table-6: Fertility Decline
TFR
Punjab
Haryana
HP
India
1971
5.2
6.7
5.2
5.2
Source: SRS, Registrar General, India
1981
4.0
5.0
3.8
4.5
1991
3.1
4.0
3.1
3.6
2001
2.4
3.1
2.2
3.1
Decline
2006
2.1
2.7
2.0
2.8
1971-2006
3.1
4.0
3.2
2.4
10

3.5 Page 25

▲back to top


Key Note-I
Place of Residence
Total
Rural
Urban
Total
Rural
Urban
Total
Rural
Urban
Source: NFHS
Table-7: Fertility by Residence and State
Punjab
2.92
3.09
2.48
2.21
2.42
1.79
1.99
2.06
1.88
Haryana
NFHS-1(1992-93)
3.99
4.32
3.14
NFHS-2(1998-99)
2.88
3.13
2.24
NFHS-3 (2005-06)
2.69
2.92
2.17
Himachal Pradesh
2.97
3.07
2.03
2.14
2.18
1.74
1.94
1.98
1.57
India
3.39
3.67
2.70
2.85
3.07
2.27
2.68
2.98
2.06
Replacement Level of Fertility:
With the advent of fertility decline in the North Western states, it is an opportune moment to look
around the replacement level fertility in these states. Since achievement of replacement-level fertility
is crucial for the long-term objective of ‘Stable population’ by 2045 in India and the medium term
objective of reducing the Total Fertility Rate (TFR) to replacement level by 2010, as laid down in
the National Population Policy 2000(NPP), it is the need of the hour to examine the position of
these three states in relation to the national target of fertility decline. As per the RGI projections
Punjab (2006) and Himachal Pradesh (2002) reached the replacement level of fertility. Haryana is
yet to achieve replacement level fertility. As per the projection Haryana will achieve the same by
the year 2012.While the country as a whole will achieve the replacement level fertility also by
2015.In this regard there is a need to examine the rural-urban differential in fertility for Haryana.
As majority of the population still lives in rural set up, the prospects of population stabilization in
near future depends on the success of the efforts in rural areas. In all these states there is a decline
in percentage share of unwanted fertility rate to total fertility rate in between the two successive
National Family Health Surveys. Still in these states more than 20 percent of fertility are unwanted
which can have averted to have an impact on the Total Fertility Rate (TFR)
Table-8: Wanted and Un-wanted Fertility in Punjab, Haryana and Himachal Pradesh
State
NFHS-3 (2005-06)
NFHS-2 (1998-99)
India
Haryana
HP
Punjab
1.9
2.7
0.8
30
2.1
2.9
0.7
25
2.1
2.7
0.6
22
2.1
2.9
0.8
27
1.5
1.9
0.4
21
1.6
2.2
0.7
30
1.5
2
0.5
25
1.5
2.1
0.6
30
Source: NFHS
11

3.6 Page 26

▲back to top


Key Note-I
Proximate Determinants of Fertility:
The important among the proximate variables which can be relatively easily measured in surveys
are marriage, use of contraception, breastfeeding and use of abortion. Various policy interventions
have attempted to influence these factors. The minimum legal age for marriage in women is 18
years in India. India’s family planning programme that was launched in the early 1950s has made
contraceptive methods widely and freely available through health facilities. Data available from
the two National Family Health Surveys conducted in the 1990s enable to estimate the contribution
of these variables in the overall total fertility and although the interval between the two surveys
was only a little over six years, the changes in the share of each of the variables over this period is
also captured (Visaria,1999).
Marriage:
Higher age at marriage and large proportion of women remaining single have some effect on
depressing fertility compared to low age at marriage and marriage being universal for women. The
available data from NFHS-2 (1998-99) indicate that in Punjab the median age at marriage of women
is highest (20) followed by Himachal Pradesh(18.6) and Haryana being lowest (16.9). Among
these three states Haryana has the highest proportion of females, 2.6 percent, who are married
before reaching legal age at marriage. Lowest is in Himachal Pradesh 0.9 percent, followed by
Punjab 1.8 percent (RGI, 2008).
Distribution of districts by mean age at marriage shows that, out of total 19 districts in Haryana, in
9 districts female mean age at marriage is found below the legal age at marriage. Out of these 9
districts in case of three districts it ranges in between 16 years to 16.9 years (RGI, 2008).
Other things being equal, this would imply that women in Haryana stay in marriage for longer
period since they enter marriage early and thereby are exposed to greater risk of pregnancy resulting
in high fertility compared to women in Punjab and Himachal Pradesh. This is very much reflected
in the total fertility of these states as Haryana is yet to achieve replacement level of fertility where
as Himachal Pradesh and Punjab have already achieved the same. As per the NFHS-3, about 41
percent of women (18-29 years) and 28 percent of men (21-29 years) marry before reaching the
legal age at marriage in Haryana. The corresponding figures for Himachal Pradesh is 14 percent
and 10 percent while in case of Punjab are 22 percent and 25 percent respectively.
Post-Partum Amenorrhea:
In India breastfeeding is prolonged (around 25 months) and the estimated duration of breastfeeding
does not vary much. Longer duration of breastfeeding extends the period of postpartum amenorrhea
thereby increasing the inter-birth interval. The median duration of breastfeeding is at least 20
months in these three states. The median duration of exclusive breastfeeding is lower in Punjab
and Himachal Pradesh. But, it is higher in case of Haryana.
Abortion:
Induced abortion has been legal in India since 1972.But no reliable estimates of the number of
abortions exist, in part because many women attend private clinics for this service. The incidence
of induced abortion reported in demographic surveys is under reported. According to NFHS and
other survey data only 1 or 2 percent of all pregnancies end in an induced abortion. But, some
micro level studies suggest that the figure in some parts of the country may be as high as 9 to 14
percent (Ganatra et al. 2001). It is likely that the current incidence of abortion is high and on the
increase, especially in the South, but data deficiencies mean that it is difficult to assess the influence
of induced abortion on fertility trends.
Contraception:
The fertility transition has been achieved overwhelmingly through increase in the use of modern
contraceptive methods, primarily female sterilization in these three states. The Contraceptive
12

3.7 Page 27

▲back to top


Key Note-I
Prevalence Rate (CPR) in these three states ranged in between 73 percent in Himachal Pradesh
and low of 63 percent both in Punjab and Haryana as per the NFHS-3(2005-06).The unmet need
for contraception has registered an increasing trend in case of Haryana in between the last two
National Family Health Surveys (7.6 to 8.3).In order to achieve replacement level fertility the
unmet need for contraception is to be met. Which will have substantial impact on reducing the un-
wanted fertility in Haryana.
Table-9: Contraceptive Prevalence Rate (CPR) and Unmet need for Contraception in Punjab,
Haryana, Himachal Pradesh and India
NFHS-III (2005-06)
State/Country
Contraceptive Prevalence
Rate (CPR)-Any Method
Contraceptive Prevalence
Rate (CPR)- Any modern method
Punjab
63.3
56.1
Haryana
63.4
58.3
HP
72.6
71.0
India
56.3
48.5
NFHS-II (1998-99)
Punjab
66.7
53.8
Haryana
62.4
53.2
HP
67.7
60.8
India
48.2
42.8
NFHS-I (1992-93)
Punjab
58.7
51.3
Haryana
49.7
44.4
HP
58.4
54.4
India
40.7
36.5
Source: NFHS
Unmet Needs:
Table-10: Unmet needs for Contraception
NFHS-III (2005-06)
State/Country
Spacing
Limiting
Unmet Need for Contraception
Punjab
2.6
4.7
7.3
Haryana
3.1
5.2
8.3
HP
2.4
4.9
7.2
India
6.2
6.6
12.8
13

3.8 Page 28

▲back to top


Key Note-I
NFHS-II (1998-99)
Punjab
2.8
4.5
7.3
Haryana
2.9
4.7
7.6
HP
3.6
4.9
8.6
India
8.3
7.5
15.8
NFHS-I (1992-93)
Punjab
6.5
6.5
13.0
Haryana
8.8
7.6
16.4
HP
9.2
5.6
14.9
India
11.0
8.5
19.5
Source: NFHS
Age at First Conception:
Table-11: Median age at first birth for women aged 25-49 years
States/Country
NFHS-1
NFHS-2
NFHS-3
Punjab
21
21.5
21.4
Haryana
19.8
20.1
20.3
HP
20.0
20.5
21.2
India
19.4
19.3
19.8
Source: NFHS
The age at which women start childbearing is an important demographic determinant of fertility.
A higher median age at first birth is an indicator of lower fertility. The table shows the median age
at first birth for the three north-western states. There is a consistent increase in median age at first
birth for Haryana and Himachal Pradesh. There is also rural-urban differential in median age at
first birth. The urban areas recorded higher median age at first birth than the rural areas.
As a result of socio-economic development and family planning interventions, the country recorded
a significant decline in fertility, fairly widespread across the different regions in the post-
independence era. Yet regional variations have played a significant role in the onset and speed of
fertility transition in the country. The states in the North- Western region such as Himachal
Pradesh, Punjab and Haryana has undergone through substantial transformation in its fertility
trend.
Punjab too experienced fertility decline from relatively early on; economic development seems to
have been an important factor. From the late 1960s, Punjab prospered from the Green Revolution
in agriculture. This supported the rise of a flourishing industrial sector, and average incomes in the
state rose significantly. Fertility was reduced even though levels of female literacy were low, levels
of child mortality were relatively high, and there was a very strong degree of son preference (Das
Gupta 1995).
There is a positive relationship between levels of fertility and levels of son preference (Arnold and
Roy 2002).It is evident from the NFHS-2 data that in the populous northern states of Bihar, Rajasthan
14

3.9 Page 29

▲back to top


Key Note-I
and Uttar Pradesh, roughly half of all ever-married women reported that they wanted more sons
than daughters. In contrast in the Southern states the extent of son preference is very much less. In
Tamil Nadu, for example less than 10 percent of women revealed any partiality for having sons.
An analysis of NFHS data collected during the 1990s concluded that levels of son preference were
declining. This was true even for northern and western states like Punjab and Gujarat (Lahiri and
Dutta 2002). The percentage of women who want more sons than daughters were increased in the
state of Haryana in between the two successive National Family and Health Surveys. Which
shows among these states, Haryana is having strong sense of son preference, which results in
neglected attitude towards girl child. Furthermore the experience of Punjab shows that fertility can
fall despite high levels of son preference. Thus the association in between these two should not be
used to make dynamic inferences regarding the prospects of further fertility decline. More over it
seems probable that even in the major states, fertility decline will eventually help to generate a
more balanced view of the desirability of having daughters, a development which itself should
facilitate continuing fertility decline. However some researcher have argued that with fertility
decline the level of son preference may increase (Das Gupta and Bhat 1998).
Why the big birth reduction campaign put on jointly by the Indian Government and the Rockfeller
Foundation in an Indian village in Punjab failed so dismally. It is a study of one village in what was
called the ‘Khanna Study’ (Wyon and Gordon, 1953-60). The message is very simple-nobody will
restrict his family unless it pays to do so- and the brutal truth is that, especially for the poor in
circumstances where some emigration is possible, big families do pay. The blind assumption of
the population controllers-that all one has to do is to put on a big educational campaign and
persuade the villagers to use birth control –neglects completely the realities, both of the class
structure and of the payoff structure. The author shows convincingly that almost the only present
hope of a rise in status of the lower-class people in the village is to have a big family of sons,
who could either work in land for parents and so develop savings with which to acquire more
land or migrate to the city and send back emigrant’s remittances. This is some what the which the
population control people have overlooked completely (Mamdani, 1973).
Mortality transition:
Among the components of population change, mortality has historically played an important role
in determining the growth of population. During the first and second stage of demographic transition,
it is mortality, which starts declining first, initially slowly and then rapidly, contributing to a gradually
rising rate of population growth as fertility decline generally starts with a time lag. Reduction in
overall mortality is an important objective of planning since the first five-year plan.
The National Population Policy 2000 (NPP, 2000), National Health Policy 2002 (NHP, 2002),
RCH-2 (2005) and National Rural Health Mission (NRHM, 2005) have simultaneously reinforced
the need of reduction in mortality particularly maternal and infant (including neonatal) mortality.
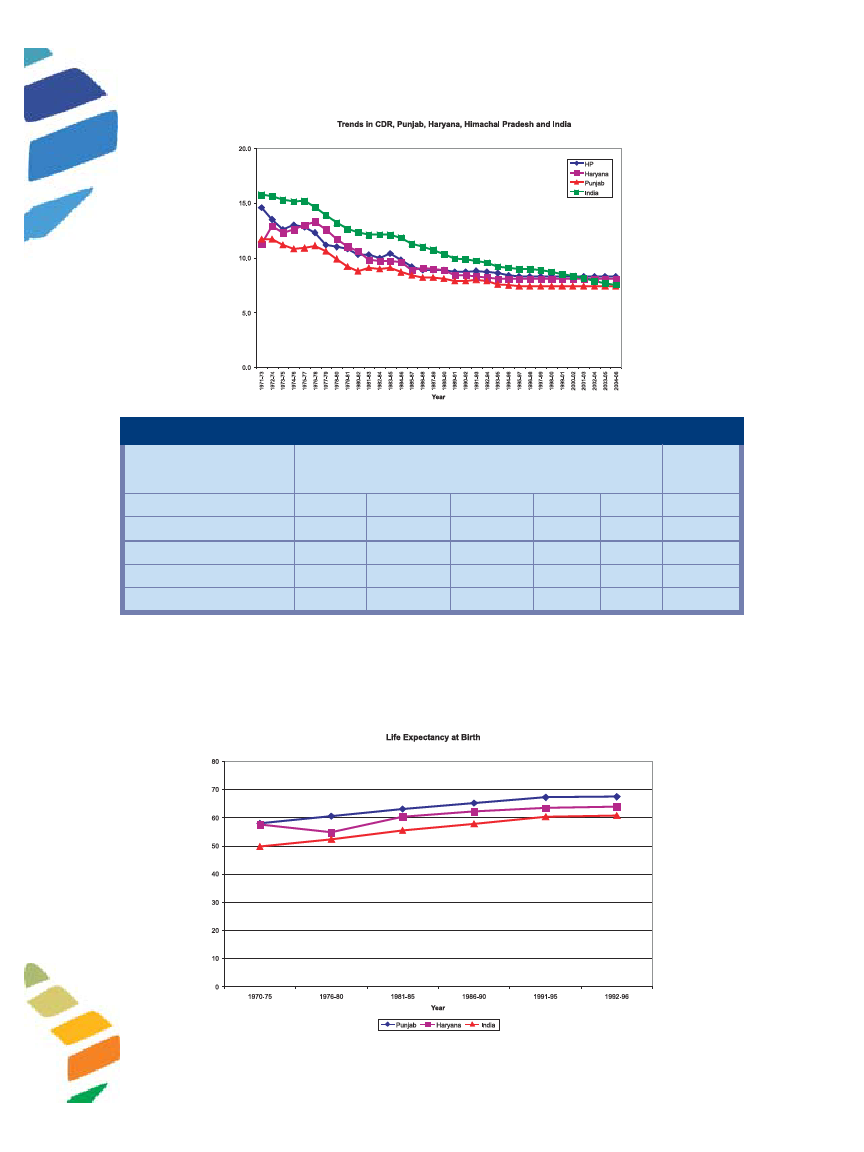
Crude Death Rate (CDR):
In the last thirty five years, the CDR at all India level declined from 14.9 in 1971 to 8.4 in 2006,
i.e., 6.5 points decline during the period 1971-2006.Similarly, CDR for Himachal Pradesh, Punjab
and Haryana declined from 15.6, 10.4, 9.9 in 1971 to 7.1,7.0 and 7.6 in 2006 i.e., 8.5 ponits
decline, 3.4 points decline and 2.3 points decline in Himachal Pradesh, Punjab and Haryana
respectively. As seen from the table that the declining trend in CDR has been fairly steady in all
the three states. However, the decline in CDR in Haryana is relatively less compared to both
Himachal Pradesh and Punjab. In fact the decline in Himachal Pradesh is the highest.
15

3.10 Page 30

▲back to top


Key Note-I
Table-11: Crude Death Rate (CDR) in Punjab, Haryana and Himachal Pradesh
Crude Death Rate(CDR)
Decline
State
Punjab
Haryana
HP
India
1971
10.4
9.9
15.6
14.9
1981
9.4
11.3
11.1
12.5
1991
7.8
8.2
8.9
9.8
2001
6.8
6.5
6.8
7.5
2006 1971-2006
7.0
3.4
7.6
2.3
7.1
8.5
8.4
6.5
Source: SRS
The reduction in mortality is an integral part of demographic transition in these states and immensely
contributed to increase in life expectancy at birth.
Life expectancy at birth in Punjab, Haryana and Himachal Pradesh, 2006
16

4 Pages 31-40

▲back to top


4.1 Page 31

▲back to top


Key Note-I
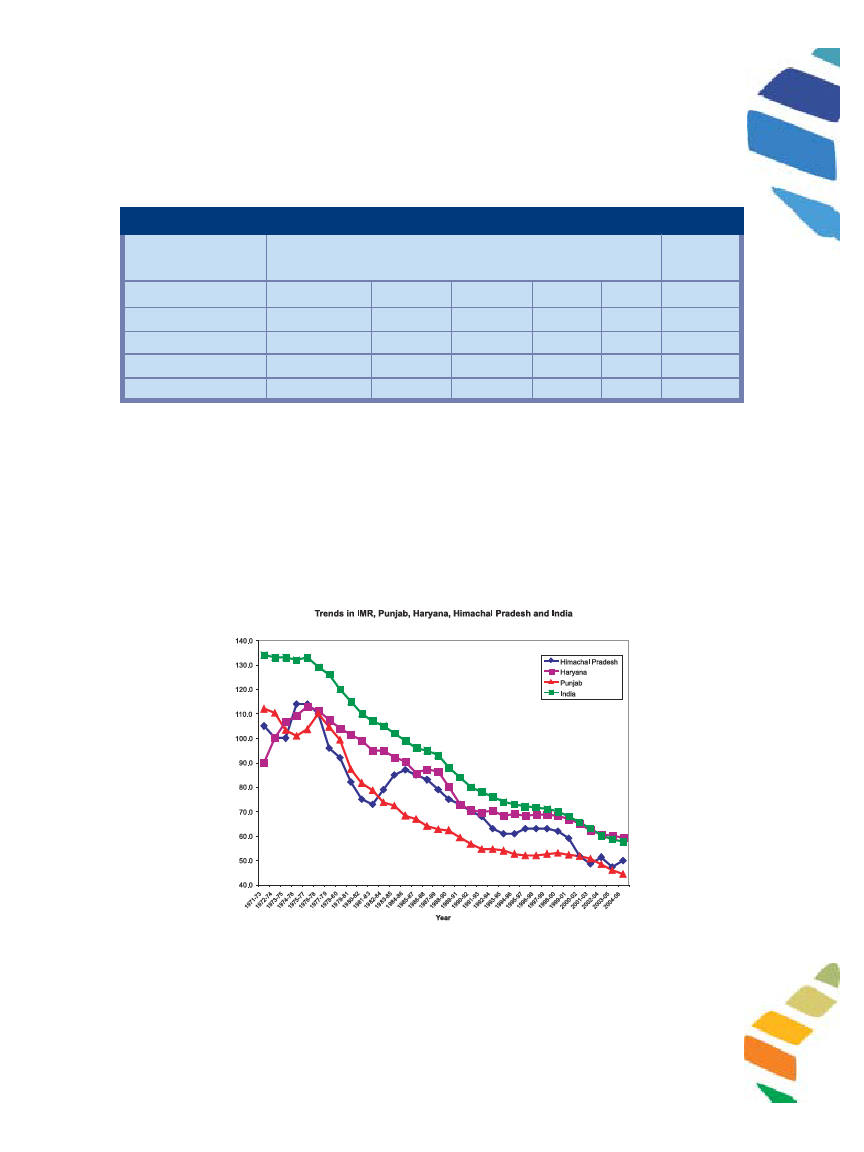
Infant Mortality Rate (IMR):
Infant Mortality Rate (IMR) is considered to be one of the most sensitive indicators of health and
development, the table below presents the data for IMR for Punjab, Haryana and Himachal Pradesh
and India for the period 1971-2006.
Table-12: Infant Mortality Rate (IMR)
Infant Mortality Rate (IMR)
Decline
State
Punjab
Haryana
HP
India
1971
102
72
113
129
1981
81
101
71
110
1991
53
68
75
73
2001
52
66
43
66
2006 1971-2006
44
58
57
15
50
63
57
72
Source: SRS
As seen from the table during the decade 1971-81 IMR declined dramatically from 102 to 81 in
Punjab,113-71 in Himachal Pradesh and 129-110 at the National Level, However it is frustrating
to note that during this period in Haryana IMR increased dramatically from 72 in 1971 to 101 in
1981, the other two states in the country which also registered a similar increase during 1971-81
were Madhya Pradesh(135-142) and Orissa(127-135).However during the decade 1981-91 Haryana
showed a dramatic decline in IMR from 101 to 68.In short IMR at all India level during the period
1971-2006 declined from 129 to 57. Similarly, the decline in Punjab was 102 to 44, Himachal
Pradesh 113 to 50 and in Haryana from 72 to 57 during the period 1971-2006.The percent decline
in IMR was found to be lowest in Haryana.
In early 1970s except the state of Haryana a declining trend in IMR was observed for Punjab and
Himachal Pradesh. This decline may be attributed to advancements made in the field of medicine,
improvements in public health, availability of immunization services and the general improvement
in the living conditions. The pace of decine somewhat slowed during late seventies in Punjab.
Again the decline picked momentum in the eighties. The pace of mortality decline is very fast in
17

4.2 Page 32

▲back to top


Key Note-I
Punjab as compared to the other two states. In case of Himachal Pradesh the pace mortality
decline stagnated in early seventies, eighties and mid nineties as there was no reduction in
mortality trends. As there was an increase in neo-natal mortality during these periods.
Among the three north-western states, the Infant Mortality Rate (IMR) is highest (45) in Himachal
Pradesh followed by Punjab(43) and Haryana(40).There is rural-urban diffential in IMR among
these states. However, the level of IMR is below the national average (54) in these states. In the
state of Himachal Pradesh, two districts are having IMR more than the country(PFI,2008).
Nutritional Status:
The table below presents data on the nutritional status of children in the three north western states
of Punjab, Haryana, Himachal Pradesh and India. The proportion of children who are stunted
decreased steadily in between NFHS-2 to NFHS-3,where as proportion of underweight children
increased in Haryana from 34.6 to 39.6.In case of stunting the there is substantial increase was
found in Haryana(5.3 to 19.1) in between the NFHS-2 and NFHS-3.
Table-13: Nutritional Status of Children
- Weight-for-age(underweight)
State/Country
Under-Weight(Weight-for-age) Children
NFHS-I(1992-93)
NFHS-II(1998-99)
NFHS-III(2005-06)
Punjab
46.0
Haryana
34.6
HP
43.7
India
51.5
28.7
24.9
34.6
39.6
43.6
36.5
47.0
42.5
Source: National Family Health Survey
- Height-for-age(stunting)
State/CountryStunting(Height-for-age) Children
NFHS-I (1992-93)
NFHS-II (1998-99)
NFHS-III (2005-06)
Punjab
38.0
39.2
36.7
Haryana
42.9
50.0
45.7
Himachal Pradesh
NA
41.3
38.6
India
NA
45.5
48.0
Source: National Family Health Survey
- Weight-for-height (wasting)
State/Country
Wasting(Weight-for-height) Children
NFHS-I(1992-93)
NFHS-II(1998-99)
NFHS-III(2005-06)
Punjab
21.1
7.1
9.2
Haryana
5.7
5.3
19.1
hp
NA
16.9
19.3
India
NA
15.5
19.8
Source: National Family Health Survey
18

4.3 Page 33

▲back to top


Key Note-I
Anaemia among Children and Women:
Table-14: Prevalence of anaemia among children (6-59 months) and women (15-49 years)
State/Country
Any Anaemia(Children)
Any Anaemia(Women)
Punjab
66.4
38.0
Haryana
72.3
56.1
HP
54.7
43.3
India
69.5
55.3
Source: NFHS-3 (2005-06)
The Anaemia level for women (56.1 percent) and children (72.3 percent) in case of Haryana is
highest among these three states (56.1 percent), which is above the national average (55.3 percent
and 69.5 percent).
Summing Up:
To sum up on fertility reduction front Himachal Pradesh and Punjab have achieved replacement
level of fertility. Therefore the declining fertility along with increasing life expectancy is going to be
a major challenge. The other demographic effect will be reduction in population growth in these
two states resulting in changes in the age structure of the population. These changes however are
not immediate As a result of demographic transition the first impact is often observed in the age
pyramid. The decline in mortality rate would result in increased longevity of the people. Further
decline in fertility would result less number of people in young ages. This would result in high
proportion of old age people. This phenomenon is known as population ageing. Among these
three states Himachal Pradesh and Punjab have already started to experience this phenomena.
The state machinery needs to be prepared to take care of rising elderly population and its associated
socio-economic problems. The proportion of working age population will also increase manifold,
and this has major implications for the economic growth and standard of living of the people.
There is a significant demographic transition accruing in these three states; to hasten this requires
investments in health, education, food, and employment. What is clearly not required are counter
productive punitive measures. Also, given the age structure of the population there is an inbuilt
momentum which cohesive measures can do nothing about.
It is evident that in spite of declining mortality and changing morbidity patterns, the states of
Haryana, Punjab and Himachal Pradesh still have the unfinished agenda of combating traditional
infectious diseases and relatively high maternal, peri-natal and neo-natal disorders including
nutritional deficiencies which continue to contribute to a heavy disease burden and take a sizeable
toll. Along with these, these states have to deal with the “emerging agenda” which includes chronic
and newer diseases induced by changing age structure, changing life style, the emergence of HIV/
AIDS and those related to tobacco use, environmental pollution and drug abuse including alcohol.
Thus these states are experiencing the “changing epidemiology of double or dual burden of disease
”We have not dealt deliberately on the issue of health and epidemiological transition in these
states as this topic will be discussed in detail in a separate paper.
2. Population Stabilization: Issues and Challenges
“The myth of overpopulation is destructive because it prevents constructive thinking and action
on reproductive issues. Instead of clarifying our understanding of these issues, it obfuscates our
vision and limits our ability to see the real problems and final workable solutions. Worst of all,
it breeds racism and turns women’s bodies into a political battlefield. It is philosophy based on
fear, not on understanding”.
19

4.4 Page 34

▲back to top


Key Note-I
- Betsy Hartmann, Reproductive Rights and Wrong: The Global Politics of Population Control
(From Sanjam Ahluwalia; Reproductive Restraints : Birth Control in India, 1877-1947, Year 2008)
There are a number of myths and misconceptions surrounding population issues especially about
population stabilization and population explosion.
We would try to explode some of the misconceptions and demystify some of the myths on these
issues.
Population Stabilization is not merely about numbers. It is true that prior to 1994 (ICPD, Cairo)
population had primarily been seen as an issue of numbers. In order to understand the issue of
population in a correct perspective let us have a quick look at the history of population debate
spanning over last five decades.
From the mid 1950s onwards, as a result of rapid fall in death rates there was an unprecedented
high level of natural growth. It was this concern of “excessive demographic increase” and its
social, economic and perhaps geo-political ramifications that impelled and triggered the international
community to focus on slowing down population growth by implementing what was then called
Population Control” or “Family Planning Programmes”. This was perhaps a spontaneous and
logical response then on the part of international community trying to curb the increase in number
from a “purely quantitative perspective” (Ali, 2002).
This panic like Neo-Malthusian environment/situation continued in the 1960s, 1970s and throughout
1980s. Even in 1987 July 11th, when the world’s population crossed five billion mark, the alarm
then was the rapidly increasing number and it was this concern which led to the observance of
World Population Day. The thought on Population was primarily concerned with numbers.
Increasing numbers were looked at with fright. It was this fear that formed the central/ core idea of
the Population Programmes those days. The focus was mostly on “Population” not “People”. These
programmes did not look at “Human Development” as the need of the hour, but instead looked at
Women” whose fertility needed to be controlled. The word “Control” best represented the situation
(Ali, 2002).
It is only since 1994, after the International Conference on Population and Development (ICPD) at
Cario, Egypt, that there has been a dramatic change in thinking on population issues. In fact ICPD
was a Watershed in the history of thinking on population issues.
The ICPD brought about a paradigm shift from the previous emphasis on Demography and Population
Control to Sustainable Development and Reproductive Rights. It became clear that population
was no longer about numbers, figures and statistics but about people and improving their quality
of life. That for such a quality development to occur population programmes, should be development
oriented, human rights based, inclusive and participatory and should involve people of concern in
the whole process of defining problems, deriving strategies, implementing programmes and
evaluating outcome. It was also agreed that no force, no coercion, no targets imposed from above,
no incentives and disincentives are required. Incentives and disincentives at the face of it looks as
if they are harmless but, ultimately tend to be coercive and are in fact counter productive. Coercion
infringes upon human rights and inhibits human development. The ICPD Programme of Action
(PoA) placed “individuals” in the center of development with a focus on building pillars of “Human
Development Rights Human”, Gender Equity and Equality (Ali, 2002).
Total Fertility Rate (TFR) and Contraceptive Prevalence Rate (CPR) were used to be the fixation of
most population programmes as they also served as indicators of success. ICPD replaced them
with quality of care, informed choice, gender factor, women’s empowerment and accessibility to
a whole gamut of reproductive health services.
20

4.5 Page 35

▲back to top


Key Note-I
Exploding the Myth of Population Explosion
The important question that demands an answer is : Is India or the North Western States in particular
are currently going through a “Population Explosion”? This question admits of the simple answer
- definitely NOT. India witnessed a phase of rapid growth in population from 1951 to 1981,
similar was also in the case of North Western States namely Punjab, Haryana and Himachal
Pradesh.
Population Growth Trends from 1951-2001 - India and North Western States
(.e Punjab, Haryana and Himachal Pradesh)
Years
1901-1951
India
N W states
1951-1961
India
N W states
1961-1971
India
N W states
1971-1981
India
N W states
1981-1991
India
N W states
1991-2001
India
N W states
Total
Population
(in crores)
23-36
1.4-1.7
36-44
1.7-2.1
44-55
2.1-2.7
55-68
2.7-3.4
68-84
3.4-4.2
84-102
4.1-5.1
Absolute
increase
(in crores)
13
0.3
8
0.4
11
0.6
13
0.7
16
0.8
18
1
Decadal
Growth
Rate
-
-
21.6
25.1
24.8
25.6
24.6
25.7
23.9
23.3
21.3
23.0
Average
Annual
Exponential
Growth Rate
-
-
1.96
2.23
2.22
2.27
2.20
2.28
2.14
2.09
1.93
2.04
Phase of
Demographic
Transition
Near stagnant population
High growth
Rapid High Growth
Rapid High Growth
High growth with definite
signs of fertility decline
High growth with definite
signs of fertility decline
Source : Computed from Census Figures
It will be seen from the above table that the total population of India which was little over 36
crores in 1951 grew to about 44 crores in 1961 and to about 55 crores in 1971. The total population
of the north western states which was 1.4 crores in 1951 grew to about 1.7 crores in 1961 and to
about 2.1 crores in 1971. During the decade 1951-61 absolute increase in population in India
was about 8 crores, the decadal growth rate was 21.6 per cent and average annual exponential
growth rate was 1.96. Similarly during the decade 1951-61 absolute increase in population in
Punjab, Haryana, and Himcahal Pradesh (at that time erstwhile Punjab) was about 0.4 crores, the
decadal growth rate was 25.1 per cent and average annual exponential growth rate was (2.23. The
period between1961-71 recorded the highest ever-decadal growth rate of 24.8 per cent in case of
India while 1971-81 was the period where the highest ever decadal growth rate was recorded in
the North Western States i.e 25.7 percent. Average Exponential Growth Rate in case of India was
also highest during the decade 1961-71, which was 2.22 with an absolute increase of about 11
crores. The period between 1971 and 1981 recorded a marginal decrease in decadal growth rate
from 24.8 per cent in 1961-71 to 24.6 while in case of North Western State there was a marginal
increase in the decadal growth rate from 25.6 to 25.7. The decadal growth rate started declining
steadily from 1981 onwards from 24.6 per cent in 1971-81 to 23.9 per cent in 1981-91 to 21.3
percent in 1991-2001 in case of India, while in case of north western states it declined from 25.7
in 1971-81 to 23.3 during 1981-91 and to a minimum of 23.0 in 1991-2001. In fact, India’s as well
as the north western state’s population growth rate has been declining steadily over the last two
decades since 1981 as will be seen from table above.
21

4.6 Page 36

▲back to top


Key Note-I
The decadal growth rate during 1991-01 represents the sharpest decline since Independence (even
less than +21.6 per cent during 1951-61) in case of India. So is also in the case of the north
western states i.e +23.0 percent in the last decade (1901).
The average Annual Exponential Growth rate is also declining, that is, 1971-81: 2.20 per cent;
1981-91:2.14 per cent; 1991-2001: 1.93 per cent.
In fact, this indicator is also the lowest since Independence (even less than 1.96, during 1951-61).
Fertility has also declined. Total Fertility Rate (TFR), has come down from 6 (six) in 1951 to 3
(three) in 2001 and 2.8 in 2006, in case of India. Similar is also in the case of north western
states. Now couples have fewer children and opt for smaller families.
For the first time in the 2001 Census, the proportion of children under four years has also
come down - a clear indication of the fertility decline.
If this is the case, why is the overall population growth in India as well as in the north western
states are still apparently high?.
Population numbers are growing because of what is called “Population Momentum”. Past trends
in fertility and mortality (high fertility and low mortality) from 1951 to 1981, had shaped the
population age structure in such a way that there is a tremendous in-built growth potential which
has resulted in the “bulge” in the proportion of young people in the prime reproductive ages. Even
if this group produces fewer numbers of children (just two or even one) per couple the “quantum
increase” in numbers will be high because the number of reproductive couples is high.
Given the crucial importance of Population Momentum (which in a way assures further population
growth in near future), no matter what we introduce - “two-child” or even “one-child” norm to
pressurize people to go for less than two children/one child may simply be barking up the wrong
tree. This may be neither relevant nor particularly effective in bringing down the absolute number
or the size of population.
Two Child Norm policy of certain State Governments and its probable adverse implications on
child sex ratio :
A “Two Child Norm” has the potential to cause immense harm to women’s health in the existing
social situation where son preference is high and women’s status is low (as in the case of Haryana).
One of the important risks includes increase in sex selective abortion and consequent reduction in
the number of girl children.
To quote Shri Somnath Chatterjee* “When there is a trend of reducing fertility rate, we should
consider very seriously whether punitive measures need at all to be adopted..... Actually such
approaches can become counter productive and are also demographically unnecessary ….. A
vigorous pursuit of the “two child norm” is likely to have most undesirable consequences as it
could degenerate into sex selective abortions. Indeed, it was the recognition of this link that
compelled Chinees Government officially abandon its one child per family norm.
We feel that compulsion to have no more than two children would result in increased female
foeticide. This happened in China when government declared that no couple should have more
than one child. The “One Child Policy” in China appears to have created more societal and family
problems like skewed sex ratio, female infanticide and foeticide, rather than helping in smooth
stabilizion of population. There are thus lessons to be learnt from the Chinese experience in
governance. We tend to misrepresent the Chinese story, whenever we compare the Indian situation
* Ninth JRD Tata Memorial Oration on “Towards Population Stabilization:Role of Good Governance”, PFI, New Delhi, 30th March,
2005.
22

4.7 Page 37

▲back to top


Key Note-I
for advocating coercive policy like “Two Child Norm” and the concomitant regime of incentive
and disincentives to solve our population problem quickly.
The “Two Child Norm” policy of certain state governments which are not in harmony with the
National Population Policy (NPP)** can become an important factor responsible for female foeticide
in these states in future.
Several state governments have formulated their state specific population policies. Unfortunately
enough, most of the state policies reflect the population control mindset viewing population growth
as human crisis and are more forthright in methods of achieving demographic goals and list series
of incentives and disincentives.
Several state government enacted legislation to enforce a two child norm as a general
disqualification clause. This was after the supreme court made mistaken observations in respect of
the two-child norm in Javed v/s State of Haryana. The apex court acted on the presumption that the
two-child norm was incorporated in the National Population Policy (NPP) 2000. Nothing could
be further from the truth.
The two child norm came in by a side wind. Persons who were disqualified from contesting
panchayat elections in Haryana filed a petition in the Supreme Court impugning the constitutionality
of the state notification laying down the norm. In these proceedings, the Union government appears
to have given the apex court the impression that the two-child norm was indeed part of the NPP.
The court relied on an obsolete 1960s Club of Rome framework and characterized “the torrential
increase in the population… as more dangerous than a hydrogen bomb”. It quotes with approval
two obscure writers on the subject who said that “the rate of population growth has not moved on
bit from 1979”. In fact, India has experienced the sharpest fall in decadal growth from 23.81% in
1991 to 21.34% in 2001, the lowest population growth rate since independence.
As already stated many states have enacted legislations that bar women with more than 2 children
from contesting election to PRIs. Introduced with the avowed intention of controlling family size
and stabilizing population growth, the two-child norm has become a cause of anxiety for human
rights activist and women’s organizations. The measure is seen as being implemented in an
environment, where women and the marginalized do not have adequate access to health
infringement of reproductive rights, as they tend to penalize women who anyway have little control
over reproductive decision- making. It has been noticed that this law hits the poor and the backward
section of the society. Till the large unmet needs of those socially backward groups for health and
family welfare services are met, proposing any punitive measures is clearly irrational. Debarring
such women from contesting elections or from public employment opportunities makes a mockery
of policies to empower women. Further it will provide the impetus for sex-selective abortions and
female foeticide, worsening the already deplorable child sex ratio in some parts of our country.
An Exploratory study on Panchayati Raj and Two Child Norm: Implications and Consequences
was taken up by Mahila Chetana Manch in the states of Andhra Pradesh, Haryana, Madhya Pradesh,
Orissa and Rajasthan. This study found that its implementation is discriminatory to women and
disadvantaged sections of the society. The study also found that information on the law has not
been disseminated properly. Most people charged with violating the law found out about its
existence only when they filed their nominations or were sent notices. The study also clearly
revealed that the economically and socially vulnerable sections are most affected by this legislation
which is often misused to settle political scores or prevent the under privileged from getting into
** A running theme of the NPP 2000 is provision of quality health services and supplies and a basket of contraceptive choices. “People
must be free and enable to access quality health care, make informed choice and adopt methods for fertility regulation best suited to
them” - it is in this spirit that the NPP 2000 speaks of the “Small Family Norm”. No where the policy advocates for “Two Child
Norm”. However, it is unfortunate and some times even disturbing to note that while talking about NPP. “Small Family Norm” is
often misinterpreted as “Two Child Norm” (Which has a definite coercive connotation).
23

4.8 Page 38

▲back to top


Key Note-I
positions of power. While the law had had little impact on reproductive choices or in motivating
people to have small families, it has become a tool in the hands of opposing factions to deny
power to a rival and as in all power struggles; it is the marginalized and the poor who have
suffered. It has thus become a source of harassment for the already disadvantaged. The study also
found that there is no evidence that the law has persuaded Panchayat Members to adopt a small
family- or others to follow their example. People do not decide to have fewer children because the
sarpanch has a small family.
In the states where these laws have been imposed scores of cases have been documented where
women have been deserted, or forced to undergo sex selective abortions. Children have also been
abandoned or given up for adoption. In general, such a norm provides an impetus for an increase
in sex-selective abortions worsening an already terrible child sex ratio in the country, worse in
precisely these three states.
The good news is that the “Two Child Norm” in the states of Himachal Pradesh and Haryana have
been withdrawn and it is indeed a wise decision. This was possible due to very intensive advocacy
efforts from the civil society organizations and activists.
The Way Forward…
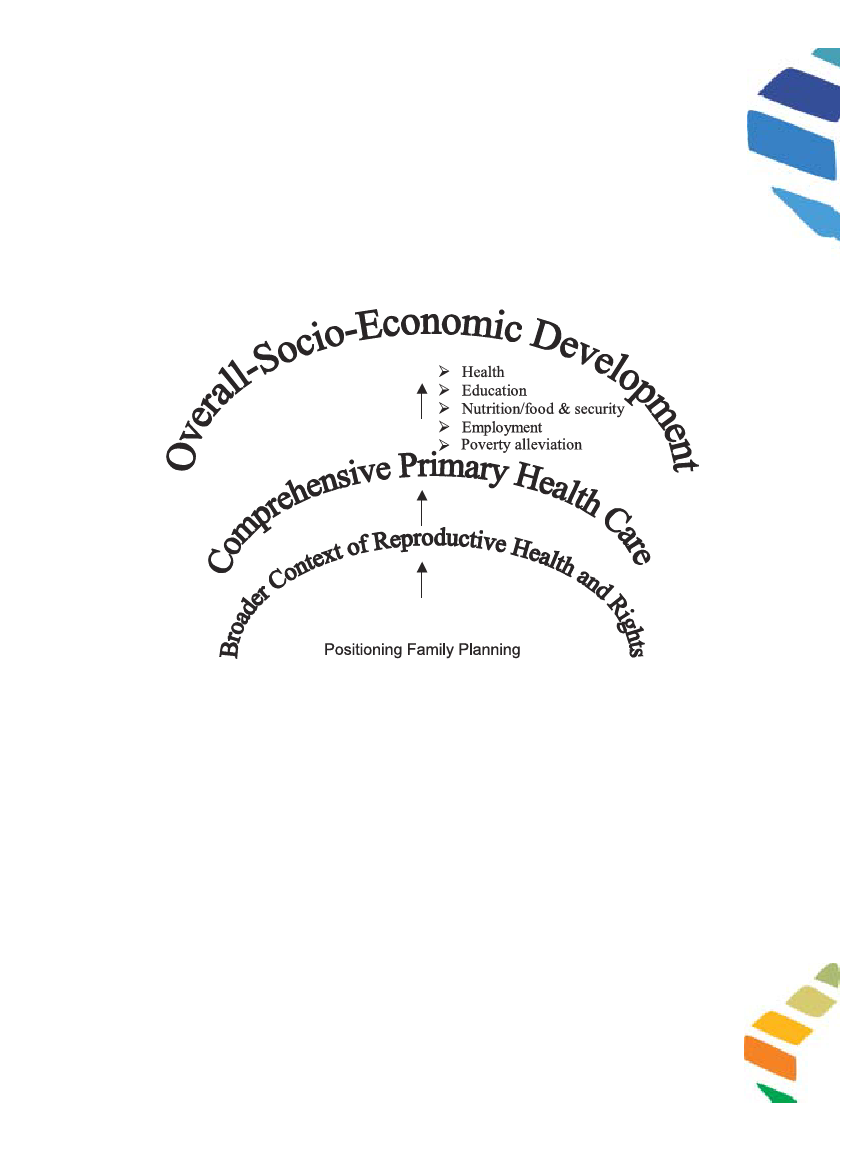
Population stabilization therefore has to be looked in the context of wider socio economic
development. Yes, there exists a linkage between social development, health status and population
stabilization. The issue of population stabilization is not a technical issue with a technical quick-
fix solution. The answer does not lie in pushing sterilizations and chasing targets in the conventional
mode. For population stabilization it is important to improve people’s access, particularly women’s
access, to quality health care. The contraceptive mix needs to be enlarged and expanded. We are
now discovering that the obvious route to population stabilization is through social development,
through women’s empowerment, and through greater gender equality.
The single most important factor that can reduce momentum is raising the age at marriage/
cohabitation and increasing the interval between marriage and first pregnancy specially for girls.
The strongest impact of this can come through increasing years of schooling for girls. Therefore,
population momentum can only be eased out significantly by policies that encourage women to
delay child bearing as this stretches out the time between generations.
Population momentum can also be curtailed, in part, by investing on adolescents with emphasis
on raising girls social and economic prospects and enhancing their self-esteem. Measures that
would accomplish this include.
Promoting valued roles for women apart from the motherhood,
Increasing young women’s access to education, income earning work and financial credit
Providing young women and men with information about reproductive and marital rights,
health and sexuality and extending their access to appropriate services and
Fostering equality between young women and men and improving their perceptions of marital
responsibility
Historically, India’s population stabilization efforts have centred around family planning, with
focus on fertility reduction. Such narrow vertical programmes, often limited to achieving numbers,
are not the answer for India’s population stabilization.
To quote Dr. Manmohan Singh* “The proposition that population stabilization policies cannot be
designed in isolation and that they have to be integrated into the framework of social and economic
* Eighth JRD TATA Memorial Oration on Population, Poverty and Sustainable Development, PFI, New Delhi February 2003
24

4.9 Page 39

▲back to top


Key Note-I
development strategies and programmes as a whole is now widely accepted. In this context, first
and foremost is the role of credible framework for the reduction of poverty.
It is now generally agreed that what we need is a holistic and integrated approach which places
control of fertility in the broader context of evolving an effective development strategy focusing on
the reduction of poverty, increasing the access of the poor to basic social services focusing more
sharply on improving the social and economic status of women”.
We need to tackle the issue of population stabilization in a holistic way. Family planning
programmes cannot be addressed in isolation.
Therefore, Family Planning (FP) has to be re- positioned in the broader context of Reproductive
Health (RH) and Reproductive Rights (RR). In fact, it has to be placed and positioned in the context
of Comprehensive Primary Health Care (Ali et al, 2007).
The most important aspect of Primary Health Care is its ‘all-inclusive equity-oriented approach’.
Primary health care was and still is a potentially revolutionary concept which looks beyond the
customary, conventional and traditional boundaries of curative and preventive medicine and tries
to address up-front the underlying social causes of poverty, deprivation. discrimination, food security,
hunger and poor health. This is, in fact, a holistic concept and is guided by five principles, namely,
(i) equitable distribution, (ii) multi-sectoral approach, (iii) utilization of appropriate technology, (iv)
focus on prevention, and (v) community participation and involvement. Delivery of primary health
care requires an amalgamation of good (Ali et al, 2007).
It is, therefore, suggested that family planning programmes should form an integral part of the
comprehensive primary health care and need to be based on “Community Needs Assessment”
with a participatory planning at different tiers of panchayati raj system starting from Gram Sabha
upwards rather than the method specific contraceptive targets being contemplated to be imposed
from above. Micro planning with community needs assessment can help to identify and address
the local problems through more acceptable strategies. The gender concerns and the women’s’
health concerns could be better taken care of in such a decentralized approach (Nanda, 2005).
25

4.10 Page 40

▲back to top


Key Note-I
CNA should also assess the community perception of quality of care and practical indicators for
quality of care should be developed. In this exercise it is vital to install a good Health Management
Information System (HMIS) for improving the effectiveness of the programme; there will also be
emphasis on complete registration of births, marriages, pregnancies, and deaths. Against this
backdrop, CNA should be viewed as an important health sector reform initiative and not merely a
reporting system.
The need is for greater social investment, wider socio-economic development, strengthening of
public health system, and improved governance in order to achieve population stabilization.
Social investments help reach the goal of slower population growth. Strategies for achieving
population stabilization should include improving socio-economic indicators such as addressing
the needs for maternal care, child health and contraceptive services, education of girls, ensuring a
minimum age at marriage of girls, reducing infant mortality and MMR through better health care
and immunization, nutrition support to women and children.
There is a need to focus on reducing IMR and MMR. We recommend that verbal autopsy audit of
all such deaths should be done so as to understand the leading causes of such events and take
necessary action. The participation of various community based organisations, Non-Governmental
Organisations and local experts should be encouraged during the audit.
The twin issues of Gender and Equity should be over arching in all the strategies that are being
formulated. In this context, we would like to suggest that the entire focus seems to be on the
women’s fertility regulation. There is a need to promote Male Participation and promotion of
methods for regulation of male fertility, both temporary as well as Permanent, through good quality
health care delivery system.
Since 2005, National Rural Health Mission (NRHM) is being implemented in Himachal Pradesh
and now all the states in the country including, Punjab and Haryana are also being covered under
this flagship programme. One can take the opportunity of this programme platform. The NRHM
appears to have brought back the primacy of Primary Health Care. The concept of Primary Health
Care as advocated in the Alma Ata declaration – with its emphasis on equity and strong people’s
participation addressing the underlying social, economic and political causes of poor health, is as
valid and relevant today as it was 30 years ago – and is even more urgently needed now. People
say that primary health care was tried and failed. In fact, in our country it has never been tried in
its true spirit, in the comprehensive form as advocated at the Alma Ata.
We try our best not to use words like Population Control” or “Population Explosion” as these
words have a negative and an authoritarian connotation.
A fundamental change which has occurred in recent times in conceptualizing and implementing
population policies, programmes and strategies is to ensure that they address the root cause of
high fertility which happens to be persistent gender disparities in access to education, nutrition,
health, employment and other productive resources. Therefore reducing the gender disparity and
bridging the gender gap is one of the major thrust areas of Population Foundation of India. One of
the cruelest and crudest forms of gender disparity is the phenomenon of sex selection and Pre-
Birth Elimination of Females (PBEF) - in common parlance what we refer to as female feticide.
The theme of ‘missing girls’ is an interface between population and gender. It captures the foremost
concern of population and development issues namely,
I. Declining child sex ratio (0-6 years).
II. Sex selection
III. Sex selective abortion
26

5 Pages 41-50

▲back to top


5.1 Page 41

▲back to top


Key Note-I
IV. Two child norm
V. Gender equity concerns.
This theme assumes importance in the North Western Region.
As mentioned earlier we reiterate that population stabilization is not merely about numbers, it has
to be looked at in the context of wider socio-economic development. “It does not matter if in the
process we don’t stabilize by 2045 (as indicated in NPP, 2000), it could be achieved by 2050 or
2060. But what is of greater concern is how we approach the issue of population stabilization. It
should be a gender balanced approach to population stabilization (Nanda 2002)”. This is all the
more important precisely in the states of Punjab, Haryana and Himachal Pradesh where one of the
most important demographic issue of serious and grave concern is the issue of declining child sex
ratio and sex selective abortion.
References
1. Ahluwalia. S, (2008) Reproductive Restraints: Birth Control in India, 1877-1947, 2008.
2. Ali A (2005) Current Thinking on Population Issues pp 68-76, in Dialogue, vol 6 No 3 Jan-Mar,
2005, ASTHA Bharati, New Delhi
3. Ali A, Nayak S & Mukhopadhyay S. (2007) State of Health in Bihar. PFI, 2007
4. Ali, A (2002) Population scenario of India and National Population Policy-pp 329-342 in Population
Stabilization and Development, The Universe, Cuttack,2002
5. Ali, A (2004) The Myth of population explosion: Reflections in NPP and State Population Policies
in the Health for Millions Vol 30 , Nos 3 & 4 August –Sept. , Oct-Nov., 2004, VHAI New Delhi.
6. Arnold, F. and T.K. Roy(2002), ‘ Sex Ratios and Sex-selective Abortions in India: Findings from the
1998-9 National Family Health Survey’, Paper presented at the Workshop on Sex Ratio of India’s
Population, held at the International Institute for Population Sciences,Mumbai,10-11 January.
7. Bose A. (1996) Demographic Transition and Demographic Imbalance in India PP 89-99 in Health
Transition Review, supplement to Vol 6 1996
8. Chatterjee. S. (2005) Towards Population Stabilization : Role of Good Governance 9th J.R.D.
Tata Memorial Oration, PFI 2005
9. Das Gupta, M. (1995), ‘Fertility Decline in Punjab, India: Parallels with Historical Europe’, Population
Studies, Vol. 49 No. 3, pp. 481-500.
10. Das Gupta, M. and P.N. Mari Bhat (1998), “Intensified Gender Bias in India: A Consequence of
Fertility Decline”, in M. Krishnaraj, R.M. Sudarshan, and A. Shariff, (eds.), Gender, Population and
Development. New Delhi; Oxford University Press, pp 73-93.
11. Government of India, National Population Policy 2000,New Delhi
12. International Institute for Population Sciences (1995), National Family Health Survey India, 1992-
93, Bombay.
13. International Institute for Population Sciences (IIPS),2006, National Family Health Survey-3, 2005-
06,IIPS, Mumbai
14. International Institute for Population Sciences, Mumbai and ORC Macro Maryland (2000), National
Family Health Survey, India 1998-99:India
27

5.2 Page 42

▲back to top


Key Note-I
15. Lahiri, S. and P. Dutta (2002), “Sex Preference and Child Mortality in Some Selected Indian States:
An Anlysis Based on NFHS Data During 1992-93 and 1998-99’, Paper presented at the Workshop
on Sex Ratio of India’s Population, held at the International Institute for Population Sciences,
Mumbai, 10-11 January.
16. Nanda A.R. (2002) Not Just a Number Game PP29-32, in Seminar Beyond Numbers, No 511,
March
17. Nanda A.R. (2004) Obsolescence and Anachronism of Population Control: From Demography to
Demology in Demography India pp 1-12, Vol 33, No 1, 2004
18. Nanda A.R.(2005) Note for circulation for the meeting of the National Commission on Population
held on 23rd July 2005 (Unpublished)
19. Planning Commission (2001), Approach Paper to Tenth Five year Plan(2002-07), p.6, Government
of India, New Delhi
20. Population Foundation of India (2006), Loosing Count; Mapping India’s Child Sex Ratio.
21. Population Foundation of India(PFI), New Delhi(2008), Infant and Child Mortality in India: District
Level Estimates
22. Registrar General ,India “Marital Status and Age at Marriage- An Analysis of 2001 Census Data,
Census of India, Ministry of Home Affairs.
23. Singh. M. (2003) Population, Poverty and Social Development 8th J.R.D. Tata Memorial Oration,
PFI, 2003
24. Visaria, L and P. Visaria, 1982. “Population (1757-1947)”, in: D. Kumar (ed.), The Cambridge
Economic History of India, Volume II:c.1757-c.1970,Hyderabad, Orient Longman, pp. 463-532.
25. Visaria, L. 1999. “Proximate Determinants of Fertility in India: An Exploration of NFHS Data”,
Economic and Political Weekly, Vol. 34, Nos. 42 and 43, October, pp. 3033-3040
28

5.3 Page 43

▲back to top


Key Note-II
Health and Epidemiological Transition in Punjab, Haryana and
Himachal Pradesh
Dr. Rajesh Kumar1, PGI Chandigarh
Punjab, Haryana, and Himachal, located in the northern region, are among the richest states of India,
but these states were left behind by many other states in social and health indicators. Gender discrimi-
nation, as reflected in low female to male sex ratio, is highest in Punjab and Haryana. Infant and
maternal mortality continues to be higher than many other states. Non-communicable diseases, such
as heart diseases, stroke, diabetes, chronic respiratory diseases and cancers, are rising whereas com-
municable diseases and malnutrition are still prevalent. Water-born diseases such as diarrhea and
hepatitis and vector-born disease outbreaks such as malaria, dengue and Japanese encephalitis occur
frequently. Injecting drug abuse is fueling the HIV epidemic in Punjab, though the level of HIV in
general population is still low in these states. Safe water supply is available to most of the population
but satisfactory sanitation is still a far cry particularly in the villages. Intensive use of pesticide in the
agriculture and indiscriminate release of industrial waste in the environment is also posing threat to
human health.
Exhibit 1: Health Determinants and Risk Factors in Selected States of India
Major States
1Population
below
poverty
line %
2Literacy
(15-49
years) %
Pre-
2Sanitary
toilet
%
Men
2Low
Weight-
for-Age
Men
School
Children
%
2Tobacco
Use
among
(Rupees)
15-49
years
%
2Alcohol
Use
among
Expenditure
15-49
years
%
3Per Capita
Expenditure
on Health
3Public Expenditure
on Health as
Percentage of Total
(Rupees)
2004
2006
2006
2006
2006
2006
2001-02
2001-02
Haryana
14.0
60.4
52.4
39.6
48.0
28.0
1570
10.4
Punjab
8.4
68.7
70.8
24.9
49.0
43.0
1530
16.8
Himachal
10.7
83.3
46.4
36.5
40.0
29.5
1305
37.8
Tamil Nadu
22.5
69.4
42.9
29.8
40.0
42.0
846
23.9
India
27.5
55.1
44.6
42.5
57.0
32.0
997
20.8
Major States
Haryana
Punjab
Himachal
Tamil Nadu
India
Exhibit 2: Health Indicators in Selected States of India
4Hospital
Treatment
Public
Facility
Urban
%
2004
20.6
29.2
89.5
40.8
4Hospital
Treatment
Public
Facility
Rural
%
2Child
Pneumonia
Treatment
Health
Facility
%
2Child
Diarrhea
Treatment
Health
Facility
%
2Child
Birth
in Health
Institution
%
2004
2006
2006
2006
29.0
88.0
81.7
35.7
26.4
87.1
75.2
51.3
78.1
-
68.9
43.0
37.2
75.3
63.3
87.8
2Infant
Full
Immunization
%
5Infant
Mortality
Rate /1000
live births
2006
65.3
60.0
74.2
81.0
2007
55
43
47
35
41.7
38.2
69.0
59.8
38.7
43.5
55
6Maternal
Mortality
Ratio /
100000
live births
2001-03
162
178
-
134
301
1Summary of Paper by Dr. Rajesh Kumar, Professor & Head, PGIMER School of Public Health Chandigarh for Population Foundation of
India Conference on ‘Health, Population and Social Development Issues in Punjab, Himachal Pradesh and Haryana’ from 23 to 24 October,
2008 at Chandigarh.
29

5.4 Page 44

▲back to top


Key Note-II
Public health system utilization is better in Himachal as compared to Punjab and Haryana where
public health system, which is the main source of health care for the poor, has stagnated due to
inadequate and inefficient financing by the state, though private medical sector has flourished. As a
result medical care consumes highest proportion of household income compared to many other states
of the country. Unless additional investments are made to increase the effectiveness and efficiency of
the public health system for achieving universal coverage of primary health care, leave aside attain-
ment of a pre-eminent position in the field of health, there is little chance that Punjab and Haryana
will even be able to achieve the goals set in national health policy 2002. Priory areas for immediate
intervention need to be identified by careful analysis of the trends in mortality, morbidity, and health
care utilization to tackle the co-existing triple burden, i.e., rising incidence of non-communicable
diseases, persistence of communicable diseases, and a weak public health system.
References:
1Poverty Estimates for 2004-05. Press Information Bureau. Planning Commission, Government of In-
dia, New Delhi, March 2007.
2National Family Health Survey (NFHS-3), 2005-06: India. Volume I. International Institute for Popu-
lation Sciences and Macro-International, Mumbai, 2007.
3National Health Accounts: India 2001-02. National Health Accounts Cell. Ministry of Health and
Family Welfare, Government of India, New Delhi, 2005.
4Morbidity, Health Care and Condition of the Aged: NSS 60th Round (January to June 2004), Report
No. 507. National Sample Survey Organisation. Ministry of Statistics and Programme Implementa-
tion, New Delhi, 2006.
5Sample Registration System Bulletin. Office of the Registrar General of India, New Delhi, vol. 43(1),
2008.
6Sample Registration System. “Maternal Mortality in India 1997-2003: Trends, Causes and Risk Fac-
tors”. Office of the Registrar General of India, New Delhi, 2006.
30

5.5 Page 45

▲back to top


Key Note-II
Health and Epidemiological Transition in Punjab, Haryana and
Himachal Pradesh
Dr. Rajesh Kumar1, PGI Chandigarh
Punjab, Haryana, and Himachal, located in the northern region, are among the richest states of India,
but these states were left behind by many other states in social and health indicators. Gender discrimi-
nation, as reflected in low female to male sex ratio, is highest in Punjab and Haryana. Infant and
maternal mortality continues to be higher than many other states. Non-communicable diseases, such
as heart diseases, stroke, diabetes, chronic respiratory diseases and cancers, are rising whereas com-
municable diseases and malnutrition are still prevalent. Water-born diseases such as diarrhea and
hepatitis and vector-born disease outbreaks such as malaria, dengue and Japanese encephalitis occur
frequently. Injecting drug abuse is fueling the HIV epidemic in Punjab, though the level of HIV in
general population is still low in these states. Safe water supply is available to most of the population
but satisfactory sanitation is still a far cry particularly in the villages. Intensive use of pesticide in the
agriculture and indiscriminate release of industrial waste in the environment is also posing threat to
human health.
Exhibit 1: Health Determinants and Risk Factors in Selected States of India
Major States
1Population
below
poverty
line %
2Literacy
(15-49
years) %
Pre-
2Sanitary
toilet
%
Men
2Low
Weight-
for-Age
Men
School
Children
%
2Tobacco
Use
among
(Rupees)
15-49
years
%
2Alcohol
Use
among
Expenditure
15-49
years
%
3Per Capita
Expenditure
on Health
3Public Expenditure
on Health as
Percentage of Total
(Rupees)
2004
2006
2006
2006
2006
2006
2001-02
2001-02
Haryana
14.0
60.4
52.4
39.6
48.0
28.0
1570
10.4
Punjab
8.4
68.7
70.8
24.9
49.0
43.0
1530
16.8
Himachal
10.7
83.3
46.4
36.5
40.0
29.5
1305
37.8
Tamil Nadu
22.5
69.4
42.9
29.8
40.0
42.0
846
23.9
India
27.5
55.1
44.6
42.5
57.0
32.0
997
20.8
Major States
Haryana
Punjab
Himachal
Tamil Nadu
India
Exhibit 2: Health Indicators in Selected States of India
4Hospital
Treatment
Public
Facility
Urban
%
2004
20.6
29.2
89.5
40.8
4Hospital
Treatment
Public
Facility
Rural
%
2Child
Pneumonia
Treatment
Health
Facility
%
2Child
Diarrhea
Treatment
Health
Facility
%
2Child
Birth
in Health
Institution
%
2004
2006
2006
2006
29.0
88.0
81.7
35.7
26.4
87.1
75.2
51.3
78.1
-
68.9
43.0
37.2
75.3
63.3
87.8
2Infant
Full
Immunization
%
5Infant
Mortality
Rate /1000
live births
2006
65.3
60.0
74.2
81.0
2007
55
43
47
35
41.7
38.2
69.0
59.8
38.7
43.5
55
6Maternal
Mortality
Ratio /
100000
live births
2001-03
162
178
-
134
301
1Summary of Paper by Dr. Rajesh Kumar, Professor & Head, PGIMER School of Public Health Chandigarh for Population Foundation of
India Conference on ‘Health, Population and Social Development Issues in Punjab, Himachal Pradesh and Haryana’ from 23 to 24 October,
2008 at Chandigarh.
29

5.6 Page 46

▲back to top


Key Note-II
Public health system utilization is better in Himachal as compared to Punjab and Haryana where
public health system, which is the main source of health care for the poor, has stagnated due to
inadequate and inefficient financing by the state, though private medical sector has flourished. As a
result medical care consumes highest proportion of household income compared to many other states
of the country. Unless additional investments are made to increase the effectiveness and efficiency of
the public health system for achieving universal coverage of primary health care, leave aside attain-
ment of a pre-eminent position in the field of health, there is little chance that Punjab and Haryana
will even be able to achieve the goals set in national health policy 2002. Priory areas for immediate
intervention need to be identified by careful analysis of the trends in mortality, morbidity, and health
care utilization to tackle the co-existing triple burden, i.e., rising incidence of non-communicable
diseases, persistence of communicable diseases, and a weak public health system.
References:
1Poverty Estimates for 2004-05. Press Information Bureau. Planning Commission, Government of In-
dia, New Delhi, March 2007.
2National Family Health Survey (NFHS-3), 2005-06: India. Volume I. International Institute for Popu-
lation Sciences and Macro-International, Mumbai, 2007.
3National Health Accounts: India 2001-02. National Health Accounts Cell. Ministry of Health and
Family Welfare, Government of India, New Delhi, 2005.
4Morbidity, Health Care and Condition of the Aged: NSS 60th Round (January to June 2004), Report
No. 507. National Sample Survey Organisation. Ministry of Statistics and Programme Implementa-
tion, New Delhi, 2006.
5Sample Registration System Bulletin. Office of the Registrar General of India, New Delhi, vol. 43(1),
2008.
6Sample Registration System. “Maternal Mortality in India 1997-2003: Trends, Causes and Risk Fac-
tors”. Office of the Registrar General of India, New Delhi, 2006.
30

5.7 Page 47

▲back to top


Key Note-III
Gender Discrimination, Sex Selection and the State: Contradictions,
Contestations and Challenges
- Bijayalaxmi Nanda
Sr. Lecturer, Department of Political Science, Miranda House, DU
and
Campaign Coordinator
Campaign Against Pre-birth Elimination of Females, (CAPF)
As the demographic domain clearly manifests, gender biases appear throughout the life cycle of women
in India. This bias takes a grave and heinous form when it denies them the right to be born. Amartya
Sen points out that "natal inequality reflects the fact that many parents want the new born to be a boy
rather than a girl, given a general preference for boys in many male-dominated societies. The availability
of modern techniques to determine the gender of the fetus has made such sex-selective abortion
possible and easy, and it has become very common in many societies" (Sen 2005). The sex-ratio is a
clear indicator of the phenomenon of selectively eliminating female fetuses by a complex nexus of
patriarchal ideas, misuse of medical technology and avarice and greed of unscrupulous medical
practitioners. However this is only half the story. The State also plays a major role in this. The State's
management of this form of gender discrimination is enacted through a number of potentially
contradictory fora, including policies, programme, civil/criminal remedies and formal and informal
mediation. This has an adverse impact on the problem. While the socio-cultural factors leading to sex
selection and sex selective abortion and its terming as a cultural crime has been extensively emphasised
upon, what is less actively studied are the contestations, contradictions and challenges emerging from
the State and civil society discourses. The thick description of it as a cultural crime which has been
arrived at by constructing and validating theories of hypergamy, dowry practice and high caste Hindu
practices has placed the onus of responsibility of rectifying this cultural crime on the family without
adequately addressing the State and the market's role in exacerbating it. This paper presents an analysis
of the State's role in an effort to bring to the forefront the complex interactions between policies,
programmes ,women's bodies and voices ,nature and forms of gender discrimination and the patriarchal
boundaries of both the public and the private spheres.
This paper is divided into three sections. The first section explores the broad demographic domain
and the socio-political and economic factors concerning the child sex ratio. The second critically
examines some of the initiatives that have been taken by the state and the civil society groups and
others for this cause. Through a series of case studies it attempts to present the contradictions,
contestations and challenges in them which render these initiatives not only ineffectual but actually
make them work against the notion of women's rights. The last section explores some alternative
narratives on this issue to grasp the complex paths they have taken in order to undermine this form of
gender discrimination and bring about a feminist transformation in society.
Child Sex Ratio: Tales that numbers tell
The female-male ratio of the population in 0-6 age group has severely declined from 945 girls per 1000
boys in 1991 to 927 girls per 100 boys in 2001. The fall is more pronounced in rich States like Haryana,
Punjab, Delhi, Maharashtra, Himachal Pradesh & Gujarat. Among the States/UTs with balanced CSRs
are the North-Eastern States, predominant tribal States and southern States like Kerala and eastern
States like West Bengal and Orissa.
31

5.8 Page 48

▲back to top


Key Note-III
Source: Visaria, L., 2005 'Female Deficit in India: Role of Prevention of Sex Selective Abortion Act' International
Conference on Female Deficit in Asia: Trends and Perspectives, Singapore.
Comparison between rural and urban areas also show that the rural areas are more balanced than the
urban areas so far as sex ratio is concerned. This is reflected in the child sex ratio of India as per 2001
Census, which stands at 934 for rural areas as compared to 906 for urban areas, a difference of 28
points. Although there has been a decline in the sex ratio in rural areas as well as compared to 1991
Census, this decline is lower as compared to decline in urban areas. As compared to a decline of 15
points in rural areas, decline in urban areas has been 29 points between 1991 and 2001. The trend of
overall decline in sex ratio and the rural - urban characteristic continues as is evident from the SRS
data of recent years.
Child Sex ratio
Census
Total
Rural
Urban
1981
962
963
931
1991
945
948
935
2001
927
934
903
SRB/2004-06*
892
895
881
Source: Census of India 1981,1991, 2001 & * Sample Registration System (SRS)
Although the SRB has shown a hint of upward turn in the SRS 2004-06 (which is 892 as compared to
SRB of 880 in SRS 2003-05), it still paints a gloomy picture.
Even the per capita income as an indicator of economic prosperity has no defining role in determining
the declining child sex ratio (Dagar 2007).
32

5.9 Page 49

▲back to top


Key Note-III
Sex Ratio (0-6 Years) and Per capita Income in Selected States, 1981-2001
State
INDIA
Goa
Maharashtra
Punjab
Gujarat
Kerala
Karnataka
West Bengal
Andhra Pradesh
Rajasthan
Bihar
1981
962
926
956
908
950
970
974
1149
992
954
981
2001
927
933
917
793
878
963
949
963
964
909
938
Decline in Child
sex Ratio
-35
7
-39
-115
-72
-7
-25
-186
-28
-45
-43
Per capita income1991-2001
(at current price) in Rs.
15,562
44,613
22,604
22,797
18,926
17,709
16,654
14,817
15,040
12,074
4,813
Source: Dagar, Rainuka (2007), "Rethinking Female Foeticide: Perspective and Issues" in Sex Selective
Abortion in India: Gender, Society and New Reproductive Technologies, Sage Publications, New
Delhi, p.96.
Child Sex Ratio - Bottom Ten Districts in India in 2001
State
District
CSR
Haryana Sonipat
788
Ambala
782
Kurukshetra
771
Punjab Gurdaspur
789
Sangrur
786
Kapurthala
785
Bathinda
785
Mansa
782
Patiala
777
Fatehgarh Sahib
766
All the statistics point out clearly that the gender discriminatory practices affect sex ratio. The class
factor in this form of gender discrimination also comes to the forefront. Economically prosperous
States like Punjab and Haryana due to the nexus between traditional son preference and easy access
to medical technology, get rid of the daughters in a 'sanitised and systematic' manner (i.e., through
sex selective abortion). In the poor sections gender discrimination manifests itself in girl-child neglect
in terms of nutritional and healthcare leading to infant mortality.
The gender gap in IMR is about 1, i.e. there is one excess female mortality to male mortality. However,
it is in States like Haryana, Punjab, Rajasthan, Gujarat that it is higher. Female infanticide continues to
33

5.10 Page 50

▲back to top


Key Note-III
be followed in the North and in parts of Tamil Nadu. The sex ratios as presented in the Census of India
2001 also reveal that sex ratio among slum populations are far higher than the non-slum areas. The
CSR for the slum population is 919 which is significantly higher than the 904 recorded fro non-slum
area (Census 2001).
"No other data set could have provided a clearer picture of who the 'guilty' are and how erroneous the
typical association of even those practices of sex determination based girl child discrimination being
a cause of poverty turns out to be. Poverty in itself debilitates in various ways, but does not turn the
poor populations into being anti-female and girl-child murderers" (Rastogi 2006).
The neglect of and discriminatory behaviour against girls leading to excess female mortality has been
widely documented by several studies (Das Gupta 1987, Kishor 1995, Miller 1989, Visaria1971,
2005). Declining sex ratio and its implication for the status of women in society has formed an important
category of interest in studies by Agnihotri (2000), Chen, Haq and D'Souza and Bhat (1997), Dyson
and Moore(1983), Mason (1984), Mitra (1978), Mazumdar and Krishnaji (2001). Das Gupta (1987)
and Miller (1981,1984, 1991) had studied gender discrimination through sex differences in mortality
and girl child survival. Besides Sen's (1990) famous missing women phrase, economists like Bardhan
(1982), Cain (1984) Vibhuti Patel (1984) and Harriss (1989) have also focused on gender discrimination.
Historians and other social scientists like Clark (1987, 1993), Vishwanath (2000) and the cultural
anthropological work by Bhatnagar, Dube and Dube (2005) have provided archival, demographic,
anthropological evidence and a cultural view of gender discrimination in India especially of female
Infanticide. Demographers, feminist scholars and health scientists like Bose (2001), Shiva (2003) and,
Raju (2006) have also focussed their attention on the declining sex ratio.
An all India study which has examined changes in Child sex ratios (0-4) between 1981-1991 alongside
trends in mortality sex ratios and fertility rates, concluded that during fertility decline in India parents
are not substituting prenatal for postnatal discrimination against girls, but are adding these two strategies.
Male bias thus appears to be intensifying (Das Gupta and Bhat, 1997). Another study explores the
issue by examining the variations in regions on the intensification of masculinity of sex ratios in India.
It points out to the need to study the interconnection with socio-economic development and the status
of women. Any policy measure thus need to not only focus on regulating or banning technology used
to women's detriment, but also address the root causes of the devaluation of women (Sudha and Rajan
2003). Extensive national and regional analyses of child sex ratios in India, on the whole indicate that
more masculine child sex ratios and higher female than male child mortality go hand in hand. A well
known regional pattern is observed; the Northern and North -Western parts of India including the
states of Haryana, Rajasthan, Western UP are most unfavourable to the life chances of female children
(Das Gupta and Bhatt, 1997; Kishor, 1993). Agnihotri's study also pointed out to the interconnections
between economic prosperity and declining sex ratio favouring the male. Chunkath and Athreya
noted the intra-region variations in Tamil Nadu in the belt of female infanticide in the Salem \\ Dhramapuri
\\ Madurai districts (1997). UNFPA (United Nations Population Fund) study of September 2001 analyses
the link between fertility decline and sex -selective abortions in Haryana and Punjab.
Studies have also offered a range of explanation for the sex selective practices. They have drawn
attention to the interlocking of this issue with caste, class, social mobility and the spread of dowry
(Clarke, 1987; Heyer, 1992, 1997). A 1995 study by Adithi, an NGO working in rural Bihar revealed
that sex-selective abortion, female infanticide and excess female child mortality due to selective neglect
were widespread in the 8 districts studied. The report indicated that it was due to the spread of dowry
in those areas.
Locating of gender in the discourse related to sex selection and/or population policy or reproductive
health issues have been examined in some studies. An intensive study in a rural population of 13000
in Rohtak district of Haryana in India on the issue of sex selection revealed that parents tend to be
calculative in choosing the sex of the next child and the decision is based on the birth order, sex
34

6 Pages 51-60

▲back to top


6.1 Page 51

▲back to top


Key Note-III
sequence of previous children and number of sons. Transfer of medical technology to India is resulting
in reinforcement of patriarchal values as professional medical organisations seem to be indifferent to
ethical misconduct. The study pointed out a general lack of gender sensitivity of Indian doctors and
other professionals. It also revealed that the entire focus of the health system is on fertility reduction.
The contraceptive burden was almost entirely on women. This has a negative impact on women and
also increases female foeticide. The lack of a gender perspective in the policies and programmes
related to health of women in Haryana is revealed through this study (Sabu George, Ranbir S. Dahiya,
1998, 2003).
Voluntary Health Association of India (VHAI) conducted a study (2003) in the three districts of Kangra,
Fatehgarh Sahib and Kurushetra in the States of Himachal Pradesh, Punjab and Haryana respectively.
The principal researcher of this study were Ashish Bose and Mira Shiva. The study noted the nexus
between tradition and technology. The inherent and deep rooted son complex in Indian society has
been triggered by medical technology. It also notes that the small family norm results in an increase in
sex-selective abortion in order to have the requisite number of sons.(incidentally the study reveals it to
be two). The complicity of the doctors in this results in furthering it. The findings of the study also
point out to the lack of efficiency in the legal machinery in the districts in implementing the PNDT
Act as it was busy with other pressing administrative matters. The study reveals that women do take
decisions to determine the sex of the fetus and to terminate it if found to be female as they had very
low self esteem and felt that their status would be enhanced by having sons. This is due to social
conditioning and strong hold of patriarchy in these regions. The study also revealed that economic
prosperity in these regions goes hand in hand with social backwardness. A higher level of economic
growth, better income levels and better transportation networks has facilitated spread of technology
and also attitudes to lead to further decline in child sex ratio.
Initiatives for action
It was the third wave of the women's movement in India, especially the Committee on the status of
Women in India in 1974, that recognised sex ratio as a composite indicator of women's status. The
decline in Child Sex Ratio and the issue of missing girls was raised by women's groups. Due to their
persistent lobbying and through seminars, debates and research, the issue gained prominence and
was provided an appropriate environment to take firm roots in domains of enquiry - be it research,
policy, advocacy or campaigns (Rastogi 2006).
The drive against Sex selective Abortion and sex-determination techniques gained strength in 1980s.
The 1976 partial ban on sex-determination tests in government hospitals had only led to the proliferation
of private clinics/hospitals offering the facility. The ban was imposed because advent of amniocentesis
in 1975 caused a dramatic increase in sex-selective abortion cases. Since then, different parts of the
country have witnessed several campaigns against the misuse of science and technology to continue
discrimination against women. In 1982, the Centre for Women's Development Studies (CWDS)
launched the first campaign. It was initiated by Dr. Vina Mazumdar and Dr. Lotika Sarkar in Delhi as
a protest against an advertisement for Bhandari Antenatal sex Determination Clinic, Amritsar, Punjab.
The clinic was openly advertising its services through press, in railway compartments and other public
places. The advertisement referred to daughters as 'liabilities' to the family and a threat to the nation,
and exhorted expectant parents to avail the services of the clinics to rid themselves of this 'danger'.
More campaigns like the Forum Against Sex Determination and Sex Pre-Selection (FASDSP) in 1985
in Maharashtra and the Campaign Against Sex Selective Abortion (CASSA), Tamil Nadu came up.
FASDSP lobbied to regulate the practice of sex determination in Maharashtra by formulating a separate
legislation, instead of modifying the Medical Termination of Pregnancy (MTP) Act, 1971, that had the
danger of curtailing women's right to abort. As a result, the Maharashtra Regulation of Use of Prenatal
Diagnostic Techniques Act, 1988, came into being.
35

6.2 Page 52

▲back to top


Key Note-III
Serious drawbacks in the state legislation and poor implementation caused the awakening of interest in
the issue across the entire country. A move for an all-India ban on sex determination tests gained
momentum, and the Pre Natal Diagnostic Tests (Regulation and Prohibition of Misuse) Act, 1994,
(called the PNDT Act) came into existence. Though the PNDT Act entered into force in January 1996,
no evidence of decline in the practise of sex-selective abortion came forth even after four years. Lack
of concern and political will to implement the legislation by the Centre and states led to a Public
Interest Litigation (PIL) in the Supreme Court (SC). The PIL was filed by three petitioners - Dr Sabu
George - a social activist, Mahila Sarvangeen Utkarsh Mandal (MASUM), Pune, and Centre for the
Enquiry of Health and Allied Themes (CEHAT), Mumbai, in February 2000. In May 2001, the SC
directed the Centre to implement the PNDT Act in all its aspects and called upon all state governments
to take necessary steps to implement the Act. However, a further dip in 2001 sex ratio suggests that a
lot more needs to be done in this regard.
In the light of new techniques available to determine sex before conception, it was felt necessary to
amend the Act. From February 14, 2003, the Pre-natal Diagnostic Techniques (Regulation and Prevention
of Misuse) Amendment Act, 2002 came into force. The PNDT Act 1994 was renamed as 'the Pre-
conception and Pre-natal Diagnostic Techniques (Prohibition of Sex Selection) Act, 1994.
Contradictions, contestations and challenges
Sex selective Abortion, Population and women's fertility - The understanding of sex ratio as a
demographic imbalance tends to ignore the conflict of State interests when it comes to the issue of
population control. The discourse on population control in India has led to an ambiguity on the issue
of sex selective abortion. In India there is a fairly long historical tradition of a narrow focus on family
planning to attain population stabilization (Mallik 2002). This form of family planning implicitly builds
into its methods of circumscribing of women's bodies and control of their fertility by targeted sterilization.
It also remains tolerant of and encourages abortion for such purposes. It was in the background of this
construction of women's subjectivity that reproductive technologies like amniocentesis, chorionic
villous biopsy and later ultrasound was introduced in the 1970s.While these technologies were mainly
to detect congenital abnormalities of foetuses during pregnancy, in India it was perceived by the
families as methods to determine their family size by getting rid of unwanted female foetuses. The
State remained complicit in this desire and decision.
The demographic scenario at this time engaged mainly with ideas of Malthusian origin and considered
India's burgeoning population as its main problem. At a seminar in 1984 a government official stated
that sex determination tests must be allowed because our population problem calls for desperate
measures (Menon 2004). The desperate measures ignored the demographic dynamics of declining sex
ratio or the impact of it on women's health and rights. The International Conference on Population
and Development (ICPD, 1994) and then the National Population Policy (2000) transformed this
obsession with numbers by talking about target free approaches, gender equity, unmet needs of women
for contraception and the idea of informed and empowered choice. A declining sex ratio and the
ramifications of sex determination and sex selective abortion had already shown up by this time in
government documents and census reports and had sufficiently embarrassed the State to change its
track on the use of reproductive technology and also on the issue of population stabilization. However
for a country steeped in the discourse of population as a problem and its scant regard for women's
rights, the rhetoric of ICPD and the NPP remained at the fringes and the attainment of replacement
levels of fertility calculated at a total fertility of 2.1 remained a holy national goal. Many state policies
continue to emphasise a two child norm by using varying incentives and disincentives for the people.
Studies by Nirmala Buch (2006), Leela Visaria (2006) show how the implementation of the two child
norm has led to multiple burdens on women especially increasing the phenomenon of sex
determination and sex-selective abortion. The small family norm as stipulated by the state does not
take into account its adverse impact on the girl child and women. According to Sabu George "the
small family will always be at the expense of girls". The contradictions in these population policies
36

6.3 Page 53

▲back to top


Key Note-III
and norms and the State's concern to restore the demographic balance by countering sex determination
and sex selective abortion has not been adequately addressed. How the two child norm works to the
detriment of women and children and is essentially anti-poor, anti weaker sections in society needs to
be underlined. This is an essentially complex intersection which is characteristic of most policies that
aim to emancipate women in India and there is a need to intensively work towards withdrawal of such
norms and policies in order to fulfil the State's commitment to gender equity and equality. On a
positive note due to intense lobbying and campaigning by civil society initiatives the two child norm
has been withdrawn from Himachal Pradesh, Haryana and Madhya Pradesh.
<Case study of Bimala Nayak , Cuttack Orissa to be cited here>
Sex selective abortion, and women's right to abortion - The issue of sex determination and sex
selective abortion has always been placed on a slippery terrain as far as women's rights are concerned.
Firstly the idea of abortion has been played out as a human drama with a set of actors who can be
categorised as the pro-life supporters and the pro-choice supporters. The issue is thus seen as a set of
competing rights i.e. fetal rights vs. women's rights. Understanding that women have limited
reproductive rights and very little bargaining and negotiation powers when it comes to contraception
use it is important that abortion is retained as a right for women to be able to have some form of
control over their bodies, their choices and their lives. At the same time it needs to be understood that
sex determination and sex selective abortion are far removed from this discourse of choice and
autonomy. The determination of the sex of the foetus and its elimination when it is found to be female
cannot be justified as an example of choice and autonomy for women. Whether such a decision is
taken by coercion or by consent there is no doubt that the decision is based on an acceptance of the
inferiority of being female and a categorical denial of her birth. Sex determination and sex-selective
abortion are to be seen as anti women, as gender discrimination, as violence against women and as
genocide.
Feminists and women's groups have always strived to maintain this distinction between abortion and
sex-selective abortion. Nivedita Menon puts it very appropriately when she says that sex determination
and sex-selective abortion show us how the language of pro-choice in the context of abortion becomes
anti-women (Menon 2004). Secondly while this distinction is clearly laid out in the various policies
and documents, and the legal remedies and procedures in India, it remains clouded otherwise. The
involving of religious groups to counter sex determination and sex-selective abortion has led to an
overlap between the abortion and sex-selective abortion. The word bhrunhatya has come to invisibilise
the word kanya in kanya bhrunhatya. Many seemingly proactive pamphlets, brochures, films and
other communication materials are plagued by this problem finding it easier to lapse into a pro-life,
moral, ethical appeal to reach out without adequately analysing how it overlaps over women's
reproductive rights.
Finally it is important to highlight that in India second trimester abortion is amongst the highest in the
world. This is often because of women undergoing sex selective abortion (Johnston 2002 in Mallik
2003). While there is a need to bring about safe and universal access to abortion for women, the
dangers and threats to women's health and the elimination of females arising out of sex-selective
abortion needs to be emphasised.
<Case study of the Nawanshar experiment in Punjab to be cited here>
Sex selective Abortion and the issue of women's worth - One of the predominant methods of addressing
the declining sex ratio and its concomitant reason, sex-selective abortion, is to enhance the so called
worth of women. The strategies of intervention by the State are built around the perception that the
unwantedness of daughters is due to the fact that they are liabilities There are two major ways in
which these benign and well-meaning strategies contradict and contest against the rights of women.
The common strategy for intervention is to introduce an incentive for families with daughters to reduce
the guilt of inaction. While these incentives which include monetary motivation are within the
37

6.4 Page 54

▲back to top


Key Note-III
stereotypical context of poor families and their 'liabilities', the demographic dynamics show us that
this is an issue which is crosscutting all classes and especially true for economically prosperous regions
and in families which are high caste and high class. The paltry incentives therefore can do very little to
motivate such families. Jean Dreze questioned the wisdom of bribing parents to keep their daughters,
thereby reinforcing the notion that they are a liability (Dreze 1997 in Rajan 2003).
George's findings show that this monetary incentive is sometimes used as dowry (2001). Veena Talwar
Oldenberg in her extensive study of dowry practice in Punjab is of the opinion that the viewing of
women as liabilities has wrongly placed all blame at the door of dowry. The practice of dowry needs
to stop but its unproblematic assessment as the main cause of sex selective abortion and monetary
incentives to enhance the worth of women will be counterproductive. Women's worth is tied up with
equal inheritance rights to natal property, economic opportunities, recognition of household labour
and a progressive understanding of women's sexuality and mobility (Oldenberg 2003).
The other strategy for intervention to enhance the worth of women is to emphasize the utility of
women especially when it comes to men and marriage. Posing questions to families by presenting
present day examples of how men are finding it difficult to get brides due to the dwindling numbers
of women, the State implores them to keep their daughters. This marketing of the issue fails to take
into account how in many parts of India the decline of the number of women has led to a double
burden on women. The practice of coerced polyandry has shown us how daughters are eliminated
while brides are bought and sold. This kind of an utilitarian argument about women's use as providers
of sex and sons is essentially anti-women and not rights based. Addressing inequalities within marriage,
the predominantly patriarchal structure of marriage and viewing women beyond standard definitions
of marriage and motherhood is not a part of the strategies for intervention thereby reinforcing the same
stereotypes which have led to the declining value of women in the society.
<Case studies of coerced polyandry along with anti-women IEC Materials>
Sex Selective Abortion, PCPNDT Act, the patriarchal road and the image of women - The complicities
of the state and society are often a matter of shared ideologies and perceptions about a problem. The
legal remedy to deal with sex determination and sex-selective abortion which is the PCPNDT Act has
been framed around broad issues - the ethical use of new reproductive technologies, the role of the
medical community, the market and the families. Irrespective of some loopholes the PCPNDT Act can
be considered a sound piece of legislation which makes the act of sex determination and sex-selective
abortion a non-bailable, non-compoundable offence. Ironically it is the most unused legislation for a
number of reasons.
The practice of sex determination and sex-selective abortion is possible due to a wide group of actors
who can be neatly divided into two categories, the service users and the service providers. The subtle
form of determining the sex of the foetus, communicating it and the nexus between the users and
providers make it difficult to register cases. Secondly, the woman stands to be implicated in this even
if it is widely believed that she is either coerced or socially conditioned to do so. Thirdly, the appropriate
authorities are from the medical community and commonly have a fraternal bond with the doctors
who commit the crime thereby leading to weak cases and very few convictions. Then there is the
contextualisation of the issue around the idea of women's choice, self esteem and family honour.
Appropriate Authorities irrespective of their position are steeped in a culture which perceives son
preference as natural fallout of the secondariness of daughters and unsubstitutability of sons. The role
of doctors in exacerbating or aiding sex-selective abortion is clearly stated in the law. In practice,
though, the tendency is to view this role as a lesser evil since the doctor is only providing what the
family wants. It is seen as a pure econometrics of demand and supply. The issue as it is played out in
the public fora tends to see it as a discrimination meted by women against her own sex. The pressures
of mother-in-law on daughter-in-law and /or the woman's own wish to have sons, all contribute to the
criminalising of women and the absolving of all guilt on part of the husband/ men and the doctors.
38

6.5 Page 55

▲back to top


Key Note-III
Recognising the agency of women in perpetuating this practice goes against the stereotype of women
as passive victims and in need to be rescued by state aided gender friendly legislation. The discourse
of women's rights remains untenable in this scenario. The low conviction rate on this issue bears
testimony to this fact.
Number of Ongoing Court/Police Cases under PC & PNDT Act 1994 (As on March, 2006)
State/UT
Andhra Pradesh
Arunachal Pradesh
Assam
Bihar
Chhatisgarh
Goa
Gujarat
Haryana
Himachal Pradesh
Jammu & Kashmir
Jharkhand
Karnataka
Kerala
Madhya Pradesh
Maharashtra
Manipur
Meghalaya
Mizoram
No. of Ongoing
Court/Police Cases
8
-
-
7
-
-
57
24
-
-
-
20
-
7
46
-
-
-
State/UT
Nagaland
Orissa
Punjab
Rajasthan
Sikkim
Tamil Nadu
Tripura
Uttaranchal
Uttar Pradesh
West Bengal
A & N Island
Chandigarh
D & N Haveli
Daman & Diu
Delhi
Lakshadweep
Pondicherry
Total
No. of Ongoing
Court/Police Cases
-
-
72
1
-
47
-
3
17
10
-
-
-
-
76
-
-
395
<Case studies of Dr. Mitu Khosla's legal battle and Dr Dahiya's proactive campaign>
The burgeoning role of the market, rolling back of the state and ethical practices for women's
health - The discourse of rights in the case of sex selective abortion remain a complex one and the
ability to address it within the contours of state regulated policies becomes hindered within the
rolling back of the frontiers of the state. The 1980s led to the liberalising of the Indian economy and
the entry of global capital in the state. The mushrooming of new reproductive technologies and the
advertisement of sex selection methods on cyber space by companies in U.S.A show that the market
widens the choices for sex selection and works against the rights of women in India. The wide outreach
of the global market requires the state to view this issue as a complex network of both local and global
patriarchy. While there is a tendency for International public opinion to stigmatise sex determination
and sex-selective abortion as a south Asian phenomenon, it ignores the proliferation of new reproductive
technologies for non-medical and profit-based reasons. What is significantly absent in public discourses
is the questioning of such technologies which flout medical ethics and universally work against the
rights of women. There is a foundational unease in addressing this significant convergence of market
interests with cultural mores. The State's failure to confront market forces in this transaction present
both the state's minimalist reach as well as its complicity in furthering sex-selective abortion.
<Case studies of the entry of Genselect of U.S.A into the Indian market and Roop Rai's
dilemma in Canada>
Alternative narratives- charting new paths
The decades of working on the issue of sex selection has uncovered many lessons. It has shown the
narrowness of the strategies adopted despite the variations in their processes. On a positive side it has
allowed the key stakeholders to explore the kind of spaces that are available for promoting transformative
change. The women's movement in India has examined this issue in the context of violence against
women and has believed that multi-pronged strategies need to be set in motion in order to achieve the
39

6.6 Page 56

▲back to top


Key Note-III
much desired goal of gender equality. While critical of the state and the possible emancipatory value
of law, the women's movement still invokes the state in this matter. So the women's movement in
India charts the first steps for engaging the State and its laws in order to address the declining sex ratio
and its immediate reason ie sex selection.
The UNFPA has networked extensively and engaged with all key stakeholders all over India to have
emerged with innovative programmes and plans. Research, advocacy and execution have all been a
part of their engagement on this issue. They have worked in various ways with the state and the civil
society in manners which have been oppositional, reformist and collaborative. Their support to the
Laadli project, which celebrates the value of the girl child and emphasises on negotiating for a space
for the recognition of the symmetrical interaction between issues of the girl child and issues of women,
is an important one. The Ministry of Health and Family Welfare under whom the central authority of
implementing the law (PC PNDT Act 1994) has also worked in various ways to generate awareness of
the formal aspects of the law and its symbiotic relationship with the value of the girl child. In 2000 and
in 2001 the issue was given primary importance and the amendments to the PCPNDT Act were set in
motion then broadening it to include pre-conceptual reproductive technologies and also emphasizing
the role of civil society initiatives on the issue.The UNFPA's emphasis on reproductive rights in this
context, has also gained recognition in the Ministry of Women and Child Development. Right to be
born, equality and dignity sets the terrain for an understanding of the issue of sex selection. The census
office in India has been the first to openly articulate the declining sex ratio and its consequences. In
1991 the Census office recognised that the declining child sex ratio was a consequence of sex-selective
abortion. While the census data is only in numbers, it charted the path for exploring and interpreting
data in order to argue that the status of women in India must be improved.Advocacy drives with the
media by Sabu George has led to an awareness on the issue since 2001 bringing the issue to the
forefront .
The Lawyer's Collective has worked extensively on this issue, forging new partnerships and engaging
the state by insisting on two strategies: (1) Implementation of the law and (2) an insistence on the rights
of the women. The Population Foundation of India has also articulated the rights based approach on
this issue and emphasised on massive advocacy drives, especially with legislators on this issue. The
discourse of rights and that of violence against women in this context have been provided a broad
consensual platform by the consistent efforts of activist-academic Women's organizations like CWDS,
Sama, etc. In Punjab the Punjab Voluntary Health Association has used multi-pronged approaches to
address the issue by adopting a systemic analysis by linking it with all forms of patriarchal discrimination
and violence.
Sutra in Himachal Pradesh has also addressed this issue by using diverse, differentiated strategies
which expand the possibilities for building appropriate form of solidarity. Organisations like CAPF in
Delhi which have worked with the youth, have found that the essential move to re-politicise the issue
requires radical and revolutionary goals which the youth can set. The issue of sex selection is not only
a struggle against and a struggle for, it is a struggle within.
The complex socio-political reality of sex selection and gender discrimination in India requires a
multi-pronged approach which needs to take into account the whole gamut of rights of women, the
intricate interconnection of these rights, the influence of class, caste, religion and other individual and
group identities as well as the shifting heterogeneous character of the market and the State itself.
40

6.7 Page 57

▲back to top


Key Note-III
References and select Bibliography:
Adithi (1995), "Female Infanticide in Bihar", Report prepared by Viji Srinivasan, Parinita, Vijay, Shankar,
Alice, Mukul, Medha and Anita Kumari, ADITHI, Patna.
Ahluwalia, Kishwar (1986), "Amniocentesis, the controversy continues", Times of India, 8th March
1986.
Agarwal, Bina (1994), A Field of One's Own: Gender and Land Rights in South Asia, Cambridge
University Press.
Agnihotri, S. R. (1995), "Missing females: A disaggregated analysis," Economic and Political Weekly
30(33) (19 August): 2074-2084.
Agnihotri, S. (1996), "Child sex ratios in India: a disaggregated analysis", Economic and Political
Weekly, Dec. 1996, pp.S3369-S3382.
Agnihotri, S. (2000), Sex Ratio Patterns in the Indian Population: A Fresh Exploration, Sage Publication,
New Delhi.
Baker, John, Kathleen Lynch, Sara Cantillon and Judy Walsh (2004), From Theory to Action, Palgrave,
London.
Bardhan, Pranab (1974), "On life and death questions," Economic and Political Weekly, 9(32-34)
(Special Number, August): 1293-1 304.
Bardhan, Pranab (1982), "Little Girls and Death in India", Economic and Political Weekly, 17 (36), pp.
1448-50.
Baxi, U. (2001), "Gender and Reproductive Rights in India: Problems and Projects for the New
Millenium", A report by UNFPA, New Delhi.
Benhabib, Seyla (1986), "The Generalized and the Concrete Other: The Kohlberg-Gilligan Controversy
and Feminist Theory." Praxis International (1986): 38-60.
Bhat, Mari M. and A.J. Francis Zavier (2003), "Fertility Decline and Gender Bias in Northern India",
Demography, Vol.40, No.4, pp.637-657.
Bhat, M. and Sharma (2006), "Missing Girls: Evidence from Some North Indian States", Indian Journal
of Gender Studies, 13: 351-374.
Bhatnagar, R.D., R. Dube and R. Dube (2005), Female Infanticide in India: A Feminist Cultural History,
State university of New York, Albany.
Bose, Ashish (2001), "Fighting Female Foeticide: Growing Greed and Shrinking Child Sex Ratio",
Economic and Political Weekly, 8 Sep., pp.3427-3429.
________ (2002), "Curbing Female Foeticide: Doctors, Governments and Civil Society Ensure Failure",
Economic and Political Weekly, 23 Feb., pp.696-697.
Bose, Ashish and Mira Shiva (2003), Darkness at Noon: Female Foeticide in India, Voluntary Health
Association of India, New Delhi.
Buch, Nirmala (2006), The Law of Two Child Norm in Panchayats, Concept Publishing Company,
New Delhi.
Cain, M. (1984), Women's Status and Fertility in Developing Countries: Son Preference and economic
security, World Bank Staff working paper Series No.682, World bank, Washington D.C.
41

6.8 Page 58

▲back to top


Key Note-III
Chhachhi, A and C. Sathyamala (1983), "Sex determination tests: a technology which will eliminate
women", Medico Friends Circle Bulletin, No.95, pp.3-5.
Chudhary P. (1994), The Veiled Women: Shifting Gender Equations in Rural Haryana 1880-1990,
Oxford University Press, New Delhi.
Chunkath, Sheela Rani and V.B. Athreya (1997), "Female infanticide in Tamil Nadu: some evidence",
Economic and political Weekly, Vol.XXXII, No.17, pp.WS-22-WS-29.
CEHAT (2003), Sex Selection-Issues and Concerns: A compilation of Writings, Cehat, Mumbai/Pune.
Chen, M., E. Haq and S. D'Souza (1981), "Sex Bias in the Family Allocation of Food and Health Care
in Rural Bangladesh", Population and Development Review, 7(1), 55-70.
Chodorow, Nancy J. (1978), The Reproduction of Mothering: Psychoanalysis and the Sociology of
Gender, University of California Press, Berkeley/Los Angeles/London.
Clark, Alice W. (1987), "Social Demography of Excess Female Mortality in India: New Directions",
Economic and Political Weekly, Vol XXII, No.17.
_______, (ed.) (1993), Gender and Political Economy: Explorations of South Asian Systems, Oxford
University Press, New Delhi.
Clark, Alice W. and Sudha Shreeniwas (1995), "Questioning the links between maternal education
and child mortality: the case of Gujarat", paper presented at the Population Association of America
Annual Meeting, San Francisco.
Cornell, Drucilla (1995), Imaginary Domain, Routledge, New York.
Dagar, Rainuka (2007), "Rethinking Female Foeticide: Perspective and Issues" in Sex Selective Abortion
in India: Gender, Society and New Reproductive Technologies, Sage Publications, New Delhi.
Das Gupta, Monica (1987), "Selective Discrimination Against Female children in Rural Punjab, India",
Population and Development Review, 13(1), pp.77-100.
Das Gupta, Monica and P.N. Mari Bhat (1997), "Fertility Decline and Increased Manifestation of Sex
Bias in India", Population Studies, 51(3), pp.307-15.
Dasgupta, Partha (1993), An Inquiry into Well-being and Destitution, Clarendon, Oxford.
Deshpande, Sudha (1992), "Structural adjustment and feminization", Indian Journal of Labour
Economics, Vol.35, No.4.
Dreze, Jean (1997), "Government Grants and the Girl Child", Times of India, September, 29.
Dworkin, Ronald (2000), Sovereign Virtue. The Theory and Practice of Equality, Harvard University
Press, Cambridge.
____________ (1977), Taking Rights Seriously, Harvard University Press, Cambridge.
____________(1981a), "What is Equality? Part 1: Equality of Welfare," Philosophy and Public Affairs
10, pp. 185-246, reprinted in: R. Dworkin, Sovereign Virtue. The Theory and Practice of Equality,
Harvard University Press 2000, Cambridge, pp.11-64.
_____________ (1981b), "What is Equality? Part 2: Equality of Resources," Philosophy and Public
Affairs 10, pp. 283-345, reprinted in: R. Dworkin, Sovereign Virtue. The Theory and Practice of Equality,
Harvard University Press 2000, Cambridge, pp.65-119.
Dyson, T. and M. Moore (1983), "On Kinship Structure, Female Autonomy and Demographic Behaviour
in India", Population and Development Review, 9(1), pp.35-60.
42

6.9 Page 59

▲back to top


Key Note-III
George, Sabu M. and Ranbir S. Dahiya (1998), "Female Foeticide in Rural Haryana", Economic and
Political Weekly, Vol.XXXIII, No.32, Aug 8-14, pp. 2191-2198.
George, Sabu M. and P. Phavalam (2000), Female Foeticide in Tamil Nadu, Madhuri and SIRD.
George, Sabu M. and Ranbir S. Dahiya (2003), "Female Foeticide in Rural Haryana", Sex Selection:
Issues & Concerns, Cehat, Mumbsi/Pune.
Gill, P.P.S. (2002), "Abortions More Prevalent in Urban Punjab", The Tribune, 4th July, Chandigarh.
Gilligan, Carol (1982), In a Difference Voice, Harvard University Press, Harvard.
Government of India, Ministry of Health and Family Welfare (2005), Annual Report on implementation
of the Pre-Conception and Pre-Natal Diagnostic Techniques (Prohibition of Sex Selection) Act, New
Delhi.
Government of India (2003), Handbook on PNDT Act, 1994, Department of Family Welfare, GOI,
New Delhi.
Government of India, Census of India, 2001, Registrar General and Census Commissioner, Ministry of
Home Affairs, New Delhi.
Government of India, Census of India, 1991, Registrar General and Census Commissioner, Ministry of
Home Affairs, New Delhi.
Government of India (2001), National Population Policy-2000, Ministry of Health and Family Welfare,
Government of India.
Government of India, Ministry of Health and Family Welfare ( 2007), Annual Report 2006-2007, New
Delhi.
Government of India, Ministry of Health and Family Welfare ( 2007), Family Welfare Statistics in
India 2006, New Delhi.
Government of India, Ministry of Health and Family Welfare ( 2006), Bulletin of Rural Health Statistics
in India, Special Revised Edition, Infrastructure Division, New Delhi.
Government of India, Ministry of Health and Family Welfare ( 2005), RCH-II National Programme
Implementation Plan, New Delhi.
Government of India, Ministry of Health and Family Welfare ( 2005), Health Information of India,
Central Bureau of Health Intelligence, New Delhi.
Government of India, Ministry of Health and Family Welfare (2005), Mission Document on National
Rural Health Mission - 2005, New Delhi.
Government of India, Planning commission (2002), National Human development Report 2001, New
Delhi.
Gupte, Manisha, Sunita Bandewar, Hemlata Pisal (1997), "Abortion needs of women in India: a case
study of rural Maharashtra", Reproductive Health Matters, No.9, may 1997, pp.77-86.
Harriss, B. (1989), "Differential Child Mortality and Health Care in South Asia", Journal of Social
Stidies' 44, pp.2-123.
Heyer, J. (1992), "The role of dowries and daughters' marriages in the accumulation and distribution
of capital in a South Indian Community", Journal of International Development, Vol.4, No.4.
IIPS (1999), Reproductive and Child Health District Rapid Household Survey (RCH-DRHS), 1998-
1999, International Institute of population Science (IIPS), Mumbai.
43

6.10 Page 60

▲back to top


Key Note-III
IIPS (2005), Reproductive and Child Health District Level Household Survey (RCH-DLHS), 2003-04,
IIPS, Mumbai.
Images and Icons: Harnessing the Power of Mass Media to Promote Gender Equality and Reduce
Practices of Sex Selection (2006), BBC World Service Trust, New Delhi.
India Social Development Report (2006), Council for Social Development, Oxford University Press,
New Delhi.
Jaisingh, Indira (ed.) (2004), Preconception and Pre-Natal Dignostic Technique Act: A users Guide to
the Law, Iniversal Law publishing, New Delhi.
Kaur, Ravinder (2004), "Across Region Marriages: Poverty, Female Migration and Sex Ratio", Economic
and Political Weekly, June 19, pp.2595-2603.
Kishor, Sunita (1993), "May God give sons to all: mender and child v mortality in India", American
Sociological Review, No.58, pp.247-265.
Kumar, Rachel (2002), "Gender in Reproductive and Child Health Policy", Economic and Political
Weekly, August 10.
Kundu, Amitabh and Mahesh Sahu (1991), "Variation in Sex Ratio: Development Implications",
Economic and Political Weekly, Oct. 12, 1991, pp.2341-2342.
Kundu, Amitabh and Mahesh Sahu (1991), "Variation in Sex Ratio: Development Implications",
Economic and Political Weekly, Oct. 12, 1991, pp.2341-2342.
Kymlicka, Will (2002), Contemporary Political Philosophy: An Introduction, Oxford University Press,
New Delhi.
Mayer, Peter (1999), India's Falling Sex Ratios, Population and Development Review, Vol. 25, No. 2,
pp. 323-343.
Mackinnon, Catherine (1987), Feminism Unmodified: Discourses on Life and law, Harvard University
Press, Cambridge, Mass.
Mahowald, Mary Briody (2000), Gender, Women and Equality, Oxford University Press, New York.
Mallik, Rupsa (2003), "'Negative Choice' Sex Determination and Sex Selective Abortion in India",
Urdhva Mula, Vol.2, No.1, May.
Malouf, Amin (1993), First Century after Beatrice, Britain and Quartet Books.
Missing…,(2003), United Nations Population Fund, Office of the Registrar General and Census
Commissioner, India, and Ministry of Health and Family Welfare, New Delhi.
Mazumdar, Vina (1992), "Amniocentesis and Sex Selection", presented at a Round Table on 'Women,
Equality and Reproductive Technology: Some Ethical Issues' held at World Institute for Development
Economics Research, August 3-6, Helsinki.
Mazumdar, Vina (2003), "Amniocentesis and Sex Selection", Sex Selection, Issues and Concern,
published by CEHAT, Mumbai.
Menon, Nivedita (1996), "The impossibility of 'Justice': female foeticide and feminist discourse on
abortion" in Patricia Uberoi (ed.), Social Reform, Sexuality and the State, Sage Publication, New
Delhi.
__________ (2004), Recovering Subversion: Feminist Politics Beyond Law, Permanent Bllack, Delhi.
44

7 Pages 61-70

▲back to top


7.1 Page 61

▲back to top


Key Note-III
Mason, K.O. (1984), The Status of Women, Fertility and Mortality: A Review of Interrelationships,
Rockefeller Foundation, New York.
Mazumdar, Vina and Krishnaji (2001), Enduring Conundrum: India's Sex Ratio, Rainbow Publishers,
Delhi.
Mies, Maria (1991), Patriarchy and Accumulation on a World Scale: Women in the International
Division of Labour, Zed Books Ltd., London.
Miller, Barbara (1981/1991), The Endangered Sex: Neglect of Female Children in Rural North India,
Cornell University Press, Ithaca, NY.
Miller, Barbara (1984), "Daughter Neglect, Women's Work and Marriage", Medical Anthropology,
8(2), 109-125.
Mishra and Navaneetham (1991), "Decline in Sex Ratio: An alternative explanation", Economic and
Political Weekly, Dec.21, pp.2963-2964.
Mishra and Navaneetham (1992), "Decline in Sex Ratio: Alternative explanation revisited", Economic
and Political Weekly, Nov.14, pp.2510-2508.
Mitra, Ashok (1978), India's Population: Aspects of Quality and Control, Vol.1, Abhinav Publications,
New Delhi.
Nayar, Usha (1995), Doomed before Birth: Study of Declining Sex Ratio in the Age Group 0-6 Years
in Selected Districts of Punjab and Harayana, Department of Women's Studies, National Council of
Educational Reaearch and Training, New Delhi.
Nayar, Usha (2006), The Unborn Daughters of Delhi, Women's Press, New Delhi.
Nussbaum, Martha and Amartya Sen (1993), Quality of Life, Oxford University Press, New York.
Nussbaum, Martha, 2000, Women and Human Development: The Capabilities Approach, Cambridge:
Cambridge University Press.
Oldenberg, Veena Talwar (2003), Dowry Murder: The Imperial Origins of a Cultural Crime, Oxford
University Press, New Delhi.
Okin, Susan Moller (1979), Women in Western Political Thought, Princeton University Press, Princeton.
_________(1981), "Women and Making of the Sentimental Family", Philosophy and Public Affairs,
11/1, pp.65-88.
_________ (1989), Justice Gender and the Family, Basic Books, New York.
_________ (1994), "Gender Inequality and Cultural Differences", Political Theory, Vol. 22, No. 1.
(Feb., 1994), pp. 5-24.
Pande, Mrinal (2003), Stepping Out: Life and sexuality in Rural India, Penguin, New Dehi.
Patel, Tulsi (2004), "Missing Girls in India", Economic and Political Weekly, 28 Feb., pp.887-889.
Patel, Tulsi (2007), Sex Selective Abortion in India: Gender, Society and New Reproductive
Technologies, Sage Publications, New Delhi.
Patel, V. (1984), "Amniocentesis- Misuse of Modern Technology", Socialist Health Review, 1(2), pp.69-
71.
Patel, V. (2002), "Adverse Child Sex Ratio in Kerala", Economic and Political Weekly, June, pp.2124-
2125.
45

7.2 Page 62

▲back to top


Key Note-III
Patel, V. (2003), "Political Economy of Missing Girls", Missing Girls in India: Science, Gender Relations
and the Political Economy of Emotions, Workshop in Delhi, India, Department of Sociology, Delhi
School of Economics, University of Delhi.
Pateman, Carole (1987), "Feminist Critiques of the Public/Private Dichotomy" in A. Phillips (ed.),
Feminism and Equality, Oxford, Blackwell.
Rajan, Rajeswari Sunder (2003), The Scandal of the State: Women, Law, and Citizenship in Postcolonial
India, Permanent Black, Ranikhet.
Rajan, S. Irudaya (1996), "Sex ratio in Kerala: new evidences", paper presented at the workshop on
Target Free Population Policy in Kerala, held on 27th Sept., organised by Health Watch, Kerala,
Trivandrum.
Raju, Saraswati and Mahendra K. Premi (1992), "Decline in Sex Ratio: Alternative Explanation Re-
examined", Economic and Political Weekly, April 25, pp.911-912.
Raju, Saraswati (2006), "Locating Women in Social Development", India Social Development Report,
Council for Social Development, Oxford University Press, New Delhi.
Raju, Saraswati and Mahendra K. Premi (1992), "Decline in Sex Ratio: Alternative Explanation Re-
examined", Economic and Political Weekly, April 25, pp.911-912.
Rao, Mohan (2001), "Population Policies: State Approve Coercive Measures", Economic and Political
Weekly, July.
Rao, Mohan (2004), The Unheard Scream: Reproductive Health and Women's Lives in India, Zubaan,
New Delhi.
Rastogi, Preet (2006), "Future of the Girl Child", presented at Workshop on the Well Being of India's
Population: A Compendium of Perspective, Institute for Human Development, New Delhi.
Rawls, John (1971), A Theory of Justice, Harvard University Press, rev. ed. 1999, Cambridge.
RGI (Registrar General of India) (2007), Maternal Mortality in India 1997-2003, Trends, causes and
risk factors, Sample Registration System, Registrar General of India, New Delhi.
RGI (2006), Statistical Report No. 1 of 2004, Sample Registration System, Registrar General of India,
New Delhi.
RGI (2006), Population Projection for India and States 2001 to 2026 (Revised in 2006), Report of the
Technical Group on Population Projection constituted by the National Commission on Population
2006, Registrar General of India, New Delhi.
RGI (2005), SRS based abridged life tables, Registrar General of India 1999-2003, New Delhi. RGI,
2005. SRS Bulletin 2003, Sample Registration System, Registrar General of India, New Delhi.
RGI ( 2001), Primaiy Census Abstrnct, Total population: Table A -5, senes-I, Census ofIndia, Registrar
General of India, New Delhi.
RGI ( 2001), Report and Tables on Age, C-14, Census of India, Registrar General of India, New Delhi.
RGI (1999), Compendium of India's Fertility and Mortality Indicators 1971-1997, Sample Registration
System, Registrar General ofIndia, New Delhi.
Roy, Anupama (2005), Gendered Citizenship: Historical and Conceptual Explorations, Orient Longman,
New Delhi.
46

7.3 Page 63

▲back to top


Key Note-III
Sagar, Alpana D. (2007), "Social Context of the Missing Girl Child" in Sex Selective Abortion in India:
Gender, Society and New Reproductive Technologies, Sage Publications, New Delhi.
Sama Resource Group for Women and Health, "Beyond Numbers: Inplications of the Two-child Norm",
Delhi, India.
Sen, Amartya (1990), " More than 100 million women are missing", New York Review of Books,
December 20.
________ (2001), "Many Faces of Gender Equality", Frontline, Vol.18, Issue 22, Oct, 27-Nov.09.
_________ (2005), The Argumentative Indian: writing on Indian Culture, History and Identity, Penguin
Books, London.
Shiva, Mira (2002), "Skirting the Issue: The Girl Child", Seen but not Heard, VHAI, New Delhi.
Snehi, Y. (2003), "Female Infanticide and Gender in Punjab: Imperial Claims and Contemporary
discourse", Economic and political Weekly, 33(41), 4302-05.
Sudha, S. and I. Rajan (1999), "Female Demographic Disadvantage in India 1981-1991: Sex Selective
Abortions and Female Infanticide", Development and Change, 30(3), pp.585-618.
Sudha S. and S. Irudaya Rajan (2003), "Intensifying Masculinity of Sex Ratios in India: New Evidence
1981-1991", Sex Selection" Issues & Concerns, Cehat, Mumbai/Pune.
United Nations Population Fund (2001), Sex-selective Abortions and Fertility Decline: The Case of
Haryana and Punjab, UNFPA, New Delhi.
Vaasanthi (2004), Birth Right, New Delhi : Zubaan.
Verma, Vidhu (2004), "Engendering Development: Limits of Feminist Theories and Justice", Economic
and Political Weekly, December 4, pp.5246-5252.
Visaria, Leela, V. Ramachandran, B. Ganatra & S. Kalyanwala (2004), "Abortion in India: Emerging
Issues from Qualitative Studies", Economic and Political Weekly, pp.5044-5052.
Visaria, Pravin (1971), The Sex Ratio of the Population of India, Census of India 1961, Monograph
No.10, Office of the Registrar General of India, New Delhi.
Visaria, Leela, Aksh Acharya and Francis Raj (2006), "Two Child Norm: Victimising the Vulnerable",
Economic and Political Weekly, Vol. XLI, No.1, pp.41-48.
Visaria, Leela, (2008), "Improving the Child Sex Ratio: Role of Policy and Advocacy", Economic and
Political Weekly, March 22, pp.34-37.
Vishwanath, L.S. (2000), Social Structure and Female Infanticide in India, Hindustan, Delhi.
Young, Iris Marion (1990), Justice and the Politics of Difference, Princeton University Press, Princeton.
_________ (2001), "House and Home: Feminist Variations on a Theme" in Feminist Interpretations of
Martin Heidegger, Eds. Nancy J. Holland and Patricia Huntington, Pennsylvania State University Press,
University Park.
47

7.4 Page 64

▲back to top


7.5 Page 65

▲back to top


7.6 Page 66

▲back to top


State Profile - Punjab
STATE PROFILE : PUNJAB
Key Demographic, Health and RCH Indicators at a glance
General information
Area (sq. kms.)
No. of Districts
No. of Sub Districts
No. of Total Villages
No. of Towns
Demographic particulars (Census, 2001)
Population
Persons
Males
Females
Rural (%)
Urban (%)
Scheduled Castes (%)
Scheduled Tribes (%)
Elderly population (60+ years) (%)
Young people (10-24 years) (%)
Decadal Growth Rate, 1991-2001 (%)
Population density (per sq. km)
Sex Ratio (females per 1000 males)
Child Sex Ratio (0-6 years) (girls per 1000 boys)
Literacy rate (7+)
Persons
Males
Females
Work participation rate
Female work participation rate
Proportion of people living below poverty line, 2004-05
Per capita net state domestic product at current prices in rupees, 2005-06
Human Development Index (HDI), 2001 (among 28 states)
Value
Rank
Social Development Index (SDI), 2001 (among 20 major states)
Rural
Value
Rank
Urban
Value
Rank
Household amenities (%), Census 2001
Households with kutchha houses
Households with safe drinking water
Households with electricity connection
Vital indices
Crude Birth Rate (CBR), 2006, SRS
Total Fertility Rate (TFR), 2006, SRS
Age Specific Fertility Rates, 2006, SRS
15-19 years
50362
17
72
12673
157
24358999
12985045
11373954
66.1
33.9
28.9
NA
9.0
31.8
20.1
484
876
798
69.7
75.2
63.4
37.5
19.1
5.2
28605
0.686
6
57.59
3
64.49
2
5.0
97.6
91.9
17.8
2.1
14.1
51

7.7 Page 67

▲back to top


State Profile - Punjab
20-24 years
25-29 years
30-34 years
35-39 years
40-44 years
45-49 years
General Fertility Rate, 2006,SRS
Gross Reproduction Rate, 2006. SRS
Life Expectancy at Birth, 2000-2004, SRS
Crude Death Rate (CDR), 2006, SRS
Maternal Mortality Ratio (MMR), 2001-03, RGI
Under five mortality rate, 2006, SRS
Infant Mortality Rate (IMR), 2006, SRS
Neo-natal mortality rate, 2005, SRS
Early neo-natal mortality rate, 2006, SRS
Late neo-natal mortality rate, 2006, SRS
Post neo-natal mortality rate, 2006, SRS
Peri-natal mortality rate, 2006, SRS
Still birth rate, 2006, SRS
Key RCH and nutrition indicators (%)
Girls marrying below 18 years, DLHS, 2002-04
Birth order 3 and above, DLHS, 2002-04
Current use of any FP method, DLHS, 2002-04
Total unmet need, DLHS, 2002-04
Pregnant women with any ANC, DLHS, 2002-04
Pregnant women with 3 + ANCs, DLHS, 2002-04
Pregnant women received IFA tablets, DLHS, 2002-04
Safe delivery, DLHS, 2002-04
Institutional delivery, DLHS, 2002-04
Children with full immunization (12-23 months), DLHS, 2002-04
Children under 3 years who are underweight, NFHS-3, 2005-06
Children under 3 years who are stunted, NFHS-3, 2005-06
Children under 3 years who are wasted, NFHS-3, 2005-06
Children age 6-35 months who are anaemic, NFHS-3, 2005-06
Ever married women age 15-49 years who are anaemic, NFHS-3, 2005-06
Percentage of women who want more sons than daughters, NFHS-3, 2005-06
Medical/Health Infrastructures/Institutions
Community Health Centres (CHCs)
Primary Health Centres (PHCs)
Sub Centres (SCs)
Information on HIV/AIDS (%)
Women who have heard of HIV/AIDS, NFHS-3, 2005-06
Men who have heard of HIV/AIDS, NFHS-3, 2005-06
Women who know that consistent condom use can reduce the chances of getting
HIV/AIDS, NFHS-3, 2005-06
Men who know that consistent condom use can reduce the chances of getting HIV/AIDS,
NFHS-3, 2005-06
HIV+ among ANC clinics (%)
HIV+ among STD clinics (%)
Number of Integrated Counseling and Testing Centres (ICTC formerly VCTC)
Number of Prevention of Parent To Child Transmission Centres (PPTCTC)
Number of Anti Retroviral Therapy (ART) Centres
52
173.0
152.2
51.5
14.6
3.9
2.0
68.9
0.9
68.9
6.8
178
11
44
30
17
13
14
31
14
10.2
32.4
68.2
10.4
89.5
64.3
20.3
64.3
49.9
72.9
24.9
36.7
9.2
66.4
38.0
17.7
116
484
2858
73.6
91.8
53.7
81.2
0.00
0.27
33
7
2

7.8 Page 68

▲back to top


7.9 Page 69

▲back to top


District Profile - Punjab
54

7.10 Page 70

▲back to top


District Profile - Punjab
DISTRICT : GURDASPUR
General information
Area (Sq. Kms.)
Percent to total state’s area
3569
7.1
Villages
1532
Demographic particulars
(Census, 2001)
Population
Persons 2104011
Males 1113077
Females 990934
Rural (%)
74.6
Urban (%)
25.4
Scheduled Castes (%)
24.7
Scheduled Tribes (%)
-
Elderly population (60 + years) (%)
9.2
Young people (10-24 years) (%)
31.9
Decadal Growth Rate, 1991-2001 (%)
19.7
Population density (per sq. km)
590
Sex Ratio (females per 1000 males)
1991
903
2001
890
Child Sex Ratio (0-6 years)
(girls per 1000 boys)
1991
878
2001
789
Literacy rate (7+)
Persons
73.8
Males
79.8
Females
67.1
Total work participation rate
33.3
Female work participation rate
13.1
Household amenities, (%), Census 2001
Households with kutchha houses
Households with safe drinking water
Households with electricity connection
Vital rates
Crude Birth Rate, 2001
Total Fertility Rate, 2001
Infant Mortality Rate, 2001
Key RCH indicators from District
Level Household Survey, 2002-04 (%)
Girls marrying below 18 years
Birth order 3 and above
Current use of any FP Method
Total unmet need
Pregnant women with any ANC
Pregnant women with 3+ ANCs
Pregnant women received IFA tablets
Safe delivery
Institutional delivery
Children with full immunization
Medical/Health Infrastructures/ Institutions
CHCs
PHCs
Sub-Centres
Information on HIV/AIDS
HIV+ among ANC clinics (%)
HIV+ among STD clinics (%)
Number of Integrated Counseling and
Testing Centres (ICTC formerly VCTC)
Number of Prevention of Parent To Child
Transmission Centres (PPTCTC)
Number of Anti Retroviral Therapy (ART)
Centres
3.9
96.8
89.5
20.6
2.4
37
8.7
34.8
66.7
14.1
78.1
51.2
22.6
53.5
40.0
74.4
10
47
274
-
-
2
-
-
55

8 Pages 71-80

▲back to top


8.1 Page 71

▲back to top


District Profile - Punjab
56

8.2 Page 72

▲back to top


District Profile - Punjab
DISTRICT : AMRITSAR
General information
Area (Sq. Kms.)
Percent to total state’s area
5094
10.1
Villages
1185
Demographic particulars (Census, 2001)
Population
Persons 3096077
Males 1650589
Females 1445488
Rural (%)
60.5
Urban (%)
39.5
Scheduled Castes (%)
28.8
Scheduled Tribes (%)
-
Elderly population (60 + years)(%)
8.8
Young people (10-24 years) (%)
32.1
Decadal Growth Rate, 1991-2001 (%)
23.6
Population density (per sq. km)
608
Sex Ratio (females per 1000 males)
1991
873
2001
876
Child Sex Ratio (0-6 years)
(girls per 1000 boys)
1991
861
2001
790
Literacy rate (7+)
Persons
67.3
Males
72.6
Females
61.3
Total work participation rate
35.9
Female work participation rate
16.7
Household amenities, (%), Census 2001
Households with kutchha houses
Households with safe drinking water
Households with electricity connection
Vital rates
Crude Birth Rate, 2001
Total Fertility Rate, 2001
Infant Mortality Rate, 2001
Key RCH indicators from District Level
Household Survey, 2002-04 (%)
Girls marrying below 18 years
Birth order 3 and above
Current use of any FP Method
Total unmet need
Pregnant women with any ANC
Pregnant women with 3+ ANCs
Pregnant women received IFA tablets
Safe delivery
Institutional delivery
Children with full immunization
Medical/Health Infrastructures/ Institutions
CHCs
PHCs
Sub-Centres
Information on HIV/AIDS
HIV+ among ANC clinics (%)
HIV+ among STD clinics (%)
Number of Integrated Counseling and
Testing Centres (ICTC formerly VCTC)
Number of Prevention of Parent To
Child Transmission Centres (PPTCTC)
Number of Anti Retroviral Therapy
(ART) Centres
6.2
99.0
89.2
21.3
2.7
41
13.4
37.7
69.6
8.4
92.5
62.5
10.6
62.6
43.3
73.0
13
57
332
0.0
0.0
5
-
1
57

8.3 Page 73

▲back to top


District Profile - Punjab
58

8.4 Page 74

▲back to top


District Profile - Punjab
DISTRICT : KAPURTHALA
General information
Area (Sq. Kms.)
Percent to total state’s area
1633
3.2
Villages
618
Demographic particulars
(Census, 2001)
Population
Persons
Males
Females
Rural (%)
Urban (%)
Scheduled Castes (%)
Scheduled Tribes (%)
Elderly population (60 + years)(%)
Young people (10-24 years) (%)
Decadal Growth Rate, 1991-2001 (%)
Population density (per sq. km)
Sex Ratio (females per 1000 males)
1991
2001
Child Sex Ratio (0-6 years)
(girls per 1000 boys)
1991
2001
Literacy rate (7+)
Persons
Males
Females
754521
399623
354898
67.3
32.7
29.9
-
9.6
31.3
16.7
462
896
888
879
785
73.9
79.0
68.3
Total work participation rate
34.8
Female work participation rate
14.6
Household amenities, (%), Census 2001
Households with kutchha houses
Households with safe drinking water
Households with electricity connection
Vital rates
Crude Birth Rate, 2001
Total Fertility Rate, 2001
Infant Mortality Rate, 2001
Key RCH indicators from District Level
Household Survey, 2002-04 (%)
Girls marrying below 18 years
Birth order 3 and above
Current use of any FP Method
Total unmet need
Pregnant women with any ANC
Pregnant women with 3+ ANCs
Pregnant women received IFA tablets
Safe delivery
Institutional delivery
Children with full immunization
Medical/Health Infrastructures/ Institutions
CHCs
PHCs
Sub-Centres
Information on HIV/AIDS
HIV+ among ANC clinics (%)
HIV+ among STD clinics (%)
Number of Integrated Counseling and
Testing Centres (ICTC formerly VCTC)
Number of Prevention of Parent To
Child Transmission Centres (PPTCTC)
Number of Anti Retroviral Therapy
(ART) Centres
1.9
99.1
95.2
18.9
2.2
37
5.1
33.2
65.6
14.3
96.7
68.4
26.0
65.3
48.0
81.6
5
14
88
-
-
1
-
-
59

8.5 Page 75

▲back to top


District Profile - Punjab
60

8.6 Page 76

▲back to top


District Profile - Punjab
DISTRICT : JALANDHAR
General information
Area (Sq. Kms.)
Percent to total state’s area
2634
5.2
Villages
934
Demographic particulars (Census, 2001)
Population
Persons 1962700
Males 1040177
Females 922523
Rural (%)
52.5
Urban (%)
47.5
Scheduled Castes (%)
37.7
Scheduled Tribes (%)
-
Elderly population (60 + years)(%)
9.2
Young people (10-24 years) (%)
31.8
Decadal Growth Rate, 1991-2001 (%)
19.0
Population density (per sq. km)
745
Sex Ratio (females per 1000 males)
1991
897
2001
887
Child Sex Ratio (0-6 years)
(girls per 1000 boys)
1991
886
2001
806
Literacy rate (7+)
Persons
78.0
Males
82.5
Females
73.1
Total work participation rate
34.5
Female work participation rate
12.8
Household amenities, (%), Census 2001
Households with kutchha houses
Households with safe drinking water
Households with electricity connection
Vital rates
Crude Birth Rate, 2001
Total Fertility Rate, 2001
Infant Mortality Rate, 2001
Key RCH indicators from District Level
Household Survey, 2002-04 (%)
Girls marrying below 18 years
Birth order 3 and above
Current use of any FP Method
Total unmet need
Pregnant women with any ANC
Pregnant women with 3+ ANCs
Pregnant women received IFA tablets
Safe delivery
Institutional delivery
Children with full immunization
Medical/Health Infrastructures/ Institutions
CHCs
PHCs
Sub-Centres
Information on HIV/AIDS
HIV+ among ANC clinics (%)
HIV+ among STD clinics (%)
Number of Integrated Counseling and
Testing Centres (ICTC formerly VCTC)
Number of Prevention of Parent
To Child Transmission Centres (PPTCTC)
Number of Anti Retroviral Therapy
(ART) Centres
1.9
98.8
96.8
17.8
2.1
36
5.3
28.4
67.1
12.8
97.0
83.4
29.9
76.2
61.9
77.5
7
30
195
-
-
1
-
1
61

8.7 Page 77

▲back to top


District Profile - Punjab
62

8.8 Page 78

▲back to top


District Profile - Punjab
DISTRICT : HOSHIARPUR
General information
Area (Sq. Kms.)
Percent to total state’s area
3364
6.7
Villages
1386
Demographic particulars
(Census, 2001)
Population
Persons 1480736
Males 765132
Females 715604
Rural (%)
80.3
Urban (%)
19.7
Scheduled Castes (%)
34.3
Scheduled Tribes (%)
-
Elderly population (60 + years)(%)
10.7
Young people (10-24 years) (%)
31.3
Decadal Growth Rate, 1991-2001 (%)
14.0
Population density (per sq. km)
440
Sex Ratio (females per 1000 males)
1991
924
2001
935
Child Sex Ratio (0-6 years)
(girls per 1000 boys)
1991
887
2001
812
Literacy rate (7+)
Persons
81.0
Males
86.5
Females
75.3
Total work participation rate
34.7
Female work participation rate
17.6
Household amenities, (%), Census 2001
Households with kutchha houses
Households with safe drinking water
Households with electricity connection
Vital rates
Crude Birth Rate, 2001
Total Fertility Rate, 2001
Infant Mortality Rate, 2001
Key RCH indicators from District Level
Household Survey, 2002-04 (%)
Girls marrying below 18 years
Birth order 3 and above
Current use of any FP Method
Total unmet need
Pregnant women with any ANC
Pregnant women with 3+ ANCs
Pregnant women received IFA tablets
Safe delivery
Institutional delivery
Children with full immunization
Medical/Health Infrastructures/ Institutions
CHCs
PHCs
Sub-Centres
Information on HIV/AIDS
HIV+ among ANC clinics (%)
HIV+ among STD clinics (%)
Number of Integrated Counseling and
Testing Centres (ICTC formerly VCTC)
Number of Prevention of Parent
To Child Transmission Centres (PPTCTC)
Number of Anti Retroviral Therapy
(ART) Centres
2.4
96.6
94.7
19.2
2.3
46
1.6
35.8
64.7
14.3
99.1
70.7
16.1
61.9
33.2
85.7
8
37
234
0.75
-
1
-
-
63

8.9 Page 79

▲back to top


District Profile - Punjab
64

8.10 Page 80

▲back to top


District Profile - Punjab
DISTRICT : NAWANSHAHR
General information
Area (Sq. Kms.)
Percent to total state’s area
1266
2.5
Villages
465
Demographic particulars
(Census, 2001)
Population
Persons
Males
Females
Rural (%)
Urban (%)
Scheduled Castes (%)
Scheduled Tribes (%)
Elderly population (60 + years)(%)
Young people (10-24 years) (%)
Decadal Growth Rate, 1991-2001 (%)
Population density (per sq. km)
Sex Ratio (females per 1000 males)
1991
2001
Child Sex Ratio (0-6 years)
(girls per 1000 boys)
1991
2001
Literacy rate (7+)
Persons
Males
Females
587468
306902
280566
86.2
13.8
40.5
-
10.7
31.8
10.6
464
900
914
894
808
76.4
82.9
69.5
Total work participation rate
44.9
Female work participation rate
33.2
Household amenities, (%), Census 2001
Households with kutchha houses
Households with safe drinking water
Households with electricity connection
Vital rates
Crude Birth Rate, 2001
Total Fertility Rate, 2001
Infant Mortality Rate, 2001
Key RCH indicators from District Level
Household Survey, 2002-04 (%)
Girls marrying below 18 years
Birth order 3 and above
Current use of any FP Method
Total unmet need
Pregnant women with any ANC
Pregnant women with 3+ ANCs
Pregnant women received IFA tablets
Safe delivery
Institutional delivery
Children with full immunization
Medical/Health Infrastructures/ Institutions
CHCs
PHCs
Sub-Centres
Information on HIV/AIDS
HIV+ among ANC clinics (%)
HIV+ among STD clinics (%)
Number of Integrated Counseling and
Testing Centres (ICTC formerly VCTC)
Number of Prevention of Parent To Child
Transmission Centres (PPTCTC)
Number of Anti Retroviral Therapy (ART)
Centres
1.2
97.8
95.5
18.3
2.2
37
0.8
24.5
62.3
17.2
96.4
74.1
29.8
69.3
47.8
87.6
3
16
95
-
-
1
-
-
65

9 Pages 81-90

▲back to top


9.1 Page 81

▲back to top


District Profile - Punjab
66

9.2 Page 82

▲back to top


District Profile - Punjab
DISTRICT : RUPNAGAR
General information
Area (Sq. Kms.)
Percent to total state’s area
2056
4.1
Villages
864
Demographic particulars
(Census, 2001)
Population
Persons 1116108
Males 596582
Females 519526
Rural (%)
67.5
Urban (%)
32.5
Scheduled Castes (%)
23.9
Scheduled Tribes (%)
-
Elderly population (60 + years)(%)
9.3
Young people (10-24 years) (%)
30.8
Decadal Growth Rate, 1991-2001 (%)
24.1
Population density (per sq. km)
543
Sex Ratio (females per 1000 males)
1991
870
2001
871
Child Sex Ratio (0-6 years)
(girls per 1000 boys)
1991
885
2001
794
Literacy rate (7+)
Persons
78.1
Males
84.0
Females
71.4
Total work participation rate
39.2
Female work participation rate
23.8
Household amenities, (%), Census 2001
Households with kutchha houses
Households with safe drinking water
Households with electricity connection
Vital rates
Crude Birth Rate, 2001
Total Fertility Rate, 2001
Infant Mortality Rate, 2001
Key RCH indicators from District Level
Household Survey, 2002-04 (%)
Girls marrying below 18 years
Birth order 3 and above
Current use of any FP Method
Total unmet need
Pregnant women with any ANC
Pregnant women with 3+ ANCs
Pregnant women received IFA tablets
Safe delivery
Institutional delivery
Children with full immunization
Medical/Health Infrastructures/ Institutions
CHCs
PHCs
Sub-Centres
Information on HIV/AIDS
HIV+ among ANC clinics (%)
HIV+ among STD clinics (%)
Number of Integrated Counseling and Testing
Centres (ICTC formerly VCTC)
Number of Prevention of Parent To Child
Transmission Centres (PPTCTC)
Number of Anti Retroviral Therapy (ART)
Centres
3.7
91.8
94.2
20.0
2.4
32
2.2
22.9
67.3
10.8
97.9
76.4
27.0
69.9
56.2
91.6
5
23
128
-
-
-
-
-
67

9.3 Page 83

▲back to top


District Profile - Punjab
68

9.4 Page 84

▲back to top


District Profile - Punjab
DISTRICT : FATEHGARH SAHIB
General information
Area (Sq. Kms.)
Percent to total state’s area
1180
2.3
Villages
442
Demographic particulars
(Census, 2001)
Population
Persons
Males
Females
Rural (%)
Urban (%)
Scheduled Castes (%)
Scheduled Tribes (%)
Elderly population (60 + years)(%)
Young people (10-24 years) (%)
Decadal Growth Rate, 1991-2001 (%)
Population density (per sq. km)
Sex Ratio (females per 1000 males)
1991
2001
Child Sex Ratio (0-6 years)
(girls per 1000 boys)
1991
2001
Literacy rate (7+)
Persons
Males
Females
538041
290137
247904
71.9
28.1
30.7
-
9.2
31.7
18.3
456
871
854
875
766
73.6
78.3
68.3
Total work participation rate
38.3
Female work participation rate
18.9
Household amenities, (%), Census 2001
Households with kutchha houses
Households with safe drinking water
Households with electricity connection
Vital rates
Crude Birth Rate, 2001
Total Fertility Rate, 2001
Infant Mortality Rate, 2001
Key RCH indicators from District Level
Household Survey, 2002-04 (%)
Girls marrying below 18 years
Birth order 3 and above
Current use of any FP Method
Total unmet need
Pregnant women with any ANC
Pregnant women with 3+ ANCs
Pregnant women received IFA tablets
Safe delivery
Institutional delivery
Children with full immunization
Medical/Health Infrastructures/ Institutions
CHCs
PHCs
Sub-Centres
Information on HIV/AIDS
HIV+ among ANC clinics (%)
HIV+ among STD clinics (%)
Number of Integrated Counseling and
Testing Centres (ICTC formerly VCTC)
Number of Prevention of Parent To Child
Transmission Centres (PPTCTC)
Number of Anti Retroviral Therapy (ART)
Centres
2.0
98.0
96.6
19.2
2.3
43
4.6
29.2
75.2
7.3
98.0
81.6
23.9
70.6
62.4
87.5
3
14
67
-
-
1
-
-
69

9.5 Page 85

▲back to top


District Profile - Punjab
70

9.6 Page 86

▲back to top


District Profile - Punjab
DISTRICT : LUDHIANA
General information
Area (Sq. Kms.)
Percent to total state’s area
3767
7.5
Villages
897
Demographic particulars
(Census, 2001)
Population
Persons 3032831
Males 1662716
Females 1370115
Rural (%)
44.2
Urban (%)
55.8
Scheduled Castes (%)
25.0
Scheduled Tribes (%)
-
Elderly population (60 + years)(%)
8.1
Young people (10-24 years) (%)
32.1
Decadal Growth Rate, 1991-2001 (%)
24.9
Population density (per sq. km)
805
Sex Ratio (females per 1000 males)
1991
844
2001
824
Child Sex Ratio (0-6 years)
(girls per 1000 boys)
1991
878
2001
817
Literacy rate (7+)
Persons
76.5
Males
80.3
Females
71.9
Total work participation rate
37.9
Female work participation rate
16.5
Household amenities, (%), Census 2001
Households with kutchha houses
Households with safe drinking water
Households with electricity connection
Vital rates
Crude Birth Rate, 2001
Total Fertility Rate, 2001
Infant Mortality Rate, 2001
Key RCH indicators from District Level
Household Survey, 2002-04 (%)
Girls marrying below 18 years
Birth order 3 and above
Current use of any FP Method
Total unmet need
Pregnant women with any ANC
Pregnant women with 3+ ANCs
Pregnant women received IFA tablets
Safe delivery
Institutional delivery
Children with full immunization
Medical/Health Infrastructures/ Institutions
CHCs
PHCs
Sub-Centres
Information on HIV/AIDS
HIV+ among ANC clinics (%)
HIV+ among STD clinics (%)
Number of Integrated Counseling and Testing
Centres (ICTC formerly VCTC)
Number of Prevention of Parent To Child
Transmission Centres (PPTCTC)
Number of Anti Retroviral Therapy (ART)
Centres
2.4
99.1
95.5
19.1
2.3
40
8.8
31.2
70.6
7.9
95.9
73.3
23.1
75.2
59.1
85.1
10
37
227
0.25
-
5
-
-
71

9.7 Page 87

▲back to top


District Profile - Punjab
72

9.8 Page 88

▲back to top


District Profile - Punjab
DISTRICT : MOGA
General information
Area (Sq. Kms.)
Percent to total state’s area
2216
4.4
Villages
321
Demographic particulars
(Census, 2001)
Population
Persons
Males
Females
Rural (%)
Urban (%)
Scheduled Castes (%)
Scheduled Tribes (%)
Elderly population (60 + years)(%)
Young people (10-24 years) (%)
Decadal Growth Rate, 1991-2001 (%)
Population density (per sq. km)
Sex Ratio (females per 1000 males)
1991
2001
Child Sex Ratio (0-6 years)
(girls per 1000 boys)
1991
2001
Literacy rate (7+)
Persons
Males
Females
894854
474139
420715
80.0
20.0
31.8
-
10.2
31.8
15.0
404
884
887
867
818
63.5
68.0
58.5
Total work participation rate
40.1
Female work participation rate
24.5
Household amenities, (%), Census 2001
Households with kutchha houses
Households with safe drinking water
Households with electricity connection
Vital rates
Crude Birth Rate, 2001
Total Fertility Rate, 2001
Infant Mortality Rate, 2001
Key RCH indicators from District Level
Household Survey, 2002-04 (%)
Girls marrying below 18 years
Birth order 3 and above
Current use of any FP Method
Total unmet need
Pregnant women with any ANC
Pregnant women with 3+ ANCs
Pregnant women received IFA tablets
Safe delivery
Institutional delivery
Children with full immunization
Medical/Health Infrastructures/ Institutions
CHCs
PHCs
Sub-Centres
Information on HIV/AIDS
HIV+ among ANC clinics (%)
HIV+ among STD clinics (%)
Number of Integrated Counseling and
Testing Centres (ICTC formerly VCTC)
Number of Prevention of Parent To Child
Transmission Centres (PPTCTC)
Number of Anti Retroviral Therapy (ART)
Centres
5.0
97.5
91.7
19.5
2.4
41
7.5
31.0
65.8
12.6
84.3
67.0
28.8
72.9
60.4
57.2
5
23
131
-
-
2
-
-
73

9.9 Page 89

▲back to top


District Profile - Punjab
74

9.10 Page 90

▲back to top


District Profile - Punjab
DISTRICT : FIROZPUR
General information
Area (Sq. Kms.)
Percent to total state’s area
5300
10.5
Villages
968
Demographic particulars
(Census, 2001)
Population
Persons 1746107
Males 926224
Females 819883
Rural (%)
74.2
Urban (%)
25.8
Scheduled Castes (%)
22.8
Scheduled Tribes (%)
-
Elderly population (60 + years)(%)
7.9
Young people (10-24 years) (%)
32.4
Decadal Growth Rate, 1991-2001 (%)
20.5
Population density (per sq. km)
329
Sex Ratio (females per 1000 males)
1991
895
2001
885
Child Sex Ratio (0-6 years)
(girls per 1000 boys)
1991
886
2001
822
Literacy rate (7+)
Persons
60.7
Males
68.7
Females
51.7
Total work participation rate
37.1
Female work participation rate
18.9
Household amenities, (%), Census 2001
Households with kutchha houses
Households with safe drinking water
Households with electricity connection
Vital rates
Crude Birth Rate, 2001
Total Fertility Rate, 2001
Infant Mortality Rate, 2001
Key RCH indicators from District Level
Household Survey, 2002-04 (%)
Girls marrying below 18 years
Birth order 3 and above
Current use of any FP Method
Total unmet need
Pregnant women with any ANC
Pregnant women with 3+ ANCs
Pregnant women received IFA tablets
Safe delivery
Institutional delivery
Children with full immunization
Medical/Health Infrastructures/ Institutions
CHCs
PHCs
Sub-Centres
Information on HIV/AIDS
HIV+ among ANC clinics (%)
HIV+ among STD clinics (%)
Number of Integrated Counseling and
Testing Centres (ICTC formerly VCTC)
Number of Prevention of Parent To Child
Transmission Centres (PPTCTC)
Number of Anti Retroviral Therapy (ART)
Centres
21.7
96.7
85.7
23.3
2.8
47
21.7
36.7
66.2
8.8
63.3
41.8
7.6
53.9
38.7
50.2
8
37
234
0.00
-
2
-
-
75

10 Pages 91-100

▲back to top


10.1 Page 91

▲back to top


District Profile - Punjab
76

10.2 Page 92

▲back to top


District Profile - Punjab
DISTRICT : MUKTSAR
General information
Area (Sq. Kms.)
Percent to total state’s area
2615
5.2
Villages
234
Demographic particulars
(Census, 2001)
Population
Persons
Males
Females
Rural (%)
Urban (%)
Scheduled Castes (%)
Scheduled Tribes (%)
Elderly population (60 + years)(%)
Young people (10-24 years) (%)
Decadal Growth Rate, 1991-2001 (%)
Population density (per sq. km)
Sex Ratio (females per 1000 males)
1991
2001
Child Sex Ratio (0-6 years)
(girls per 1000 boys)
1991
2001
Literacy rate (7+)
Persons
Males
Females
777493
411217
366276
74.5
25.5
37.8
-
9.1
31.8
18.8
297
880
891
858
811
58.2
65.4
50.3
Total work participation rate
39.8
Female work participation rate
22.8
Household amenities, (%), Census 2001
Households with kutchha houses
Households with safe drinking water
Households with electricity connection
Vital rates
Crude Birth Rate, 2001
Total Fertility Rate, 2001
Infant Mortality Rate, 2001
Key RCH indicators from District Level
Household Survey, 2002-04 (%)
Girls marrying below 18 years
Birth order 3 and above
Current use of any FP Method
Total unmet need
Pregnant women with any ANC
Pregnant women with 3+ ANCs
Pregnant women received IFA tablets
Safe delivery
Institutional delivery
Children with full immunization
Medical/Health Infrastructures/ Institutions
CHCs
PHCs
Sub-Centres
Information on HIV/AIDS
HIV+ among ANC clinics (%)
HIV+ among STD clinics (%)
Number of Integrated Counseling and
Testing Centres (ICTC formerly VCTC)
Number of Prevention of Parent To Child
Transmission Centres (PPTCTC)
Number of Anti Retroviral Therapy (ART)
Centres
12.0
97.2
86.4
20.8
2.6
48
17.8
33.9
68.3
7.8
92.1
65.5
12.0
63.2
45.1
45.7
5
16
102
-
-
-
-
-
77

10.3 Page 93

▲back to top


District Profile - Punjab
78

10.4 Page 94

▲back to top


District Profile - Punjab
DISTRICT : FARIDKOT
General information
Area (Sq. Kms.)
Percent to total state’s area
1469
2.9
Villages
163
Demographic particulars
(Census, 2001)
Population
Persons
Males
Females
Rural (%)
Urban (%)
Scheduled Castes (%)
Scheduled Tribes (%)
Elderly population (60 + years)(%)
Young people (10-24 years) (%)
Decadal Growth Rate, 1991-2001 (%)
Population density (per sq. km)
Sex Ratio (females per 1000 males)
1991
2001
Child Sex Ratio (0-6 years)
(girls per 1000 boys)
1991
2001
Literacy rate (7+)
Persons
Males
Females
550892
292596
258296
64.9
35.1
36.2
-
9.1
31.5
21.1
375
883
883
865
812
62.0
68.1
55.0
Total work participation rate
38.1
Female work participation rate
20.6
Household amenities, (%), Census 2001
Households with kutchha houses
Households with safe drinking water
Households with electricity connection
Vital rates
Crude Birth Rate, 2001
Total Fertility Rate, 2001
Infant Mortality Rate, 2001
Key RCH indicators from District Level
Household Survey, 2002-04 (%)
Girls marrying below 18 years
Birth order 3 and above
Current use of any FP Method
Total unmet need
Pregnant women with any ANC
Pregnant women with 3+ ANCs
Pregnant women received IFA tablets
Safe delivery
Institutional delivery
Children with full immunization
Medical/Health Infrastructures/ Institutions
CHCs
PHCs
Sub-Centres
Information on HIV/AIDS
HIV+ among ANC clinics (%)
HIV+ among STD clinics (%)
Number of Integrated Counseling and
Testing Centres (ICTC formerly VCTC)
Number of Prevention of Parent To Child
Transmission Centres (PPTCTC)
Number of Anti Retroviral Therapy (ART)
Centres
6.7
97.7
90.1
19.5
2.4
45
16.2
29.1
67.2
11.5
89.1
67.6
19.1
62.6
52.0
55.5
1
10
61
0.00
-
2
-
-
79

10.5 Page 95

▲back to top


District Profile - Punjab
80

10.6 Page 96

▲back to top


District Profile - Punjab
DISTRICT : BATHINDA
General information
Area (Sq. Kms.)
Percent to total state’s area
3382
6.7
Villages
280
Demographic particulars
(Census, 2001)
Population
Persons 1183295
Males 632809
Females 550486
Rural (%)
70.3
Urban (%)
29.7
Scheduled Castes (%)
30.0
Scheduled Tribes (%)
-
Elderly population (60 + years)(%)
8.8
Young people (10-24 years) (%)
32.1
Decadal Growth Rate, 1991-2001 (%)
20.1
Population density (per sq. km)
350
Sex Ratio (females per 1000 males)
1991
884
2001
870
Child Sex Ratio (0-6 years)
(girls per 1000 boys)
1991
860
2001
785
Literacy rate (7+)
Persons
61.2
Males
67.8
Females
53.7
Total work participation rate
42.3
Female work participation rate
27.5
Household amenities, (%), Census 2001
Households with kutchha houses
Households with safe drinking water
Households with electricity connection
Vital rates
Crude Birth Rate, 2001
Total Fertility Rate, 2001
Infant Mortality Rate, 2001
Key RCH indicators from District Level
Household Survey, 2002-04 (%)
Girls marrying below 18 years
Birth order 3 and above
Current use of any FP Method
Total unmet need
Pregnant women with any ANC
Pregnant women with 3+ ANCs
Pregnant women received IFA tablets
Safe delivery
Institutional delivery
Children with full immunization
Medical/Health Infrastructures/ Institutions
CHCs
PHCs
Sub-Centres
Information on HIV/AIDS
HIV+ among ANC clinics (%)
HIV+ among STD clinics (%)
Number of Integrated Counseling and
Testing Centres (ICTC formerly VCTC)
Number of Prevention of Parent To Child
Transmission Centres (PPTCTC)
Number of Anti Retroviral Therapy (ART)
Centres
5.7
97.5
89.0
19.6
2.4
50
12.3
29.9
70.2
8.0
93.1
59.6
23.7
65.6
49.0
67.4
6
24
140
-
0.00
1
-
-
81

10.7 Page 97

▲back to top


District Profile - Punjab
82

10.8 Page 98

▲back to top


District Profile - Punjab
DISTRICT : MANSA
General information
Area (Sq. Kms.)
Percent to total state’s area
2169
4.3
Villages
238
Demographic particulars
(Census, 2001)
Population
Persons
Males
Females
Rural (%)
Urban (%)
Scheduled Castes (%)
Scheduled Tribes (%)
Elderly population (60 + years)(%)
Young people (10-24 years) (%)
Decadal Growth Rate, 1991-2001 (%)
Population density (per sq. km)
Sex Ratio (females per 1000 males)
1991
2001
Child Sex Ratio (0-6 years)
(girls per 1000 boys)
1991
2001
Literacy rate (7+)
Persons
Males
Females
688758
366446
322312
79.3
20.7
30.3
-
9.3
31.4
19.9
318
873
880
873
782
52.4
58.9
45.2
Total work participation rate
40.9
Female work participation rate
25.6
Household amenities, (%), Census 2001
Households with kutchha houses
Households with safe drinking water
Households with electricity connection
Vital rates
Crude Birth Rate, 2001
Total Fertility Rate, 2001
Infant Mortality Rate, 2001
Key RCH indicators from District Level
Household Survey, 2002-04 (%)
Girls marrying below 18 years
Birth order 3 and above
Current use of any FP Method
Total unmet need
Pregnant women with any ANC
Pregnant women with 3+ ANCs
Pregnant women received IFA tablets
Safe delivery
Institutional delivery
Children with full immunization
Medical/Health Infrastructures/ Institutions
CHCs
PHCs
Sub-Centres
Information on HIV/AIDS
HIV+ among ANC clinics (%)
HIV+ among STD clinics (%)
Number of Integrated Counseling and Testing
Centres (ICTC formerly VCTC)
Number of Prevention of Parent To Child
Transmission Centres (PPTCTC)
Number of Anti Retroviral Therapy (ART)
Centres
5.4
97.5
84.5
21.9
2.7
57
18.4
31.5
69.5
7.1
90.3
58.7
17.5
57.5
46.3
54.1
4
16
103
-
-
1
-
-
83

10.9 Page 99

▲back to top


District Profile - Punjab
84

10.10 Page 100

▲back to top


District Profile - Punjab
DISTRICT : SANGRUR
General information
Area (Sq. Kms.)
Percent to total state’s area
5021
10.0
Villages
697
Demographic particulars
(Census, 2001)
Population
Persons 2000173
Males 1069289
Females 930884
Rural (%)
70.8
Urban (%)
29.2
Scheduled Castes (%)
27.6
Scheduled Tribes (%)
-
Elderly population (60 + years)(%)
9.4
Young people (10-24 years) (%)
31.6
Decadal Growth Rate, 1991-2001 (%)
18.7
Population density (per sq. km)
398
Sex Ratio (females per 1000 males)
1991
870
2001
871
Child Sex Ratio (0-6 years)
(girls per 1000 boys)
1991
873
2001
786
Literacy rate (7+)
Persons
60.0
Males
65.8
Females
53.4
Total work participation rate
40.7
Female work participation rate
24.6
Household amenities, (%), Census 2001
Households with kutchha houses
Households with safe drinking water
Households with electricity connection
Vital rates
Crude Birth Rate, 2001
Total Fertility Rate, 2001
Infant Mortality Rate, 2001
Key RCH indicators from District Level
Household Survey, 2002-04 (%)
Girls marrying below 18 years
Birth order 3 and above
Current use of any FP Method
Total unmet need
Pregnant women with any ANC
Pregnant women with 3+ ANCs
Pregnant women received IFA tablets
Safe delivery
Institutional delivery
Children with full immunization
Medical/Health Infrastructures/ Institutions
CHCs
PHCs
Sub-Centres
Information on HIV/AIDS
HIV+ among ANC clinics (%)
HIV+ among STD clinics (%)
Number of Integrated Counseling and
Testing Centres (ICTC formerly VCTC)
Number of Prevention of Parent To Child
Transmission Centres (PPTCTC)
Number of Anti Retroviral Therapy (ART)
Centres
1.8
97.9
91.9
20.6
2.5
58
9.6
30.9
66.5
10.7
87.2
59.5
23.0
65.2
50.7
73.5
10
45
263
0.00
-
2
-
-
85

11 Pages 101-110

▲back to top


11.1 Page 101

▲back to top


District Profile - Punjab
86

11.2 Page 102

▲back to top


District Profile - Punjab
DISTRICT : PATIALA
General information
Area (Sq. Kms.)
Percent to total state’s area
3627
7.2
Villages
1054
Demographic particulars
(Census, 2001)
Population
Persons 1844934
Males 987390
Females 857544
Rural (%)
65.1
Urban (%)
34.9
Scheduled Castes (%)
23.1
Scheduled Tribes (%)
-
Elderly population (60 + years)(%)
8.4
Young people (10-24 years) (%)
32.3
Decadal Growth Rate, 1991-2001 (%)
20.7
Population density (per sq. km)
509
Sex Ratio (females per 1000 males)
1991
882
2001
868
Child Sex Ratio (0-6 years)
(girls per 1000 boys)
1991
869
2001
777
Literacy rate (7+)
Persons
69.8
Males
75.9
Females
62.9
Total work participation rate
37.0
Female work participation rate
17.8
Household amenities, (%), Census 2001
Households with kutchha houses
Households with safe drinking water
Households with electricity connection
Vital rates
Crude Birth Rate, 2001
Total Fertility Rate, 2001
Infant Mortality Rate, 2001
Key RCH indicators from District Level
Household Survey, 2002-04 (%)
Girls marrying below 18 years
Birth order 3 and above
Current use of any FP Method
Total unmet need
Pregnant women with any ANC
Pregnant women with 3+ ANCs
Pregnant women received IFA tablets
Safe delivery
Institutional delivery
Children with full immunization
Medical/Health Infrastructures/ Institutions
CHCs
PHCs
Sub-Centres
Information on HIV/AIDS
HIV+ among ANC clinics (%)
HIV+ among STD clinics (%)
Number of Integrated Counseling and
Testing Centres (ICTC formerly VCTC)
Number of Prevention of Parent To Child
Transmission Centres (PPTCTC)
Number of Anti Retroviral Therapy (ART)
Centres
2.9
96.8
92.8
19.6
2.3
42
12.2
31.3
74.1
8.1
95.3
69.7
24.7
61.4
57.8
79.1
10
37
207
-
0.80
6
-
-
87

11.3 Page 103

▲back to top


11.4 Page 104

▲back to top


11.5 Page 105

▲back to top


State Profile - Haryana
STATE PROFILE : HARYANA
Key Demographic, Health and RCH Indicators at a glance
General information
Area (sq. kms.)
No. of Districts
No. of Sub Districts
No. of Total Villages
No. of Towns
Demographic particulars (Census, 2001)
Population
Persons
Males
Females
Rural (%)
Urban (%)
Scheduled Castes (%)
Scheduled Tribes (%)
Elderly population (60+ years) (%)
Young people (10-24 years) (%)
Decadal Growth Rate, 1991-2001 (%)
Population density (per sq. km)
Sex Ratio (females per 1000 males)
Child Sex Ratio (0-6 years) (girls per 1000 boys)
Literacy rate (7+)
Persons
Males
Females
Work participation rate
Female work participation rate
Proportion of people living below poverty line, 2004-05
Per capita net state domestic product at current prices in rupees, 2005-06
Human Development Index (HDI), 2001 (among 28 states)
Value
Rank
Social Development Index (SDI), 2001 (among 20 major states)
Rural
Value
Rank
Urban
Value
Rank
Household amenities (%), Census 2001
Households with kutchha houses
Households with safe drinking water
Households with electricity connection
Vital indices
Crude Birth Rate (CBR), 2006, SRS
Total Fertility Rate (TFR), 2006, SRS
Age Specific Fertility Rates, 2006, SRS
15-19 years
44212
19
67
6955
106
21144564
11363953
9780611
71.1
28.9
19.3
NA
7.5
32.7
28.4
478
861
819
67.9
78.5
55.7
39.6
27.2
9.9
29887
0.633
14
44.85
5
48.83
10
6.0
86.1
82.9
23.9
2.7
37.2
91

11.6 Page 106

▲back to top


State Profile - Haryana
20-24 years
25-29 years
30-34 years
35-39 years
40-44 years
45-49 years
General Fertility Rate, 2006,SRS
Gross Reproduction Rate, 2006, SRS
Life Expectancy at Birth, 2000-2004, SRS
Crude Death Rate (CDR), 2006, SRS
Maternal Mortality Ratio (MMR), 2001-03, RGI
Under five mortality rate, 2006, SRS
Infant Mortality Rate (IMR), 2006, SRS
Neo-natal mortality rate, 2006, SRS
Early neo-natal mortality rate, 2006, SRS
Late neo-natal mortality rate, 2006, SRS
Post neo-natal mortality rate, 2006, SRS
Peri-natal mortality rate, 2006, SRS
Still birth rate, 2006, SRS
Key RCH and nutrition indicators (%)
Girls marrying below 18 years, DLHS, 2002-04
Birth order 3 and above, DLHS, 2002-04
Current use of any FP method, DLHS, 2002-04
Total unmet need, DLHS, 2002-04
Pregnant women with any ANC, DLHS, 2002-04
Pregnant women with 3 + ANCs, DLHS, 2002-04
Pregnant women received IFA tablets, DLHS, 2002-04
Safe delivery, DLHS, 2002-04
Institutional delivery, DLHS, 2002-04
Children with full immunization (12-23 months), DLHS, 2002-04
Children under 3 years who are underweight, NFHS-3, 2005-06
Children under 3 years who are stunted, NFHS-3, 2005-06
Children under 3 years who are wasted, NFHS-3, 2005-06
Children age 6-35 months who are anaemic, NFHS-3, 2005-06
Ever married women age 15-49 years who are anaemic, NFHS-3, 2005-06
Percentage of women who want more sons than daughters, NFHS-3, 2005-06
Medical/Health Infrastructures/Institutions
Community Health Centres (CHCs)
Primary Health Centres (PHCs)
Sub Centres (SCs)
Information on HIV/AIDS (%)
Women who have heard of HIV/AIDS, NFHS-3, 2005-06
Men who have heard of HIV/AIDS, NFHS-3, 2005-06
Women who know that consistent condom use can reduce the chances of getting HIV/AIDS,
NFHS-3, 2005-06
Men who know that consistent condom use can reduce the chances of getting HIV/AIDS,
NFHS-3, 2005-06
HIV+ among ANC clinics (%)
HIV+ among STD clinics (%)
Number of Integrated Counseling and Testing Centres (ICTC formerly VCTC)
Number of Prevention of Parent To Child Transmission Centres (PPTCTC)
Number of Anti Retroviral Therapy (ART) Centres
92
254.9
164.9
57.9
21.4
7.9
1.9
97.8
1.3
65.6
6.5
162
18
57
34
22
12
23
29
7
27.8
38.4
60.3
14.7
87.6
48.5
17.1
43.2
35.1
59.2
39.6
45.7
19.1
72.3
56.1
22.0
72
408
2433
64.1
87.2
46.0
79.2
0.13
0.81
60
29
1

11.7 Page 107

▲back to top


11.8 Page 108

▲back to top


District Profile - Haryana
94

11.9 Page 109

▲back to top


District Profile - Haryana
DISTRICT : PANCHKULA
General information
Area (Sq. Kms.)
898
Percent to total state’s area
2.0
Villages
224
Demographic particulars
(Census, 2001)
Population
Persons
Males
Females
Rural (%)
Urban (%)
Scheduled Castes (%)
Scheduled Tribes (%)
Elderly population (60 + years)(%)
Young people (10-24 years) (%)
Decadal Growth Rate, 1991-2001 (%)
Population density (per sq. km)
Sex Ratio (females per 1000 males)
1991
2001
Child Sex Ratio (0-6 years)
(girls per 1000 boys)
1991
Literacy rate (7+)
2001
Persons
Males
Females
468411
256939
211472
55.5
44.5
15.5
-
7.1
30.6
50.9
522
839
823
892
829
74.0
80.9
65.7
Total work participation rate
38.1
Female work participation rate
18.2
Household amenities, (%), Census 2001
Households with kutchha houses
Households with safe drinking water
Households with electricity connection
Vital rates
Crude Birth Rate, 2001
Total Fertility Rate, 2001
Infant Mortality Rate, 2001
Key RCH indicators from District Level
Household Survey, 2002-04 (%)
Girls marrying below 18 years
Birth order 3 and above
Current use of any FP Method
Total unmet need
Pregnant women with any ANC
Pregnant women with 3+ ANCs
Pregnant women received IFA tablets
Safe delivery
Institutional delivery
Children with full immunization
Medical/Health Infrastructures/ Institutions
CHCs
PHCs
Sub-Centres
Information on HIV/AIDS
HIV+ among ANC clinics (%)
HIV+ among STD clinics (%)
Number of Integrated Counseling and Testing
Centres (ICTC formerly VCTC)
Number of Prevention of Parent To Child
Transmission Centres (PPTCTC)
Number of Anti Retroviral Therapy (ART)
Centres
6.8
90.4
87.6
24.1
2.8
34
11.9
24.2
69.9
10.6
97.8
68.0
27.7
53.5
45.1
85.7
2
9
48
-
1.20
3
-
-
95

11.10 Page 110

▲back to top


District Profile - Haryana
96

12 Pages 111-120

▲back to top


12.1 Page 111

▲back to top


District Profile - Haryana
DISTRICT : AMBALA
General information
Area (Sq. Kms.)
Percent to total state’s area
1574
3.6
Villages
482
Demographic particulars
(Census, 2001)
Population
Persons 1014411
Males 542977
Females 471434
Rural (%)
64.8
Urban (%)
35.2
Scheduled Castes (%)
25.1
Scheduled Tribes (%)
-
Elderly population (60 + years)(%)
8.6
Young people (10-24 years) (%)
32.2
Decadal Growth Rate, 1991-2001 (%)
25.8
Population density (per sq. km)
644
Sex Ratio (females per 1000 males)
1991
903
2001
868
Child Sex Ratio (0-6 years)
(girls per 1000 boys)
1991
886
2001
782
Literacy rate (7+)
Persons
75.3
Males
82.3
Females
67.4
Total work participation rate
32.0
Female work participation rate
10.2
Household amenities, (%), Census 2001
Households with kutchha houses
Households with safe drinking water
Households with electricity connection
Vital rates
Crude Birth Rate, 2001
Total Fertility Rate, 2001
Infant Mortality Rate, 2001
Key RCH indicators from District Level
Household Survey, 2002-04 (%)
Girls marrying below 18 years
Birth order 3 and above
Current use of any FP Method
Total unmet need
Pregnant women with any ANC
Pregnant women with 3+ ANCs
Pregnant women received IFA tablets
Safe delivery
Institutional delivery
Children with full immunization
Medical/Health Infrastructures/ Institutions
CHCs
PHCs
Sub-Centres
Information on HIV/AIDS
HIV+ among ANC clinics (%)
HIV+ among STD clinics (%)
Number of Integrated Counseling and Testing
Centres (ICTC formerly VCTC)
Number of Prevention of Parent To Child
Transmission Centres (PPTCTC)
Number of Anti Retroviral Therapy (ART)
Centres
6.5
96.2
92.2
20.9
2.4
32
1.6
24.5
70.8
6.4
99.5
80.5
20.7
69.1
61.8
92.9
2
15
99
-
0.00
4
-
-
97

12.2 Page 112

▲back to top


District Profile - Haryana
98

12.3 Page 113

▲back to top


District Profile - Haryana
DISTRICT : YAMUNANAGAR
General information
Area (Sq. Kms.)
Percent to total state’s area
1768
4.0
Villages
613
Demographic particulars
(Census, 2001)
Population
Persons 1041630
Males 559444
Females 482186
Rural (%)
62.3
Urban (%)
37.7
Scheduled Castes (%)
24.5
Scheduled Tribes (%)
-
Elderly population (60 + years)(%)
8.1
Young people (10-24 years) (%)
33.1
Decadal Growth Rate, 1991-2001 (%)
29.2
Population density (per sq. km)
589
Sex Ratio (females per 1000 males)
1991
883
2001
862
Child Sex Ratio (0-6 years)
(girls per 1000 boys)
1991
889
2001
806
Literacy rate (7+)
Persons
71.6
Males
78.8
Females
63.4
Total work participation rate
32.3
Female work participation rate
11.7
Household amenities, (%), Census 2001
Households with kutchha houses
Households with safe drinking water
Households with electricity connection
Vital rates
Crude Birth Rate, 2001
Total Fertility Rate, 2001
Infant Mortality Rate, 2001
Key RCH indicators from District Level
Household Survey, 2002-04 (%)
Girls marrying below 18 years
Birth order 3 and above
Current use of any FP Method
Total unmet need
Pregnant women with any ANC
Pregnant women with 3+ ANCs
Pregnant women received IFA tablets
Safe delivery
Institutional delivery
Children with full immunization
Medical/Health Infrastructures/ Institutions
CHCs
PHCs
Sub-Centres
Information on HIV/AIDS
HIV+ among ANC clinics (%)
HIV+ among STD clinics (%)
Number of Integrated Counseling and Testing
Centres (ICTC formerly VCTC)
Number of Prevention of Parent To Child
Transmission Centres (PPTCTC)
Number of Anti Retroviral Therapy (ART)
Centres
11.5
95.7
89.3
22.7
2.8
35
14.5
39.7
62.1
12.1
91.9
52.2
17.8
38.7
31.6
72.0
4
18
111
-
0.81
3
-
-
99

12.4 Page 114

▲back to top


District Profile - Haryana
100

12.5 Page 115

▲back to top


District Profile - Haryana
DISTRICT : KURUSHETRA
General information
Area (Sq. Kms.)
Percent to total state’s area
1530
3.5
Villages
407
Demographic particulars
(Census, 2001)
Population
Persons
Males
Females
Rural (%)
Urban (%)
Scheduled Castes (%)
Scheduled Tribes (%)
Elderly population (60 + years)(%)
Young people (10-24 years) (%)
Decadal Growth Rate, 1991-2001 (%)
Population density (per sq. km)
Sex Ratio (females per 1000 males)
1991
2001
Child Sex Ratio (0-6 years)
(girls per 1000 boys)
1991
2001
Literacy rate (7+)
Persons
Males
Females
825454
442328
383126
73.9
26.1
20.5
-
7.9
33.7
23.3
540
879
866
867
771
69.9
78.1
60.6
Total work participation rate
37.4
Female work participation rate
21.4
Household amenities, (%), Census 2001
Households with kutchha houses
Households with safe drinking water
Households with electricity connection
Vital rates
Crude Birth Rate, 2001
Total Fertility Rate, 2001
Infant Mortality Rate, 2001
Key RCH indicators from District Level
Household Survey, 2002-04 (%)
Girls marrying below 18 years
Birth order 3 and above
Current use of any FP Method
Total unmet need
Pregnant women with any ANC
Pregnant women with 3+ ANCs
Pregnant women received IFA tablets
Safe delivery
Institutional delivery
Children with full immunization
Medical/Health Infrastructures/ Institutions
CHCs
PHCs
Sub-Centres
Information on HIV/AIDS
HIV+ among ANC clinics (%)
HIV+ among STD clinics (%)
Number of Integrated Counseling and Testing
Centres (ICTC formerly VCTC)
Number of Prevention of Parent To Child
Transmission Centres (PPTCTC)
Number of Anti Retroviral Therapy (ART)
Centres
4.8
98.9
92.2
23.0
2.7
44
6.0
27.6
68.4
9.6
97.7
74.0
23.3
59.1
50.3
81.7
3
17
105
0.00
-
3
-
-
101

12.6 Page 116

▲back to top


District Profile - Haryana
102

12.7 Page 117

▲back to top


District Profile - Haryana
DISTRICT : KAITHAL
General information
Area (Sq. Kms.)
Percent to total state’s area
2317
5.2
Villages
270
Demographic particulars
(Census, 2001)
Population
Persons
Males
Females
Rural (%)
Urban (%)
Scheduled Castes (%)
Scheduled Tribes (%)
Elderly population (60 + years)(%)
Young people (10-24 years) (%)
Decadal Growth Rate, 1991-2001 (%)
Population density (per sq. km)
Sex Ratio (females per 1000 males)
1991
2001
Child Sex Ratio (0-6 years)
(girls per 1000 boys)
1991
2001
Literacy rate (7+)
Persons
Males
Females
946131
510513
435618
80.6
19.4
21.5
-
8.1
33.0
21.0
408
853
853
854
791
59.0
69.2
47.3
Total work participation rate
39.3
Female work participation rate
25.8
Household amenities, (%), Census 2001
Households with kutchha houses
Households with safe drinking water
Households with electricity connection
Vital rates
Crude Birth Rate, 2001
Total Fertility Rate, 2001
Infant Mortality Rate, 2001
Key RCH indicators from District Level
Household Survey, 2002-04 (%)
Girls marrying below 18 years
Birth order 3 and above
Current use of any FP Method
Total unmet need
Pregnant women with any ANC
Pregnant women with 3+ ANCs
Pregnant women received IFA tablets
Safe delivery
Institutional delivery
Children with full immunization
Medical/Health Infrastructures/ Institutions
CHCs
PHCs
Sub-Centres
Information on HIV/AIDS
HIV+ among ANC clinics (%)
HIV+ among STD clinics (%)
Number of Integrated Counseling and Testing
Centres (ICTC formerly VCTC)
Number of Prevention of Parent To Child
Transmission Centres (PPTCTC)
Number of Anti Retroviral Therapy (ART)
Centres
3.0
91.6
83.6
25.1
3.1
48
31.3
39.0
59.4
16.9
80.2
40.4
23.9
40.8
28.4
41.4
3
22
144
0.00
-
2
-
-
103

12.8 Page 118

▲back to top


District Profile - Haryana
104

12.9 Page 119

▲back to top


District Profile - Haryana
DISTRICT : KARNAL
General information
Area (Sq. Kms.)
Percent to total state’s area
2520
5.7
Villages
422
Demographic particulars
(Census, 2001)
Population
Persons 1274183
Males 683368
Females 590815
Rural (%)
73.5
Urban (%)
26.5
Scheduled Castes (%)
21.0
Scheduled Tribes (%)
-
Elderly population (60 + years)(%)
7.4
Young people (10-24 years) (%)
33.6
Decadal Growth Rate, 1991-2001 (%)
23.1
Population density (per sq. km)
506
Sex Ratio (females per 1000 males)
1991
864
2001
865
Child Sex Ratio (0-6 years)
(girls per 1000 boys)
1991
875
2001
809
Literacy rate (7+)
Persons
67.7
Males
76.3
Females
58.0
Total work participation rate
35.7
Female work participation rate
19.0
Household amenities, (%), Census 2001
Households with kutchha houses
Households with safe drinking water
Households with electricity connection
Vital rates
Crude Birth Rate, 2001
Total Fertility Rate, 2001
Infant Mortality Rate, 2001
Key RCH indicators from District Level
Household Survey, 2002-04 (%)
Girls marrying below 18 years
Birth order 3 and above
Current use of any FP Method
Total unmet need
Pregnant women with any ANC
Pregnant women with 3+ ANCs
Pregnant women received IFA tablets
Safe delivery
Institutional delivery
Children with full immunization
Medical/Health Infrastructures/ Institutions
CHCs
PHCs
Sub-Centres
Information on HIV/AIDS
HIV+ among ANC clinics (%)
HIV+ among STD clinics (%)
Number of Integrated Counseling and Testing
Centres (ICTC formerly VCTC)
Number of Prevention of Parent To Child
Transmission Centres (PPTCTC)
Number of Anti Retroviral Therapy (ART)
Centres
4.7
97.1
84.2
24.0
3.0
39
15.6
36.0
60.5
15.2
94.4
56.3
21.1
40.5
33.8
73.9
3
26
141
0.00
-
3
-
-
105

12.10 Page 120

▲back to top


District Profile - Haryana
106

13 Pages 121-130

▲back to top


13.1 Page 121

▲back to top


District Profile - Haryana
DISTRICT : PANIPAT
General information
Area (Sq. Kms.)
Percent to total state’s area
1268
2.9
Villages
179
Demographic particulars
(Census, 2001)
Population
Persons
Males
Females
Rural (%)
Urban (%)
Scheduled Castes (%)
Scheduled Tribes (%)
Elderly population (60 + years)(%)
Young people (10-24 years) (%)
Decadal Growth Rate, 1991-2001 (%)
Population density (per sq. km)
Sex Ratio (females per 1000 males)
1991
2001
Child Sex Ratio (0-6 years)
(girls per 1000 boys)
1991
2001
Literacy rate (7+)
Persons
Males
Females
967449
528860
438589
59.5
40.5
15.8
-
6.6
33.2
38.6
763
852
829
881
809
69.2
78.5
58.0
Total work participation rate
39.6
Female work participation rate
25.8
Household amenities, (%), Census 2001
Households with kutchha houses
Households with safe drinking water
Households with electricity connection
Vital rates
Crude Birth Rate, 2001
Total Fertility Rate, 2001
Infant Mortality Rate, 2001
Key RCH indicators from District Level
Household Survey, 2002-04 (%)
Girls marrying below 18 years
Birth order 3 and above
Current use of any FP Method
Total unmet need
Pregnant women with any ANC
Pregnant women with 3+ ANCs
Pregnant women received IFA tablets
Safe delivery
Institutional delivery
Children with full immunization
Medical/Health Infrastructures/ Institutions
CHCs
PHCs
Sub-Centres
Information on HIV/AIDS
HIV+ among ANC clinics (%)
HIV+ among STD clinics (%)
Number of Integrated Counseling and Testing
Centres (ICTC formerly VCTC)
Number of Prevention of Parent To Child
Transmission Centres (PPTCTC)
Number of Anti Retroviral Therapy (ART)
Centres
3.4
94.9
87.6
27.5
3.5
45
29.4
37.8
54.0
19.4
88.3
46.7
17.1
46.1
33.9
63.8
1
15
89
0.00
-
2
-
-
107

13.2 Page 122

▲back to top


District Profile - Haryana
108

13.3 Page 123

▲back to top


District Profile - Haryana
DISTRICT : SONIPAT
General information
Area (Sq. Kms.)
Percent to total state’s area
2122
4.8
Villages
323
Demographic particulars
(Census, 2001)
Population
Persons 1279175
Males 695723
Females 583452
Rural (%)
74.9
Urban (%)
25.1
Scheduled Castes (%)
18.1
Scheduled Tribes (%)
-
Elderly population (60 + years)(%)
8.0
Young people (10-24 years) (%)
32.9
Decadal Growth Rate, 1991-2001 (%)
22.4
Population density (per sq. km)
603
Sex Ratio (females per 1000 males)
1991
840
2001
839
Child Sex Ratio (0-6 years)
(girls per 1000 boys)
1991
879
2001
788
Literacy rate (7+)
Persons
72.8
Males
83.1
Females
60.7
Total work participation rate
40.9
Female work participation rate
30.4
Household amenities, (%), Census 2001
Households with kutchha houses
Households with safe drinking water
Households with electricity connection
Vital rates
Crude Birth Rate, 2001
Total Fertility Rate, 2001
Infant Mortality Rate, 2001
Key RCH indicators from District Level
Household Survey, 2002-04 (%)
Girls marrying below 18 years
Birth order 3 and above
Current use of any FP Method
Total unmet need
Pregnant women with any ANC
Pregnant women with 3+ ANCs
Pregnant women received IFA tablets
Safe delivery
Institutional delivery
Children with full immunization
Medical/Health Infrastructures/ Institutions
CHCs
PHCs
Sub-Centres
Information on HIV/AIDS
HIV+ among ANC clinics (%)
HIV+ among STD clinics (%)
Number of Integrated Counseling and Testing
Centres (ICTC formerly VCTC)
Number of Prevention of Parent To Child
Transmission Centres (PPTCTC)
Number of Anti Retroviral Therapy (ART)
Centres
1.6
76.4
88.3
24.4
3.1
35
25.8
35.5
62.1
17.1
84.8
46.2
14.3
50.0
41.1
55.1
6
27
160
-
2.00
3
-
-
109

13.4 Page 124

▲back to top


District Profile - Haryana
110

13.5 Page 125

▲back to top


District Profile - Haryana
DISTRICT : JIND
General information
Area (Sq. Kms.)
Percent to total state’s area
2702
6.1
Villages
306
Demographic particulars
(Census, 2001)
Population
Persons 1189827
Males 642282
Females 547545
Rural (%)
79.7
Urban (%)
20.3
Scheduled Castes (%)
19.8
Scheduled Tribes (%)
-
Elderly population (60 + years)(%)
7.9
Young people (10-24 years) (%)
32.9
Decadal Growth Rate, 1991-2001 (%)
21.4
Population density (per sq. km)
440
Sex Ratio (females per 1000 males)
1991
838
2001
852
Child Sex Ratio (0-6 years)
(girls per 1000 boys)
1991
858
2001
818
Literacy rate (7+)
Persons
62.1
Males
73.8
Females
48.5
Total work participation rate
43.9
Female work participation rate
34.8
Household amenities, (%), Census 2001
Households with kutchha houses
Households with safe drinking water
Households with electricity connection
Vital rates
Crude Birth Rate, 2001
Total Fertility Rate, 2001
Infant Mortality Rate, 2001
Key RCH indicators from District Level
Household Survey, 2002-04 (%)
Girls marrying below 18 years
Birth order 3 and above
Current use of any FP Method
Total unmet need
Pregnant women with any ANC
Pregnant women with 3+ ANCs
Pregnant women received IFA tablets
Safe delivery
Institutional delivery
Children with full immunization
Medical/Health Infrastructures/ Institutions
CHCs
PHCs
Sub-Centres
Information on HIV/AIDS
HIV+ among ANC clinics (%)
HIV+ among STD clinics (%)
Number of Integrated Counseling and Testing
Centres (ICTC formerly VCTC)
Number of Prevention of Parent To Child
Transmission Centres (PPTCTC)
Number of Anti Retroviral Therapy (ART)
Centres
1.3
72.6
83.6
26.0
3.3
48
26.6
45.4
57.8
12.4
90.8
41.4
14.7
35.4
27.1
62.4
6
27
158
0.25
-
4
-
-
111

13.6 Page 126

▲back to top


District Profile - Haryana
112

13.7 Page 127

▲back to top


District Profile - Haryana
DISTRICT : FATEHABAD
General information
Area (Sq. Kms.)
Percent to total state’s area
2538
5.7
Villages
243
Demographic particulars
(Census, 2001)
Population
Persons
Males
Females
Rural (%)
Urban (%)
Scheduled Castes (%)
Scheduled Tribes (%)
Elderly population (60 + years)(%)
Young people (10-24 years) (%)
Decadal Growth Rate, 1991-2001 (%)
Population density (per sq. km)
Sex Ratio (females per 1000 males)
1991
2001
Child Sex Ratio (0-6 years)
(girls per 1000 boys)
1991
2001
Literacy rate (7+)
Persons
Males
Females
806158
427862
378296
82.4
17.6
27.4
-
7.6
32.9
24.8
318
877
884
872
828
58.0
68.2
46.5
Total work participation rate
45.0
Female work participation rate
34.4
Household amenities, (%), Census 2001
Households with kutchha houses
Households with safe drinking water
Households with electricity connection
Vital rates
Crude Birth Rate, 2001
Total Fertility Rate, 2001
Infant Mortality Rate, 2001
Key RCH indicators from District Level
Household Survey, 2002-04 (%)
Girls marrying below 18 years
Birth order 3 and above
Current use of any FP Method
Total unmet need
Pregnant women with any ANC
Pregnant women with 3+ ANCs
Pregnant women received IFA tablets
Safe delivery
Institutional delivery
Children with full immunization
Medical/Health Infrastructures/ Institutions
CHCs
PHCs
Sub-Centres
Information on HIV/AIDS
HIV+ among ANC clinics (%)
HIV+ among STD clinics (%)
Number of Integrated Counseling and Testing
Centres (ICTC formerly VCTC)
Number of Prevention of Parent To Child
Transmission Centres (PPTCTC)
Number of Anti Retroviral Therapy (ART)
Centres
14.4
95.0
77.8
26.3
3.2
50
23.6
37.6
67.3
9.3
91.8
43.5
10.2
51.4
37.9
65.1
3
16
102
0.25
-
3
-
-
113

13.8 Page 128

▲back to top


District Profile - Haryana
114

13.9 Page 129

▲back to top


District Profile - Haryana
DISTRICT : SIRSA
General information
Area (Sq. Kms.)
Percent to total state’s area
4277
9.7
Villages
321
Demographic particulars
(Census, 2001)
Population
Persons 1116649
Males 593245
Females 523404
Rural (%)
73.7
Urban (%)
26.3
Scheduled Castes (%)
26.6
Scheduled Tribes (%)
-
Elderly population (60 + years)(%)
7.6
Young people (10-24 years) (%)
33.0
Decadal Growth Rate, 1991-2001 (%)
23.6
Population density (per sq. km)
261
Sex Ratio (females per 1000 males)
1991
885
2001
882
Child Sex Ratio (0-6 years)
(girls per 1000 boys)
1991
883
2001
817
Literacy rate (7+)
Persons
60.6
Males
70.1
Females
49.9
Total work participation rate
42.6
Female work participation rate
30.7
Household amenities, (%), Census 2001
Households with kutchha houses
Households with safe drinking water
Households with electricity connection
Vital rates
Crude Birth Rate, 2001
Total Fertility Rate, 2001
Infant Mortality Rate, 2001
Key RCH indicators from District Level
Household Survey, 2002-04 (%)
Girls marrying below 18 years
Birth order 3 and above
Current use of any FP Method
Total unmet need
Pregnant women with any ANC
Pregnant women with 3+ ANCs
Pregnant women received IFA tablets
Safe delivery
Institutional delivery
Children with full immunization
Medical/Health Infrastructures/ Institutions
CHCs
PHCs
Sub-Centres
Information on HIV/AIDS
HIV+ among ANC clinics (%)
HIV+ among STD clinics (%)
Number of Integrated Counseling and Testing
Centres (ICTC formerly VCTC)
Number of Prevention of Parent To Child
Transmission Centres (PPTCTC)
Number of Anti Retroviral Therapy (ART)
Centres
25.0
92.8
73.9
24.7
2.9
41
23.7
36.2
63.3
16.1
78.6
34.5
14.8
47.7
33.3
49.1
4
23
137
-
0.40
3
-
-
115

13.10 Page 130

▲back to top


District Profile - Haryana
116

14 Pages 131-140

▲back to top


14.1 Page 131

▲back to top


District Profile - Haryana
DISTRICT : HISAR
General information
Area (Sq. Kms.)
Percent to total state’s area
3983
9.0
Villages
272
Demographic particulars
(Census, 2001)
Population
Persons 1537117
Males 830520
Females 706597
Rural (%)
74.1
Urban (%)
25.9
Scheduled Castes (%)
22.0
Scheduled Tribes (%)
-
Elderly population (60 + years)(%)
7.1
Young people (10-24 years) (%)
32.9
Decadal Growth Rate, 1991-2001 (%)
27.1
Population density (per sq. km)
386
Sex Ratio (females per 1000 males)
1991
853
2001
851
Child Sex Ratio (0-6 years)
(girls per 1000 boys)
1991
864
2001
832
Literacy rate (7+)
Persons
64.8
Males
76.6
Females
51.1
Total work participation rate
43.3
Female work participation rate
33.2
Household amenities, (%), Census 2001
Households with kutchha houses
Households with safe drinking water
Households with electricity connection
Vital rates
Crude Birth Rate, 2001
Total Fertility Rate, 2001
Infant Mortality Rate, 2001
Key RCH indicators from District Level
Household Survey, 2002-04 (%)
Girls marrying below 18 years
Birth order 3 and above
Current use of any FP Method
Total unmet need
Pregnant women with any ANC
Pregnant women with 3+ ANCs
Pregnant women received IFA tablets
Safe delivery
Institutional delivery
Children with full immunization
Medical/Health Infrastructures/ Institutions
CHCs
PHCs
Sub-Centres
Information on HIV/AIDS
HIV+ among ANC clinics (%)
HIV+ among STD clinics (%)
Number of Integrated Counseling and Testing
Centres (ICTC formerly VCTC)
Number of Prevention of Parent To Child
Transmission Centres (PPTCTC)
Number of Anti Retroviral Therapy (ART)
Centres
5.3
84.3
81.9
25.3
3.1
41
34.5
34.7
63.8
8.6
95.2
57.6
18.0
40.1
32.4
63.6
6
34
199
0.25
-
4
-
-
117

14.2 Page 132

▲back to top


District Profile - Haryana
118

14.3 Page 133

▲back to top


District Profile - Haryana
DISTRICT : BHIWANI
General information
Area (Sq. Kms.)
Percent to total state’s area
4778
10.8
Villages
437
Demographic particulars
(Census, 2001)
Population
Persons 1425022
Males 758253
Females 666769
Rural (%)
81.0
Urban (%)
19.0
Scheduled Castes (%)
19.6
Scheduled Tribes (%)
-
Elderly population (60 + years)(%)
7.7
Young people (10-24 years) (%)
34.0
Decadal Growth Rate, 1991-2001 (%)
22.5
Population density (per sq. km)
298
Sex Ratio (females per 1000 males)
1991
878
2001
879
Child Sex Ratio (0-6 years)
(girls per 1000 boys)
1991
886
2001
841
Literacy rate (7+)
Persons
67.4
Males
80.3
Females
53.0
Total work participation rate
42.8
Female work participation rate
35.4
Household amenities, (%), Census 2001
Households with kutchha houses
Households with safe drinking water
Households with electricity connection
Vital rates
Crude Birth Rate, 2001
Total Fertility Rate, 2001
Infant Mortality Rate, 2001
Key RCH indicators from District Level
Household Survey, 2002-04 (%)
Girls marrying below 18 years
Birth order 3 and above
Current use of any FP Method
Total unmet need
Pregnant women with any ANC
Pregnant women with 3+ ANCs
Pregnant women received IFA tablets
Safe delivery
Institutional delivery
Children with full immunization
Medical/Health Infrastructures/ Institutions
CHCs
PHCs
Sub-Centres
Information on HIV/AIDS
HIV+ among ANC clinics (%)
HIV+ among STD clinics (%)
Number of Integrated Counseling and Testing
Centres (ICTC formerly VCTC)
Number of Prevention of Parent To Child
Transmission Centres (PPTCTC)
Number of Anti Retroviral Therapy (ART)
Centres
3.8
77.1
83.2
25.5
3.3
44
45.1
37.2
60.3
13.3
93.8
47.6
20.5
41.1
36.3
47.8
7
37
211
-
3.21
4
-
-
119

14.4 Page 134

▲back to top


District Profile - Haryana
120

14.5 Page 135

▲back to top


District Profile - Haryana
DISTRICT : ROHTAK
General information
Area (Sq. Kms.)
Percent to total state’s area
1745
3.9
Villages
146
Demographic particulars
(Census, 2001)
Population
Persons
Males
Females
Rural (%)
Urban (%)
Scheduled Castes (%)
Scheduled Tribes (%)
Elderly population (60 + years)(%)
Young people (10-24 years) (%)
Decadal Growth Rate, 1991-2001 (%)
Population density (per sq. km)
Sex Ratio (females per 1000 males)
1991
2001
Child Sex Ratio (0-6 years)
(girls per 1000 boys)
1991
2001
Literacy rate (7+)
Persons
Males
Females
940128
509038
431090
64.9
35.1
19.1
-
8.6
32.5
21.0
539
849
847
867
799
73.7
83.2
62.6
Total work participation rate
39.5
Female work participation rate
27.8
Household amenities, (%), Census 2001
Households with kutchha houses
Households with safe drinking water
Households with electricity connection
Vital rates
Crude Birth Rate, 2001
Total Fertility Rate, 2001
Infant Mortality Rate, 2001
Key RCH indicators from District Level
Household Survey, 2002-04 (%)
Girls marrying below 18 years
Birth order 3 and above
Current use of any FP Method
Total unmet need
Pregnant women with any ANC
Pregnant women with 3+ ANCs
Pregnant women received IFA tablets
Safe delivery
Institutional delivery
Children with full immunization
Medical/Health Infrastructures/ Institutions
CHCs
PHCs
Sub-Centres
Information on HIV/AIDS
HIV+ among ANC clinics (%)
HIV+ among STD clinics (%)
Number of Integrated Counseling and Testing
Centres (ICTC formerly VCTC)
Number of Prevention of Parent To Child
Transmission Centres (PPTCTC)
Number of Anti Retroviral Therapy (ART)
Centres
2.3
66.8
90.7
23.5
3.0
38
26.8
28.8
63.2
12.2
98.1
60.1
26.8
47.3
41.9
81.0
3
21
111
-
3.01
4
-
1
121

14.6 Page 136

▲back to top


District Profile - Haryana
122

14.7 Page 137

▲back to top


District Profile - Haryana
DISTRICT : JHAJJAR
General information
Area (Sq. Kms.)
Percent to total state’s area
1834
4.1
Villages
247
Demographic particulars
(Census, 2001)
Population
Persons
Males
Females
Rural (%)
Urban (%)
Scheduled Castes (%)
Scheduled Tribes (%)
Elderly population (60 + years)(%)
Young people (10-24 years) (%)
Decadal Growth Rate, 1991-2001 (%)
Population density (per sq. km)
Sex Ratio (females per 1000 males)
1991
2001
Child Sex Ratio (0-6 years)
(girls per 1000 boys)
1991
2001
Literacy rate (7+)
Persons
Males
Females
880072
476475
403597
77.8
22.2
17.8
-
8.4
33.0
23.1
480
861
847
886
801
72.4
83.3
59.6
Total work participation rate
44.2
Female work participation rate
35.7
Household amenities, (%), Census 2001
Households with kutchha houses
Households with safe drinking water
Households with electricity connection
Vital rates
Crude Birth Rate, 2001
Total Fertility Rate, 2001
Infant Mortality Rate, 2001
Key RCH indicators from District Level
Household Survey, 2002-04 (%)
Girls marrying below 18 years
Birth order 3 and above
Current use of any FP Method
Total unmet need
Pregnant women with any ANC
Pregnant women with 3+ ANCs
Pregnant women received IFA tablets
Safe delivery
Institutional delivery
Children with full immunization
Medical/Health Infrastructures/ Institutions
CHCs
PHCs
Sub-Centres
Information on HIV/AIDS
HIV+ among ANC clinics (%)
HIV+ among STD clinics (%)
Number of Integrated Counseling and Testing
Centres (ICTC formerly VCTC)
Number of Prevention of Parent To Child
Transmission Centres (PPTCTC)
Number of Anti Retroviral Therapy (ART)
Centres
1.9
70.1
87.1
24.3
3.1
42
21.9
25.7
64.3
10.8
95.8
55.4
22.8
55.4
46.2
68.0
4
19
123
0.26
-
2
-
-
123

14.8 Page 138

▲back to top


District Profile - Haryana
124

14.9 Page 139

▲back to top


District Profile - Haryana
DISTRICT : MAHENDERGARH
General information
Area (Sq. Kms.)
Percent to total state’s area
1859
4.2
Villages
368
Demographic particulars
(Census, 2001)
Population
Persons
Males
Females
Rural (%)
Urban (%)
Scheduled Castes (%)
Scheduled Tribes (%)
Elderly population (60 + years)(%)
Young people (10-24 years) (%)
Decadal Growth Rate, 1991-2001 (%)
Population density (per sq. km)
Sex Ratio (females per 1000 males)
1991
2001
Child Sex Ratio (0-6 years)
(girls per 1000 boys)
1991
2001
Literacy rate (7+)
Persons
Males
Females
812521
423578
388943
86.5
13.5
16.3
-
8.8
33.1
19.2
437
910
918
892
818
69.9
84.7
54.1
Total work participation rate
43.3
Female work participation rate
38.2
Household amenities, (%), Census 2001
Households with kutchha houses
Households with safe drinking water
Households with electricity connection
Vital rates
Crude Birth Rate, 2001
Total Fertility Rate, 2001
Infant Mortality Rate, 2001
Key RCH indicators from District Level
Household Survey, 2002-04 (%)
Girls marrying below 18 years
Birth order 3 and above
Current use of any FP Method
Total unmet need
Pregnant women with any ANC
Pregnant women with 3+ ANCs
Pregnant women received IFA tablets
Safe delivery
Institutional delivery
Children with full immunization
Medical/Health Infrastructures/ Institutions
CHCs
PHCs
Sub-Centres
Information on HIV/AIDS
HIV+ among ANC clinics (%)
HIV+ among STD clinics (%)
Number of Integrated Counseling and Testing
Centres (ICTC formerly VCTC)
Number of Prevention of Parent To Child
Transmission Centres (PPTCTC)
Number of Anti Retroviral Therapy (ART)
Centres
2.4
78.9
76.6
25.5
3.3
45
42.5
35.0
62.4
14.0
89.6
35.9
11.0
48.7
36.8
52.6
3
21
102
-
-
3
-
-
125

14.10 Page 140

▲back to top


District Profile - Haryana
126

15 Pages 141-150

▲back to top


15.1 Page 141

▲back to top


District Profile - Haryana
DISTRICT : REWARI
General information
Area (Sq. Kms.)
Percent to total state’s area
1582
3.6
Villages
397
Demographic particulars
(Census, 2001)
Population
Persons
Males
Females
Rural (%)
Urban (%)
Scheduled Castes (%)
Scheduled Tribes (%)
Elderly population (60 + years)(%)
Young people (10-24 years) (%)
Decadal Growth Rate, 1991-2001 (%)
Population density (per sq. km)
Sex Ratio (females per 1000 males)
1991
2001
Child Sex Ratio (0-6 years)
(girls per 1000 boys)
1991
2001
Literacy rate (7+)
Persons
Males
Females
765351
403034
362317
82.2
17.8
18.9
-
8.5
32.9
25.3
484
927
899
894
811
75.2
88.4
60.8
Total work participation rate
43.6
Female work participation rate
36.8
Household amenities, (%), Census 2001
Households with kutchha houses
Households with safe drinking water
Households with electricity connection
Vital rates
Crude Birth Rate, 2001
Total Fertility Rate, 2001
Infant Mortality Rate, 2001
Key RCH indicators from District Level
Household Survey, 2002-04 (%)
Girls marrying below 18 years
Birth order 3 and above
Current use of any FP Method
Total unmet need
Pregnant women with any ANC
Pregnant women with 3+ ANCs
Pregnant women received IFA tablets
Safe delivery
Institutional delivery
Children with full immunization
Medical/Health Infrastructures/ Institutions
CHCs
PHCs
Sub-Centres
Information on HIV/AIDS
HIV+ among ANC clinics (%)
HIV+ among STD clinics (%)
Number of Integrated Counseling and Testing
Centres (ICTC formerly VCTC)
Number of Prevention of Parent To Child
Transmission Centres (PPTCTC)
Number of Anti Retroviral Therapy (ART)
Centres
2.5
84.1
81.4
25.0
3.1
42
16.5
28.8
69.1
11.4
89.5
47.2
19.9
56.7
45.9
65.8
5
14
105
-
-
2
-
-
127

15.2 Page 142

▲back to top


District Profile - Haryana
128

15.3 Page 143

▲back to top


District Profile - Haryana
DISTRICT : GURGAON
General information
Area (Sq. Kms.)
Percent to total state’s area
2766
6.3
Villages
694
Demographic particulars
(Census, 2001)
Population
Persons 1660289
Males 886451
Females 773838
Rural (%)
77.8
Urban (%)
22.2
Scheduled Castes (%)
11.3
Scheduled Tribes (%)
-
Elderly population (60 + years)(%)
6.4
Young people (10-24 years) (%)
31.1
Decadal Growth Rate, 1991-2001 (%)
44.9
Population density (per sq. km)
600
Sex Ratio (females per 1000 males)
1991
871
2001
873
Child Sex Ratio (0-6 years)
(girls per 1000 boys)
1991
895
2001
858
Literacy rate (7+)
Persons
62.9
Males
76.2
Females
47.8
Total work participation rate
37.9
Female work participation rate
27.7
Household amenities, (%), Census 2001
Households with kutchha houses
Households with safe drinking water
Households with electricity connection
Vital rates
Crude Birth Rate, 2001
Total Fertility Rate, 2001
Infant Mortality Rate, 2001
Key RCH indicators from District Level
Household Survey, 2002-04 (%)
Girls marrying below 18 years
Birth order 3 and above
Current use of any FP Method
Total unmet need
Pregnant women with any ANC
Pregnant women with 3+ ANCs
Pregnant women received IFA tablets
Safe delivery
Institutional delivery
Children with full immunization
Medical/Health Infrastructures/ Institutions
CHCs
PHCs
Sub-Centres
Information on HIV/AIDS
HIV+ among ANC clinics (%)
HIV+ among STD clinics (%)
Number of Integrated Counseling and Testing
Centres (ICTC formerly VCTC)
Number of Prevention of Parent To Child
Transmission Centres (PPTCTC)
Number of Anti Retroviral Therapy (ART)
Centres
8.1
80.7
69.2
35.2
4.5
47
49.1
56.1
41.6
26.5
67.2
34.2
13.4
23.1
20.4
32.9
4
25
156
-
0.41
3
-
-
129

15.4 Page 144

▲back to top


District Profile - Haryana
130

15.5 Page 145

▲back to top


District Profile - Haryana
DISTRICT : FARIDABAD
General information
Area (Sq. Kms.)
Percent to total state’s area
2151
4.9
Villages
413
Demographic particulars
(Census, 2001)
Population
Persons 2194586
Males 1193063
Females 1001523
Rural (%)
44.3
Urban (%)
55.7
Scheduled Castes (%)
14.2
Scheduled Tribes (%)
-
Elderly population (60 + years)(%)
5.8
Young people (10-24 years) (%)
32.1
Decadal Growth Rate, 1991-2001 (%)
48.6
Population density (per sq. km)
1020
Sex Ratio (females per 1000 males)
1991
828
2001
839
Child Sex Ratio (0-6 years)
(girls per 1000 boys)
1991
884
2001
850
Literacy rate (7+)
Persons
70.0
Males
81.5
Females
56.3
Total work participation rate
35.8
Female work participation rate
20.9
Household amenities, (%), Census 2001
Households with kutchha houses
Households with safe drinking water
Households with electricity connection
Vital rates
Crude Birth Rate, 2001
Total Fertility Rate, 2001
Infant Mortality Rate, 2001
Key RCH indicators from District Level
Household Survey, 2002-04 (%)
Girls marrying below 18 years
Birth order 3 and above
Current use of any FP Method
Total unmet need
Pregnant women with any ANC
Pregnant women with 3+ ANCs
Pregnant women received IFA tablets
Safe delivery
Institutional delivery
Children with full immunization
Medical/Health Infrastructures/ Institutions
CHCs
PHCs
Sub-Centres
Information on HIV/AIDS
HIV+ among ANC clinics (%)
HIV+ among STD clinics (%)
Number of Integrated Counseling and Testing
Centres (ICTC formerly VCTC)
Number of Prevention of Parent To Child
Transmission Centres (PPTCTC)
Number of Anti Retroviral Therapy (ART)
Centres
4.8
93.5
78.8
29.9
3.7
37
33.0
48.2
52.7
21.2
81.2
43.9
10.3
38.5
31.2
53.7
3
22
132
0.00
0.41
3
-
-
131

15.6 Page 146

▲back to top


15.7 Page 147

▲back to top


15.8 Page 148

▲back to top


State Profile - Himachal Pradesh
STATE PROFILE : Himachal Pradesh
Key Demographic, Health and RCH Indicators at a glance
General information
Area (sq. kms.)
No. of Districts
No. of Sub Districts
No. of Total Villages
No. of Towns
Demographic particulars (Census, 2001)
Population
Persons
Males
Females
Rural (%)
Urban (%)
Scheduled Castes (%)
Scheduled Tribes (%)
Elderly population (60+ years) (%)
Young people (10-24 years) (%)
Decadal Growth Rate, 1991-2001 (%)
Population density (per sq. km)
Sex Ratio (females per 1000 males)
Child Sex Ratio (0-6 years) (girls per 1000 boys)
Literacy rate (7+)
Persons
Males
Females
Work participation rate
Female work participation rate
Proportion of people living below poverty line, 2004-05
Per capita net state domestic product at current prices in rupees, 2005-06
Human Development Index (HDI), 2001 (among 28 states)
Value
Rank
Social Development Index (SDI), 2001 (among 20 major states)
Rural
Value
Rank
Urban
Value
Rank
Household amenities (%), Census 2001
Households with kutchha houses
Households with safe drinking water
Households with electricity connection
Vital indices
Crude Birth Rate (CBR), 2006, SRS
Total Fertility Rate (TFR), 2006, SRS
Age Specific Fertility Rates, 2006, SRS
15-19 years
55673
12
109
20118
75
6077900
3087940
2989960
90.2
9..8
24.7
4.0
9.0
31.6
17.5
109
968
896
76.5
85.3
67.4
49.2
43.7
6.7
27162
0.658
10
63.55
2
70.37
1
2.9
88.6
94.8
18.8
2.0
17.9
135

15.9 Page 149

▲back to top


136
State Profile - Himachal Pradesh
20-24 years
25-29 years
30-34 years
35-39 years
40-44 years
45-49 years
General Fertility Rate, 2006,SRS
Gross Reproduction Rate, 2006, SRS
Life Expectancy at Birth, 2000-2004, SRS
Crude Death Rate (CDR), 2006, SRS
Maternal Mortality Ratio (MMR), 2001-03, RGI
Under five mortality rate (0-4 yrs), 2006, SRS
Infant Mortality Rate (IMR), 2006, SRS
Neo-natal mortality rate, 2006, SRS
Early neo-natal mortality rate, 2006, SRS
Late neo-natal mortality rate, 2006, SRS
Post neo-natal mortality rate, 2006, SRS
Peri-natal mortality rate, 2006, SRS
Still birth rate, 2006, SRS
Key RCH and nutrition indicators (%)
Girls marrying below 18 years, DLHS, 2002-04
Birth order 3 and above, DLHS, 2002-04
Current use of any FP method, DLHS, 2002-04
Total unmet need, DLHS, 2002-04
Pregnant women with any ANC, DLHS, 2002-04
Pregnant women with 3 + ANCs, DLHS, 2002-04
Pregnant women received IFA tablets, DLHS, 2002-04
Safe delivery, DLHS, 2002-04
Institutional delivery, DLHS, 2002-04
Children with full immunization (12-23 months), DLHS, 2002-04
Children under 3 years who are underweight, NFHS-3, 2005-06
Children under 3 years who are stunted, NFHS-3, 2005-06
Children under 3 years who are wasted, NFHS-3, 2005-06
Children age 6-59 months who are anaemic, NFHS-3, 2005-06
Ever married women age 15-49 years who are anaemic, NFHS-3, 2005-06
Medical/Health Infrastructures/Institutions
Community Health Centres (CHCs)
Primary Health Centres (PHCs)
Sub Centres (SCs)
Information on HIV/AIDS (%)
Women who have heard of HIV/AIDS, NFHS-3, 2005-06
Men who have heard of HIV/AIDS, NFHS-3, 2005-06
Women who know that consistent condom use can reduce the chances of getting HIV/AIDS,
NFHS-3, 2005-06
Men who know that consistent condom use can reduce the chances of getting HIV/AIDS,
NFHS-3, 2005-06
HIV+ among ANC clinics (%)
HIV+ among STD clinics (%)
Number of Integrated Counseling and Testing Centres (ICTC formerly VCTC)
Number of Prevention of Parent To Child Transmission Centres (PPTCTC)
Number of Anti Retroviral Therapy (ART) Centres
185.4
145.8
41.4
12.8
2.8
3.0
67.5
1.0
66.5
6.8
NA
10
50
30
20
11
14
39
19
2.9
24.4
70.1
11.8
91.0
67.7
42.8
51.4
45.1
79.3
36.5
38.6
19.3
54.7
43.3
66
439
2068
82.7
93.1
61.8
86.2
0.00
0.60
21
13
1

15.10 Page 150

▲back to top


16 Pages 151-160

▲back to top


16.1 Page 151

▲back to top


District Profile - Himachal Pradesh
138

16.2 Page 152

▲back to top


District Profile - Himachal Pradesh
DISTRICT : CHAMBA
General information
Household amenities, (%), Census 2001
Area (Sq. Kms.)
6525
Households with kutchha houses 1.5
Percent to total state’s area
11.7
Households with safe drinking water 89.1
-
Households with electricity connection 89.1
-
Vital rates
Villages
1118
Crude Birth Rate, 2001 24.2
Total Fertility Rate, 2001
2.9
Demographic particulars
(Census, 2001)
Infant Mortality Rate, 2001
42
Population
Key RCH indicators from District Level
Household Survey, 2002-04 (%)
Persons 460887
Girls marrying below 18 years 3.6
Males 235218
Birth order 3 and above 42.2
Females 225669
Current use of any FP Method 66.2
Rural (%)
92.5
Total unmet need 13.5
Urban (%)
7.5
Pregnant women with any ANC 86.3
Scheduled Castes (%)
20.0
Pregnant women with 3+ ANCs 53.0
Scheduled Tribes (%)
25.5
Pregnant women received IFA tablets 37.1
Elderly population (60+ years)(%)
7.1
Safe delivery 28.5
Young people (10-24 years) (%)
32.5
Institutional delivery 25.0
Decadal Growth Rate, 1991-2001 (%)
17.2
Children with full immunization 68.7
Population density (per sq. km)
71
Sex Ratio (females per 1000 males)
Medical/Health Infrastructures/ Institutions
1991
949
2001
959
CHCs
7
Child Sex Ratio (0-6 years)
(girls per 1000 boys)
PHCs
40
1991
965
Sub-Centres 169
2001
955
Literacy rate (7+)
Information on HIV/AIDS
Persons
62.9
HIV+ among ANC clinics (%) 0.40
Males
76.4
HIV+ among STD clinics (%)
-
Females
48.8
Number of Integrated Counseling and Testing
Centres (ICTC formerly VCTC)
1
Total work participation rate
50.0
Number of Prevention of Parent To Child
Transmission Centres (PPTCTC)
-
Female work participation rate
46.0
Number of Anti Retroviral Therapy (ART)
Centres
-
139

16.3 Page 153

▲back to top


District Profile - Himachal Pradesh
140

16.4 Page 154

▲back to top


District Profile - Himachal Pradesh
DISTRICT : KANGRA
General information
Household amenities, (%), Census 2001
Area (Sq. Kms.)
5739
Households with kutchha houses 2.1
Percent to total state’s area
10.3
Households with safe drinking water 87.3
-
Households with electricity connection 97.6
-
Vital rates
Villages
3619
Crude Birth Rate, 2001 18.8
Total Fertility Rate, 2001 2.2
Demographic particulars
(Census, 2001)
Infant Mortality Rate, 2001
35
Population
Key RCH indicators from District Level
Household Survey, 2002-04 (%)
Persons 1339030
Girls marrying below 18 years 1.7
Males 661254
Birth order 3 and above 19.1
Females 677776
Current use of any FP Method 70.5
Rural (%)
94.6
Total unmet need 11.4
Urban (%)
5.4
Pregnant women with any ANC 97.2
Scheduled Castes (%)
20.9
Pregnant women with 3+ ANCs 76.0
Scheduled Tribes (%)
0.1
Pregnant women received IFA tablets 40.7
Elderly population (60+ years)(%)
10.2
Safe delivery 65.5
Young people (10-24 years) (%)
31.7
Institutional delivery 55.0
Decadal Growth Rate, 1991-2001 (%)
14.1
Children with full immunization 81.1
Population density (per sq. km)
233
Sex Ratio (females per 1000 males)
Medical/Health Infrastructures/ Institutions
1991
1024
2001
1025
CHCs
13
Child Sex Ratio (0-6 years)
(girls per 1000 boys)
PHCs
78
1991
939
Sub-Centres 434
2001
836
Literacy rate (7+)
Information on HIV/AIDS
Persons
80.1
HIV+ among ANC clinics (%) 0.25
Males
87.5
HIV+ among STD clinics (%)
-
Females
73.0
Number of Integrated Counseling and Testing
Centres (ICTC formerly VCTC)
3
Total work participation rate
44.0
Number of Prevention of Parent To Child
Transmission Centres (PPTCTC)
-
Female work participation rate
37.4
Number of Anti Retroviral Therapy (ART)
Centres
-
141

16.5 Page 155

▲back to top


District Profile - Himachal Pradesh
142

16.6 Page 156

▲back to top


District Profile - Himachal Pradesh
DISTRICT : LAHUL & SPITI
General information
Household amenities, (%), Census 2001
Area (Sq. Kms.) 13835
Households with kutchha houses 34.8
Percent to total state’s area
24.9
Households with safe drinking water 91.1
-
Households with electricity connection 86.5
-
Vital rates
Villages
287
Crude Birth Rate, 2001 17.1
Total Fertility Rate, 2001 2.0
Demographic particulars
(Census, 2001)
Infant Mortality Rate, 2001
35
Population
Key RCH indicators from District Level
Household Survey, 2002-04 (%)
Persons 33224
Girls marrying below 18 years 1.5
Males 18441
Birth order 3 and above 31.9
Females 14783
Current use of any FP Method 65.3
Rural (%) 100.0
Total unmet need 11.6
Urban (%)
0.0
Pregnant women with any ANC 91.4
Scheduled Castes (%)
7.8
Pregnant women with 3+ ANCs 63.4
Scheduled Tribes (%)
73.0
Pregnant women received IFA tablets 41.7
Elderly population (60+ years)(%)
8.6
Safe delivery 48.0
Young people (10-24 years) (%)
28.9
Institutional delivery 35.4
Decadal Growth Rate, 1991-2001 (%)
6.2
Children with full immunization 48.2
Population density (per sq. km)
2
Sex Ratio (females per 1000 males)
Medical/Health Infrastructures/ Institutions
1991
817
2001
802
CHCs
3
Child Sex Ratio (0-6 years)
(girls per 1000 boys)
PHCs
14
1991
951
Sub-Centres
35
2001
961
Literacy rate (7+)
Information on HIV/AIDS
Persons
73.1
HIV+ among ANC clinics (%) 0.00
Males
82.8
HIV+ among STD clinics (%)
Females
60.7
Number of Integrated Counseling and Testing
Centres (ICTC formerly VCTC)
1
Total work participation rate
63.5
Number of Prevention of Parent To Child
Transmission Centres (PPTCTC)
-
Female work participation rate
57.4
Number of Anti Retroviral Therapy (ART)
Centres
-
143

16.7 Page 157

▲back to top


District Profile - Himachal Pradesh
144

16.8 Page 158

▲back to top


District Profile - Himachal Pradesh
DISTRICT : KULLU
General information
Household amenities, (%), Census 2001
Area (Sq. Kms.)
5503
Households with kutchha houses 1.1
Percent to total state’s area
9.9
Households with safe drinking water 89.1
-
Households with electricity connection 91.4
-
Vital rates
Villages
172
Crude Birth Rate, 2001 22.4
Total Fertility Rate, 2001 2.6
Demographic particulars
(Census, 2001)
Infant Mortality Rate, 2001
51
Population
Key RCH indicators from District Level
Household Survey, 2002-04 (%)
Persons 381571
Girls marrying below 18 years 9.8
Males 198016
Birth order 3 and above 22.6
Females 183555
Current use of any FP Method 75.3
Rural (%)
92.1
Total unmet need
7.2
Urban (%)
7.9
Pregnant women with any ANC 81.1
Scheduled Castes (%)
28.3
Pregnant women with 3+ ANCs 66.2
Scheduled Tribes (%)
3.0
Pregnant women received IFA tablets 46.5
Elderly population (60+ years)(%)
7.3
Safe delivery 50.8
Young people (10-24 years) (%)
32.2
Institutional delivery 48.0
Decadal Growth Rate, 1991-2001 (%)
26.2
Children with full immunization 78.6
Population density (per sq. km)
69
Sex Ratio (females per 1000 males)
Medical/Health Infrastructures/ Institutions
1991
920
2001
927
CHCs
5
Child Sex Ratio (0-6 years)
(girls per 1000 boys)
PHCs
17
1991
966
Sub-Centres 100
2001
960
Literacy rate (7+)
Information on HIV/AIDS
Persons
72.9
HIV+ among ANC clinics (%)
-
Males
84.0
HIV+ among STD clinics (%) 0.00
Females
60.9
Number of Integrated Counseling and Testing
Centres (ICTC formerly VCTC)
1
Total work participation rate
56.7
Number of Prevention of Parent To Child
Transmission Centres (PPTCTC)
-
Female work participation rate
52.9
Number of Anti Retroviral Therapy (ART)
Centres
-
145

16.9 Page 159

▲back to top


District Profile - Himachal Pradesh
146

16.10 Page 160

▲back to top


District Profile - Himachal Pradesh
DISTRICT : MANDI
General information
Household amenities, (%), Census 2001
Area (Sq. Kms.)
3950
Households with kutchha houses 0.6
Percent to total state’s area
7.1
Households with safe drinking water 93.1
-
Households with electricity connection 95.1
-
Vital rates
Villages
2833
Crude Birth Rate, 2001 21.0
Total Fertility Rate, 2001 2.4
Demographic particulars
(Census, 2001)
Infant Mortality Rate, 2001
48
Population
Key RCH indicators from District Level
Household Survey, 2002-04 (%)
Persons 901344
Girls marrying below 18 years 2.7
Males 447872
Birth order 3 and above 20.3
Females 453472
Current use of any FP Method 72.7
Rural (%)
93.2
Total unmet need 10.0
Urban (%)
6.8
Pregnant women with any ANC 87.1
Scheduled Castes (%)
29.0
Pregnant women with 3+ ANCs 60.7
Scheduled Tribes (%)
1.2
Pregnant women received IFA tablets 40.0
Elderly population (60+ years)(%)
9.1
Safe delivery 34.9
Young people (10-24 years) (%)
31.7
Institutional delivery 31.4
Decadal Growth Rate, 1991-2001 (%)
16.1
Children with full immunization 82.8
Population density (per sq. km)
228
Sex Ratio (females per 1000 males)
Medical/Health Infrastructures/ Institutions
1991
1013
2001
1013
CHCs
9
Child Sex Ratio (0-6 years)
(girls per 1000 boys)
PHCs
59
1991
968
Sub-Centres 311
2001
918
Literacy rate (7+)
Information on HIV/AIDS
Persons
75.2
HIV+ among ANC clinics (%) 0.00
Males
85.9
HIV+ among STD clinics (%)
-
Females
64.8
Number of Integrated Counseling and Testing
Centres (ICTC formerly VCTC)
1
Total work participation rate
50.4
Number of Prevention of Parent To Child
Transmission Centres (PPTCTC)
-
Female work participation rate
48.2
Number of Anti Retroviral Therapy (ART)
Centres
-
147

17 Pages 161-170

▲back to top


17.1 Page 161

▲back to top


District Profile - Himachal Pradesh
148

17.2 Page 162

▲back to top


District Profile - Himachal Pradesh
DISTRICT : HAMIRPUR
General information
Household amenities, (%), Census 2001
Area (Sq. Kms.)
1118
Households with kutchha houses 2.1
Percent to total state’s area
2.0
Households with safe drinking water 90.4
-
Households with electricity connection 98.3
-
Vital rates
Villages
1635
Crude Birth Rate, 2001 18.8
Total Fertility Rate, 2001
2.2
Demographic particulars
(Census, 2001)
Infant Mortality Rate, 2001
39
Population
Key RCH indicators from District Level
Household Survey, 2002-04 (%)
Persons 412700
Girls marrying below 18 years 2.5
Males 196593
Birth order 3 and above 24.9
Females 216107
Current use of any FP Method 66.2
Rural (%)
92.7
Total unmet need 14.3
Urban (%)
7.3
Pregnant women with any ANC 97.1
Scheduled Castes (%)
23.9
Pregnant women with 3+ ANCs 80.4
Scheduled Tribes (%)
0.0
Pregnant women received IFA tablets 52.0
Elderly population (60+ years)(%)
12.1
Safe delivery 61.5
Young people (10-24 years) (%)
30.7
Institutional delivery 48.0
Decadal Growth Rate, 1991-2001 (%)
11.8
Children with full immunization 92.4
Population density (per sq. km)
369
Sex Ratio (females per 1000 males)
Medical/Health Infrastructures/ Institutions
1991
1105
2001
1099
CHCs
5
Child Sex Ratio (0-6 years)
(girls per 1000 boys)
PHCs
24
1991
938
Sub-Centres 152
2001
850
Literacy rate (7+)
Information on HIV/AIDS
Persons
82.5
HIV+ among ANC clinics (%) 0.00
Males
90.2
HIV+ among STD clinics (%)
-
Females
75.7
Number of Integrated Counseling and Testing
Centres (ICTC formerly VCTC)
2
Total work participation rate
49.8
Number of Prevention of Parent To Child
Transmission Centres (PPTCTC)
-
Female work participation rate
48.7
Number of Anti Retroviral Therapy (ART)
Centres
-
149

17.3 Page 163

▲back to top


District Profile - Himachal Pradesh
150

17.4 Page 164

▲back to top


District Profile - Himachal Pradesh
DISTRICT : UNA
General information
Household amenities, (%), Census 2001
Area (Sq. Kms.)
1540
Households with kutchha houses 7.4
Percent to total state’s area
2.8
Households with safe drinking water 90.7
-
Households with electricity connection 97.4
-
Vital rates
Villages
758
Crude Birth Rate, 2001 21.1
Total Fertility Rate, 2001 2.5
Demographic particulars
(Census, 2001)
Infant Mortality Rate, 2001
34
Population
Key RCH indicators from District Level
Household Survey, 2002-04 (%)
Persons 448273
Girls marrying below 18 years 0.0
Males 224524
Birth order 3 and above 26.4
Females 223749
Current use of any FP Method 58.3
Rural (%)
91.2
Total unmet need 19.9
Urban (%)
8.8
Pregnant women with any ANC 91.0
Scheduled Castes (%)
22.4
Pregnant women with 3+ ANCs 67.7
Scheduled Tribes (%)
0.0
Pregnant women received IFA tablets 33.1
Elderly population (60+ years)(%)
10.9
Safe delivery 52.2
Young people (10-24 years) (%)
30.4
Institutional delivery 40.2
Decadal Growth Rate, 1991-2001 (%)
18.5
Children with full immunization 91.8
Population density (per sq. km)
291
Sex Ratio (females per 1000 males)
Medical/Health Infrastructures/ Institutions
1991
1017
2001
997
CHCs
4
Child Sex Ratio (0-6 years)
(girls per 1000 boys)
PHCs
20
1991
923
Sub-Centres 131
2001
837
Literacy rate (7+)
Information on HIV/AIDS
Persons
80.4
HIV+ among ANC clinics (%) 0.00
Males
87.7
HIV+ among STD clinics (%)
-
Females
73.2
Number of Integrated Counseling and Testing
Centres (ICTC formerly VCTC)
2
Total work participation rate
45.0
Number of Prevention of Parent To Child
Transmission Centres (PPTCTC)
-
Female work participation rate
37.0
Number of Anti Retroviral Therapy (ART)
Centres
-
151

17.5 Page 165

▲back to top


District Profile - Himachal Pradesh
152

17.6 Page 166

▲back to top


District Profile - Himachal Pradesh
DISTRICT : BILASPUR
General information
Household amenities, (%), Census 2001
Area (Sq. Kms.)
1167
Households with kutchha houses 1.6
Percent to total state’s area
2.1
Households with safe drinking water 88.6
-
Households with electricity connection 97.9
-
Vital rates
Villages
965
Crude Birth Rate, 2001 19.7
Total Fertility Rate, 2001 2.3
Demographic particulars
(Census, 2001)
Infant Mortality Rate, 2001
40
Population
Key RCH indicators from District Level
Household Survey, 2002-04 (%)
Persons 340885
Girls marrying below 18 years 1.1
Males 171263
Birth order 3 and above 25.4
Females 169622
Current use of any FP Method 68.9
Rural (%)
93.6
Total unmet need 12.1
Urban (%)
6.4
Pregnant women with any ANC 92.2
Scheduled Castes (%)
25.4
Pregnant women with 3+ ANCs 70.1
Scheduled Tribes (%)
2.7
Pregnant women received IFA tablets 66.7
Elderly population (60+ years)(%)
10.5
Safe delivery 64.9
Young people (10-24 years) (%)
30.7
Institutional delivery 62.0
Decadal Growth Rate, 1991-2001 (%)
15.4
Children with full immunization 38.5
Population density (per sq. km)
292
Sex Ratio (females per 1000 males)
Medical/Health Infrastructures/ Institutions
1991
1002
2001
990
CHCs
5
Child Sex Ratio (0-6 years)
(girls per 1000 boys)
PHCs
27
1991
923
Sub-Centres 117
2001
882
Literacy rate (7+)
Information on HIV/AIDS
Persons
77.8
HIV+ among ANC clinics (%)
-
Males
86.0
HIV+ among STD clinics (%)
-
Females
69.5
Number of Integrated Counseling and Testing
Centres (ICTC formerly VCTC)
2
Total work participation rate
48.9
Number of Prevention of Parent To Child
Transmission Centres (PPTCTC)
-
Female work participation rate
45.6
Number of Anti Retroviral Therapy (ART)
Centres
-
153

17.7 Page 167

▲back to top


District Profile - Himachal Pradesh
154

17.8 Page 168

▲back to top


District Profile - Himachal Pradesh
DISTRICT : SOLAN
General information
Household amenities, (%), Census 2001
Area (Sq. Kms.)
1936
Households with kutchha houses 4.6
Percent to total state’s area
3.5
Households with safe drinking water 84.5
-
Households with electricity connection 96.0
-
Vital rates
Villages
2388
Crude Birth Rate, 2001 22.1
Total Fertility Rate, 2001
2.5
Demographic particulars
(Census, 2001)
Infant Mortality Rate, 2001
46
Population
Key RCH indicators from District Level
Household Survey, 2002-04 (%)
Persons 500557
Girls marrying below 18 years 1.6
Males 270291
Birth order 3 and above 18.5
Females 230266
Current use of any FP Method 69.2
Rural (%)
81.8
Total unmet need 10.9
Urban (%)
18.2
Pregnant women with any ANC 95.6
Scheduled Castes (%)
28.1
Pregnant women with 3+ ANCs 73.0
Scheduled Tribes (%)
0.7
Pregnant women received IFA tablets 49.4
Elderly population (60+ years)(%)
7.2
Safe delivery 59.3
Young people (10-24 years) (%)
31.9
Institutional delivery 53.8
Decadal Growth Rate, 1991-2001 (%)
30.9
Children with full immunization 86.1
Population density (per sq. km)
259
Sex Ratio (females per 1000 males)
Medical/Health Infrastructures/ Institutions
1991
909
2001
852
CHCs
3
Child Sex Ratio (0-6 years)
(girls per 1000 boys)
PHCs
32
1991
951
Sub-Centres 178
2001
900
Literacy rate (7+)
Information on HIV/AIDS
Persons
76.6
HIV+ among ANC clinics (%) 0.25
Males
84.8
HIV+ among STD clinics (%)
-
Females
66.9
Number of Integrated Counseling and Testing
Centres (ICTC formerly VCTC)
2
Total work participation rate
52.6
Number of Prevention of Parent To Child
Transmission Centres (PPTCTC)
-
Female work participation rate
42.6
Number of Anti Retroviral Therapy (ART)
Centres
-
155

17.9 Page 169

▲back to top


District Profile - Himachal Pradesh
156

17.10 Page 170

▲back to top


District Profile - Himachal Pradesh
DISTRICT : SIRMAUR
General information
Household amenities, (%), Census 2001
Area (Sq. Kms.)
2825
Households with kutchha houses 5.2
Percent to total state’s area
5.1
Households with safe drinking water 81.0
-
Households with electricity connection 87.2
-
Vital rates
Villages
966
Crude Birth Rate, 2001 24.4
Total Fertility Rate, 2001 3.1
Demographic particulars
(Census, 2001)
Infant Mortality Rate, 2001
55
Population
Key RCH indicators from District Level
Household Survey, 2002-04 (%)
Persons 458593
Girls marrying below 18 years 3.9
Males 241299
Birth order 3 and above 41.0
Females 217294
Current use of any FP Method 70.9
Rural (%)
89.6
Total unmet need 12.4
Urban (%)
10.4
Pregnant women with any ANC 92.7
Scheduled Castes (%)
29.6
Pregnant women with 3+ ANCs 57.0
Scheduled Tribes (%)
1.3
Pregnant women received IFA tablets 39.3
Elderly population (60+ years)(%)
7.3
Safe delivery 34.4
Young people (10-24 years) (%)
32.4
Institutional delivery 31.0
Decadal Growth Rate, 1991-2001 (%)
20.8
Children with full immunization 67.3
Population density (per sq. km)
162
Sex Ratio (females per 1000 males)
Medical/Health Infrastructures/ Institutions
1991
897
2001
901
CHCs
3
Child Sex Ratio (0-6 years)
(girls per 1000 boys)
PHCs
34
1991
973
Sub-Centres 148
2001
934
Literacy rate (7+)
Information on HIV/AIDS
Persons
70.4
HIV+ among ANC clinics (%)
-
Males
79.4
HIV+ among STD clinics (%) 0.81
Females
60.4
Number of Integrated Counseling and Testing
Centres (ICTC formerly VCTC)
2
Total work participation rate
49.3
Number of Prevention of Parent To Child
Transmission Centres (PPTCTC)
-
Female work participation rate
41.3
Number of Anti Retroviral Therapy (ART)
Centres
-
157

18 Pages 171-180

▲back to top


18.1 Page 171

▲back to top


District Profile - Himachal Pradesh
158

18.2 Page 172

▲back to top


District Profile - Himachal Pradesh
DISTRICT : SHIMLA
General information
Household amenities, (%), Census 2001
Area (Sq. Kms.)
5131
Households with kutchha houses 2.2
Percent to total state’s area
9.2
Households with safe drinking water 89.9
-
Households with electricity connection 94.0
-
Vital rates
Villages
2520
Crude Birth Rate, 2001 18.9
Total Fertility Rate, 2001
2.2
Demographic particulars
(Census, 2001)
Infant Mortality Rate, 2001
54
Population
Key RCH indicators from District Level
Household Survey, 2002-04 (%)
Persons 722502
Girls marrying below 18 years 3.8
Males 380996
Birth order 3 and above 17.8
Females 341506
Current use of any FP Method 79.2
Rural (%)
76.9
Total unmet need
8.7
Urban (%)
23.1
Pregnant women with any ANC 85.9
Scheduled Castes (%)
26.1
Pregnant women with 3+ ANCs 70.1
Scheduled Tribes (%)
0.6
Pregnant women received IFA tablets 46.5
Elderly population (60+ years)(%)
7.8
Safe delivery 65.2
Young people (10-24 years) (%)
31.4
Institutional delivery 62.5
Decadal Growth Rate, 1991-2001 (%)
17.0
Children with full immunization 81.8
Population density (per sq. km)
141
Sex Ratio (females per 1000 males)
Medical/Health Infrastructures/ Institutions
1991
894
2001
896
CHCs
6
Child Sex Ratio (0-6 years)
(girls per 1000 boys)
PHCs
77
1991
958
Sub-Centres 259
2001
929
Literacy rate (7+)
Information on HIV/AIDS
Persons
79.1
HIV+ among ANC clinics (%)
-
Males
87.2
HIV+ among STD clinics (%) 0.00
Females
70.1
Number of Integrated Counseling and Testing
Centres (ICTC formerly VCTC)
3
Total work participation rate
51.2
Number of Prevention of Parent To Child
Transmission Centres (PPTCTC)
-
Female work participation rate
44.2
Number of Anti Retroviral Therapy (ART)
Centres
1
159

18.3 Page 173

▲back to top


District Profile - Himachal Pradesh
160

18.4 Page 174

▲back to top


District Profile - Himachal Pradesh
DISTRICT : KINNAUR
General information
Household amenities, (%), Census 2001
Area (Sq. Kms.)
6401
Households with kutchha houses 6.0
Percent to total state’s area
11.5
Households with safe drinking water 84.3
-
Households with electricity connection 91.1
-
Vital rates
Villages
234
Crude Birth Rate, 2001 0.0
Total Fertility Rate, 2001 0.0
Demographic particulars
(Census, 2001)
Infant Mortality Rate, 2001
75
Population
Key RCH indicators from District Level
Household Survey, 2002-04 (%)
Persons 78334
Girls marrying below 18 years 16.4
Males 42173
Birth order 3 and above 30.8
Females 36161
Current use of any FP Method 68.8
Rural (%) 100.0
Total unmet need 12.9
Urban (%)
0.0
Pregnant women with any ANC 94.9
Scheduled Castes (%)
9.7
Pregnant women with 3+ ANCs 66.2
Scheduled Tribes (%)
71.8
Pregnant women received IFA tablets 53.7
Elderly population (60+ years)(%)
9.1
Safe delivery 38.4
Young people (10-24 years) (%)
29.6
Institutional delivery 33.5
Decadal Growth Rate, 1991-2001 (%)
9.9
Children with full immunization 65.9
Population density (per sq. km)
12
Sex Ratio (females per 1000 males)
Medical/Health Infrastructures/ Institutions
1991
856
2001
857
CHCs
3
Child Sex Ratio (0-6 years)
(girls per 1000 boys)
PHCs
17
1991
958
Sub-Centres
33
2001
979
Literacy rate (7+)
Information on HIV/AIDS
Persons
75.2
HIV+ among ANC clinics (%) 0.00
Males
84.3
HIV+ among STD clinics (%)
-
Females
64.4
Number of Integrated Counseling and Testing
Centres (ICTC formerly VCTC)
1
Total work participation rate
61.0
Number of Prevention of Parent To Child
Transmission Centres (PPTCTC)
-
Female work participation rate
54.7
Number of Anti Retroviral Therapy (ART)
Centres
-
161

18.5 Page 175

▲back to top


18.6 Page 176

▲back to top


18.7 Page 177

▲back to top


State Profile - Chandigarh
STATE PROFILE : CHANDIGARH
Key Demographic, Health and RCH Indicators at a glance
General information
Area (sq. kms.)
No. of Districts
No. of Sub Districts
No. of Total Villages
No. of Towns
Demographic particulars (Census, 2001)
Population
Persons
Males
Females
Rural (%)
Urban (%)
Scheduled Castes (%)
Scheduled Tribes (%)
Elderly population (60+ years) (%)
Young people (10-24 years) (%)
Decadal Growth Rate, 1991-2001 (%)
Population density (per sq. km)
Sex Ratio (females per 1000 males)
Child Sex Ratio (0-6 years) (girls per 1000 boys)
Literacy rate (7+)
Persons
Males
Females
Work participation rate
Female work participation rate
Proportion of people living below poverty line, 2004-05
Per capita net state domestic product at current prices in rupees, 2005-06
Human Development Index (HDI), 2001 (among 28 states)
Value
Rank
Social Development Index (SDI), 2001 (among 20 major states)
Rural
Value
Rank
Urban
Value
Rank
Household amenities (%), Census 2001
Households with kutchha houses
Households with safe drinking water
Households with electricity connection
Vital indices
Crude Birth Rate (CBR), 2006, SRS
Total Fertility Rate (TFR), 2006, SRS
Age Specific Fertility Rates, 2006, SRS
15-19 years
14
1
1
23
1
900635
506938
393697
10.2
89.8
17.5
NA
5.0
32.1
40.3
7900
777
845
81.9
86.1
76.5
37.8
14.2
3.8
67910
NA
NA
NA
NA
NA
NA
3.2
99.8
96.8
15.8
NA
NA
165

18.8 Page 178

▲back to top


166
State Profile - Chandigarh
20-24 years
25-29 years
30-34 years
35-39 years
40-44 years
45-49 years
General Fertility Rate, 2006,SRS
Gross Reproduction Rate, 2006, SRS
Life Expectancy at Birth, 2000-2004, SRS
Crude Death Rate (CDR), 2006, SRS
Maternal Mortality Ratio (MMR), 2001-03, RGI
Under five mortality rate, 2006, SRS
Infant Mortality Rate (IMR), 2006, SRS
Neo-natal mortality rate, 2006, SRS
Early neo-natal mortality rate, 2006, SRS
Late neo-natal mortality rate, 2006, SRS
Post neo-natal mortality rate, 2006, SRS
Peri-natal mortality rate, 2006, SRS
Still birth rate, 2006, SRS
Key RCH and nutrition indicators (%)
Girls marrying below 18 years, DLHS, 2002-04
Birth order 3 and above, DLHS, 2002-04
Current use of any FP method, DLHS, 2002-04
Total unmet need, DLHS, 2002-04
Pregnant women with any ANC, DLHS, 2002-04
Pregnant women with 3 + ANCs, DLHS, 2002-04
Pregnant women received IFA tablets, DLHS, 2002-04
Safe delivery, DLHS, 2002-04
Institutional delivery, DLHS, 2002-04
Children with full immunization (12-23 months), DLHS, 2002-04
Children under 3 years who are underweight, NFHS-3, 2005-06
Children under 3 years who are stunted, NFHS-3, 2005-06
Children under 3 years who are wasted, NFHS-3, 2005-06
Children age 6-35 months who are anaemic, NFHS-3, 2005-06
Ever married women age 15-49 years who are anaemic, NFHS-3, 2005-06
Medical/Health Infrastructures/Institutions
Community Health Centres (CHCs)
Primary Health Centres (PHCs)
Sub Centres (SCs)
Information on HIV/AIDS (%)
Women who have heard of HIV/AIDS, NFHS-3, 2005-06
Men who have heard of HIV/AIDS, NFHS-3, 2005-06
Women who know that consistent condom use can reduce the chances of getting HIV/AIDS,
NFHS-3, 2005-06
Men who know that consistent condom use can reduce the chances of getting HIV/AIDS,
NFHS-3, 2005-06
HIV+ among ANC clinics (%)
HIV+ among STD clinics (%)
Number of Integrated Counseling and Testing Centres (ICTC formerly VCTC)
Number of Prevention of Parent To Child Transmission Centres (PPTCTC)
Number of Anti Retroviral Therapy (ART) Centres
NA
NA
NA
NA
NA
NA
NA
NA
NA
4.1
NA
NA
23
NA
NA
NA
NA
NA
NA
4.4
38.5
60.9
17.8
90.5
75.6
43.6
59.1
47.4
52.4
NA
NA
NA
NA
NA
1
0
13
NA
NA
NA
NA
0.25
1.66
9
6
1

18.9 Page 179

▲back to top


18.10 Page 180

▲back to top


District Profile - Chandigarh
168

19 Pages 181-190

▲back to top


19.1 Page 181

▲back to top


District Profile - Chandigarh
DISTRICT : CHANDIGARH
General information
Area (Sq. Kms.)
114
Percent to total state’s area
100
-
-
Villages
23
Demographic particulars
(Census, 2001)
Population
Persons
Males
Females
Rural (%)
Urban (%)
Scheduled Castes (%)
Scheduled Tribes (%)
Elderly population (60 + years)(%)
Young people (10-24 years) (%)
Decadal Growth Rate, 1991-2001 (%)
Population density (per sq. km)
Sex Ratio (females per 1000 males)
1991
2001
Child Sex Ratio (0-6 years)
(girls per 1000 boys)
1991
2001
Literacy rate (7+)
Persons
Males
Females
900635
506938
393697
10.2
89.9
17.5
0.0
5.0
32.1
40.3
7900
790
777
899
845
81.9
86.1
75.6
Total work participation rate
37.8
Female work participation rate
14.2
Household amenities, (%), Census 2001
Households with kutchha houses
Households with safe drinking water
Households with electricity connection
Vital rates
Crude Birth Rate, 2001
Total Fertility Rate, 2001
Infant Mortality Rate, 2001
Key RCH indicators from District Level
Household Survey, 2002-04 (%)
Girls marrying below 18 years
Birth order 3 and above
Current use of any FP Method
Total unmet need
Pregnant women with any ANC
Pregnant women with 3+ ANCs
Pregnant women received IFA tablets
Safe delivery
Institutional delivery
Children with full immunization
Medical/Health Infrastructures/ Institutions
CHCs
PHCs
Sub-Centres
Information on HIV/AIDS
HIV+ among ANC clinics (%)
HIV+ among STD clinics (%)
Number of Integrated Counseling and Testing
Centres (ICTC formerly VCTC)
Number of Prevention of Parent To Child
Transmission Centres (PPTCTC)
Number of Anti Retroviral Therapy (ART)
Centres
3.2
99.8
96.8
20.1
2.2
23
4.4
38.5
60.9
17.8
90.5
75.6
43.6
59.1
47.4
53.3
1
0
13
0.25
9
-
1
169

19.2 Page 182

▲back to top


19.3 Page 183

▲back to top


Glossary
1. Anaemia
Severe : Anaemia-haemoglobin level <110 grams/deciliter (g/dl) for children and pregnant
women and <12.0 g/dl for non pregnant women.
Stunted : Stunting is assessed in by height-for-age.
Wasted : Wasting is assessed by weight-for-height
Underweight : Underweight is assessed by weight-for-age.
2. Child Sex Ratio (0-6 years) : Number of girls in the age-group 0-6 years per 1000 boys in the same
age-group.
3. Crude Birth Rate (CBR) : Total number of births in a given year and in a given geographical area
per thousand mid-year (average) population in the same year and geographical area.
4. Crude Death Rate (CDR) : Total number of deaths in a given year and in a given geographical area
per thousand mid-year (average) population in the same year and geographical area.
5. Electrified Households : Households having electricity as source of lighting.
6. Human Development Index (HDI) : The Human Development Index (HDI) is a summary measure
of human development. It measures the average achievement of the country in three basic
dimensions of human development i.e., health, education and income.
7. Infant Mortality Rate (IMR) : The number of death of infants under age 1 per 1,000 live births in
a given year.
8. Life Expectancy at Birth : Average number of years a new born child is expected to live under
current mortality conditions.
9. Literacy Rate : Percentage of literates to the total population age 7 years and above.
10. Maternal Mortality Ratio (MMR) : Number of deaths of women during pregnancy or within 42
days of termination of pregnancy from any cause related to pregnancy/childbearing and childbirth
per 100,000 live births in a given year.
11. Safe Drinking Water : Drinking water from the safe sources such as Tap, Hand Pump and Tube
Well are classified as safe drinking water.
12. Social Development Index (SDI) : The social development index captures six major dimensions
of social development namely demographic parameters, health situation, poverty and extent of
social deprivation.
13. Sex Ratio : Number of females per 1000 males.
171

19.4 Page 184

▲back to top


14. Temporary Houses (Kutchha Houses) : Houses in which both walls and roof are made of materials,
which have to be replaced frequently. Walls may be made from any one of the following temporary
materials, namely, grass, thatch, bamboo, plastic, polythene, mud, unburnt bricks or wood. Roof
may be made from any one of the following temporary materials, namely, grass, thatch, bamboo,
wood, mud, plastic or polythene.
15. Total Fertility Rate (TFR) : The average number of childern that would be born alive to a woman
during her life time if she were to pass through her child bearing years conforming to the age
specific fertility rates of a given year.
16. Work Participation Rate : Percentage of total workers (main and marginal) to total population.
172

19.5 Page 185

▲back to top


References
1. Bulletin on Rural Health Statistics in India, (2006), Ministry of Health and Family Welfare
Government of India
2. Central Bureau of Health Intelligence, (2006), Health Information of India, 2005, Ministry of
Health & Family Welfare, Government of India
3. Christophe Z Guilmoto, S Irudaya Rajan, District Level Estimates of Fertility from India’s 2001
Census, Economic and Political Weekly February 16, 2002
4. Council for Social Development (2006), India Social Development Report, OXFORD
5. Directorate of Census Operations, (2001), Haryana, Primary Census Abstract, Census of India,
2001
6 Directorate of Census Operations, (2001), Himachal Pradesh, Primary Census Abstract, Census
of India, 2001
7. Directorate of Census Operations, (2001), Punjab, Primary Census Abstract, Census of India,
2001
8. Directorate of Census Operations, Chandigarh, (2001), Primary Census Abstract, Census of
India, 2001
9. Directorate of Census Operations, Chandigarh, (2001), Provisional Population Totals,Paper-1
of 2001,Census of India,2001
10. Directorate of Census Operations, Haryana, (2001), Provisional Population Totals,Paper-1 of
2001,Census of India,2001
11. Directorate of Census Operations, Himachal Pradesh, (2001) Provisional Population Totals,Paper-
1 of 2001,Census of India,2001
12. Directorate of Census Operations, Punjab, (2001), Provisional Population Totals,Paper-1 of
2001,Census of India, 2001
13. International Institute for Population Sciences (IIPS), Mumbai, (2006), Reproductive and Child
Health-District Level Household Survey (RCH-DLHS), 2002-2004
14. International Institute for Population Sciences (IIPS), Mumbai, (2006), National Family Health
Survey, 3, 2005-2006
15. Ministry of Finance, Economic Division, (2007), Economic Survey, 2006-07, Government of
India
16. National Institute of Health & Family Welfare (NIHFW) and National AIDS Control Organization
(NACO), New Delhi (2007), Annual Sentinel Surveillance for HIV Infection in India: Country
Report ,2005.
17. Population Foundation of India (2006), Loosing Count; Mapping India’s Child Sex Ratio.
18. Population Foundation of India(PFI), New Delhi(2008), Infant and Child Mortality in India:
District Level Estimates
173

19.6 Page 186

▲back to top


19. Registrar General and Census Commissioner of India, (2001), Report and Tables on Age,C-
14,2001, Census of India, 2001
20. Registrar General, India, (2001), Housing Atlas of India, Census of India, 2004.
21. Registrar General, India, (2001), Tables on Housing and Household Amenities, Census of India,
2001
22. Registrar General, India, (2004), Sample Registration System, Statistical Report No.1 of 2006
23. Registrar General, India, (2004), Primary Census Abstract, Total Population: Table A-5, Series-I,
New Delhi, Census of India, 2001
24. Registrar General, India, (2006), Sample Registration System, SRS Bulletin, October, 2006
25. Registrar General, India, (2006), SRS based Abridged Life Tables, 1999-2003.
26. UNDP, (2002), Human Development Indices in India: Trends and Analysis
174

19.7 Page 187

▲back to top


PFI POPULATION
FOUNDATION
OF INDIA
B-28, Qutab Institutional Area, Tara Crescent, New Delhi 110 016
Tel. No : 42899770, Fax : 42899795
Website : www.popfound.org, E-mail : popfound@sify.com