Women%27s Empowerment %26 Female Headed Household- An Empirical Analysis

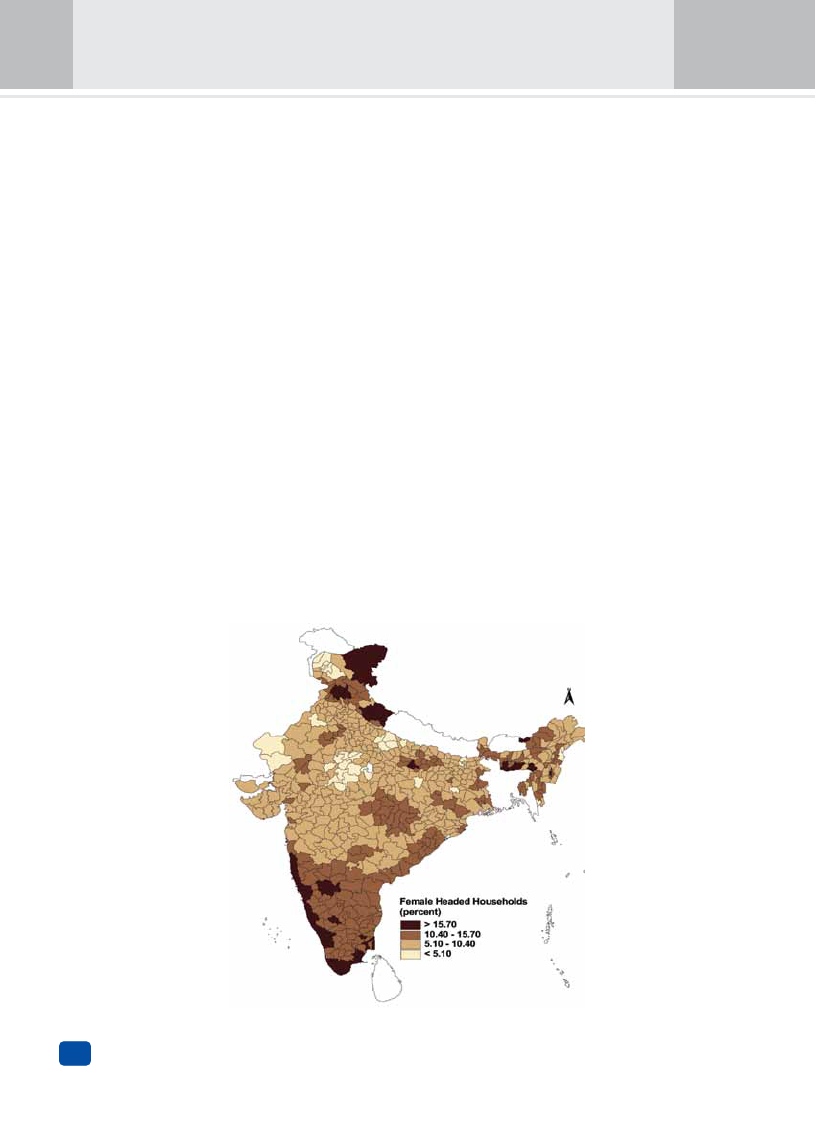
Women%27s Empowerment %26 Female Headed Household- An Empirical Analysis


1 Pages 1-10

▲back to top


1.1 Page 1

▲back to top


Women’s
Empowerment
& Female-Headed
Households
An Empirical Analysis
Mahendra K. Premi
Lalitendu Jagatdeb
Nihar Ranjan Mishra
Lopamudra Paul
POPULATION FOUNDATION OF INDIA

1.2 Page 2

▲back to top


1.3 Page 3

▲back to top


WOMEN’S EMPOWERMENT AND
FEMALE-HEADED HOUSEHOLDS
An Empirical Analysis
Mahendra K. Premi
Professor of Demography
Formerly at Jawaharlal Nehru University
P. F. I. Team
Lalitendu Jagatdeb
Manager (MIS) Health of the Urban Poor
Nihar Ranjan Mishra
Programme Manager (Monitoring & Evaluation)
Lopamudra Paul
Former Research Associate (Monitoring & Evaluation)
Funded by
Population Foundation of India

1.4 Page 4

▲back to top


1.5 Page 5

▲back to top


FOREWORD
The International Conference on Population and Development (ICPD) in 1994 represented a quantum
leap for population and development policies as it involved a paradigm shift from the previous emphasis
on demography and population control to sustainable development and reproductive rights. Further, the
United Nations emphasized on promotion of gender equality and women’s empowerment in the Millennium
Development Goals (MDGs). The National Population Policy 2000 focused on providing reproductive health
care, primary and secondary education, basic amenities and empowering women in the country.
The study ‘Women’s Empowerment and Female-Headed Households’ attempts to examine the relationship
between women’s empowerment and female-headed households in India from empirical data sources like
decadal Census, the National Family Health Survey-3 and the National Sample Survey (61st Round). As per
2001 Census data, one-tenth of the households in the country have females as household head and Kerala,
Himachal Pradesh and Uttarakhand have a high proportion of female-headed households in the country. It is
found that among female household heads, two-thirds are widows. On the other hand, female head in single
person households are mostly unmarried. The study found that women in female-headed households have
more freedom in making decisions regarding spending their own cash, personal health care, major household
purchases, daily household needs and visits to family/relatives.
I would like to place on record our appreciation of Dr. Mahendra K. Premi’s expertise on this endeavour. Dr.
Premi served as Professor of Demography in Jawaharlal Nehru University in New Delhi and was a visiting
fellow in East-West Centre, Honolulu, Hawaii. He was President of the Indian Association for the Study of
Population (IASP) and was also associated with the Indian Census organization for a long time. Dr. Lalitendu
Jagatdeb, Nihar Ranjan Mishra and Dr. Lopamudra Paul from PFI were associated with this study.
We hope the report will be useful to researchers, policymakers and programme managers. It also shows how
women are more empowered in female-headed households.
A. R. Nanda

1.6 Page 6

▲back to top


ACKNOWLEDGEMENTS
For quite some time, I have been toying with the idea of preparing a monograph related to female headship
rates in India by analysing extant secondary data from different sources and conducting a sample survey of
women and male-headed households to compare and contrast their characteristics.
I contributed a small write-up on Female-Headed Households in India to the Indian Association of
Parliamentarians on Population and Development (IAPPD) for publication in its newsletter. Mr. A. R. Nanda,
former Executive Director, Population Foundation of India, suggested that I undertake a more detailed analysis
of the available data. The exercise was carried out with the secondary data available from the 2001 Census,
National Sample Survey (61st Round) and National Family Health Survey (3rd Round). I am grateful to Mr.
Nanda for providing me the technical support for the study as well as to the Population Foundation of India
for providing me with the necessary funds.
I am also grateful to Dr. Lalitendu Jagatdeb, Manager – MIS, HUP, PFI; Mr. Nihar Ranjan Mishra, Programme
Manager (Monitoring & Evaluation), PFI; and Dr. Lopamudra Paul, former Research Associate (Monitoring
& Evaluation), PFI who commented on the proposal and the drafts of the report. I am also thankful to Mr. K.
Varghese who undertook data analysis, especially of NFHS-3 and NSS 61st.
Mahendra K. Premi

1.7 Page 7

▲back to top


CONTENTS
List of Tables and Maps...........................………………………………............................... vi-vii
Abbreviations…………………………………………………………………...................... viii
Executive Summary…………………………………………………………........................ ix-xiv
1.0 Introduction
1.1 Objectives
1.2 Past Progress
1.3 Data Availability
1.4 Approach for Data Analysis
01-02
01
02
02
02
2.0 Proportion of Female-Headed Households (FHH) in the Census, NFHS-3 and NSS
61st Round
02-05
2.1 Proportion of Female-Headed Households in the Census,
05
NFHS-3 and NSS 61st Round by Residence Type
3.0 Percentage of Female-Headed Households by Marital Status
05-07
4.0 Household Composition and Headship Rates
08
5.0 Percentage of Female-Headed Households by Religion and Social Group
09-10
5.1 Religion
09
5.2 Social Group
10
6.0 Mean Household Size
11-12
6.1 Mean Household Size by Religion
6.2 Mean Household Size by Social Groups
11-12
12
7.0 Distribution of Headship Rates of Households by Age and Marital Status
13-14
8.0 Headship Rates by Sex and Educational Attainment
14-15
9.0 Women’s Employment
16-17
9.1 Earnings of Women Workers
16
10.0 Women’s Autonomy, Decision Making and Empowerment
17-20
11.0 Headship Rates by Sex and Monthly per Capita Expenditure and Wealth Index
20-22
12.0 Classification of Female and Male-Headed Households by Available Amenities
22-23
13.0 Summary
23-28
13.1 Proportion of Female-Headed Households
24
13.2 Percentage of Female-Headed Households by Marital Status
24
13.3 Household Composition and Headship Rates
25
13.4 Percentage of Female-Headed Households by Religion and Social Group
25
13.5 Mean Household Size
25
13.6 Headship Rates by Sex and Educational Attainment
25
13.7 Women’s Employment
13.8 Women’s Autonomy, Decision Making and Empowerment
26
26-27
13.9 Headship Rates by Sex, Monthly Per Capita Expenditure and Wealth Index
27-28
13.10 Classification of Female and Male-Headed Households by Available Amenities
28
14.0 Conclusion
28

1.8 Page 8

▲back to top


LIST OF TABLES
Table 1.
Households by sex of household heads and proportion of female-headed households
(FHH), India and States, 2001 Census, NFHS-3 and NSS 61st Round
03
Table 2.
Proportion of FHH according to the Census, NFHS-3 and NSS 61st Round by residence
type
05
Table 3.
Proportion of FHH by marital status and residence type, 2001 Census,
NFHS-3 and NSS 61st Round
06
Table 4. Household types by male and female-head in India, 2001 Census
08
Table 5. Percentage of female-headed households by religion
Table 6.
Proportion of female-headed households by social groups, NFHS-3 and NSS 61st
Round
Table 7.
Mean household size by sex of household head and by rural urban residence, India,
Census 2001, NFHS-3 and NSS 61st Round
Table 8.
Mean household size by religion for India by residence type from 2001 Census,
NFHS-3 and NSS 61st Round
Table 9.
Male and female-headed households by age and marital status, India, 2001 Census,
NFHS-3 and NSS 61st Round
Table10.
Literacy rate among female and male household heads by residence type, NFHS-3 and
NSS 61st Round
Table 11.
Percentage of people up to middle and up to higher secondary among literates in India
according to NSS 61st Round and NFHS-3
Table 12.
Occupational classification of workers in female and male-headed households by
residence type, NSS 61st Round
Table 13.
Respondent’s type of earnings for work where female is head and where male is
household head, India, NFHS-3
Table 14.
Person(s) in the household who decides how to spend wives cash earnings by sex of
household head aged 15-49 years
Table 15. Women’s participation in decision making by sex of household head aged 15-49 years
Table 16.
Women’s freedom of movement to certain places by sex of household head (women in
the age group 15-49 years)
Table 17.
Distribution of FHH and MHH by availability of electricity, toilet within premises and
safe drinking water, India, NFHS-3
09
10
11
11
13
14-15
15
16-17
17
18
18-19
20
22
vi

1.9 Page 9

▲back to top


APPENDIX TABLES
A1.
Percentage distribution of household head by sex and marital status, India and big
states, Census 2001, NFHS-3 and NSS 61st Round
29-30
A2.
Percentage of female-headed households by religion, India, big states and Delhi, 2001
Census, NFHS-3 and NSS 61st Round
31-32
A3.
Percentage of female-headed households by social groups, India, big states and Delhi,
NFHS-3 and NSS 61st Round
33-34
A4.
Mean household size by sex of household head and religion, 2001 Census, NFHS-3 and 34-36
NSS 61st Round
A5.
State-wise mean household size by social groups, NFHS-3 and NSS 61st Round
36-37
A6.
State-wise literacy rate among female and male household heads
A7.
State-wise proportion of FHH and MHH for those who have completed Higher
Secondary Education, NFHS-3 and NSS 61st Round
A8.
State-wise Distribution of FHH and MHH by MPCE Classes (NSS Rural)
37-38
38
39
A9.
State-wise distribution of FHH & MHH by MPCE Classes (NSS Urban)
39-40
A10.
Percent distribution of female and male headed households by income categories, India,
big states and Delhi, NFHS-3
40
A11. State-wise Distribution of MHH & FHH by Wealth Index, NFHS-3
41
A12
Percent distribution of FHH and MHH by availability of electricity, toilet facility and
safe drinking water on the premises. India, big states and Delhi, NFHS-3
41-42
LIST OF MAPS
1.
District-wise percentage of female-headed households in India, Census 2001
04
2.
Proportion of ‘currently married’ females among female household heads at district
level, India, 2001 Census
07
3.
Proportion of widowed, divorced and separated females among female household heads
at district level, India, 2001 Census
07
vii

1.10 Page 10

▲back to top


ABBREVIATIONS
AIDS
FHH
FHR
HH
HIV
ICPD
MDGs
MHH
MHS
MoHFW
MPCE
NFHS
NPP
NSSO
OBC
SC
ST
UNDP
Acquired Immune Deficiency Syndrome
Female-Headed Household
Female Headship Ratio
Household
Human Immunodeficiency Virus
International Conference on Population and Development
Millennium Development Goals
Male-Headed Household
Mean Household Size
Ministry of Health and Family Welfare
Monthly Per Capita Expenditure
National Family Health Survey
National Population Policy
National Sample Survey Organization
Other Backward Class
Scheduled Caste
Scheduled Tribe
United Nations Development Programme
viii

2 Pages 11-20

▲back to top


2.1 Page 11

▲back to top


EXECUTIVE SUMMARY
Introduction
The International Conference on Population and Development (ICPD), 1994 postulated that population
policies should be viewed as an important part of programmes on women’s development, women’s rights,
women’s reproductive health, poverty alleviation and sustainable development. The United Nations has put
special emphasis on promotion of gender equality and women’s empowerment in its Millennium Development
Goals (MDGs) that were enunciated with a view to achieve poverty reduction and sustainable development.
Recognising that population stabilisation was an essential requirement for promoting sustainable development
with more equitable distribution of resources, the National Population Policy 2000 (NPP 2000) laid special
emphasis on making reproductive health care more accessible and affordable for all. Along with that it aimed
at increasing provision of primary and secondary education, extending basic amenities including sanitation,
safe drinking water and housing, and empowering women. Keeping the above in view, we examined in this
monograph the situation of females as household heads vis-à-vis their counterparts.
When we talk of ‘women’s empowerment’ five issues are generally discussed at the national as well as
international levels. These relate to girls’ education, women’s employment, reproductive health, decision
making at the family and societal level, and political participation. We get certain information about the
progress achieved partly from decadal population censuses and partly from large sample surveys.
India’s 2001 population Census gives separate information for male-headed households (MHH) and female-
headed households (FHH) on certain variables like age, marital status, religion and household size. The
National Family Health Survey (NFHS-3) 2005-06, provides information on the education and employment
status of male and female household heads. It also tells us about decision making in household matters by
male and female heads as also on household income (wealth index). Information on availability of certain
basic amenities like safe drinking water, electricity and toilet facility within the premises are other important
indicators of social equality that are available from the NFHS. Similarly, the National Sample Survey (NSS)
data relating to 61st Round (2004-05) provides information on educational attainment and occupational
placement of male and female household heads. One also gets information on total household expenditure.
As the main objective of the present research, we examined the extent of female autonomy vis-à-vis their
destitution utilising the extant data, especially from the NFHS-3 and NSS 61st Round. As indicated earlier,
one of the objectives of the United Nation’s Millennium Development Goals (MDGs) is to promote gender
equality and women’s empowerment. This has been examined by separately tabulating information on relevant
indicators for male and female-headed households.
Proportion of Female-Headed Households
One-tenth of the households in India as of 2001 Census have females as household heads. Their proportion
in Kerala was 22.6 percent; it was 17.9 percent in Himachal Pradesh and 16.3 percent in Uttaranchal (now
Uttarakhand). Besides, it was well above the national average of 10.4 percent in Andhra Pradesh, Chhattisgarh,
Karnataka and Tamil Nadu. Among smaller states this proportion was high in Goa, Manipur, Meghalaya and
Mizoram. In contrast, the proportion of female-headed households was quite low in Bihar, Gujarat, Haryana,
Jammu and Kashmir, Jharkhand, Madhya Pradesh, Rajasthan and Uttar Pradesh among large states.
The proportion of female-headed households was 14.4 percent according to the National Family Health Survey
(NFHS-3: 2005-06) and 10.8 percent in the NSS 61st Round (2004-05).
Female Headship Rates (FHR) are higher in NFHS-3 compared to Census 2001 by four percent points at
the national level. The rates are higher in all the states compared to the Census. Bihar is especially an outlier
where the NFHS FHR at 25 percent is the highest compared to only 7.4 percent in the Census and 11.8 percent
in NSS, which needs some probing with more detailed data. FHR were higher by almost six percent points in
ix

2.2 Page 12

▲back to top


NFHS in Tamil Nadu and Uttar Pradesh; they were also higher by three or more points in Haryana, Jharkhand,
Orissa and West Bengal.
The pattern of FHR remains the same in NSS as in 2001 Census. In NSS too, Kerala, Himachal Pradesh and
Uttaranchal stand out having larger proportions of FHH.
Percentage of Female-Headed Households by Marital Status
The proportion of male and female-headed households by marital status and residence type at the national level
indicates that among males, ‘currently married’ ones are mostly household heads. Among female household
heads, almost two-thirds are widowed. A little over a quarter are ‘currently married’. The latter situation
basically arises from migration of male members for work.
The observed pattern is similar in Census, NFHS and NSS. It is also similar in both rural and urban areas.
We find that the proportion of currently married females is higher in rural areas in all the three data sets.
Consequently, the proportion of widowed females is higher in urban areas.
The data at the state level for 2001 Census, NFHS-3 and NSS 61st Round shows that among male heads, 90
percent or more were currently married as expected in a patriarchal society where the man is the principal
bread-winner. Among women household heads, while at the national level the proportion of ‘currently
married’ women stood at slightly below 30 percent, it was more than 40 percent in Bihar, Himachal Pradesh,
Jammu and Kashmir and Uttaranchal according to 2001 Census; in Bihar, Jammu and Kashmir, Jharkhand,
Rajasthan and Uttar Pradesh as per NFHS data and in Bihar, Himachal Pradesh, Rajasthan, Uttar Pradesh and
Uttaranchal according to NSS. It is noteworthy that currently married women as household heads comprise 66
percent in Bihar and more than 50 percent in Uttar Pradesh in both NFHS and NSS surveys.
Household Composition and Headship Rates
From the data on household composition we observe that at the national level 89.6 percent of households were
headed by males and 10.4 percent by females.
In the 2001 Census a total of 8.3 million households were recorded as ‘single-person’ households comprising
4.3 percent of the total households. Proportionately, single-member households were more with female head
(19 percent) as against 2.6 percent in respect of male head. Of the total 4.5 million single-person MHH, 87
percent were one-person households. Among women, of the total 3.8 million single-person households, 98.3
percent were one-person households implying that almost all women heading single-person households were
living alone. It is quite likely that most of them are widows and some unmarried.
Percentage of Female-Headed Households by Religion and Social Groups
In analysing information on the proportion of female-headed households by religion at the national level
based on 2001 Census, NFHS-3 and NSS 61st Round, we have taken only four major religions: Hindus,
Muslims, Christians and Sikhs.
The proportion of females as household heads among Christians was well above that for the other three
religions in all the three data sets. The proportion of FHH was marginally higher among Muslims compared to
Hindus and Sikhs. It is noteworthy that while Christian women have larger autonomy and tendency to migrate
independently, this is not true in respect of Muslim women. It is quite likely that there is substantial migration
of Muslim males to certain other parts of the country and to other countries, especially the Gulf, to make a
living.
x

2.3 Page 13

▲back to top


Mean Household Size
We observe that FHH are smaller in size than MHH by 1.4 persons in the Census as well as in the NFHS.
They are smaller by 1.2 persons per household in NSS 61st Round. The pattern is same in both rural and urban
areas. This difference in size is because proportionately single-person households are more among females
than males. Further, currently married women become household head largely because of male migration for
various reasons reducing household size.
At the national level the mean household size is higher by one person for both male and female-headed
households for Muslims compared to Hindus followed by Sikhs. In contrast, the mean household size of
Christians is the lowest. This applies to all three data sources – 2001 Census, NFHS and NSS. The pattern is
repeated in rural as well as urban areas.
Headship Rates by Sex and Educational Attainment
According to NFHS-3, one-third of female household heads were literate in comparison to two-thirds male
literate household heads. A little over half urban female household heads were literate as against 83.3 percent
of urban male household heads. Literacy rate pattern is found to be similar in both NSS as NFHS.
We examined the completed level of education – middle (up to VIII standard) and secondary – among literate
household heads from NFHS and NSS data sets. At the national level we observe that among literates, a higher
proportion of women household heads have completed middle level education. A slightly higher proportion of
FHH had completed secondary education as well, both in NFHS-3 and NSS, but more males were graduates.
There are state-wise differences in educational attainment. The proportion of women household heads among
literates that completed higher secondary education according to NFHS-3 was 90 percent or above in a
majority of states. However, those who had completed beyond higher secondary education, by more than 15
percent, were in Jharkhand (16 percent), Maharashtra (22.8 percent), Rajasthan (23.9 percent) and Delhi (24.4
percent). It is surprising to know that among literate women in Jharkhand and Rajasthan, a high proportion had
more than secondary education, whereas female literacy rates were 23.0 percent and 12.3 percent respectively.
In contrast, the proportion of female household heads who had gone beyond secondary education in Kerala
and Tamil Nadu was just 6.7 percent and 8.4 percent respectively.
The pattern of female heads who had completed higher secondary education in NSS was almost similar to the
one observed from NFHS data. Here it were Karnataka, Maharashtra, Rajasthan and Delhi that had more than
15 percent of women household heads who had completed higher secondary education.
Women’s Employment
NSS 61st Round data indicate that 28 percent women among household heads were non-workers against four
percent of men as household heads. Among female workers 18 percent were found in white collar occupations
while 22 percent males were engaged in similar jobs. Moreover, while the proportion of female household
heads in white collar jobs was one-tenth in rural areas, it was 43 percent in urban areas.
In NFHS among women aged 15-49 years, 57 percent in the total sample (71 percent urban) were non-workers
in FHH. The proportion of non-workers among women in MHH was 58 percent. White collar workers in FHH
comprised 33 percent of total workers in urban areas and 6 percent in rural areas. These figures are similar
for women workers in MHH. Thus, for women being in FHH or MHH made no difference with regard to
employment or those engaged in white collar occupations as far as NFHS is concerned.
xi

2.4 Page 14

▲back to top


Women’s Autonomy, Decision Making and Empowerment
NFHS-3 has obtained data from currently married women aged 15-49 years on certain aspects of their
empowerment and decision making related to their earnings and the person(s) who decides how the same
has to be used; person(s) who takes decisions regarding (1) the woman’s health care (2) major household
purchases (3) purchase of daily household goods and (4) the visit to her family or relatives and the woman’s
freedom of movement - going to the market, the health facility and places outside the village/community.
Similar data have been obtained from men in this age group. In this study we have separated FHH and MHH
among currently married women; hence, we have ignored men’s information.
We examined the type of earnings of women workers who were themselves household heads and those who
were working but a male member was household head. The pattern of earnings of women in FHH and MHH
has been quite similar, 54.7 percent of women in FHH and 53.4 percent in MHH were earning cash only.
We find that in 60 percent of the times women decided themselves as household head how to spend their cash
earnings. With a male household head only 23 percent of wives were able to utilise their earnings on their
own. Thus, women as household heads showed more independence in using their cash earnings.
Regarding decision making, we notice that when a woman is household head, she has greater say in respect to
her own health care and purchase of daily household goods. Further, she along with her husband takes three-
quarters to four-fifths of the decisions on all matters under consideration. In MHH, we observe that only one-
fourth of the times a woman can decide on health care; she has the freedom to purchase for daily household
needs from one-third to two-fifths of the times, but few women have the liberty to make major household
purchases or to go to their family or relatives. Husbands had greater say in decisions on various items except
daily household purchases. Rural-urban differences in this respect are small, although the proportion of urban
women who took decisions, especially with their husbands, even when the male is household head, account
for almost three-fourths of the times.
As regards women’s freedom of movement we analysed these data when she herself was household head and
when a male was household head. To a question regarding freedom to go alone outside the particular village/
community we find that 54 percent of women in FHH thought that they could go alone against 37 percent in
MHH. One may conclude that women in FHH had greater freedom of movement than those in MHH.
Headship Rates by Sex, Monthly Per Capita Expenditure and Wealth Index
As is well known, Indian Census does not collect any data on household income or expenditure.
NSSO has been collecting data on monthly household expenditure in its ‘Consumer Expenditure’ schedule
over time. Similarly, NFHS in its different rounds has collected data on household assets. Classification of
FHH and MHH in rural households into five Monthly Per Capita Expenditure (MPCE) categories: lowest, low,
medium, high and highest as of NSS 61st Round indicates that at the national level there is a little difference
in the proportion of female and male-headed households in different MPCE categories. In fact, the proportion
of FHH and MHH in lowest MPCE category (25.8 percent) is exactly same. The proportion of FHH in rural
areas in highest MPCE category (12.4 percent) is slightly better than that for MHH (10.9 percent). If we put
the lowest and low MPCE categories together, the proportion of FHH (47.9 percent) was a shade lower than
MHH (49.9 percent). In contrast, the proportion of FHH in high and highest categories totaled 31.5 percent as
against 28.2 percent for MHH. Thus, FHH in rural India are better placed than MHH and do not reflect higher
poverty amongst women.
The NSS data shows that urban households at the national level have a slightly higher proportion (7.6 percent)
of FHH in the lowest category of MPCE compared to MHH (4.9 percent). However, the proportion (41.6
xii

2.5 Page 15

▲back to top


percent and 43.8 percent) of the female and male headed households respectively were in highest MPCE
category.
From the NSS data on MPCE we find that FHH are not generally poor. Women household heads might be
getting regular remittances from their spouses and other male members that keep them well above the poverty
line.
NFHS has classified all households on the basis of their income into three categories – low, medium and
high. At the national level while there were 43 percent of FHH in low income category, only 28 percent of
MHH were in it. In contrast, there were 28 percent and 39 percent of FHH and MHH respectively in the high
income category. This indicates that MHH were somewhat better off than FHH in terms of household income
according to NFHS-3.
NFHS has computed ‘wealth index’ using 33 household assets and housing characteristics data to indicate
economic status of households. Utilising the ‘wealth index’ indicator we have classified the FHH and MHH
into poorest, poorer, middle, richer and richest categories. At the national level, 46.7 percent of FHH were in
poorest and poorer categories, which is not very different from what was observed from the NSS data. On the
other hand, the proportion of MHH therein was 36 percent. Accordingly, the proportion of richer and richest
FHH was 33.5 percent whereas that of MHH was 40.8 percent.
Concentrating on the ‘poorest’ category of wealth index we observe that the proportion of FHH was less
than 10 percent in Haryana, Himachal Pradesh, Jharkhand, Kerala, Punjab, Uttar Pradesh, and Delhi. The
proportion of the richest FHH in these states was above 30 percent.
According to NFHS-3, at the national level, FHH are somewhat worse off than MHH whether we consider
income classification in three categories or wealth index dividing the households into five categories. These
results are at variance with those obtained in NSS where the difference between FHH and MHH was marginal.
Classification of Female and Male-Headed Households by Available Amenities
We wanted to assess as to what proportion of FHH and MHH availed three basic amenities – safe drinking
water, toilet facility within the house and electricity. With large scale electrification it is presumed that most
households would have electricity. Safe drinking water is a necessity of life and, therefore, households must
have access to it. Similarly, toilet facility within the premises is a basic necessity and should be available to
all. We classified the FHH and MHH on the basis of availability of these amenities for NFHS-3 for which the
relevant data was available. We are of the view that households that have all three amenities are better placed
than those that possess fewer amenities or none of them.
We find that 25 percent of the FHH had all the three amenities and, therefore, can be regarded as better off.
On the other hand, 26.9 percent of FHH did not have any of the three basic amenities and, hence, they fell
in deprived category. In rural areas only 9.4 percent FHH were able to enjoy all the facilities while 37.2
percent had one. In urban India, almost three-fifths of FHH utilised all the above facilities and less than three
percent had none. Among MHH, 27.6 percent had electricity, toilet facility and safe drinking water on the
premises; hence, they were better off households. In contrast, 22.6 percent of MHH did not have any of the
above facilities and were, therefore, deprived ones. There is only a small difference between FHH and MHH
in respect of availability and non-availability of household amenities, a slightly higher proportion of MHH
having all the three amenities and, correspondingly, a slightly lower proportion of MHH having none of them.
In rural areas, 10.2 percent of MHH had all the three amenities as against 32.6 percent that had none. These
proportions are only slightly better than those found in respect of FHH. Similarly, proportions for urban MHH
are somewhat better than those for FHH.
xiii

2.6 Page 16

▲back to top


Concluding Observations
NSSO has been collecting data on monthly household expenditure in its ‘Consumer Expenditure’ schedule
over time. Classification of FHH and MHH in rural households into five Monthly Per Capita Expenditure
(MPCE) categories: lowest, low, medium, high, and highest – as of NSS 61st Round indicates that at the
national level there is little difference in the proportion of female and male-headed households in different
MPCE categories. In fact, from NSS data on MPCE for rural and urban samples we find that FHH are not
generally poor. Women household heads might be getting regular remittances from their spouses and other
male members that keep them well above the poverty line.
According to NFHS-3, at the national level, FHH are somewhat worse off than MHH whether we consider
income classification in three categories or wealth index dividing the households into five categories. These
results are at variance with those obtained in NSS where the difference between FHH and MHH was marginal.
We wanted to assess as to what proportion of FHH and MHH respectively availed three basic amenities – safe
drinking water, toilet facility within the house and electricity. This data was available only from NFHS-3. We
find that one-quarter of the FHH had all the three basic amenities and, hence, were better off. On the other
hand, 26.9 percent of FHH had none of the basic amenities and, therefore, were deprived. There is only a small
difference between FHH and MHH in respect of availability and non-availability of household amenities,
a slightly higher proportion of MHH having all the three amenities and, correspondingly, a slightly lower
proportion of MHH having none of them.
As the title of the study indicates we were examining if a woman being a household head was more empowered
to take decisions on her own as compared to the one in male-headed household. It was only in NFHS that direct
questions were asked from women and men on certain aspects of decision making and women’s freedom to
move alone to specified places. The data indicate that women as household heads decided more frequently
how to spend their own cash earnings in comparison to women in male-headed households. Similarly, women
respondents in FHH themselves decided more frequently about (a) own health care (b) major household
purchases (c) daily household needs and (d) visit to relatives, than women with male household head. A more
important aspect of ‘freedom of movement to go alone outside the particular village/community’ showed that
a little over half the women as household head could do it compared to less than two-fifths where a male was
the household head. Thus, considering utilisation of her cash earnings and decision-making power in certain
household related matters as also freedom of movement alone, we conclude that women in FHH had greater
freedom than those in MHH.
xiv

2.7 Page 17

▲back to top


WOMEN’S EMPOWERMENT AND
FEMALE-HEADED HOUSEHOLDS
1.0 INTRODUCTION
The ICPD 1994 postulated that population policies should be an important part of programmes of women
development, women’s rights, women’s reproductive health, poverty alleviation and sustainable development.
The United Nations has put special emphasis on promotion of gender equality and women empowerment
in its Millennium Development Goals (MDGs) that were enunciated in 2000 to achieve poverty reduction
and sustainable development. Recognising that population stabilisation was an essential requirement for
promoting sustainable development with more equitable distribution of national resources, the National
Population Policy 2000 (NPP 2000) laid special emphasis on making reproductive health care more accessible
and affordable to all, along with increasing the provision of primary and secondary education, extending basic
amenities including sanitation, safe drinking water and housing besides empowering women (MoHFW 2000).
1.1 Objectives
The main objective of the present research is to examine the extent of female autonomy vis-à-vis their
destitution utilising secondary data. The other objective here is to examine United Nation’s MDG that relates to
the promotion of gender equality and the empowerment of women (UNDP 2000). To achieve these objectives,
we propose to analyse separately various characteristics of female and male-headed households1 by utilising
information from 2001 Census, NFHS-3 and NSS 61st Round2.
When we talk of ‘women’s empowerment’ five issues are generally discussed at the national as well as the
international level. These relate to girls’ education, women’s employment, reproductive health, decision
making at the family and societal level and women’s political participation. We get certain information about
the progress achieved so far partly from population censuses and partly from large-scale sample surveys.
India’s 2001 Census gives separate information for male and female-headed households on certain variables
like age, marital status, size of household and religion (Census of India, 2001, HH Series Tables on CD).
Data on these characteristics along with the availability of householdamenities are obtained from the third
round of the National Family Health Survey (NFHS-3), 2005-06 and also about decision making in household
matters by male and female heads (IIPS and Macro International, 2007). In fact, information on availability of
certain basic amenities like safe drinking water, electricity and toilet facility within the premises are important
indicators of social equality that are available from NFHS-3.
Similarly, the National Sample Survey (NSS) data relating to 61st Round (2004-05) provide information
on educational attainment and occupational placement of male and female household heads. One also gets
information on total household expenditure by household size. Certain data is also available regarding
household amenities—the source of lighting within the premises and type of fuel used for cooking meals in
NSS (NSSO, 2006).
1 In Census, a household has been defined as usually a group of persons who normally live together and take their meals from a common kitchen unless
exigencies of work prevent any of them from doing so. Persons in a household may be related or unrelated or a mix of both. If a group of unrelated persons,
however, live in a common house but do not take their meals from the common kitchen, then they do not constitute a household." Male or female head of
household has been determined by the response of the person giving information in this regard to the enumerator.
A similar definition of the ‘household’ and its head has been used in the National Family Health Survey and the National Sample Survey rounds (Census of
India 2001, Data Highlights in Table HH-4).
2 Relevant data from all the three sources are available on CD.
01

2.8 Page 18

▲back to top


1.2 Past Progress
India has made significant progress in spreading girls’ education over the past six decades. For example,
female literacy rate reached more than half (54 percent) for the first time in 2001 from less than 10 percent
in 1 51. Further, one-fifth of literate women had completed at least secondary level education (Premi 2006:
201, 214).
Women’s employment has improved over the past 20 years. It was below one-fifth in 1 81, became 22 percent
in 1 1 and 26 percent in 2001 (Premi 2006: 236). A lot of attention has been given in the Five ear Plans to
reproductive health including maternal mortality and HIV/AIDS.
Women’s empowerment politically became a reality with the passing of 73rd and 74th Constitutional
Amendments (1993) that have guaranteed one-third representation of women in Panchayati Raj Institutions
and municipal bodies. The amendments also reserved one-third of all posts of chairpersons in these institutions
for women. Some of the states in the country have recently decided to reserve 50 percent of positions for
elected women.
1.3 Data Availability
We get a good deal of information on decision making by females from sample surveys, especially from
the National Family Health Survey-3. Little attention has, however, been given to females as household
heads. There are several indicators that could probably analyse women’s autonomy on the one hand and their
empowerment/destitution on the other hand. For example, one gets a good idea in this respect by examining
availability of household amenities and by the ‘wealth index’ in NFHS-3 and consumer expenditure data into
five categories from lowest to highest available in NSS 61st ound.
1.4 Approach for Data Analysis
Approaches for Data AnalysisIn the first instance we examine here the extent of female headship rates at all
India, state and district levels from the 2001 Census and state level from NFHS-3 and NSS 61st Round. This
is followed by distribution of female and male-headed households by marital status. We then examine the
differences between female and male-headed households by religion and social groups. Differences between
household size of female and male heads provide important information. As indicated earlier, literacy and
education are important indicators of women’s progress and, therefore, we examine the same. Analysis of
female and male-headed households by ‘consumer expenditure’ categories and by ‘wealth index’ throws
important light on women’s autonomy and empowerment. This is further reinforced by the analysis of
availability of household amenities at the national and state levels.
2.0 PROPORTION OF FEMALE-HEADED HOUSEHOLDS IN THE
CENSUS, NFHS-3 AND NSS 61st ROUND
It is observed that one-tenth of the households in India as of 2001 Census have females as household heads.
Their proportion in Kerala was 22.6 percent; it was 17.9 percent in Himachal Pradesh and 16.3 percent in
Uttarakhand (Table 1). Besides, it was well above the national average of 10.4 percent in Andhra Pradesh,
Chhattisgarh, Karnataka and Tamil Nadu. Among smaller states this proportion was high in Goa, Manipur,
Meghalaya and Mizoram. In contrast, the proportion of female-headed households (FHH) was quite low in
Bihar, Gujarat, Haryana, Jammu and Kashmir, Jharkhand, Madhya Pradesh, Rajasthan and Uttar Pradesh
among major states (Table 1). The proportion of female-headed households was 14.4 percent according to
the National Family Health Survey (NFHS-3: 2005-06) and 10.8 percent in the NSS 61st ound (2004-05).
02

2.9 Page 19

▲back to top


Table 1: Households by Sex of Household Heads and Proportion of Female-Headed Households, India
and States, 2001 Census, NFHS-3 and NSS 61st Round
India and States
INDIA
Andhra Pradesh
Assam
Bihar
Chhattisgarh
Gujarat
Haryana
Himachal Pradesh
Jammu & Kashmir
Jharkhand
Karnataka
Kerala
Madhya Pradesh
Maharashtra
Orissa
Punjab
Rajasthan
Tamil Nadu
Uttar Pradesh
Uttarakhand
West Bengal
Delhi
Arunachal Pradesh
Goa
Manipur
Meghalaya
Mizoram
Nagaland
Sikkim
Tripura
A. and N. Islands
Chandigarh
Dadra & Nagar Haveli
Daman & Diu
Lakshadweep
Puducherry
Household Figures in Thousands
Male Head Female Head
Total
173,132
19,988
193,119
Big States
15,040
1,921
16,961
4,400
502
4,902
12,709
1,013
13,722
3,634
8,8 0
450
4,085
778
,668
3,406
299
3,705
1,000
219
1,219
1,456
4,390
106
1,562
399
4,78
8, 38
1,442
10,380
5,199
1,514
6,713
10,079
17,546
815
1,976
10,8 3
19,522
6,944
776
7,720
3,919
419
4,338
8,652
12,582
645
2,042
9,296
14,624
23,656
2,032
25,688
1,336
260
1,596
14,130
2,490
1,709
238
15,840
2,728
Small States
192
22
213
232
62
294
324
49
373
321
96
417
154
22
176
296
30
326
103
11
114
590
73
664
Union Territories
70
8
78
191
15
206
43
3
45
29
7
36
7
3
10
182
33
215
% Female-Headed Households
Census NFHS-3
NSS
10.4
14.4
10.8
11.3
14.9
11.9
10.2
13.4
8.5
7.4
25.0
11.8
11.0
11.6
9.2
8.0
8.4
8.5
8.1
11.1
7.7
17.9
18.6
17.2
6.8
8.2
7.1
8.3
11.2
8.0
13.9
15.8
15.2
22.6
24.6
25.0
7.5
7.5
5.6
10.1
12.4
9.5
10.1
13.0
9.5
9.7
10.9
8.3
6.9
8.7
.8
14.0
20.2
16.2
7.9
13.9
8.2
16.3
15.7
15.7
10.9
15.0
9.9
8.7
9.50
8.6
10.2
11.3
21.2
25.4
13.1
17.5
23.0
22.7
12.4
15.9
9.2
14.4
9.7
14.6
11.0
13.6
.8
7.2
6.3
18.8
34.4
15.3
03

2.10 Page 20

▲back to top


Table 1 also presents the proportion of female-headed households as revealed in NFHS-3 and NSS 61st
Round. The data from NFHS-3 has been presented here for all the states and only Delhi because several of
the union territories did not have any sample. Data from NSS has been presented here for the bigger states
and Delhi only because of small sample size in smaller states and union territories and consequently, large
fluctuations in sample estimates. Female Headship ate (FH ) is higher in NFHS-3 compared to the Census
2001 by four percent points at the national level. The rates are higher in all the states compared to the Census.
Bihar is especially an outlier where the National Family Health Survey-3 FHR is the highest at 25 percent
compared to only 7.4 percent in the Census and 11.8 percent in NSS, which needs some probing with more
detailed data. FHR were higher by almost 6 percent points in NFHS-3 in Tamil Nadu and Uttar Pradesh; they
were also higher by 3 or more points in Haryana, Jharkhand, Orissa, and West Bengal. FHR was higher than
the national average in Manipur, Mizoram and Meghalaya, especially because of the matrilineal system. One-
fourth of the households in Goa were headed by females.
The pattern of FHH remains the same in respect of NSS as in 2001 Census. Here also Kerala, Himachal
Pradesh and Uttarakhand stand out having larger proportions of FHH. Tamil Nadu gets the third rank in
the proportion of FHH rather than Uttarakhand. Bihar’s FHR is also above the national average. States that
have low proportion of FHH are Assam, Gujarat, Haryana, Jharkhand, Madhya Pradesh, Maharashtra, Orissa,
Punjab, Rajasthan and Uttar Pradesh along with the union territory of Delhi.
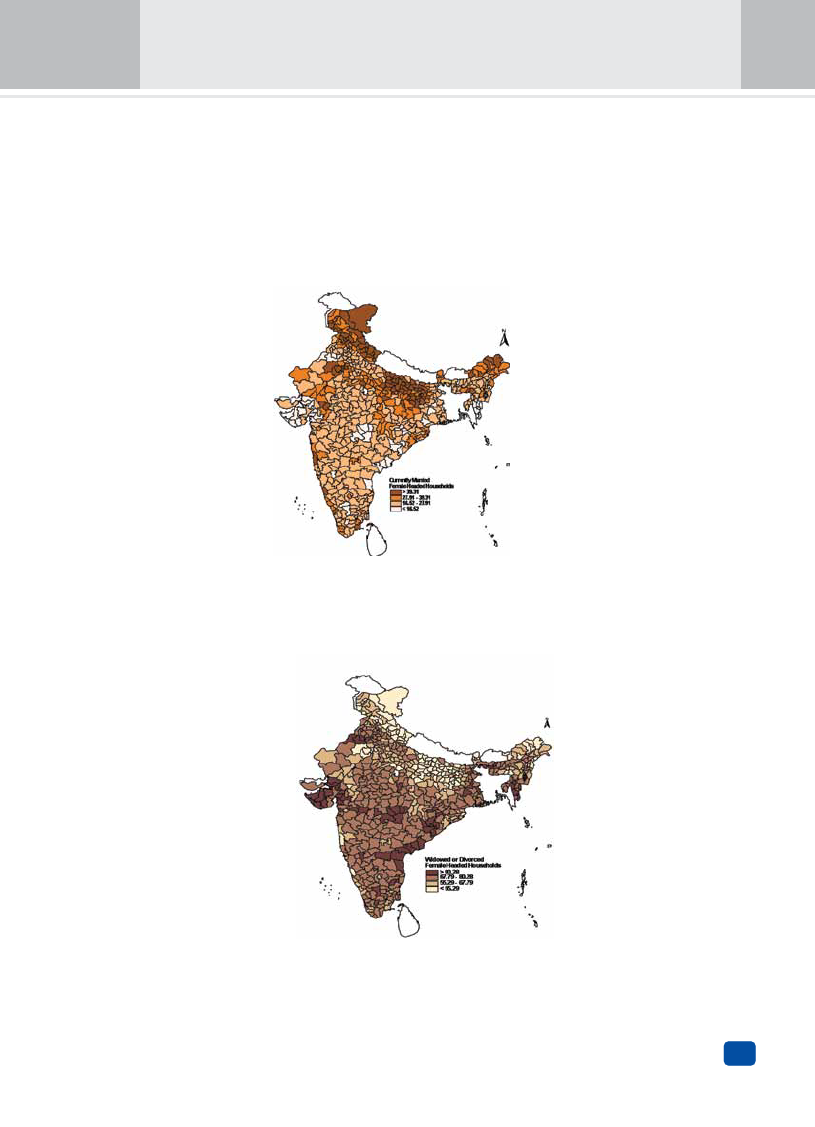
Map 1 provides district level estimates of proportion of FHH in total households of each district as obtained
from the 2001 Census. (The map is drawn by taking values up to one standard deviation above the national mean
and, similarly, one standard deviation below the mean.) We observe that most districts of Uttarakhand, many
districts of Himachal Pradesh, most of the districts of Kerala and coastal districts of Karnataka, a few districts
of Tamil Nadu, Meghalaya and Ladakh division of Jammu and Kashmir had the proportion of FHH above
15.7 percent (more than mean plus one standard deviation). Besides, the southern states, parts of Maharashtra,
Orissa, Chhattisgarh and Jharkhand also had large tracts of districts with more than 10.4 percent FHR.
Map 1: District-wise Percentage of Female-Headed Households in India, Census 2001
Map not to Scale
04

3 Pages 21-30

▲back to top


3.1 Page 21

▲back to top


In contrast, the proportion of FHH in many states–Punjab, Haryana Rajasthan, Gujarat, Madhya Pradesh, Uttar
Pradesh and Bihar–was well below all India average. There are a few districts in Madhya Pradesh, Rajasthan
and Uttar Pradesh where the FHR has been below 5.1 percent (less than mean minus one standard deviation).
2.1 Proportion of Female-Headed Households in the Census, NFHS-3 and NSS
61st Round by Residence Type
We started with the assumption that the proportion of female-headed households would be greater in urban
areas compared to rural areas thinking that the former would have larger proportion of single females. Table
2 gives national level estimates of proportion of FHH according to Census 2001, NFHS-3 and NSS 61st
Round. The data indicate that it is only in the Census that the proportion of FHH in urban areas was somewhat
higher since the reverse was true in respect of both NFHS-3 and NSS surveys. This implies that our starting
assumption was weak. This might mean that widowhood among women is more prevalent in rural areas and
these women, in all likelihood, are left alone to look after themselves, much more than widows in urban areas.
The situation would become clear after examining headship rates by sex and marital status (Table 3).
Table 2: Proportion of FHH according to 2001 Census, NFHS-3
and NSS 61st Round by Residence Type
Data Source
Total
Census 2001
10.4
NFHS-3
14.4
NSS 61st Round
10.8
Residence Type
Rural
Urban
10.1
11.0
14.9
13.2
11.0
10.4
3.0 PERCENTAGE OF FEMALE-HEADED HOUSEHOLDS BY MARITAL
STATUS
Table 3 presents the proportion of male and female-headed households by marital status3 and residence type
at the national level. We observe that among males ‘currently married’ ones are mostly heads of household as
it should be. There are, however, a small proportion of ‘never married’ and ‘widowed’ males who are heads
of households. Never married males as household heads are generally single person living away from other
relatives for one reason or the other while the widowers are due to changes in family life cycle. Among female
household heads almost two-thirds are widowed. A little over a quarter is of those who are currently married.
The latter situation basically arises from migration of male members for work.
The observed pattern is similar in Census 2001, NFHS-3 and NSS. It is also similar in both rural and urban
areas. We find that the proportion of currently married females is higher in rural areas in all the three data
sets; consequently, the proportion of widowed females is higher in urban areas. A slightly higher proportion
of unmarried females are, however, reported as households heads compared to males.
The data at the state level for 2001 Census, NFHS-3 and NSS 61st Round is presented in Table A1 in the
Appendix. We have preferred to present data only for the big states and Delhi keeping in view the small
sample size in respect of small states and union territories in NFHS-3 and NSS and, consequently, wide
fluctuations in their estimates.
3. Here the proportion of male heads and that of female heads by four categories of marital status adds up to 100.0 respectively.
05

3.2 Page 22

▲back to top


Among male household heads, 90 percent or more were ‘currently married’ as expected in a patriarchy
where the man is the principal bread winner and has the responsibility to run his household. Among women
household heads while at the national level the proportion of ‘currently married’ women stood at slightly
below 30 percent, it was, however, more than two-fifths in ihar, Himachal Pradesh, ammu and ashmir
and Uttarakhand according to 2001 Census; in Bihar, Jammu and Kashmir, Jharkhand, Rajasthan and Uttar
Pradesh as per NFHS-3 data and in Bihar, Himachal Pradesh, Rajasthan, Uttar Pradesh and Uttarakhand
according to NSS (Appendix Table A1). It is noteworthy that currently married women as household heads
comprised two-thirds in Bihar and more than half in Uttar Pradesh in both NFHS-3 and NSS surveys. It is not
clear if, besides male migration, there is any other factor to explain the observed phenomenon.
Table 3: Proportion of FHH by Marital Status and Residence Type, Census 2001,
NFHS-3 and NSS 61st Round
Category
Census 2001
Total
Rural
Urban
NFHS-3
Total
Rural
Urban
NSS 61st Round
Total
Rural
Urban
Never Married
Male
Head
Female
Head
Currently Married
Male
Head
Female
Head
Widowed
Male
Head
Female
Head
Divorced/Separated
Male
Head
Female
Head
2.74
3.45
93.15
27.06
3.87
66.13 0.24
3.36
2.50
3.13
92.96
28.25
4.27
65.07 0.27
3.55
3.32
4.18
93.63
24.37
2.86
68.53 0.18
2.92
3.44
3.38
92.66
28.87
3.40
62.28 0.49
5.46
2.47
2.04
2.85
33.64
4.12
59.20 0.54
5.09
4.57
5.07
92.43
22.84
2.57
66.18 0.43
5.92
4.10
5.29
91.54
26.93
4.10
64.67 0.26
3.11
2.82
4.26
92.42
2 .81
4.47
63.00 0.29
2.93
7.46
8.16
8 .22
18. 1
3.12
69.33 0.20
3.60
Widowed and divorced/separated women comprised around two-thirds of FHH at the national level. Since
this category is complementary to ‘never married’ and ‘currently married’ women, the proportion is high
where these two categories had small proportions of women, and low where ‘currently married’ women
accounted for a large proportion of females as household heads, and this applies to all the three data sources.
Thus, widowed females as household heads in the Census were above 70 percent in Andhra Pradesh, Assam,
Gujarat, Tamil Nadu, West Bengal and Delhi. In contrast, their proportion was below 60 percent in Bihar,
Himachal Pradesh, Jammu and Kashmir, Uttar Pradesh, and Uttarakhand. This pattern is almost similar in
NFHS-3 and NSS 61st Round data (Appendix Table A1).
From district level data of 2001 Census we computed percent distribution of females as household heads by
marital status and mapped the information in Map 2 for ‘currently married’ women and in Map 3 for widowed
and divorced/separated women. The complementary nature of information in Map 2 and Map 3 is clearly
discerned. Concentrating on Map 2, we observe that, among women household heads, more than two-thirds
were ‘currently married’ in most of Uttarakhand and large parts of Jammu and Kashmir, Himachal Pradesh,
eastern Uttar Pradesh, Bihar, Jharkhand and a few districts in other states, particularly in north-east Rajasthan.
In contrast, the proportion of such districts was very low (below 16.5 percent) in Gujarat, parts of Punjab and
Chhattisgarh and few scattered districts in other states.
06

3.3 Page 23

▲back to top


ooking at Map 3 we find that the proportion of widowed, divorced and separated females as household heads
was above four-fifths in major parts of ujarat, Punjab, Chhattisgarh and Andhra Pradesh besides scattered
districts in other states. In fact, this proportion has been above the mean of 67.8 percent in most of Punjab,
Haryana, central India, west India, south India and east India excluding Bihar and Jharkhand, and in some
districts of north-east India. This presumably indicates that widowed and divorced women are in a large
majority of cases heads of one-person households.
Map 2: Proportion of ‘Currently Married’ Females among Female Household Heads at District Level,
India, 2001 Census
Map not to Scale
Map 3: Proportion of Widowed, Divorced and Separated Females among Female Household Heads
at District Level, India, 2001 Census
Map not to Scale
07

3.4 Page 24

▲back to top


4.0 HOUSEHOLD COMPOSITION AND HEADSHIP RATES
Household composition depicts the family type constituting it. Change in household type is a significant
indicator of social change involving social structure, familial relationships and bond of kinship, and is
presumed to be drastically changing in the face of urbanization and globalization. We present below some
details of household types found in the 2001 Census. Table 4 presenting household types by male and female
household heads respectively indicates that 8 .7 percent of households were headed by males and just 10.3
percent by females4 (Census of India 2001, September 2009).
Table 4: Household Types by Male and Female Head in India, 2001 Census
Household Type
All Types
Total
Single-person household
Nuclear household
Sub-Nuclear household
Supplemented nuclear
household
Broken-extended-
household
Joint household
Other household
Total
100.00
100.00
4.29
51.73
5.82
15.30
1.99
1 .08
1.79
Distribution by Household Type
Male Head
8 .7
100.00
2.59
57.09
2.30
14.53
1.73
20.50
1.26
Female Head
10.3
.8
19.02
5.29
36.29
22.00
4.24
6.81
6.33
We observe that proportionately single-member households were more with female head (19 percent) as
against 2.6 percent in respect of male head. More than half of MHH (57.1 percent) were nuclear households
compared to 5.3 percent of FHH in this category. Sub-nuclear5 and supplemented nuclear6 households were
largely female-headed (58.3 percent) in comparison to 16.8 percent of MHH as per their definition.
In 2001 Census a total of 8.2 million households were recorded as single-person households7 comprising
4.3 percent of total households. Of the total 4.4 million single-person MHH, 87 percent were one-person
households. Among women, of the total 3.80 million single-person households, 8.3 percent were one-person
households, implying that almost all women heading single-person households were living alone and were
quite likely unmarried or widowed.
4. The figures are sample estimates. Note on HH-4 Highlights- eceived on Internet on Sept. 1, 200 .
5. Sub-nuclear households are broken nuclear households in which one or both of spouse(s) is/are dead or are divorced or separated or are not living together, but
total members not reducing less then two (Census of India 2001, HH4 Data Highlights).
6. A household consisting of a nuclear family plus other related members but the latter never constituting another nuclear or broken nuclear family (Census of
India 2001, HH4 Data Highlights).
7. A single-person household may not always be single in size as there could be servants, guests and other non-related members residing in the household who
are not considered its members in defining household type.
08

3.5 Page 25

▲back to top


5.0 PERCENTAGE OF FEMALE-HEADED HOUSEHOLDS BY RELIGION
AND SOCIAL GROUP
5.1 Religion
Table 5 presents information on the proportion of female-headed households by religion and rural-urban
residence at the national level based on the Census 2001, NFHS-3 and NSS 61st Round. In preparing this
table, we have taken only four religions–Hindu, Muslim, Christian and Sikh. Buddhist, Jain and other religions
have been left out as in NFHS-3 and the NSS samples are small. The two religions and others have, however,
been included in row totals.
We notice that the proportion of females as household heads among Christians was well above that for the
other three religions in all the three data sets with one abrasion. Muslim women as household heads were
in greater proportion than any other religious group in rural areas in NFHS-3. The proportion of FHH was
marginally higher among Muslims compared to Hindus and Sikhs except in the case of Sikhs in urban areas
in NFHS-3.
It is noteworthy that while Christian females have larger autonomy and tendency to migrate independently,
this is not true in respect of Muslim women. It is quite likely that there is substantial migration of Muslim
males for a living. It would, however, be useful to examine the sociological and economic factors behind the
observed phenomenon.
Table 5: Percentage of Female-Headed Households by Religion
Census 2001
Total
Rural
Urban
NFHS-3
Total
Rural
Urban
NSS 61st Round
Total
Rural
Urban
Hindu
10.1
9.9
10.7
13.9
14.4
12.8
10.4
10.6
10.0
Religion
Muslim
Christian
10.6
15.2
10.2
14.3
11.3
16.8
17.1
18.4
19.0
17.4
14.2
1 .8
12.5
17.4
13.3
17.3
10.8
17.7
Sikh
9.3
8.8
10.5
11.7
10.5
14.5
8.8
8.3
10.4
Total
10.4
10.1
11.0
14.4
14.9
13.2
10.8
11.0
10.4
Appendix Table A2 presents the state-wise proportion of FHH for the 2001 Census, NFHS-3 and NSS 61st
Round by religion for the total population. Data presented here relates only to big states and Delhi. The pattern
is not exactly similar in the three data sets. While Christian women are more often household heads in majority
of states whether it relates to census data, NFHS-3 or NSS, there are certain states where Muslim women
are household heads in greater proportion, e.g. Kerala and Tamil Nadu. More Hindu women are household
heads in Himachal Pradesh and Punjab according to the 2001 Census, but in none of the states according to
NFHS-3. Hindu women as household heads in largest proportion were only in Assam as per NSS data. It is
generally found that the proportion of FHH is high where the sample size in NFHS-3 or NSS is comparatively
small.
09

3.6 Page 26

▲back to top


At the state level we find from the NFHS-3 data that one-third of the household heads were Muslim women in
Bihar and Kerala. Tamil Nadu also had 23 percent of households with Muslim female heads. It is understood
that this phenomenon results from husbands or other male members’ migration. It is noteworthy that Hindus in
Himachal Pradesh, Jammu and Kashmir, Madhya Pradesh, Punjab, Rajasthan, Uttarakhand and Delhi had higher
proportions of FHH than Muslims. Christians have larger proportions of females as household heads in states
where their representation in the sample has been small and, consequently, large fluctuations in sample estimates.
5.2 Social Groups
We have separate data for headship rates by social groups–Scheduled Caste (SC), Scheduled Tribe (ST), Other
Backward Classes (OBC) and others, i.e., upper castes and middle castes in NFHS-3 and NSS 61st Round.
Tables for SC and ST are not available in the Census. Table 6 gives the proportion of FHH by social groups in
respect of NFHS-3 and NSS. No set pattern has emerged with regard to female headship rates by social groups
in the two data sources. Proportion of FHH is higher for OBCs in both NFHS-3 and NSS. Also, the proportion
of FHH in the urban sample is somewhat higher for STs compared to other social groups in both NFHS-3 and
NSS. Smallness of urban ST sample size might be one of the reasons for the observed phenomenon.
Appendix Table A3 gives state wise proportion of FHH for SC, ST, OBC and others in NFHS-3 and NSS
61st Round. Looking at NFHS-3 data we observe that women as household heads were in greater proportion
among SCs in Chhattisgarh, Jammu and Kashmir, Jharkhand, Madhya Pradesh, Maharashtra, Orissa and
Punjab. In contrast, the proportion of FHH was higher among STs in Gujarat, Karnataka, Rajasthan, Tamil
Nadu, West Bengal and Delhi.8 Women headship rate was higher among OBCs than other social groups in
Assam, Bihar and Uttarakhand and it was higher for ‘others’ in the remaining states.
Table 6: Proportion of Female-Headed Households by Social Groups, NFHS-3 and NSS 61st Round
NFHS-3
Total
Rural
Urban
NSS 61st Round
Total
Rural
Urban
Social Groups
Scheduled Caste Scheduled Tribe Other Backward Class
14.9
11.8
15.0
15.2
11.4
15.7
14.1
15.4
13.4
10.6
10.4
11.5
10.6
.8
11.7
10.9
15.7
10.9
Others
13.8
14.9
12.4
10.1
10.6
9.4
From the NSS data by social groups we find that the proportion of FHH among SCs was higher in ujarat,
Tamil Nadu and Uttar Pradesh. All these states are different from the other ones where female headship rates
are higher in NFHS-3 data. ST women were household heads in greater proportion than other social groups
in Chhattisgarh, Jammu and Kashmir, Jharkhand, Karnataka, Madhya Pradesh, Maharashtra and West Bengal
according to NSS data (Appendix Table A3). The picture was different in NFHS-3 where ST FHH was in
greater proportion in Gujarat, Karnataka, Rajasthan, Tamil Nadu and West Bengal. Karnataka and Tamil Nadu
are the only two states that are common in NSS and NFHS-3 (Appendix Table A3). Female headship rates
were higher in respect of ‘others’ in Haryana, Himachal Pradesh, Kerala and Uttar Pradesh as per the NFHS-3
data and in Bihar, Rajasthan, Uttarakhand and Delhi in NSS. Information on FHH by social groups does not
indicate any pattern in NFHS-3 and NSS data sets.
8. According to the Constitution of India, Delhi does not have any scheduled tribe population.
10

3.7 Page 27

▲back to top


6.0 MEAN HOUSEHOLD SIZE
We have data from the 2001 Census, NFHS-3 and NSS 61st Round to examine differentials in the size of
male-headed and female-headed households. Table 7 presents the data at the national level. We observe that
FHH are smaller in si e than MHH by 1.4 persons in the census (4.0 v s 5.4) as also in NFHS-3 (3.8 v s 5.2).
They are smaller by 1.2 persons per household in NSS 61st Round (3.3 v/s 4.5). The pattern is same in both
rural and urban areas. This difference in size is because proportionately single-person households are more
among females than males. Further, currently married women become household head largely because of
male migration for various reasons, especially to make a living, reducing household size.
Table 7: Mean Household Size by Sex of Household Head and by Rural Urban Residence,
India, Census 2001, NFHS-3 and NSS 61st Round
Census 2001
NFHS-3
NSS 61st Round
Rural
Male
Female
5.6
3.8
5.3
3.8
4.6
3.3
Urban
Male
Female
5.2
4.5
4.8
3.9
4.2
3.3
Total
Male
Female
5.4
4.0
5.2
3.8
4.5
3.3
6.1 Mean Household Size by Religion
Mean household si e (MHS) by religion presented in Table 8 from 2001 Census, NFHS-3 and NSS 61st
Round at the national level indicates that the same is higher by one person for both male and female-headed
households for Muslims followed by Sikhs compared to Hindus. This applies to all three data sources–2001
Census, NFHS-3 and NSS. The pattern is repeated in rural as well as urban areas.
Table 8: Mean Household Size by Religion for India by Residence type from 2001 Census, NFHS-3
and NSS 61st Round
Hindu
Muslim
Christian
Sikh
M Head F Head M Head F Head M Head F Head M Head F Head
Census 2001
Total
Rural
Urban
5.3
3.8
6.3
4.9
4.9
3.8
5.7
4.8
5.5
3.7
6.2
4.5
5.0
3.8
5.9
4.8
5.0
4.3
6.4
5.7
4.5
3.8
5.3
4.8
NFHS-3
Total
Rural
5.1
3.7
5.9
4.7
4.3
3.2
5.6
4.1
5.3
3.7
6.0
4.6
4.5
3.3
5.8
4.3
Urban
4.7
3.7
5.8
5.1
4.1
3.1
5.1
3.8
NSS 61st Round
Total
4.4
3.2
4.8
3.8
4.2
2.9
4.7
3.8
Rural
4.6
3.2
4.9
3.7
4.4
3.0
4.8
4.0
Urban
4.1
3.3
4.6
3.8
4.0
2.6
4.6
3.5
Appendix Table A4 presents state-wise data from the Census, NFHS-3 and NSS 61st Round on mean
household size (MHS) by religion and sex of household head. As indicated earlier, in presenting this data
we have excluded Buddhist, Jain and other religions from the table because a large number of cells in their
case were empty. For the same reason we have excluded smaller states and union territories (except Delhi).
11

3.8 Page 28

▲back to top


The table clearly establishes that MHS is higher for male-headed households than female-headed households
by more than one person across the board. From the 2001 Census, we notice that mean households size of
Christians is the lowest both among females and males in most of the states and Delhi. MHS has been larger
among Muslims than Hindus in all the states with one minor abrasion in respect of West Bengal when the
reverse is true. MHS in respect of Sikh FHH is higher than Muslim households in several states, particularly
in Assam, Bihar, Chhattisgarh, Jharkhand, Orissa and West Bengal (Appendix Table A4). The higher value
of MHS among Muslims might be due to their higher fertility; the TFR of Muslim women being higher by at
least one child at the national level (Premi 200 : 115).
Considering data from NFHS-3, we observe that at the national level, MHS for both female and male
household heads is higher for Muslims than for other religious groups. This largely holds true across the
states too. MHS of female-headed households among Muslims is above four persons in Bihar, Chhattisgarh,
Haryana, Jharkhand, Jammu and Kashmir, Karnataka, Kerala, Maharashtra, Punjab, Rajasthan, Uttar Pradesh,
Uttarakhand and Delhi (Appendix Table A4). MHS is above four in Hindu FHH in Bihar, Haryana, Himachal
Pradesh, Jharkhand, Jammu and Kashmir, Kerala, Punjab, Uttar Pradesh and Delhi. These are the same states
where MHS for Muslim FHH is above four. There are a few states where MHS is above four for FHH among
Christians: Assam, harkhand, arnataka, Madhya Pradesh, Uttarakhand and West engal and among Sikhs
in Assam and Himachal Pradesh. There is a need to probe for the observed pattern with more detailed data.
NSS 61st Round data (Appendix Table A4) shows that MHS for male heads is higher by a little over one
person for Hindu, Muslim and Christian households and a shade less for Sikh households. MHS for females
has been four or above in case of Muslim households in Bihar, Jammu and Kashmir, Kerala, Orissa, Uttar
Pradesh and Uttarakhand; it is above four for Hindu households only in Punjab and Delhi. MHS of six persons
for Christian women household heads in Punjab is an outlier and needs more probing. The only other state
where MHS for females is above four is Assam. MHS for Sikhs being higher for FHH compared to MHH in
Rajasthan and Uttar Pradesh in NSS needs to be probed.
6.2 Mean Household Size by Social Groups
Appendix Table A5 presents data on MHS separately for the scheduled castes, scheduled tribes, other
backward classes and the remaining population (others) from NFHS-3 and NSS 61st Round. According to the
VIII Schedule of the Constitution there is no ST in Haryana, Punjab and Delhi; the NFHS-3 sample has some
ST households in Delhi and the NSS sample has some ST households in Haryana that may be due to some
household heads in the sample reporting themselves as belonging to a ST.
Taking first the NFHS-3 data, we notice that MHS for MHH was higher than that for FHH by 1.5 persons for
SC, 1.6 persons for ST and 1.4 persons for OBC households at the national level. MHS for the SC FHH was
the highest in Delhi (5.1 persons) followed by Punjab (4. persons) and harkhand (4.8 persons). MHS in
FHH was above four in Bihar, Haryana, Himachal Pradesh, Jammu and Kashmir, Jharkhand, Kerala, Punjab,
Rajasthan, Uttar Pradesh and Delhi among SC households (Table A5). MHS was four persons or more among
ST households in Himachal Pradesh, Jammu and Kashmir, Jharkhand, Karnataka, Kerala, and Uttar Pradesh;
and in OBC households in Assam, Bihar, Haryana, Himachal Pradesh, Jharkhand, Karnataka, Kerala, Punjab,
Uttar Pradesh, West Bengal and Delhi. Thus, female-headed OBC households are bigger in size in several
states compared to SC or ST households (Appendix Table A5).
MHS at the national level for all the four social groups in the NSS has been low for both male and female-
headed households compared to NFHS-3. MHS has been four and above for FHH in Assam, Haryana, Kerala,
Punjab and Delhi for SC households; in Assam, Uttar Pradesh and Uttarakhand for ST households; in Assam,
Punjab, Rajasthan and Uttarakhand for OBC households and in Chhattisgarh and Delhi in case of the remaining
households. It is noteworthy that MHS for females has been higher than that for male-headed households in
Delhi for SC households and in Uttarakhand for ST households (Table A5) that needs further investigation.
12

3.9 Page 29

▲back to top


7.0 DISTRIBUTION OF HEADSHIP RATES OF HOUSEHOLDS BY AGE
AND MARITAL STATUS
From the distribution of headship pattern in India by marital status for each age group in the 2001 Census one
observes that, among currently married males, household headship is almost universal as the societal norm
fixes the responsibility on the husband to run his household efficiently. It is more than 5 percent for the age
group 30-49 years (Table 9). There are, however, a small proportion of households where an unmarried or
widowed male becomes household head. It is noteworthy that, among currently married females, 64.1 percent
of household heads were in 20-2 years age group followed by 30-3 years age group (48.3 percent).
Table 9: Male and Female-Headed Households by Age and Marital Status,
Census 2001, NFHS-3 and NSS 61st Round
Age Group
All ages
< 20
20-29
30-39
40-49
50-59
60-69
70-79
80
All ages
< 20
20 – 29
30 – 39
40 – 49
50 – 59
60 – 69
70 – 79
80
All ages
< 20
20 – 29
30 – 39
40 – 49
50 – 59
60 – 69
70 – 79
80
Never Married
M Head F Head
2.34
76.71
12.05
1.49
0.63
0.59
0.68
0.78
26.54
3.45
84.4
.68
2.09
1.44
1.15
0.81
0.67
23.59
3.44
82.66
18.73
2.33
0.70
0.72
0.51
0.79
1.05
3.38
65.04
14.86
2.95
1. 8
1.75
1.09
1.21
0.79
4.1
5.3
85.4
84.6
15.6
17.5
1.9
1.3
0.6
0.9
0.5
1.5
0.5
0.6
0.6
0.8
1.1
2.0
Currently Married
M Head F Head
2001 Census
93.15
27.06
21.97
10.54
87.04
64.08
97.27
48.27
97.12
32.43
94.69
20.58
8.0
13.36
83.65
10.63
69.95
40.15
NFHS-3
92.66
28.88
17.14
31.71
80.54
69.42
96.53
56.14
97.29
36.30
5.38
15.51
91.51
6.96
83.33
4.71
71.79
3.54
NSS 61st Round
91.5
26.9
14.4
14.9
83.5
66.9
96.9
57.7
96.7
31.8
93.9
11.7
88.6
3.4
81.7
0.7
70.5
1.9
Widowed
M Head F Head
3.87
1.18
0.64
1.01
2.01
4.48
.18
15.33
3.29
66.13
4.02
20.53
42. 8
61.40
75.67
84.45
87. 2
34.72
3.40
0.0
0.26
0.66
1.46
3.40
7.51
15.46
26.50
62.27
0.81
9.20
31.8
53.33
78.15
8.3
92.47
93.90
4.1
64.7
0.2
0.3
0.6
13.1
0.9
35.6
2.4
62.1
5.4
84.8
10.7
94.7
17.4
8.1
27.9
95.7
Divorced/ Separated
M Head F Head
0.24
3.36
0.14
0.34
0.27
5.71
0.24
6.65
0.24
4.72
0.24
2.60
0.24
1.37
0.24
0.78
0.22
1.54
0.49
5.46
0.20
2.44
0.47
6.53
0.48
9.02
0.55
8.3
0.50
4.55
0.46
2.01
0.39
1.48
0.59
1.77
0.3
3.1
0.0
0.2
0.3
2.4
0.3
5.3
0.2
5.2
0.2
2.0
0.2
1.2
0.3
0.4
0.5
0.4
13

3.10 Page 30

▲back to top


Headship in the census is found more pronounced among widows probably because a large proportion of them
are left alone to look after themselves. Among ‘never married’ males and females in the age group ‘less than
20 years’ there is a very high proportion of household heads, 77 percent for males and 84 percent for females.
This high proportion of headship rate among the young people implies that they are mostly heads of single
member households.
In NFHS-3 also, 2.7 percent of currently married males and 28. percent of currently married females were
household heads. While in the age group ‘less than 20 years’ the proportion of ‘never married’ males as
household heads was comparatively higher at 82.7 percent against 76.7 percent in the Census, the proportion
of female-headed households declined sharply to 65 percent. Further, 31.7 percent of ‘currently married’
females in this age group reported themselves as household heads. The proportion of ‘currently married’
males as household heads in 30-59 years age group was found above 95 percent as expected. The proportion
of ‘currently married’ females among total female household heads in respective age groups was, however,
quite high (69.4 percent in 20-29 years age group and 56.1 percent in 30-39 years age group). As the age of
household heads increased the proportion of ‘widowed’ females as household heads rose sharply, becoming
more than 90 percent for women over 60 years.
At the national level the proportions of MHH and FHH for all ages in NSS 61st Round are similar to those
in NFHS-3. The proportions of MHH and FHH of currently married men and women by age are also similar
to those in NFHS-3. The proportion of FHH among widows over 60 years is above 95 percent as expected.
Widowers over 60 years constitute a higher proportion in NSS as well as in NFHS-3 compared to the Census.
8.0 HEADSHIP RATES BY SEX AND EDUCATIONAL ATTAINMENT
We have generated special tables from NFHS-3 and NSS 61st Round data on the literacy rate of household
head by sex. According to NFHS-3 (Table 10), one-third of female household heads were literate in comparison
to two-thirds male literate household heads. A little over half urban female household heads were literate as
against 83.3 percent of urban male household heads. iteracy rate pattern is found to be the same in NSS as
in NFHS-3.
Appendix Table A6 presents state-wise literacy rate for big states and Delhi for female and male household
heads respectively. There is substantive variation in data from NFHS-3 and NSS. While it is only Assam,
Kerala and Delhi where literacy rate of FHH is more than half according to NFHS-3, in the NSS survey it is
Himachal Pradesh, Kerala and Punjab with more than half female household heads who are literate. We know
that the female literacy rate in the country in population aged seven years and above became more than half
(52 percent) for the first time in 2001 Census. ow female literacy rate in both NFHS-3 and NSS is because
of difference in age structure of the general population and that of female household heads.
Table 10: Literacy Rate among Female and Male Household Heads by Residence Type, NFHS-3 and
NSS 61st Round
Residence type and data source
Total
Rural
Urban
Household head
Female
Illiterate
Literate
Illiterate
NFHS-3
67.1
32.9
32.6
75.7
24.3
40.5
47.2
52.8
16.7
Male
Literate
67.4
59.5
83.3
14

4 Pages 31-40

▲back to top


4.1 Page 31

▲back to top


Residence type and data source
Total
Rural
Urban
Household head
Female
Illiterate
Literate
Illiterate
NSS 61st Round
63.6
36.4
34.4
70.9
29.1
41.8
43.3
56.7
15.1
Male
Literate
65.6
58.2
84.
Male literacy rate of household heads was above 60 percent in all the states except Andhra Pradesh, Bihar,
Jharkhand and Rajasthan in NFHS-3 and in all the states other than Andhra Pradesh, Bihar, Jammu and
Kashmir, Jharkhand, Madhya Pradesh, Orissa, Rajasthan and Uttar Pradesh according to NSS.
We examined the completed level of education–middle (up to VIII standard) and secondary - among literate
household heads from the NSS and NFHS-3 data sets (Table 11). At the national level we observe that, among
literates, a higher proportion of women household heads have completed middle level education. Further,
a slightly higher proportion of female heads completed secondary education according to both NSS and
NFHS-3 compared to male heads but more male heads have received a ‘graduate and above’ education.
Table 11: Percentage of People up to Middle and up to Higher Secondary among Literates
According to NSS 61st Round and NFHS-3
NSS
NFHS-3
NSS
NFHS-3
Up to Middle
70.8
66.0
Up to Higher
Secondary
90.3
91.1
Sex of the Household Head
Female
Above Middle
Up to Middle
29.2
63.7
34.0
50.1
Above Higher
Up to Higher
Secondary
Secondary
9.7
87.1
8.
85.4
Male
Above Middle
36.3
49.9
Above Higher
Secondary
12.9
14.6
There are state-wise differences in educational attainment. Appendix Table A7 presents state-wise proportions
of FHH and MHH for those who have completed up to high/higher secondary level of school education and
those who have gone beyond higher secondary education as per NFHS-3 and NSS data. The proportion of
women household heads among literates that completed higher secondary education according to NFHS-3
was 90 percent or above in a majority of states. However, those FHH that had completed beyond higher
secondary education (by more than 15 percent) were in harkhand (16 percent), Maharashtra (22.8 percent),
Rajasthan (23.9 percent) and Delhi (24.4 percent). It is surprising to know that, among literate women in
Jharkhand and Rajasthan, a high proportion had gone secondary education whereas female literacy rates
therein were 23.0 percent and 12.3 percent respectively. In contrast, the proportion of FHH that had gone
beyond secondary education in erala and Tamil Nadu was just 6.7 percent and 8.4 percent respectively
although their female literacy rates were 78.1 percent and 43.3 percent respectively. This implies that many
literate women especially in Jharkhand and Rajasthan were able to continue their education beyond higher
secondary level (Appendix Table A7).
The pattern of women household heads who had completed higher education in NSS was almost similar to the
one observed from NFHS-3 data. Here it was Jammu and Kashmir, Madhya Pradesh, Maharashtra, Rajasthan
and Delhi where the proportion of FHH having completed beyond higher secondary education was above 15
percent (Appendix Table A7).
15

4.2 Page 32

▲back to top


9.0 WOMEN’S EMPLOYMENT
Employment of women as household heads in NSS 61st ound indicates that 28.4 percent were non-workers
whereas just four percent men as household heads were non-workers. The rural-urban difference in these
figures has been small, a slightly higher proportion of females and males as household heads being non-
workers in urban areas compared to rural areas.
Table 12 presents occupational classification of workers in male and female-headed households by rural-
urban residence according to the NSS 61st ound. When we combine the first four categories (considered as
white collar workers), we notice that 21.7 percent male household heads and 18.2 percent female household
heads were engaged in white collar occupations. Rural-urban differences in this respect are large. Considering
FHH we observe that while their proportion is one-tenth in rural areas, they account for a little over two-fifths
in urban areas.
Employment data in NFHS-3 are available for females aged 15-49 years instead of all females. Fifty-seven
percent of women in the sample who are household heads were non-workers; their proportion in urban areas
being 71 percent. There were other women with a man as household head. In their case also, non-working
women comprised 58 percent in the total sample (51 percent in rural and 73 percent in urban areas). Thus,
whether a woman was a household head or not made no difference as far as the NFHS-3 data on employment
is concerned.
Among those who were workers in FHH, 32.9 percent were engaged in white collar occupations (professional,
technical and managerial, clerical and sales) in urban areas, and just six percent in rural areas according to
NFHS-3. An examination of women in those households where male is the head indicates that 32.8 percent
women workers in urban areas and 5.8 percent in rural areas were engaged in white collar jobs. The figures
for FHH and women in MHH are quite similar. Further, 58. percent (72. percent rural and 10.7 percent
urban) workers in FHH were engaged in agricultural activities followed by skilled and unskilled manual jobs
(22.2 percent in total: 36.1 percent in urban and 18.2 percent in rural areas). The story is similar with women
workers in male-headed households.
9.1 Earnings of Women Workers
We examined the type of earnings of women workers who were household heads and those who were working
but a male member was household head. The pattern of earnings of women in FHH and MHH has been quite
similar, 54.7 percent of women in FHH and 53.4 percent in MHH were earning cash only. Their proportion in
urban areas with female head stood at 88 percent and at 87 percent with male head. The proportions in rural
areas were also quite similar (Table 13). However, a large proportion of rural women workers were not paid at
all (27.2 percent with female head and 29.1 percent with male head) or were paid ‘in kind’ only (13.3 percent
in FHH and 12.9 percent in MHH).
able Occu ational Classification of or ers in Female and Male-Headed Households by
Residence Type, NSS 61st Round
Occu ational Classification
Professional, technical and related workers
Administrative, executive & managerial workers
Clerical and related workers
Sales workers
Service workers
Farmers, fishermen, hunters, loggers related workers
Male
4.52
4.27
3.95
8. 8
4.01
50.22
Female
4.93
3.00
3.45
7.04
8.16
54.36
Total
4.55
4.16
3.91
8.82
4.36
50.57
16

4.3 Page 33

▲back to top


Occu ational Classification
Operators & labourers
Total
Rural
Professional, technical and related workers
Administrative, executive & managerial workers
Clerical and related workers
Sales workers
Service workers
Farmers, fishermen, hunters, loggers related workers
Operators & labourers
Total
Urban
Professional, technical and related workers
Administrative, executive & managerial workers
Clerical and related workers
Sales workers
Service workers
Farmers, fishermen, hunters, loggers related workers
Operators & labourers
Total
Male
24.05
100.00
2.84
2.00
1.74
5.86
2.41
66.44
18.71
100.00
.08
10.46
.8
17.51
8.3
5.96
38.61
100.00
Female
19.07
100.00
2.95
1.68
1.51
3.99
4.66
6 .87
15.33
100.00
10.78
6.8
9.19
16.08
18.52
8.40
30.15
100.00
Total
23.63
100.00
2.85
1.97
1.72
5.70
2.60
66.73
18.42
100.00
9.22
10.18
9.92
17.39
9.19
6.15
37.95
100.00
Table 13: Respondent’s Type of Earnings for Work where Female is Household Head and where Male
is Household Head, NFHS-3
Type of Earnings
Not paid
Cash only
Cash and kind
In kind only
Total
Female Head
Type of Residence
Urban
Rural
6.1
27.2
88.1
45.0
4.5
14.5
1.3
13.3
100.0 100.0
Total
22.4
54.7
12.3
10.6
100.0
Urban
7.0
87.3
4.4
1.4
100.1
Male Head
Type of Residence
Rural
29.1
44.0
14.0
12.9
100.0
Total
24.3
53.4
11.9
10.4
100.0
10.0 WOMEN’S AUTONOMY, DECISION MAKING AND EMPOWERMENT
We indicated at the beginning of this report that the United Nations had put special emphasis on promotion
of gender equality and ‘women empowerment’ in its Millennium Development Goals (MDGs) that were
enunciated in 2000 (UNDP, 2000) with a view to achieve poverty reduction and sustainable development.
Recognising that population stabilisation was an essential requirement for promoting sustainable development
with more equitable distribution of national resources, the National Population Policy 2000 (Ministry of
Health and Family Welfare, 2000) laid special emphasis on making reproductive health care accessible and
affordable to all along with increasing the provision of primary and secondary education, extending basic
amenities including sanitation, safe drinking water and housing besides empowering women.
17

4.4 Page 34

▲back to top


NFHS-3 has obtained data from ever married women aged 15-49 years on certain aspects of her empowerment
and decision making that relate to her earnings and person(s) who decides how the same has to be used;
person(s) who largely takes decisions regarding (1) woman’s health care (2) major household purchases (3)
purchase of daily household needs and (4) visit to her family or relatives; and the woman’s freedom of
movement – going to (a) the market (b) health facility and (c) places outside the village/community. Similar
data has been obtained from men in the same age group (IIPS and Macro International 2007: 44 ). In this
study we have separated FHH and MHH; hence, we have ignored men’s information.
Table 13 shows the nature of earnings of women workers, when she herself was household head and where
a man/spouse was the household head. Table 14 indicates who in the family decides how the wife’s cash
earnings have to be spent.
We find that women themselves as household head decide in three-fifths of the time to spend the money
according to their wish. Further, one-third of the women spent their cash earnings with their husband’s
consent. No rural-urban difference has been observed in this regard. With a male household head, only 23
percent of wives (19.1 percent rural and 31.1 percent urban) were able to utilise their earnings on their own
and three-fifths spent in consonance with their husbands. Thus, women as household heads had much more
independence to use their cash earnings.
A question was addressed to currently married women aged 15-49 years about decision making with regard to
(1) their health care (2) major household purchases (3) purchase of daily household needs and (4) visit to her
family or relatives. We have analysed the situation in this regard for FHH and MHH in Table 15.
Table 14: Person(s) in the Household who Decides how to Spend Wife’s Cash Earnings by Sex of
Household Head Aged 15-49 Years
Sex of Household Head
Persons
Female
Male
Total
Rural
Urban
Total
Rural
Urban
Total
Rural
Urban
Mainly Wife
25.86
22.44
33.02
5 .68
59.73
59.56
23.03
19.13
31.07
Wife & Husband
57.8
57.91
57.85
33.54
33.67
33.23
59.93
60.07
59.63
Mainly Husband
14. 8
18.21
8.21
4.64
4.61
4.70
15.84
19.42
8.47
Others
1.27
1.43
0.91
2.14
2.00
2.51
1.20
1.38
0.82
Total
100.00
100.00
100.00
100.00
100.00
100.00
100.00
100.00
100.00
Table 15: Women’s Participation in Decision Making by Sex of Household Head Aged 15-49 Years
Sex of household head and Respondent Respondent
nature of decision making
alone and husband
Female
Total
Own health care
56.24
21.30
Major household purchases
28. 3
37.94
Daily household needs
62.37
15.63
Visit to family/relations
32.65
37.21
Husband
alone
14.02
21.18
9.40
18.34
Someone
else
7.24
9.77
10.38
.87
Others
1.20
2.19
2.22
1.93
Total
100.00
100.00
100.00
100.00
18

4.5 Page 35

▲back to top


Sex of household head and Respondent Respondent
nature of decision making
alone and husband
Rural
Own health care
56.50
20.67
Major household purchases
28.07
37.60
Daily household needs
61.61
15.87
Visit to family/relations
31.49
36.84
Urban
Own health care
55.15
23.88
Major household purchases
32.39
39.33
Daily household needs
65.47
14.66
Visit to family/relations
37.40
38.71
Male
Total
Own health care
25.28
38.4
Major household purchases
7.32
49.76
Daily household needs
33.57
31.25
Visit to family/relations
9.10
55.11
Rural
Health Care
23.96
36.77
Major HH Purchases
6.25
46.37
Daily HH Needs
29.47
30.96
Visit to family/relations
8.38
51.62
Urban
Own health care
28.10
42.17
Major household purchases
9.61
56. 8
Daily household needs
42.32
31.86
Visit to family/relations
10.64
62.55
Husband
alone
13.26
21.64
9.09
18.75
17.10
1 .28
10.64
16.67
32.47
35.83
27.95
29.71
34.78
39.01
31.11
32.72
27.54
29.06
21.24
23.29
Someone
else
8.41
10.51
11.31
11.04
2.52
6.78
6.59
5.09
3.03
5.70
5.82
4.96
3.68
6.77
6.86
5.96
1.64
3.43
3.60
2.84
Others
1.17
2.18
2.12
1.8
1.36
2.22
2.64
2.13
0.73
1.39
1.41
1.13
0.81
1.61
1.61
1.33
0.55
0.92
0. 8
0.69
Total
100.00
100.00
100.00
100.00
100.00
100.00
100.00
100.00
100.00
100.00
100.00
100.00
100.00
100.00
100.00
100.00
100.00
100.00
100.00
100.00
We notice that when a woman is household head, she has greater say in respect of her own health and purchase
of daily household needs. Further, she alone or along with her husband takes two-thirds to four-fifths of decisions
on all matters under consideration. When we consider MHH, we observe that one-fourth of the times a woman
can do the needful regarding her health care. She has the freedom to purchase for daily household needs one-third
to two-fifths of the times. Very few women have the liberty to make major household purchases or to go to their
family or to meet relatives. Husbands had greater say in taking decisions on various items except daily household
purchases. Rural-urban differences in this respect are small, although the proportion of urban women, especially
with their husbands even when the male is household head account for almost three-fourths of the decisions.
NFHS-3 had collected data on women’s freedom of movement to go (1) alone (2) with someone else or (3)
not at all to (a) market (b) health facility and (c) places outside the village/community. We analysed this data
for the total sample when she herself was household head and when a male was the household head (Table
16). We notice that a woman as household head could go to the market alone two-thirds of the times and one-
fourth of the times with someone else. If male is household head, she alone could go to the market a little over
half of the times and with someone else in 36 percent of the cases; the two together accounting for almost the
same proportion as in FHH.
19

4.6 Page 36

▲back to top


A more important aspect was freedom to go alone outside the particular village/community. Here, 54 percent
of women in FHH felt they could go alone as against 37 percent in MHH. The proportion of women who had
freedom to go alone or with someone else was similar for women in FHH and MHH for all the three activities,
namely, going to market, to a health facility and outside the village/ community. One may conclude that
women in FHH had greater freedom than those in MHH.
Table 16: Women’s Freedom of Movement to Certain Places by Sex of Household Head
(Women in the Age Group 15-49 Years)
Freedom of Movement to ecified laces With Whom To Go
To market
To health facility
To places outside this village/community
Alone
With someone else only
Not at all
Total
Alone
With someone else only
Not at all
Total
Alone
With someone else only
Not at all
Total
Sex of Household Head
Female
Male
Total
65.0
52.1
53.9
25.5
35.9
34.4
9.5
12.0
11.7
100.0
100.0
100.0
61.9
48.2
50.2
34.3
47.3
45.4
3.8
4.5
4.4
100.0
100.0
100.0
53.9
37.2
39.5
39.0
54.7
52.4
7.1
8.2
8.0
100.0
100.1
100.0
11.0 HEADSHIP RATES BY SEX AND MONTHLY PER CAPITA
EXPENDITURE AND WEALTH INDEX
The Indian Census does not collect any data on household income or expenditure. NSSO has been collecting
data on monthly household expenditure in its ‘Consumer Expenditure’ schedule over time. Similarly,
NFHS-3 in its different rounds has collected data on household income. Appendix Table A8 presents
classification of FHH and MHH in rural households into five monthly per capita expenditure (MPCE)
categories–lowest, low, medium, high and highest–as of NSS 61st Round. At the national level there is little
difference in the proportion of female and male-headed rural households in different MPCE categories. In
fact, the proportion of FHH and MHH therein in the lowest MPCE category (25.8 percent) is exactly the same.
The proportion of FHH in the highest MPCE category (12.4 percent) is slightly higher than that for MHH
(10.9 percent). If we put the lowest and low MPCE categories together, the proportion of FHH (47.9 percent)
was a shade lower than MHH (4 . percent) (Appendix Table A8). In contrast, the proportion of FHH in high
and highest categories totalled 31.5 percent as against 28.2 percent for MHH. Thus, FHH in rural India are
better placed than MHH and do not reflect higher poverty levels.
Examining the MPCE at the state level in rural India, we observe that the proportion of FHH in lowest and
low categories together was less than one-fifth in Haryana, Himachal Pradesh, ammu and ashmir, erala,
Punjab and Delhi. As a result, their proportion in high and highest categories in these states was more than
50 percent. The findings are repeated in respect of MHH. There are only a few states– ihar, Chhattisgarh,
Jharkhand, Madhya Pradesh and Orissa–where the proportion of FHH in lowest and low categories of MPCE
in rural areas is above one-third.
Considering the situation in urban households at the national level (Appendix Table A9), we observe that
a slightly higher proportion (7.6 percent) of FHH fell in the lowest category of MPCE compared to 4.9
20

4.7 Page 37

▲back to top


percent of MHH but almost similar proportion (41.6 percent and 43.8 percent) of the female and male-headed
households respectively were in highest MPCE category.
At the state level MPCE in lowest and low categories for FHH was below 20 percent in Assam, Gujarat,
Haryana, Himachal Pradesh, Jammu and Kashmir, Jharkhand, Maharashtra, Punjab, Tamil Nadu, Uttarakhand,
West Bengal and Delhi. The proportion of FHH in highest MPCE category was more than half in Gujarat,
Haryana, Himachal Pradesh, Jammu and Kashmir, Punjab, Uttarakhand, West Bengal and Delhi (Appendix
Table A9). Besides, there are several other states – Assam, Jharkhand, Karnataka, Kerala and Maharashtra
– where this proportion is above two-fifths. Hence, from the NSS data on MPCE we find that FHH are not
generally very poor. Women household heads might be getting regular remittances from their spouses and
other male members that keep them well above the poverty line.
NFHS-3 has classified all households on the basis of their income into three categories – low, medium and
high. We present data on female and male-headed households at the state level in the total sample in Table
A10. At the national level, while there were 43 percent of FHH in low income category, there were only 28
percent of MHH therein. In contrast, there were 28 percent and 3 percent of FHH and MHH respectively in
the high income category. This indicates that MHH were somewhat better off than FHH in terms of household
income.
At the state level, ujarat, Haryana, harkhand, erala, Punjab and Delhi had less than one-fifth of FHH in low
income category (Appendix Table A10). There were more than half the FHH in low income category in Bihar,
Chhattisgarh, Jammu and Kashmir, Maharashtra and Orissa. MHH in low-income category (below 20 percent)
were in the same states along with Himachal Pradesh, Madhya Pradesh and Uttar Pradesh and there was no
state with more than 50 percent of MHH in this category. FHH in high-income category (more than 40 percent)
were found in Gujarat, Haryana, Himachal Pradesh, Jharkhand, Punjab, Uttar Pradesh and Delhi. In fact, a
very high proportion of FHH in high-income category in Haryana (64 percent), Kerala (69 percent), Punjab (70
percent) and Delhi (86 percent) indicated that FHH therein were not really poor (Appendix Table A10).
NFHS-3 has computed ‘wealth index’ to indicate economic status of households. The index has been
constructed using 33 household assets and housing characteristics data (NFHS-3, India, Vol. 1, 2007: 43). The
whole sample has been divided into quintiles with equal distribution of household population at the national
level. Utilising the wealth index indicator we have classified the FHH and MHH into poorest, poorer, middle,
richer and richest categories (Appendix Table A11). At the national level, 46.7 percent of FHH were in the
poorest and poorer categories, which is not very different from what was observed in respect of NSS data. On
the other hand, the proportion of MHH therein was 39.4 percent. Accordingly, the proportion of richer and
richest FHH was 33.5 percent whereas that proportion in MHH was 40.8 percent in NFHS-3.
Concentrating on the ‘poorest’ category of wealth index, we observe that the proportion of FHH was less
than 10 percent in Haryana, Himachal Pradesh, Jharkhand, Kerala, Punjab, Uttar Pradesh and Delhi. The
proportion of the richest FHH in these states was above three-tenths except Himachal Pradesh where it was
29.7 percent (Appendix Table A11).
At the state level, the proportion of FHH below one-fourth in the poorest and poorer categories put together
was found in Gujarat, Haryana, Himachal Pradesh, Jharkhand, Kerala, Punjab and Delhi. These are the same
states where MPCE in NSS 61st Round in the lowest two categories was below 20 percent. In contrast,
the proportion of FHH in the poorest and poorer ‘wealth index’ categories was more than half in Bihar,
Chhattisgarh, Jammu and Kashmir, Maharashtra, Orissa, Rajasthan, Uttarakhand and West Bengal (Appendix
Table A11). It is noteworthy that Jharkhand, largely a tribal state, has a low proportion (15.9 percent) of FHH
in the poorest and poorer categories while Chhattisgarh, another largely tribal state, has a high proportion
(76.7 percent) of FHH in the same categories. NSS data has indicated almost similar pattern with respect to
Chhattisgarh and Jharkhand especially in the urban sample. This requires some sociological investigation.
21

4.8 Page 38

▲back to top


According to NFHS-3, at the national level, FHH are somewhat worse off than MHH whether we consider
income classification in three categories or wealth index dividing the households into five categories. These
results are at variance from those obtained in NSS analysing 61st Round data where the difference between
FHH and MHH was marginal. At the state level, while Gujarat, Haryana, Himachal Pradesh, Jharkhand,
Kerala, Punjab and Delhi had small proportions of FHH in the lowest and low-income categories in NSS and
in the poorest and poorer categories of ‘wealth index’ in NFHS-3, there were states like Bihar, Chhattisgarh,
Jammu and Kashmir, Maharashtra, Orissa, Rajasthan, Uttarakhand and West Bengal that had more than half
the FHH in the poorest and poorer categories of wealth index in NFHS-3 as well as in NSS.
12.0 CLASSIFICATION OF FEMALE AND MALE-HEADED HOUSEHOLDS
BY AVAILABLE AMENITIES
We wanted to assess as to what proportion of FHH and MHH respectively availed the three basic amenities
of safe drinking water, toilet facility within the house and electricity. With large scale electrification, it is
presumed that most households would have electricity. Safe drinking water is a necessity of life and, therefore,
households must have access to it. Similarly toilet facility within the premises is a basic necessity and should
be available to all. We classified the FHH and MHH on the basis of availability of these amenities (Table 17)
from NFHS-3 for which the relevant data was available. We are of the view that households that have all three
amenities are better placed than those that possess fewer amenities or none of them.
We find that according to NFHS-3, one-quarter of the FHH had electricity in the premises as also safe drinking
water and toilet facility. These households can be regarded as better off; on the other hand, 26.9 percent of FHH
did not have electricity in the premises, no toilet and had to depend on unsafe drinking water for their daily
necessities. These household would fall in the deprived category. The rest of the households fell in intermediate
categories. In rural areas only 9.4 percent FHH were able to enjoy all the facilities while 37.2 percent had none.
In urban India, almost three-fifths of FHH utilised all the above facilities and less than 3 percent had none.
Table 17: Distribution of FHH and MHH by Availability of Electricity, Toilet within Premises
and Safe Drinking Water, India, NFHS-3
Residence
Type
Total
Rural
Urban
Quality
of Water
SDW
USDW
SDW
USDW
SDW
USDW
Sex of the Household Head
Female Head
Male Head
Electricity
Electricity
Not Available
Available
Not Available
Available
Toilet facility
Toilet facility
Toilet facility
Toilet facility
Not Available
Not
Available Not Available Not Available
Available
Available
Available
Available
5.60
1.22
13.81
24.28
3.49
0.95
13.10
27.56
26.93
4.27
12.78
11.11
22.58
4.07
15.50
12.75
6.66
0.90
15.18
9.44
4.48
0.86
15.45
10.21
37.25
5.21
16.73
8.63
32.62
5.30
21.07
10.01
3.13
1.97
10.61
58.87
1.49
1.13
8.35
62.69
2.88
2.09
3.55
16.90
2.25
1.58
4.23
18.2
Note: SDW = Safe drinking water obtained from tap, tubewell or spring.
USDW = Unsafe drinking water.
Among MHH, 27.6 percent had electricity, toilet facility and safe drinking water on the premises; hence,
they were better off households. In contrast, there were 22.6 percent of MHH that did not have any of the
above facilities and were, therefore, deprived ones. There is only a small difference between FHH and MHH
in respect of availability and non-availability of household amenities, a slightly higher proportion of MHH
22

4.9 Page 39

▲back to top


having all the three amenities and, correspondingly, a slightly lower proportion of MHH having none of them.
In rural areas, 10.2 percent of MHH had all the three amenities as against 32.6 percent that had none. These
proportions are only slightly better than those found in respect of FHH. Similarly, proportions for urban MHH
are somewhat better than those for FHH.
Based on NFHS-3 (Appendix Table A12) information, estimates were obtained on availability of safe drinking
water, electricity and toilet facility on the premises for India, large states and Delhi. We observe that 84
percent of FHH in Delhi that had all the three basic amenities followed by Gujarat (49.6 percent) and Tamil
Nadu (43.3 percent). Other states with more than three-tenths of FHH having all the three amenities were
Haryana, Himachal Pradesh, Punjab, and Uttarakhand. In contrast, there were several states – Bihar (69
percent), Jharkhand (59 percent), Uttar Pradesh (56 percent), and Orissa (56 percent) – where more than half
of the FHH had none of the basic amenities. Obviously, these may be termed as poor households.
As regards MHH we find that 7 .8 percent households in Delhi had all the three basic amenities followed by
erala (5 . percent), Maharashtra (48. percent), ujarat (48.8 percent), ammu and ashmir (48.1 percent),
and Uttarakhand (42. percent). Tamil Nadu, third among FHH, stood at seventh rank (38.3 percent) along
with Himachal Pradesh (38.2 percent) in respect of availability of three basic amenities to MHH (Appendix
Table A12). The states where MHH had none of the three basic amenities were Bihar (61.1 percent), Jharkhand
(57.7 percent), Orissa (4 .8 percent), and Uttar Pradesh (48.6 percent). These are the same states with very
large proportions of FHH that did not have the three basic amenities. This indicates location based poverty
among both FHH and MHH.
13.0 SUMMARY
The ICPD 1994 postulated that population policies should be viewed as an important part on programmes
of women’s development, women’s rights, women’s reproductive health, poverty alleviation and sustainable
development. The United Nations has put special emphasis on the promotion of gender equality and women’s
empowerment in its Millennium Development Goals (MDGs) that was enunciated to achieve poverty reduction
and sustainable development. Recognising that population stabilisation was an essential requirement for
promoting sustainable development with more equitable distribution of resources, the National Population
Policy 2000 laid special emphasis on reproductive health care accessible and affordable for all along with
increasing the provision of primary and secondary education, extending basic amenities including sanitation,
safe drinking water and housing, besides empowering women. Keeping the above in view, we examined in
this monograph the situation of females as household heads vis-à-vis their counterparts.
India’s 2001 Census gives separate information for male-headed and female-headed households on certain
variables like age, marital status, religion and household size. The third round of National Family Health
Survey (NFHS-3) provides information on education and employment status of male and female-household
heads. It also tells us about decision-making in household matters by male and female heads, as also on
household income. Information on availability of certain basic amenities like safe drinking water, electricity
and toilet facility within the premises is also available from NFHS-3. Similarly, NSS data relating to 61st
Round (2004-05) provides information on educational attainment and occupational placement of male and
female-household heads. One also gets information on monthly per capita household expenditure.
As the main objective of the present research we examined the extent of female autonomy vis-à-vis its
destitution utilising the extant data, especially from NFHS-3 and NSS 61st Round. As indicated earlier, one of
the objectives of United Nation’s Millennium Development Goals (MDGs) is to promote gender equality and
women’s empowerment. This has been examined by separately tabulating information on relevant indicators for
male and female-headed households. The indicators on which data have been analysed here are (a) literacy and
completed secondary education (b) nature of employment and cash earnings (c) decision making in household
matters (d) expenditure data available in NSS 61st Round schedule on ‘Consumer Expenditure’ and income
data from NFHS-3 and (e) availability of certain basic amenities in FHH vis-à-vis MHH from NFHS-3.
23

4.10 Page 40

▲back to top


13.1 Proportion of Female-Headed Households
One-tenth of the households in India as of 2001 Census have females as household heads. Their proportion
in Kerala was 22.6 percent, 17.9 percent in Himachal Pradesh and 16.3 percent in Uttarakhand. Besides, it
was well above the national average of 10.4 percent in Andhra Pradesh, Chhattisgarh, Karnataka and Tamil
Nadu. Among smaller states this proportion was high in Goa, Manipur, Meghalaya and Mizoram. In contrast,
the proportion of female-headed households (FHH) was quite low in Bihar, Gujarat, Haryana, Jammu and
Kashmir, Jharkhand, Madhya Pradesh, Rajasthan and Uttar Pradesh among big states and Delhi.
Female Headship Rates (FHR) are higher in NFHS-3 compared to 2001 Census by four percent points at
the national level. The rates are higher in all the states compared to the Census. Bihar is especially an outlier
where the NFHS-3 FH at 25 percent is the highest compared to only 7.4 percent in the Census and 11.8
percent in NSS, which needs some probing.
The pattern of FHH remains the same in respect of NSS as in 2001 Census. Here too, Kerala, Himachal Pradesh
and Uttarakhand stand out having large proportions of FHH. Several large states that have low proportion of
FHH are Assam, Gujarat, Haryana, Jharkhand, Madhya Pradesh, Maharashtra, Orissa, Punjab, Rajasthan and
Uttar Pradesh along with Delhi.
From district level estimates of proportion of FHH in total households of each district as obtained in the
2001 Census we observe that most districts of Uttarakhand, many districts of Himachal Pradesh, most of the
districts of Kerala and coastal districts of Karnataka, a few districts of Tamil Nadu, Meghalaya and Ladakh
division of Jammu and Kashmir had the proportion of FHH above 15.7 percent (more than mean plus one
standard deviation). Besides the southern states, parts of Maharashtra, Orissa, Chhattisgarh and Jharkhand
also had large number of districts with more than 10.4 percent FHH (Map 1). In contrast, the proportion of
FHH in many states – Punjab, Haryana, Rajasthan, Gujarat, Madhya Pradesh, Uttar Pradesh and Bihar was
well below the all-India average.
13.2 Percentage of Female-Headed Households by Marital Status
The proportion of male and female-headed households by marital status and residence type at the national level
indicates that among males ‘currently married’ ones are mostly household heads. Among female household
heads almost two-thirds are widowed and a little over one fourth are those who are currently married. The
latter situation basically arises from migration of male members for work.
The observed pattern is similar in Census, NFHS-3 and NSS. It is also similar in both rural and urban areas.
We find that the proportion of currently married females is higher in rural areas in all the three data sets, which
seems to result from migration of their husbands for work.
These data at the state level (for large states and Delhi) for 2001 Census, NFHS-3 and NSS 61st Round show
that among male heads 90 percent or more were currently married as is expected in a patriarchal society.
Among women household heads, while at the national level the proportion of ‘currently married’ women
stood at slightly below 30 percent, it was more than two-fifths in ihar, Himachal Pradesh, ammu and
Kashmir and Uttarakhand according to 2001 Census; in Bihar, Jammu and Kashmir, Jharkhand, Rajasthan and
Uttar Pradesh as per NFHS-3 data and in Bihar, Himachal Pradesh, Rajasthan, Uttar Pradesh and Uttarakhand
according to NSS. It is noteworthy that currently married women as household heads comprised two-thirds
in Bihar and more than half in Uttar Pradesh in both NFHS-3 and NSS surveys. It is not clear if, besides male
migration, there is any other factor to explain the observed phenomenon.
Widowed and divorced/separated women comprised around two-thirds of FHH at the national level. Since
this category is complementary to the ‘never married’ and ‘currently married’ women, the proportion is high
where these two categories had small proportions of women and low where especially ‘currently married’
women accounted for a large proportion of females as household heads.
24

5 Pages 41-50

▲back to top


5.1 Page 41

▲back to top


13.3 Household Composition and Headship Rates
Household composition depicts the family type constituting it. From the data on household composition, we observe that
at the national level 8 .7 percent of households were headed by males and 10.3 percent by females.
In 2001 Census, a total of 8.2 million households were recorded as single-person households comprising
4.3 percent of total households. Proportionately, single-member households were more with female head (19
percent) as against 2.6 percent in respect of male head. Of the total 4.4 million single-member MHH, 87
percent were one-person households. Among women, of the total 3.80 million single-member households, 8
percent were one-person households implying that almost all women heading single-person households were
living alone. It is quite likely that most of them were widows and some unmarried.
13.4 Percentage of Female-Headed Households by Religion and Social Group
In analysing information on the proportion of female-headed households by religion at the national level
based on 2001 Census, NFHS-3 and NSS 61st Round, we have taken only four religions–Hindu, Muslim,
Christian and Sikh.
The proportion of females as household heads among Christians was well above that for the other three
religions in all the three data sets. The proportion of FHH among Muslims was marginally higher compared
to Hindus and Sikhs. It is noteworthy that while Christian females have larger autonomy and tendency to
migrate independently, this is not true in respect of Muslim women who use the veil. It is quite likely that
there is substantial internal and international migration of Muslim males from certain parts of the country to
earn their living.
13.5 Mean Household Size
We observe that FHH are smaller in size than MHH by 1.4 persons in the census as also in NFHS-3. They
are smaller by 1.2 persons per household in NSS 61st Round. The pattern is same in both rural and urban
areas. This difference in size is because proportionately single person households are more among females
than males. Further, currently married women become household head largely because of male migration for
various reasons, especially to make a living reducing household size.
At the national level, the mean household size is higher by one person for both male and female-headed
households for Muslims compared to Hindus and followed by Sikhs. In contrast, the mean household size of
Christians is the lowest. This applies to all three data sources – 2001 Census, NFHS-3 and NSS. The pattern
is repeated in rural and urban areas.
13.6 Headship Rates by Sex and Educational Attainment
According to NFHS-3 one-third of female household heads were literate in comparison to two-thirds male literate
household heads. A little over half of the urban female household heads were literate as against 83.3 percent of male
household heads. Literacy rate pattern is found to be similar in both NSS and NFHS-3.
State-wise data for FHH (NFHS-3) indicates that the proportion of women household heads who had completed
higher secondary education was 90 percent or above in a majority of states. However, those FHH that had
completed beyond higher secondary education by more than 15 percent were in Jharkhand (16 percent),
Maharashtra (22.8 percent), ajasthan (23. percent) and Delhi (24.4 percent). In erala and Tamil Nadu, this
proportion was just 6.7 percent and 8.4 percent respectively.
The pattern of women household heads, who had completed higher secondary education in NSS was almost
similar to the one observed from the NFHS-3 data. Here it was Jammu and Kashmir, Madhya Pradesh,
Maharashtra, Rajasthan and Delhi where the proportion of FHH having completed beyond higher secondary
education was above 15 percent.
25

5.2 Page 42

▲back to top


13.7 Women’s Employment
NSS 61st ound data indicates that 28 percent women among household heads were non-workers against four
percent of men as household heads. Among male workers, 22 percent were engaged in white collar jobs while
18 percent FHH were found in similar occupations. Moreover, while the proportion of FHH in white collar
jobs was one-tenth in rural areas, it was 43 percent in urban areas.
In NFHS-3, among women aged 15-49 years, 57 percent in the total sample (71 percent urban) were non-
workers in FHH. The proportion of non-workers among women in MHH was 58 percent. White collar workers
in FHH comprised 33 percent of total workers in urban areas and 6 percent in rural areas. These figures are
similar for women workers in MHH. Thus, being FHH or MHH made no difference with regard to employment
or those engaged in white collar occupations as far as NFHS-3 is concerned.
13.8 Women’s Autonomy, Decision Making and Empowerment
NFHS-3 has obtained data from currently married women aged 15-49 years on certain aspects of their
empowerment and decision making that relate to their earnings and persons who decide how the same has to
be used; persons who largely take decisions regarding (1) woman’s health care (2) major household purchases
(3) purchase of daily household needs and (4) visit to her family or relatives. Also the woman’s freedom of
movement–going to (a) the market (b) health facility and (c) places outside the village/community. Similar
data has been obtained from men in this age group. In this study, we have separated FHH and MHH; hence,
we have ignored men’s information.
We examined the type of earnings of women workers who were themselves household heads and those who were
working but a male member was the household head. The pattern of earnings of women in FHH and MHH has been
quite similar, 54.7 percent of women in FHH and 53.4 percent in MHH were earning cash only.
We find that three-fifths of the times, women decided themselves as household head how to spend the money
they earned. However, one-third of the women spent their cash earnings with their husband’s nod. With male-
household head only 23 percent of wives were able to utilise their earnings on their own and three-fifths spent
in agreement with their husbands. Thus, women as household heads had much more independence to use their
cash earnings.
We examined the completed level of education–middle (up to VIII standard) and secondary–among literate
household heads. At the national level we observe that among literates, a higher proportion of women
household heads have completed middle-level education. A slightly higher proportion of female heads have
completed secondary education as well, according to NSS. A higher proportion of male heads have completed
secondary level according to NFHS-3.
As indicated earlier, a question was addressed to currently married women aged 15-49 years about decision
making with regard to (1) their health care (2) major household purchases (3) purchase of daily household
needs and (4) visit to her family or relatives. When a woman is the household head, she has a greater say in
respect to her own health care and purchase of daily household needs. Further, she along with her husband
takes three-quarters to four-fifths of the decisions on all matters under consideration. When we consider
MHH, we observe that one-fourth of the times a woman can do the needful regarding decision making by
currently married women aged 15 - 49 years in respect of (1) their health care (2) major household purchases
and (3) purchase of daily household needs. It was observed that when a woman is household head she had a
greater say in respect of her own health care and purchase of daily household needs. Further, she along with
her husband took decisions two-thirds to four-fifths of the times on all matters under consideration.
NFHS-3 had collected data on women’s freedom of movement to go (1) alone (2) with someone else or (3) not at
all to (a) the market (b) the health facility and (c) places outside the village/community. We notice that a woman as
26

5.3 Page 43

▲back to top


household head could go to the market alone two-thirds of the times and one-fourth of the times with someone else.
In respect of MHH, she alone could go to market a little more than half the times and with someone else in 36 percent
of the cases; the two together accounting for almost same proportion as in FHH.
A more important aspect was freedom to go alone outside the particular village/community. Here, 54 percent
of women in FHH thought that they could go alone against 37 percent in MHH. One may conclude that
women in FHH had greater freedom than those in MHH.
13.9 Headship Rates by Sex, Monthly Per Capita Expenditure and Wealth Index
As is well known, the Indian census does not collect any data on household income or expenditure. NSSO
has been collecting data on monthly household expenditure in its ‘Consumer Expenditure’ schedule over time.
Similarly, in its different rounds, NFHS-3 has collected data on household income. Classification of FHH and
MHH in rural households into five monthly per capita expenditure (MPCE) categories–lowest, low, medium, high
and highest–as of NSS 61st Round indicates that at the national level there is little difference in the proportion
of female and male-headed rural households in different MPCE categories. In fact, FHH in rural India are better
placed than MHH and do not reflect higher poverty amongst women.
Considering the situation in urban households at the national level, we observe that a slightly higher proportion
(7.6 percent) of FHH fell in the lowest category of MPCE compared to MHH (4.9 percent) but almost a similar
proportion (41.6 percent and 43.8 percent) of the female and male-headed households respectively were in the
highest MPCE category.
From the NSS data on MPCE, we find that FHH are not generally poor. Women household heads might be
getting regular remittances from their spouses and other male members that keep them well above the poverty
line.
NFHS-3 has classified all households on the basis of their income into three categories–low, medium and
high. At the national level while there were 43 percent of FHH in the low-income category, there were only 28
percent of MHH therein. In contrast, there were 28 percent and 3 percent of FHH and MHH respectively in
the high income category. This indicates that MHH were somewhat better off than FHH in terms of household
income.
A very high proportion of FHH in the high-income category in Haryana (64 percent), Kerala (69 percent),
Punjab (70 percent) and Delhi (86 percent) indicated that FHH, especially in those states, were not really poor.
NFHS-3 has computed ‘wealth index’ to indicate economic status of households. Utilising the ‘wealth index’
indicator we have classified the FHH and MHH into poorest, poorer, middle, richer and richest categories.
At the national level 47 percent of FHH were in poorest and poorer categories, which is not very different
from what was observed in the NSS data. On the other hand, the proportion of MHH therein was 36 percent.
Accordingly, the proportion of richer and richest FHH was 34 percent whereas that proportion in MHH was
41 percent.
Concentrating on the ‘poorest’ category of wealth index, we observe that the proportion of FHH was less
than 10 percent in Haryana, Himachal Pradesh, Jharkhand, Kerala, Punjab, Uttar Pradesh and Delhi. The
proportion of the richest FHH in these states was above 30 percent.
At the state level, the proportion of FHH below one-fourth in the poorest and poorer categories put together was
found in Gujarat, Haryana, Himachal Pradesh, Jharkhand, Kerala, Punjab, and Delhi. These are the same states
where MPCE in NSS 61st Round in the lowest two categories was below 20 percent. In contrast, the proportion
of FHH in poorest and poorer ‘wealth index’ categories was more than half in Bihar, Chhattisgarh, Jammu and
Kashmir, Maharashtra, Orissa, Rajasthan, Uttarakhand and West Bengal.
27

5.4 Page 44

▲back to top


According to NFHS-3, at the national level, FHH are somewhat worse off than MHH whether we consider
income classification in the three categories or wealth index dividing households into five categories. These
results are at variance with those obtained in NSS where the difference between FHH and MHH was marginal.
Classification of Female and Male-Headed Households by Available Amenities
We wanted to assess as to what proportion of FHH and MHH respectively availed the three basic amenities of
safe drinking water, toilet facility within the house and electricity. With large scale electrification it is presumed
that most households would have electricity. Safe drinking water is a necessity of life and, therefore, households
must have access to it. Similarly toilet facility within the premises is a basic necessity and should be available
to all. We classified the FHH and MHH on the basis of availability of these amenities for NFHS-3 for which the
relevant data were available. We are of the view that households that have all three amenities are better placed
than those that possess fewer amenities or none of them.
We find that one-quarter of the FHH had all the three amenities and, therefore, could be regarded as better off.
On the other hand, 26.9 percent of FHH did not have any of the three basic amenities and, hence, they fall in the
deprived category. The rest of the households fell in the intermediate categories. In rural areas only 9.4 percent
FHH were able to enjoy all the facilities, while 37.2 percent had none. In urban India, almost three-fifths of
FHH utilised all the above facilities and less than 3 percent had none.
Among MHH, 27.6 percent had all the three basic amenities. Hence, they were better off households, while
there were 22.6 percent that did not have any of those facilities and were, therefore, deprived ones. There is
only a small difference between FHH and MHH in respect of availability and non-availability of household
amenities, a slightly higher proportion of MHH had all the three amenities and, correspondingly, a slightly
lower proportion of MHH had none of them.
14.0 CONCLUSION
As the title of the study indicates we were examining if a woman being a household head was more empowered
to take decisions on her own as compared to the one in a male-headed household. It was only in NFHS-3
that direct questions were asked from women and men on certain aspects of decision making and women’s
freedom to move alone to specified places. The data indicates that women as household heads decided more
frequently how to spend their own cash earnings in comparison to women in male-headed households.
Similarly, women respondents in FHH themselves decided more frequently about (a) their own health care (b)
major household purchases (c) daily household needs and (d) visit to the family/relations than women living
in a household with a male as household head. A more important aspect of ‘freedom of movement to go alone
outside the particular village/community’ showed that a little over half the women as household head could
do it compared to less than two-fifths with a male as household head. From these data one can easily conclude
that women in FHH had greater freedom than those in MHH.
28

5.5 Page 45

▲back to top


APPENDIX TABLES
Table A1: Percentage Distribution of Household Head by Sex and Marital Status, India and Big States,
Census 2001, NFHS-3 and NSS 61st Round
Area Name
Census 2001
INDIA
Andhra Pradesh
Assam
Bihar
Chhattisgarh
Gujarat
Haryana
Himachal Pradesh
Jammu & Kashmir
Jharkhand
Karnataka
Kerala
Madhya Pradesh
Maharashtra
Orissa
Punjab
Rajasthan
Tamil Nadu
Uttar Pradesh
Uttarakhand
West Bengal
Delhi
NFHS-3
INDIA
Andhra Pradesh
Assam
Bihar
Chhattisgarh
Gujarat
Haryana
Himachal Pradesh
Jammu & Kashmir
Jharkhand
Never Married Currently Married
Male Female Male Female
2.74
3.45
93.15
27.06
1.43
1.77
95.90
20.71
4.51
3.8
1.78
21.95
2.55
4.29
92.32
42.51
2.53
3.79
92.79
26.10
2.35
2.69
93.52
17.59
2.19
2.02
93.66
27.29
3.26
2.35
1.85
43.26
2.56
4.27
92.77
41.79
2.90
4.79
92.59
30.51
2.96
3.14
94.24
24.10
1.96
2.74
95.23
2 .58
2.61
2.96
92.54
24.76
2.79
3.04
94.62
23.75
3.24
4.07
93.11
25.25
2.29
2.13
92.57
27.28
2.36
2.59
93.14
33.63
1. 8
1. 8
94.42
22.42
3.72
7.59
8 .24
39.39
3.15
2.25
1.84
44.09
2.83
3.43
94.57
19.43
3. 8
3.36
92.91
24.87
2.47
1.58
93.39
34.68
1.49
2.42
95.45
21.90
5.06
3.52
91.41
29.92
2.26
0.24
1. 8
68.03
2.32
2.14
92.73
12.94
1.90
1.50
93.96
17.34
2.85
0.88
92.99
28.3
3.06
2.51
1.78
35.62
2.97
0.45
92.32
41.56
2.28
3.28
93.90
44.62
Widowed
Divorced/Separated
Male Female Male Female
3.87
66.13
0.24
3.36
2.44
73.24
0.23
4.28
3.44
70.71
0.27
3.45
5.06
52.60
0.07
0.59
4.20
64.49
0.48
5.61
3.72
77.06
0.41
2.66
4.03
69.90
0.12
0.79
4.55
53.22
0.34
1.16
4.47
52.50
0.20
1.44
4.35
63.09
0.16
1.60
2.63
69.44
0.17
3.32
2.56
62.54
0.26
5.14
4.52
68.74
0.33
3.54
2.37
68. 5
0.21
4.26
3.37
66.74
0.28
3.95
4.90
69.59
0.24
0.99
4.29
62.52
0.20
1.26
3.33
71.21
0.28
4.40
6.81
52.32
0.22
0.71
4.83
52.77
0.18
0.8
2.34
72.43
0.26
4.72
2.99
70.15
0.12
1.63
3.67
58.69
0.46
5.02
2.54
67.85
0.49
7.48
3.16
5 .88
0.37
6.68
5.62
30.17
0.14
1.57
3.79
73. 8
1.16
10.94
3.22
77.81
0.92
3.36
3.97
68.88
0.19
1.85
4.8
61.55
0.27
0.33
4.32
54.67
0.39
3.32
3.52
51.26
0.30
0.84
29

5.6 Page 46

▲back to top


Area Name
Karnataka
Kerala
Madhya Pradesh
Maharashtra
Orissa
Punjab
Rajasthan
Tamil Nadu
Uttar Pradesh
Uttarakhand
West Bengal
Delhi
NSS 61st Round
INDIA
Andhra Pradesh
Assam
Bihar
Chhattisgarh
Gujarat
Haryana
Himachal Pradesh
Jammu & Kashmir
Jharkhand
Karnataka
Kerala
Madhya Pradesh
Maharashtra
Orissa
Punjab
Rajasthan
Tamil Nadu
Uttar Pradesh
Uttarakhand
West Bengal
Delhi
Never Married
Male Female
2.82
2.31
1.45
1.61
2.33
1.58
1.82
1.19
1.87
2.77
2.85
0.94
3.20
1.26
2.35
1.77
2.53
0.63
2.86
1.36
2.63
1.31
6.50
5.00
Currently Married
Male Female
4.58
15.18
5.83
34.29
2.83
17.88
95.49
15.75
94.14
38.08
91.91
19.96
92.47
41.87
93.73
26.56
0.83
52.8
93.12
28.45
95.02
32.99
0.48
1 .68
4.10
5.29
4.91
7.07
3.54
4.29
3.04
0.50
2.79
5.68
4.87
10.72
4.99
0.28
5.66
6.54
2.90
11.44
3.95
10.61
5.46
8.63
3.14
5.14
2.53
2.00
4.51
7.32
3.58
8.40
3.25
2.14
3.14
1.36
4.41
6.75
4.20
1.48
2.88
2.87
3.91
5.66
9.35
0.50
91.54
91.63
93.79
91.79
92.64
0.88
90.93
88. 4
0.86
0.80
90.76
93.63
92.19
92.40
92.41
92.22
92.29
92.22
88.68
91.93
93.25
88.86
26.93
9.29
20.8
66.14
15.31
12.66
30.42
43.72
29.72
22.31
7.63
32.45
19.67
13.38
27.10
2 .58
44.44
15.42
52.11
46.72
24.31
10.07
Widowed
Male Female
2.22
75.33
2.46
58.58
4.19
73.79
2.34
75.05
3.65
56.86
5.01
76.27
3.92
54.26
3.23
62.97
6.09
44.16
3.97
67.30
2.08
60.86
2.83
72.20
Divorced/Separated
Male Female
0.39
7.18
0.26
5.51
0.66
6.74
0.35
8.01
0.33
2.30
0.23
2.82
0.40
2.61
0.69
8.70
0.56
2.32
0.05
2.90
0.26
4.84
0.19
3.12
4.10
64.67
0.26
3.11
3.16
78. 0
0.30
4.73
2.64
72.55
0.03
2.27
5.16
33.35
0.01
0.02
3.94
68.70
0.63
10.31
3.78
74.40
0.47
2.22
3.96
68.78
0.12
0.53
4.82
48.68
0.58
1.05
6.10
58.17
0.15
0.68
4.8
66.22
0.37
0.86
3.51
80.65
0.28
3.09
2. 8
58.03
0.25
4.39
4.8
75.54
0.39
2.78
2.73
72.31
0.36
6. 8
3.78
62.90
0.24
1.59
4.35
67.96
0.18
0.33
4.39
52.82
0.18
1.38
3.17
74.39
0.21
3.44
6.82
45.77
0.30
0.64
4.85
49.56
0.35
0.86
2.74
66.06
0.11
3.97
1.55
88.04
0.24
1.39
30

5.7 Page 47

▲back to top


Table A2: Percentage of Female-Headed Households by Religion, India, Big States and Delhi, 2001
Census, NFHS-3 and NSS 61st Round
India, Big States and Delhi
2001 Census
INDIA
Andhra Pradesh
Assam
Bihar
Chhattisgarh
Gujarat
Haryana
Himachal Pradesh
Jammu and Kashmir
Jharkhand
Karnataka
Kerala
Madhya Pradesh
Maharashtra
Orissa
Punjab
Rajasthan
Tamil Nadu
Uttar Pradesh
Uttarakhand
West Bengal
Delhi
NFHS-3
INDIA
Andhra Pradesh
Assam
Bihar
Chhattisgarh
Gujarat
Haryana
Himachal Pradesh
Jammu and Kashmir
Jharkhand
Karnataka
Kerala
Madhya Pradesh
Hindu
10.1
11.3
10.8
7.1
11.0
7.8
8.2
18.1
11.4
7.6
13.9
22.9
7.3
.8
9.9
10.3
6.8
13.6
7.8
17.5
11.2
8.5
13.9
14.2
13.0
23.5
11.4
8.3
11.0
18.8
13.8
10.5
15.7
22.8
7.6
Percent Households With Female Head
Muslim
Christian
Sikh
10.6
15.2
9.3
11.5
14.0
9.0
9.0
10.2
8.
9.0
15.0
.8
11.4
12.4
9.0
10.2
11.8
7.0
5.4
10.8
8.4
9.4
15.0
14.6
3.6
14.8
13.9
7.3
13.9
9.3
12.9
19.5
8.4
29.2
15.0
16.3
9.1
15.8
8.2
10.2
18.4
10.4
12.5
11.7
8.4
6.5
9.0
9.3
7.9
17.6
5.7
18.2
15.4
9.0
8.5
14.3
7.6
6.9
18.3
8.8
9.0
16.8
10.3
7.8
14.7
13.2
17.1
18.4
11.7
19.2
17.7
37.5
15.4
9.0
0.0
32.7
0.0
0.0
14.3
15.7
20.0
9.9
0.0
0.0
13.6
0.0
10.6
12.7
0.0
19.6
4.2
0.0
21.8
12.9
15.5
11.8
14.8
22.7
0.0
36.2
15.3
0.0
4.4
1.3
20.8
Total
10.4
11.3
10.2
7.4
11.0
8.0
8.1
17.9
6.8
8.3
13.9
22.6
7.5
10.1
10.1
9.7
6.9
14.0
7.9
16.3
10.8
8.7
14.4
14.9
13.4
25.0
11.6
8.4
11.1
18.6
8.2
11.2
15.8
24.6
7.5
31

5.8 Page 48

▲back to top


India, Big States and Delhi
Maharashtra
Orissa
Punjab
Rajasthan
Tamil Nadu
Uttar Pradesh
Uttarakhand
West Bengal
Delhi
NSS 61st Round
INDIA
Andhra Pradesh
Assam
Bihar
Chhattisgarh
Gujarat
Haryana
Himachal Pradesh
Jammu & Kashmir
Jharkhand
Karnataka
Kerala
Madhya Pradesh
Maharashtra
Orissa
Punjab
Rajasthan
Tamil Nadu
Uttar Pradesh
Uttarakhand
West Bengal
Delhi
Hindu
11.8
13.0
10.6
9.1
20.0
13.3
16.3
14.7
9.1
10.4
11.8
8.8
10.2
9.1
8.1
7.8
17.4
13.0
7.3
14.5
24.6
5.6
9.6
9.6
7.6
9.7
15.8
7.8
16.4
9.9
8.2
Percent Households With Female Head
Muslim
Christian
Sikh
12.4
29.3
13.1
12.4
14.5
0.0
6.5
0.0
11.6
6.0
26.7
8.5
23.1
22.5
0.0
17.3
0.0
10.2
9.4
32.4
11.6
15.9
8.
12.3
7.8
27.2
14.1
12.5
17.4
8.8
11.4
19.1
0.0
8.0
7.8
0.0
20.9
0.0
38.2
3.1
21.3
0.0
12.2
9.5
2.3
9.2
0.0
4.7
1.0
57.5
26.6
2.4
0.0
21.4
7.0
18.5
0.0
18.3
29.0
0.0
32.6
18.8
0.0
5.9
11.2
0.0
8.4
17.5
8.
5.0
9.1
0.0
4.1
0.2
9.0
13.3
0.0
6.4
21.6
19.5
0.0
10.2
0.0
12.8
7.2
37.0
0.0
9.5
24.6
0.0
10.9
20.5
10.0
Total
12.4
13.0
10.9
8.7
20.2
13.9
15.7
15.0
9.5
10.8
11.9
8.5
11.8
9.2
8.5
7.7
17.2
7.1
8.0
15.2
25.0
5.6
9.5
9.5
8.3
.8
16.2
8.2
15.7
9.9
8.6
32

5.9 Page 49

▲back to top


Table A3: Percentage of Female-Headed Households by Social Groups, India, Big States and Delhi,
NFHS-3 and NSS 61st Round
India, Big States and Delhi
SC
ST
NFHS-3
INDIA
14.9
11.8
Andhra Pradesh
15.3
8.7
Assam
11.8
9.2
Bihar
24.9
21.8
Chhattisgarh
14.6
11.0
Gujarat
9.9
12.0
Haryana
15.5
15.3
Himachal Pradesh
10.0
0.0
Jammu & Kashmir
12.3
11.4
Jharkhand
14.3
7.5
Karnataka
17.4
17.8
Kerala
21.2
22.0
Madhya Pradesh
15.8
11.6
Maharashtra
9.0
7.2
Orissa
15.5
11.9
Punjab
11.5
0.0
Rajasthan
10.0
12.7
Tamil Nadu
20.9
24.8
Uttar Pradesh
11.4
12.2
Uttarakhand
12.9
6.3
West Bengal
15.3
16.5
Delhi
9.6
10.4
NSS 61st Round
India
10.6
10.4
Andhra Pradesh
13.1
13.4
Assam
6.7
6.4
Bihar
.8
4.4
Chhattisgarh
7.3
10.9
Gujarat
12.0
9.7
Haryana
6.3
4.7
Himachal Pradesh
13.5
19.9
Jammu & Kashmir
10.5
21.2
Jharkhand
7.9
10.7
Karnataka
17.6
19.5
Kerala
22.5
24.8
Madhya Pradesh
5.6
6.6
OBC
15.0
15.2
16.1
25.1
11.6
7.6
18.7
11.2
11.0
5.1
14.1
25.1
12.0
6.6
11.8
9.6
7.8
20.3
10.8
15.0
8.3
6.9
11.5
12.5
10.5
12.0
8.6
7.5
8.4
23.0
7.1
6.9
14.9
27.7
5.1
Others
13.8
15.3
12.2
24.7
9.5
7.3
19.9
11.7
10.8
13.6
17.0
26.4
11.7
8.2
13.1
10.9
6.9
11.9
18.4
12.9
15.6
9.9
10.1
9.9
8.
13.4
8.4
7.9
8.0
17.2
6.3
6.5
13.7
20.5
5.7
33

5.10 Page 50

▲back to top


India, Big States and Delhi
SC
ST
Maharashtra
10.7
10.9
Orissa
9.2
9.3
Punjab
7.4
0.0
Rajasthan
9.9
5.5
Tamil Nadu
18.0
17.6
Uttar Pradesh
8.7
1.3
Uttarakhand
12.9
4.0
West Bengal
8.
17.1
Delhi
5.3
0.0
OBC
9.3
10.2
9.1
10.5
15.5
8.3
5.1
8.6
7.3
Others
8.
8.
8.7
10.8
17.8
7.6
20.3
.8
10.2
Table A4: Mean Household Size by Sex of Household Head and Religion, 2001 Census,
NFHS-3 and NSS 61st Round
India, Big states and Delhi
Census 2001
INDIA
Andhra Pradesh
Assam
Bihar
Chhattisgarh
Gujarat
Haryana
Himachal Pradesh
ammu8 ashmir
Jharkhand
Karnataka
Kerala
Madhya Pradesh
Maharashtra
Orissa
Punjab
Rajasthan
Tamil Nadu
Uttar Pradesh
Uttarakhand
West Bengal
Delhi
NFHS-3
INDIA
Andhra Pradesh
Hindu
M
F
5.3
3.8
4.5
3.1
5.3
4.4
6.1
4.4
5.3
3.3
5.3
3.8
5.7
4.8
5.1
4.1
5.5
4.3
5.6
4.1
5.1
3.9
4.6
4.1
5.6
3.7
5.0
3.4
4.9
3.3
5.4
5.0
6.1
4.2
4.4
3.0
6.4
4.9
5.4
3.9
5.0
4.1
4.9
4.9
5.1
3.7
4.2
2.8
Muslim
Christian
Sex of household head
M
F
M
F
6.3
4.9
4.9
3.8
5.5
4.7
4.3
3.2
6.0
4.2
5.5
4.5
6.3
4.5
5.1
4.0
5.7
4.4
5.0
3.5
5.8
4.6
4.5
3.6
6.8
5.3
4.4
4.0
5.8
4.5
4.0
3.2
7.0
5.6
5.4
4.5
6.7
4.8
5.5
4.1
6.1
4.9
4.5
3.8
6.0
5.4
4.5
3.7
6.4
5.2
4.6
3.5
6.1
4.9
4.3
3.6
5.8
4.4
4.9
3.4
6.0
5.3
5.7
5.1
7.1
5.5
4.8
3.2
5.1
4.3
4.4
3.3
7.3
5.9
5.7
4.5
6.7
5.6
4.6
3.6
5.7
4.0
4.9
4.2
5.9
6.1
4.1
3.6
5.9
4.7
4.3
3.2
4.8
3.5
4.1
2.4
Sikh
M
F
5.7
4.8
4.8
4.4
5.0
4.7
5.9
5.1
5.3
4.7
4.9
4.6
5.7
4.6
5.1
4.2
5.3
4.2
5.6
5.3
4.4
3.8
4.3
4.2
5.4
4.7
4.9
4.2
5.1
4.7
5.8
4.8
5.9
4.7
4.4
3.5
6.0
5.1
5.7
4.7
5.0
4.9
5.1
4.8
5.6
4.0
3.6
0.0
34

6 Pages 51-60

▲back to top


6.1 Page 51

▲back to top


India, Big states and Delhi
Assam
Bihar
Chhattisgarh
Gujarat
Himachal Pradesh
Haryana
Jharkhand
Jammu and Kashmir
Karnataka
Kerala
Madhya Pradesh
Maharashtra
Orissa
Punjab
Rajasthan
Tamil Nadu
Uttarakhand
Uttar Pradesh
West Bengal
Delhi
NSS 61st Round
INDIA
Andhra Pradesh
Assam
Bihar
Chhattisgarh
Gujarat
Haryana
Himachal Pradesh
Jammu & Kashmir
Jharkhand
Karnataka
Kerala
Madhya Pradesh
Maharashtra
Orissa
Punjab
Rajasthan
Tamil Nadu
Hindu
M
F
4.7
3.8
6.1
4.8
5.5
3.2
4.9
3.5
4.8
4.1
5.5
4.6
5.7
4.4
5.3
4.1
5.0
3.8
4.4
4.1
5.4
3.3
4.9
3.3
4.9
3.4
5.1
4.8
5.6
3.8
3.8
2.4
5.2
3.7
6.0
4.5
4.7
3.8
4.6
4.3
4.4
3.2
3.9
2.6
4.8
3.9
4.8
3.5
4.6
3.1
4.4
2.9
4.5
3.9
4.3
3.5
4.7
3.3
4.6
3.2
4.3
3.2
4.1
3.7
4.7
3.3
4.3
2.9
4.5
3.1
4.1
4.2
4.8
3.9
3.8
2.6
Muslim
Christian
Sex of household head
M
F
M
F
5.6
3.7
5.2
4.4
6.5
5.1
3.0
0.0
5.6
4.7
4.3
3.8
5.8
4.0
4.5
0.0
4.4
2.7
3.0
.0.0
7.1
4.2
5.0
0.0
6.6
6.2
5.3
4.3
6.6
4.1
6.4
0.0
5.5
4.8
4.1
4.2
5.8
5.3
4.1
3.5
5.7
3.8
4.2
4.4
6.1
5.4
4.1
2.5
5.8
3.9
5.1
3.6
5.9
6.2
5.5
0.0
6.0
4.2
5.0
1.9
3.8
3.0
3.5
2.4
6.7
4.6
3.3
4.5
6.8
5.4
4.9
0.0
5.3
4.0
5.3
4.4
5.2
6.4
3.4
2.7
4.8
3.8
4.2
2.9
4.7
3.6
4.2
2.1
5.0
3.5
4.8
4.5
5.1
4.2
6.7
0
4.2
1.5
5.4
3.5
4.8
2.5
3.1
3.0
4.8
2.7
3.1
0
3.6
3.0
3.7
1.3
5.3
4.0
3.7
0
5.2
3.3
4.9
2.4
4.7
3.8
3.6
2.1
4.7
4.2
4.0
3.0
4.8
3.5
3.1
2.1
4.5
3.0
3.9
2.6
4.0
4.0
4.3
2.0
4.2
7.1
5.1
6.0
4.7
3.6
6.0
0
4.1
3.5
4.0
2.8
Sikh
M
F
3.0
6.5
4.0
0.0
5.5
0.0
4.5
0.0
4.9
5.0
5.6
0.0
5.0
3.9
5.3
1.0
0.0.
2.0
2.5
4.0
5.3
0.0
5.7
3.8
6.2
3.0
5.7
0.0
4.9
0.0
.0.0
0.0
5.7
2.0
5.4
1.0
4.4
1.0
4.9
0.0
4.7
3.8
4.0
0
3.9
0
5.4
4.0
4.9
0
4.8
4.0
4.6
2.7
3.5
3.3
4.5
4.0
3.7
0
3.8
0
0
0
5.3
0
3.6
1.0
0
0
4.8
3.7
4.1
5.4
0
0
35

6.2 Page 52

▲back to top


India, Big states and Delhi
Uttar Pradesh
Uttarakhand
West Bengal
Delhi
Hindu
M
F
4.8
3.6
4.7
3.4
4.3
3.2
4.2
4.3
Muslim
Christian
Sex of household head
M
F
M
F
5.0
4.2
3.4
0
5.1
4.0
3.1
1.0
4.7
3.3
4.4
2.8
3.6
3.7
3.3
1.5
Sikh
M
F
4.8
6.6
4.7
0
3.4
0
4.9
3.3
Note: M Male, F Female
Table A5: State-wise Mean Household Size by Social Groups, NFHS-3 and NSS 61st Round
India, Big States and Delhi Scheduled Caste
NFHS-3
INDIA
Andhra Pradesh
Assam
Bihar
Chhattisgarh
Gujarat
Haryana
Himachal Pradesh
Jharkhand
Jammu and Kashmir
Karnataka
Kerala
Madhya Pradesh
Maharashtra
Orissa
Punjab
Rajasthan
Tamil Nadu
Uttar Pradesh
Uttarakhand
West Bengal
Delhi
NSS 61st Round
INDIA
Andhra Pradesh
Assam
Bihar
Male Female
5.2
3.7
4.4
2.7
4.8
3.8
5.8
4.7
5.6
3.3
4.9
3.5
5.5
4.6
5.0
4.1
5.5
4.8
5.7
4.5
5.4
3.7
4.5
4.1
5.3
2.9
5.1
3.5
4.7
3.3
5.5
4.9
5.6
4.0
4.0
2.6
5.9
4.2
5.6
3.8
4.8
3.6
4.8
5.1
4.6
3.3
3.9
2.8
4.6
4.0
4.8
3.6
Social Group
Scheduled Tribe Other Backward
Classes
Male Female Male Female
5.2
3.6
5.3
3.9
4.3
2.4
4.2
2.9
5.2
3.7
4.8
4.1
7.0
1.5
6.3
5.0
5.3
3.0
5.7
3.2
5.0
3.6
5.2
3.7
5.6
.
5.7
4.8
4.7
4.0
4.9
4.0
5.3
4.0
6.0
4.7
6.3
4.9
6.1
3.8
5.4
4.5
5.0
4.0
4.3
4.1
4.8
4.5
5.4
3.5
5.6
3.2
5.2
3.2
5.0
3.3
4.8
3.1
5.0
3.5
5.3
.
5.4
4.0
5.4
3.9
5.9
3.7
3.7
3.2
3.8
2.4
6.0
4.2
6.3
4.9
5.6
3.0
5.7
3.7
5.0
3.9
4.6
4.1
4.9
3.5
4.7
5.1
4.5
3.1
4.5
3.3
3.7
2.1
4.1
2.7
5.1
4.3
4.7
4.2
4.0
3.2
4.9
3.8
Others
Male Female
5.1
4.0
4.2
3.0
4.9
3.8
6.0
4.5
4.8
3.8
4.8
3.5
5.6
4.4
4.7
4.1
5.8
5.1
5.4
3.9
4.6
3.5
4.5
4.4
5.2
3.9
5.0
3.7
5.1
3.6
5.3
4.4
5.2
3.5
3.7
2.2
6.1
4.7
5.2
3.8
4.7
3.9
4.6
4.1
4.4
3.3
4.0
2.7
4.9
3.6
4.8
3.4
36

6.3 Page 53

▲back to top


India, Big States and Delhi Scheduled Caste
Chhattisgarh
Gujrat
Haryana
Himachal Pradesh
Jammu & Kashmir
Jharkhand
Karnataka
Kerala
Madhya Pradesh
Maharastra
Orissa
Punjab
Rajasthan
Tamil Nadu
Uttar Pradesh
Uttarakhand
West Bengal
Delhi
Male
4.8
4.5
4.6
4.5
4.9
4.8
4.8
4.3
4.7
4.5
4.5
4.7
4.9
4.0
4.9
4.9
4.4
4.5
Female
2.9
2.2
4.3
3.9
3.3
3.7
3.1
4.1
3.3
3.2
2.9
4.1
3.9
2.8
3.5
3.4
3.6
5.0
Social Group
Scheduled Tribe Other Backward
Classes
Male Female Male Female
4.6
3.0
4.6
3.1
4.3
3.4
4.5
3.0
4.6
3.0
4.7
3.8
4.7
2.1
4.7
3.9
4.7
2.2
5.4
3.9
4.7
3.0
4.7
3.2
4.6
3.5
4.4
3.2
3.9
3.3
4.3
3.8
4.7
3.5
4.7
3.2
4.5
2.7
4.4
2.9
4.3
2.6
4.6
3.1
4.5
.
4.4
4.1
4.9
3.8
4.8
4.2
3.8
2.3
3.8
2.7
4.4
4.3
5.0
3.8
4.8
6.0
4.9
4.1
4.5
2.9
4.5
3.3
4.4
.
3.3
3.1
Others
Male
4.4
4.3
4.3
4.1
5.1
4.5
4.1
3.9
4.6
4.2
4.6
4.4
4.5
3.7
4.6
4.6
4.3
4.2
Female
4.1
2.8
3.6
3.2
3.6
3.5
3.3
3.2
3.5
2.9
3.7
3.7
3.4
2.4
3.8
3.3
3.2
4.1
Table A6: State-wise Literacy Rate among Female and Male-Household Heads
India, Big States and
Delhi
INDIA
Andhra Pradesh
Assam
Bihar
Chhattisgarh
Gujarat
Haryana
Himachal Pradesh
Jammu and Kashmir
Jharkhand
Karnataka
Kerala
Madhya Pradesh
Maharashtra
NFHS-3
Female Head
Illiterate Literate
67.1
32.9
73.6
26.4
48.4
51.6
86.4
13.6
82.2
17.8
56.5
43.5
70.3
29.7
54.2
45.8
61.7
38.3
77.0
23.0
67.8
32.2
21.9
78.1
73.8
26.2
57.0
43.0
Male Head
Illiterate Literate
32.6
67.4
40.7
59.3
25.8
74.2
45.2
54.8
37.1
62.9
24.7
75.3
30.5
69.5
21.5
78.5
36.8
63.2
40.2
5 .8
32.7
67.3
7.7
92.3
38.0
62.0
19.4
80.6
NSS 61st Round
Female Head
Illiterate Literate
63.6
36.4
77.1
22.9
52.5
47.5
79.4
20.6
77.3
22.7
59.3
40.7
68.6
31.4
42.7
57.3
55.5
44.5
75.7
24.3
69.4
30.6
27.0
73.0
75.7
24.3
55.5
44.5
Male Head
Illiterate Literate
34.4
65.6
47.1
52.9
22.7
77.3
43.0
57.0
39.5
60.5
26.1
73.9
28.0
72.0
24.8
75.2
45.3
54.7
42.7
57.3
37.5
62.5
8.
91.1
40.4
59.6
22.9
77.1
37

6.4 Page 54

▲back to top


India, Big States and
Delhi
Orissa
Punjab
Rajasthan
Tamil Naadu
Uttar Pradesh
Uttarakhand
West Bengal
Delhi
NFHS-3
Female Head
Illiterate Literate
65.8
34.2
59.5
40.5
87.7
12.3
56.7
43.3
81.0
19.0
66.3
33.7
61.3
38.7
41.0
59.0
Male Head
Illiterate Literate
35.1
64.9
34.1
65.9
40.8
59.2
22.9
77.1
39.5
60.5
24.9
75.1
33.0
67.0
13.4
86.6
NSS 61st Round
Female Head
Illiterate Literate
64.0
36.0
49.1
50.9
82.7
17.3
57.4
42.6
80.0
20.0
57.5
42.5
53.0
47.0
57.5
42.5
Male Head
Illiterate Literate
40.4
59.6
34.5
65.5
46.1
53.9
25.0
75.0
41.5
58.5
28.5
71.5
30.4
69.6
8.2
1.8
Table A7: State-wise Proportion of FHH and MHH for those who have Completed Higher Secondary
Education, NFHS-3 and NSS 61st Round
India, Big States and
Delhi
NFHS-3
Female Head
Male Head
Up to HS Above Up to HS Above
HS
HS
INDIA
91.07
8.93
85.41 14.59
Andhra Pradesh
8 .87 10.13
86.53 13.47
Assam
91.50
8.50
8 .50 10.50
Bihar
8.40
1.60
85.63 14.37
Chhattisgarh
90.60
9.40
87.86 12.14
Gujarat
2.28
7.72
86.44 13.56
Haryana
92.69
7.31
86.11 13.8
Himachal Pradesh
8 .8
10.11
87.88 12.12
Jammu & Kashmir
91.91
8.0
87.58 12.42
Jharkhand
83. 8 16.02
84.84 15.16
Karnataka
92.27
7.73
83.12 16.88
Kerala
3.28
6.72
87.70 12.30
Madhya Pradesh
90.90
9.10
84.18 15.82
Maharashtra
77.19 22.81
84.63 15.37
Orissa
93.36
6.64
8 .77 10.23
Punjab
88.24 11.76
88. 0
11.10
Rajasthan
76.09 23.91
82.17 17.83
Tamil Nadu
91.56
8.44
86.58 13.42
Uttar Pradesh
86.23 13.77
81.27 18.73
Uttarakhand
88.24 11.76
85.18 14.82
West Bengal
4.08
5.92
85.74 14.26
Delhi
75.58 24.42
66.97 33.03
Note: HS Higher Secondary
NSS 61st Round
Female Head
Up to HS Above
HS
90.29
9.71
93.37
6.63
96.46
3.54
97.09
2.91
94.39
5.61
90.49
9.51
91.50
8.50
8 .47 10.53
70.20 2 .80
0.88
9.12
93.67
6.33
92.29
7.71
76.11 23.8
84.5
15.41
96.40
3.60
92.49
7.51
81.00 19.00
90.42
.58
88. 3 11.07
86.50 13.50
8.
10.01
78.42 21.58
Male Head
Up to HS Above
HS
87.12 12.88
87.01 12.99
93.50
6.50
87.44 12.56
8 .28 10.72
86.18 13.82
85.32 14.68
8 . 4 10.06
88.41 11.59
8 .53 10.47
84.66 15.34
8 .38 10.62
87.21 12.79
84.57 15.43
91.42
8.58
88.54 11.46
86.85 13.15
86.71 13.29
87.83 12.17
87.04 12.96
8 .13 10.87
71.65 28.35
38

6.5 Page 55

▲back to top


Table A8: State-wise Distribution of FHH and MHH by MPCE Classes (NSS Rural)
India, Big States
and Delhi
INDIA
Andhra Pradesh
Assam
Bihar
Chhattisgarh
Gujarat
Haryana
Himachal Pradesh
Jammu & Kashmir
Jharkhand
Karnataka
Kerala
Madhya Pradesh
Maharashtra
Orissa
Punjab
Rajasthan
Tamil Nadu
Uttar Pradesh
Uttarakhand
West Bengal
Delhi
Lowest
25.8
23.1
12.5
51.7
40.4
19.1
7.2
3.3
5.0
34.4
29.1
6.7
47.8
22.9
55.0
0.1
16.4
22.3
27.2
14.0
22.5
0.0
Female Head
Low
22.1
22.9
27.9
27.8
34.0
13.2
14.5
10.5
7.3
27.1
26.5
9.7
22.6
21.0
18.8
8.5
24.0
26.8
22.6
14.4
25.6
0.0
Medium
20.7
22.1
35.1
12.7
18.1
21.0
12.2
21.8
24.0
23.4
19.4
19.0
15.7
23.2
13.5
26.3
23.8
23.4
21.5
28.1
21.6
0.0
High
19.1
20.8
19.6
5.7
6.1
25.9
40.9
36.0
29.5
10.4
13.9
30.5
11.1
21.5
7.2
30.1
23.0
17.5
19.4
33.3
19.3
0.0
Highest
12.4
11.0
4.8
2.0
1.3
20.9
25.2
28.5
34.2
4.7
11.0
34.1
2.7
11.5
5.6
34.9
12.8
10.1
9.3
10.2
10.9
100.0
Lowest
25.8
22.6
15.7
39.3
4 .8
15.6
5.9
5.7
1.8
40.2
26.3
5.3
41.5
25.6
55.8
4.2
12.8
23.6
26.0
12.7
1 .8
0.0
Male Head
Low Medium High
24.1 22.0
17.3
23.6 23.4
20.6
26.0 33.8
20.2
29.4 18.2
8.8
22.8 14.0
7.9
21.6 25.0
24.4
13.9 22.5
32.3
14.9 27.3
27.7
9.2 32.4
32.2
28.
16.6
8.8
31.9 21.0
12.9
10.9 17.5
29.9
23.5 17.0
10.6
23.9 21.7
17.6
21.1 11.1
7.7
14.3 24.0
31.4
23.9 28.
21.9
26.8 22.4
18.3
24.7 21.4
15.8
26.5 24.5
22.2
27.3 27.6
17.6
13.6 24.1
27.2
Highest
10.9
.8
4.2
4.3
5.5
13.5
25.5
24.3
24.4
5.5
7.9
36.4
7.3
11.2
4.3
26.1
12.5
8.
12.2
14.1
7.7
35.0
Table A9: State-wise Distribution of FHH & MHH by MPCE Classes (NSS Urban)
India, Big States
and Delhi
INDIA
Andhra Pradesh
Assam
Bihar
Chhattisgarh
Gujarat
Haryana
Himachal Pradesh
Jammu & Kashmir
Jharkhand
Karnataka
Kerala
Madhya Pradesh
Lowest
7.6
10.0
1.0
16.9
14.9
6.2
3.4
0.0
0.0
6.3
11.2
4.5
11.9
Female Head
Low
11.0
13.5
6.6
18.
15.8
4.0
2.0
0.0
0.7
4.1
13.3
5.7
22.3
Medium
15.4
13.0
7.7
16.3
18.8
12.0
14.4
2.2
6.7
15.5
15.5
17.9
18.0
High
24.5
29.4
37.1
31.5
29.1
22.3
26.3
18.1
16.5
26.9
18.8
24.0
17.4
Male Head
Highest
41.6
34.2
47.6
16.3
21.4
55.6
54.0
79.6
76.1
47.2
41.2
47.9
30.4
Lowest
4.9
4.7
2.3
12.4
12.0
1.6
3.4
0.5
0.3
7.3
5.3
2.3
10.1
Low
9.5
12.7
10.0
15.0
13.7
6.0
6.5
0.8
3.5
10.8
8.3
5.9
15.5
Medium
15.1
18.6
11.3
18.1
15.0
13.2
13.0
10.3
10.2
12.5
14.9
11.2
17.6
High
26.7
28.6
32.5
24.5
22.0
29.7
27.2
20.8
37.3
24.6
27.2
25.0
22.4
Highest
43.8
35.5
43.9
30.1
37.3
49.5
49.9
67.6
48.7
44.7
44.3
55.5
34.4
39

6.6 Page 56

▲back to top


India, Big States
and Delhi
Maharashtra
Orissa
Punjab
Rajasthan
Tamil Nadu
Uttar Pradesh
Uttarakhand
West Bengal
Delhi
Female Head
Lowest
6.2
27.8
0.4
3.2
5.7
17.3
3.5
5.8
Low
9.1
17.0
9.7
19.0
13.0
13.9
1.9
9.6
4.4
Medium
11.7
10.2
14.3
21.2
21.6
17.0
1.7
14.8
8.7
High
26.4
22.6
16.9
22.7
24.1
28.7
40.8
19.6
27.1
Male Head
Highest
46.6
22.3
58.6
33.9
35.7
23.1
52.1
50.2
5 .8
Lowest
4.0
17.1
0.5
4.9
3.6
7.4
2.1
4.0
1.1
Low
7.4
15.7
5.4
10.8
9.1
12.9
11.3
10.0
2.6
Medium
12.1
13.6
11.2
18.6
17.8
17.2
18.7
15.3
11.0
High
26.1
23.7
31.1
27.8
26.9
27.5
29.6
24.7
25.1
Highest
50.5
29.9
51.8
37.9
42.7
35.0
38.2
45.9
60.2
Table A10: Percent Distribution of Female and Male-Headed Households by Income Categories,
India, Big States and Delhi, NFHS-3
India, Big States and Delhi
INDIA
Andhra Pradesh
Assam
Bihar
Chhattisgarh
Gujarat
Haryana
Himachal Pradesh
Jammu & Kashmir
Jharkhand
Karnataka
Kerala
Madhya Pradesh
Maharashtra
Orissa
Punjab
Rajasthan
Tamil Nadu
Uttar Pradesh
Uttarakhand
West Bengal
Delhi
Sex of Household Head
Female Head
Male Head
Low
Medium
High
Low
Medium
High
43.2
28.4
28.4
27.5
33.4
39.0
44.9
33.8
21.3
23.9
38.8
37.3
45.7
27.8
26.5
34.9
37.1
28.0
62.7
26.9
10.3
45.5
31.8
22.7
59.5
25.8
14.7
32.3
41.3
26.4
19.5
31.8
48.7
11.8
31.0
57.2
6.9
28.7
64.4
8.5
31.1
60.4
21.3
26.7
52.1
12.0
30.7
57.3
54.6
28.1
17.3
47.8
29.4
22.8
12.8
33.6
53.6
9.9
36.1
54.0
43.6
27.0
29.4
23.8
34.1
42.0
8.5
22.9
68.7
5.9
23.2
70.9
34.6
25.6
3 .8
18.
28.7
52.4
53.6
21.0
25.4
38.3
33.2
28.5
64.5
20.5
15.0
47.7
29.1
23.3
6.8
22.7
70.5
7.2
23.5
69.3
45.8
30.3
23.9
28.4
33.6
38.0
45.0
32.8
22.2
26.0
34.7
39.3
23.5
27.7
48.8
17.2
30.6
52.2
46.8
31.1
22.1
29.6
38.
31.6
45.5
28.4
26.2
34.7
33.9
31.4
3.6
10.9
85.5
3.1
16.3
80.6
40

6.7 Page 57

▲back to top


Table A11: State-wise Distribution of MHH & FHH by Wealth Index, NFHS-3
India, Big States
and Delhi
INDIA
Andhra Pradesh
Assam
Bihar
Chhattisgarh
Gujarat
Haryana
Himachal Pradesh
Jammu & Kashmir
Jharkhand
Karnataka
Kerala
Madhya Pradesh
Maharashtra
Orissa
Punjab
Rajasthan
Tamil Nadu
Uttar Pradesh
Uttarakhand
West Bengal
Delhi
Poorest
25.0
18.2
22.8
36.6
54.6
10.3
1.5
5.6
54.4
2.1
18.6
1.9
15.1
44.2
48.7
1.5
32.6
19.3
8.7
33.9
27.5
0.2
Sex of the Household Head
Female Head
Poorer Middle Richer
21.7 19.8 17.5
21.7 30.0 19.6
29.5 19.4 13.8
31.7 17.0 11.2
22.1
8.7
9.0
14.4 21.0 25.2
8.1 22.3 32.3
16.3 23.3 25.2
17.0 10.1
8.4
13.8 21.2 28.4
26.1 22.2 19.2
5.8 12.2 34.2
18.8 17.8 21.0
18.1 12.0 11.6
19.5 14.9
9.9
6.1 14.1 32.1
20.5 21.8 11.6
19.0 30.8 19.9
17.1 21.1 22.4
26.5 16.8 12.4
24.2 17.8 17.1
2.2
7.5 14.3
Richest
16.0
10.5
14.5
3.6
5.6
29.1
35.8
29.7
10.2
34.5
13.9
45.9
27.3
14.2
7.0
46.2
13.5
11.1
30.7
10.4
13.4
75.9
Poorest
19.9
11.0
19.9
29.2
41.5
6.8
1.4
3.7
51.7
3.1
10.0
1.1
11.1
37.9
41.5
1.4
24.3
10.4
6.8
26.8
25.0
0.2
Poorer
19.5
17.5
30.2
28.8
26.8
14.6
9.2
12.8
14.9
12.6
21.8
4.3
15.2
24.1
19.7
7.0
17.1
15.7
15.6
24.8
23.4
3.1
Male Head
Middle
19.9
28.6
22.0
17.8
13.7
18.6
23.6
25.2
10.1
28.7
23.7
12.6
17.5
12.8
17.1
16.9
21.2
28.6
21.4
18.5
18.
10.0
Richer
20.0
25.5
15.5
13.6
8.1
27.5
30.7
28.1
11.5
28.5
22.6
37.5
23.4
11.9
12.3
2 .8
17.4
24.2
23.3
16.0
17.7
20.4
Richest
20.8
17.3
12.4
10.5
9.9
32.5
35.0
30.2
11.8
27.1
21.9
44.6
32.7
13.3
9.5
44.9
20.1
21.1
32.9
13.9
15.0
66.3
Table A12: Percent Distribution of FHH and MHH by Availability of Electricity, Toilet Facility and
Safe Drinking Water on the Premises, India, Big States and Delhi, NFHS-3
India, Big States
and Delhi
INDIA
Andhra Pradesh
Assam
Bihar
Quality
of Water
SDW
USDW
SDW
USDW
SDW
USDW
SDW
USDW
Sex of the Household Head
Female Head
Male Head
Electricity
Not Available
Available
Toilet Facility
Toilet Facility
Not Available Not Available
Available
Available
5.60
1.22
13.81
24.28
26.93
4.27
12.78
11.11
10.01
0.86
27.64
31.70
8.1
0.36
15.87
5.37
0.53
5.91
0.53
8.87
23.88
31.34
1.32
27.62
1.60
0.11
0.53
1.40
69.01
7.77
.88
9.70
Electricity
Not Available
Available
Toilet Facility
Toilet Facility
Not Available Not Available
Available
Available
3.49
0.95
13.10 27.56
22.58
4.07
15.50 12.75
4.62
0.53
29.69 36.26
4.84
0.20
17.68
6.17
1.62
4.07
0.30
.08
20.28
36.00
0.96 27.69
1.53
0.24
0.61
2.63
61.09
7.36
.18 17.36
41

6.8 Page 58

▲back to top


India, Big States
and Delhi
Quality
of Water
Chhattisgarh
SDW
USDW
Gujarat
SDW
USDW
Haryana
SDW
USDW
Himachal Pradesh
SDW
USDW
Jammu and
Kashmir
SDW
USDW
Jharkhand
SDW
USDW
Karnataka
SDW
USDW
Kerala
SDW
USDW
Madhya Pradesh
SDW
USDW
Maharashtra
SDW
USDW
Orissa
SDW
USDW
Punjab
SDW
USDW
Rajasthan
SDW
USDW
Tamil Nadu
SDW
USDW
Uttar Pradesh
SDW
USDW
Uttarakhand
SDW
USDW
West Bengal
SDW
USDW
Delhi
SDW
USDW
Sex of the Household Head
Female Head
Male Head
Electricity
Not Available
Available
Toilet Facility
Toilet Facility
Not Available Not Available
Available
Available
1.95
0.38
7.03
8.41
33.56
0.33
43.32
5.02
6.62
0.74
19.14
49.56
5.88
0.00
13.61
4.45
5.63
1.55
24.94
36.22
2.96
0.00
16.51
12.18
0.76
0.40
35.49
37.90
0.00
0.00
16.68
8.78
2.68
0.00
12.17
34.83
1.61
0.00
38.13
10.57
0.00
0.25
2.27
7.23
59.41
1.34
19.24
10.25
9.15
0.85
22.44
30.02
6.90
0.34
21.46
8.83
1.88
4.03
0.54
59.32
1.21
2.69
0.54
2 .80
3.61
0.36
10.17
18.1
25.56
0.36
32.43
9.32
11.26
1.14
25.61
46.43
5.94
0.01
7.31
2.30
2.83
0.00
3.53
6.13
55.72
3.27
19.36
9.15
0.91
0.91
12.27
39.54
0.93
0.91
15.88
28.63
11.53
0.29
17.28
17.39
28.07
0.76
21.43
3.25
14.21
1.15
43.30
29.90
1.88
0.48
4.50
4.59
1.08
0.28
0.79
6.59
55.79
5.64
14.90
14.94
12.49
1.86
16.47
39.61
7.70
1.50
10.78
9.59
2.40
3.32
2.19
20.82
29.79
13.86
8.77
18.86
0.17
0.58
4.42
84.07
0.35
0.00
2.10
8.32
Electricity
Not Available
Available
Toilet Facility
Toilet Facility
Not Available Not Available
Available
Available
1.48
0.10
6.00 10.39
25.29
0.78
47.90
8.05
4.8
0.51
20.50 48.82
4.99
0.03
14.97
5.29
3. 8
0. 8
21.69
34.11
2.77
0.62
18.87 16. 8
0.90
0.09
37.08 38.25
0.75
0.00
14.85
8.07
1.67
1.37
13.50 48.13
3.19
0.76
18.33 13.05
0.22
0.06
2.30 10.26
57.70
1.68
16.67
11.11
3.96
0.42
22.16 33.50
4.86
0.20
21.09 13.80
1.14
3.21
0.88 59.94
0.97
3.47
0.66 29.73
1.44
0.04
7.37 16.88
26.79
0.23
37.50
9.76
8.3
1.05
22.41 48.87
6.47
0.27
.08
3.45
2.09
0.20
3.10
8.05
4 .81
1.38
25.05 10.32
0.64
0.60
10.11 43.76
1.71
0.75
16.57 25.85
6.84
1.07
14.07 25.16
24.78
0.57
22.61
4.90
7.27
0.87
40.88 38.30
1.47
0.15
5.72
5.36
0.87
0.38
0.80
8. 5
48.62
6.45
15.50 18.42
.58
1.95
15.75 42.90
6.78
1.04
10.26
11.74
2.17
2.77
2.59 21.20
27.76
14.52
7.43 21.55
0.13
0.31
5.15 79.75
0.11
0.11
2.19 12.24
Note: SDW – Safe drinking water
USDW – Unsafe drinking water
42

6.9 Page 59

▲back to top


REFERENCES
IIPS and Macro International, 2007. National Family Health Survey (NFHS-3), 2005-06: India, aw data on
CD, Mumbai: IIPS.
India, Registrar General, 2001.Census of India. HH Series – Household Tables, HH-6 and HH-7, data available
on CD.
India, Registrar General, 2009.
e-mail, September 1, 2009.
note communicated to author via
Ministry of Health and Family Welfare (MoHFW), 2000. National Population Policy 2000, New Delhi:
Ministry of Health and Family Welfare.
National Sample Survey Organization (NSSO), 2006. NSS 61st Round, Raw data for 61st Round available
on CD, National Sample Survey Organisation, Department of Statistics and Plan Implementation, Cabinet
Secretariat, New Delhi.
Premi, Mahendra K., 2006. Population of India in the New Millennium: Census 2001, New Delhi: National
Book Trust.
Premi, Mahendra K., 2009. India’s Changing Population Profile, New Delhi: National ook Trust.
UNDP, 2000. Millennium Development Goals, United Nations Development Programme. http//www.undp.
org/mdg/basics.shtm.
43

6.10 Page 60

▲back to top


7 Pages 61-70

▲back to top


7.1 Page 61

▲back to top


7.2 Page 62

▲back to top


POPULATION FOUNDATION OF INDIA
B-28, Qutab Institutional Area, New Delhi-110 016
Tel.: 011-43894100, Fax: 011-43894199
Website: www.populationfoundation.in