Population%2C Health %26 Social Development in Gujarat Maharashtra and Rajasthan District Profile PFI

Population%2C Health %26 Social Development in Gujarat Maharashtra and Rajasthan District Profile PFI


1 Pages 1-10

▲back to top


1.1 Page 1

▲back to top


Population,
Health &
SOCIAL
DEVELOPMENT
in Gujarat, Maharashtra
and Rajasthan
POPULATION FOUNDATION OF INDIA
NEW DELHI

1.2 Page 2

▲back to top


Population,
Health & Social Development
in Gujarat, Maharashtra and Rajasthan
POPULATION FOUNDATION OF INDIA
NEW DELHI

1.3 Page 3

▲back to top


© Population Foundation of India
Maps: Maps of India
May, 2010
Overall Guidance:
A. R. Nanda
Arundhati Mishra
Contributors:
Almas Ali
Lalitendu Jagatdeb
Nihar Ranjan Mishra
Lopamudra Paul
Chandni Malik
Shailendra Singh Negi
Designed and Produced By FACET DESIGN
D-9, Defence Colony, New Delhi-24
Tel. 011-24616720

1.4 Page 4

▲back to top


Foreword
Population Foundation of India(PFI),established in the year 1970,has now entered in to the 40th year of its
existence. Since its inception ,PFI has dedicated itself to the cause of human welfare through Family Planning,
Reproductive and Child Health(RCH) services and other population programmes within a wider canvas of
population stabilization and sustainable development.
PFI’s efforts in the 40th year, is to undertake intensive advocacy efforts to promote rights-based and
gender-sensitive strategies to achieve population stabilization. A series of events and activities including
three Regional Conferences followed by a National Conference have been planned to commemorate the 40th
year. The aim of Regional Conferences is to bring out region specific priorities and issues and recommend
strategies which will be disseminated in the National Conference. The first Regional Conference on “Health,
Population, and Social Development Issues of Eastern States--Bihar, Jharkhand, Orissa and
West Bengal” has been organized in Bhubaneswar in February,2010.
The second Regional(Western) Conference on “Health, Population, and Social Development Issues
of Western States--Gujarat, Maharashtra and Rajasthan” is being held in Pune, with the objectives
of getting a clear perspective on the demographic transition process in Gujarat, Maharashtra and Rajasthan,
to draw attention to the reproductive health issues, effective strategies to address them and to recapitulate
initiatives by the State Governments and civil society on population and health issues. With these objectives
in view , the document “Population, Health and Social Development in Gujarat, Maharashtra and
Rajasthan”, has been prepared. The document contains state and district profiles with data on population,
health and selected social development issues of the three states.
This publication is an endeavour to present information to policy makers, planners, programme managers,
NGOs, academicians and researchers. We hope this publication will be useful in meeting this intended
purpose.
May, 2010
New Delhi
A R Nanda
Executive Director
Population Foundation of India
| iii

1.5 Page 5

▲back to top


CONTENTS
Gujarat
State at a glance
Districts at a glance
Maharashtra
State at a glance
Districts at a glance
Rajasthan
State at a glance
Districts at a glance
REFERENCES
GLOSSARY
....... 001
........ 001
........ 005
....... 057
........ 057
........ 061
....... 133
........ 133
........ 137
....... 202
....... 203
|v

1.6 Page 6

▲back to top


Abbreviation
ANC
ART
CBR
CDR
CHC
CSR
HDI
ICTC
IFA
IMR
MMR
PHC
PPTCTC
RGI
SC
SDI
STD
TFR
Ante Natal Care
Anti Retroviral Therapy
Crude Birth Rate
Crude Death Rate
Community Health Centre
Child Sex Ratio
Human Development Index
Integrated Counselling and Testing Centre
Iron and Folic Acid
Infant Mortality Rate
Maternal Mortality Ratio
Primary Health Centre
Prevention of Parent to Child Transmission Centre
Registrar General, India
Sub Centre
Social Development Index
Sexually Transmitted Diseases
Total Fertility Rate
| vii

1.7 Page 7

▲back to top


GUJARAT
at a glance

1.8 Page 8

▲back to top


Population Foundation of India
GUJARAT
Showing
Districts
2|

1.9 Page 9

▲back to top


Population, Health & Social Development in gujarat, maharashtra and Rajasthan
STATE PROFILE
GUJARAT
Key Demographic, Health and RCH Indicators at a glance
General information
Area (sq. kms.)
No. of Districts
No. of CD Blocks
No. of Villages
No. of Towns
Demographic particulars (Census, 2001)
Population
Persons
Males
Females
Rural (%)
Urban (%)
Scheduled Castes (%)
Scheduled Tribes (%)
Elderly population (60+ years) (%)
Young people (10-24 years) (%)
Adolescents (10-19 years)(%)
Decadal Growth Rate, 1991-2001 (%)
Population density (per sq. km)
Sex Ratio (females per 1000 males)
Child Sex Ratio (0-6 years) (girls per 1000 boys)
Literacy rate (7+)
Persons
Males
Females
Work participation rate
Female work participation rate
Proportion of people living below poverty line, 2004-05
Per capita net state domestic product at current prices in rupees, 2007-08
Human Development Index (HDI), 2001 (among 28 states)
Value
Rank
Social Development Index (SDI), 2001 (among 20major states)
Rural
Value
Rank
Urban
Value
Rank
Household amenities (%), Census 2001
Households with kutchha houses
Households with safe drinking water
Households with electricity connection
Vital indices
Crude Birth Rate (CBR), 2008, SRS
Total Fertility Rate (TFR), 2007, SRS
196024
25
226
18539
242
50671017
26385577
24285440
62.6
37.4
7.1
14.8
6.9
31.0
21.4
22.7
258
920
883
69.1
79.7
57.8
41.9
27.9
12.5
NA
0.678
7
39.68
11
51.56
8
5.5
84.1
80.4
22.6
2.6
|3

1.10 Page 10

▲back to top


Population Foundation of India
Age Specific Fertility Rates, 2007, SRS
15-19 years
20-24 years
25-29 years
30-34 years
35-39 years
40-44 years
45-49 years
General Fertility Rate, 2007,SRS
Gross Reproduction Rate, 2007, SRS
Life Expectancy at Birth, 2000-2004, SRS
Crude Death Rate (CDR), 2008, SRS
Maternal Mortality Ratio (MMR), 2004-06, RGI
Child Mortality Rate(CMR), 2007, SRS
Infant Mortality Rate (IMR), 2008, SRS
Neo-natal mortality rate, 2007, SRS
Early neo-natal mortality rate, 2007, SRS
Late neo-natal mortality rate, 2007, SRS
Post neo-natal mortality rate, 2007, SRS
Peri-natal mortality rate, 2007, SRS
Still birth rate, 2007, SRS
Key RCH and nutrition indicators (%)
Girls marrying below 18 years, DLHS, 2007-08
Women(20-24) reporting birth of order 2 & above, DLHS, 2007-08
Current use of any FP method, DLHS, 2007-08
Total unmet need, DLHS, 2007-08
Mothers who received any antenatal check-up, DLHS, 2007-08
Mothers who had three or more ANC, DLHS, 2007-08
Mothers who consumed 100 IFA tablets, DLHS, 2007-08
Safe delivery, DLHS, 2007-08
Institutional delivery, DLHS, 2007-08
Children with full immunization (12-23 months), DLHS, 2007-08
Children under 3 years who are underweight, NFHS-3, 2005-06
Children under 3 years who are stunted, NFHS-3, 2005-06
Children under 3 years who are wasted, NFHS-3, 2005-06
Children age 6-35 months who are anaemic, NFHS-3, 2005-06
Ever married women age 15-49 years who are anaemic, NFHS-3, 2005-06
Medical/Health Infrastructures/Institutions
Community Health Centres (CHCs)
Primary Health Centres (PHCs)
Sub Centres (SCs)
Information on HIV/AIDS (%)
Women who have heard of HIV/AIDS, NFHS-3, 2005-06
Men who have heard of HIV/AIDS, NFHS-3, 2005-06
Women who know that consistent condom use can reduce the chances of getting HIV/AIDS, NFHS-3,
2005-06
Men who know that consistent condom use can reduce the chances of getting HIV/AIDS, NFHS-3,
2005-06
HIV+ among ANC clinics (%)
HIV+ among STD clinics (%)
Number of Integrated Counseling and Testing Centres (ICTC formerly VCTC)
Number of Prevention of Parent To Child Transmission Centres (PPTCTC)
Number of Anti Retroviral Therapy (ART) Centres
34.6
223.1
169.2
61.4
24.8
7.6
3.5
88.0
1.2
63.7
6.9
160
15
50
37
29
8
15
36
7
18.9
40.6
61.6
16.5
71.5
56.8
50.7
62.1
56.5
54.9
44.6
51.7
18.7
69.7
55.3
273
1073
7274
52.9
82.2
37.2
72.4
0.55
4.92
211
132
9
4|

2 Pages 11-20

▲back to top


2.1 Page 11

▲back to top


districts
at a glance

2.2 Page 12

▲back to top


Population Foundation of India
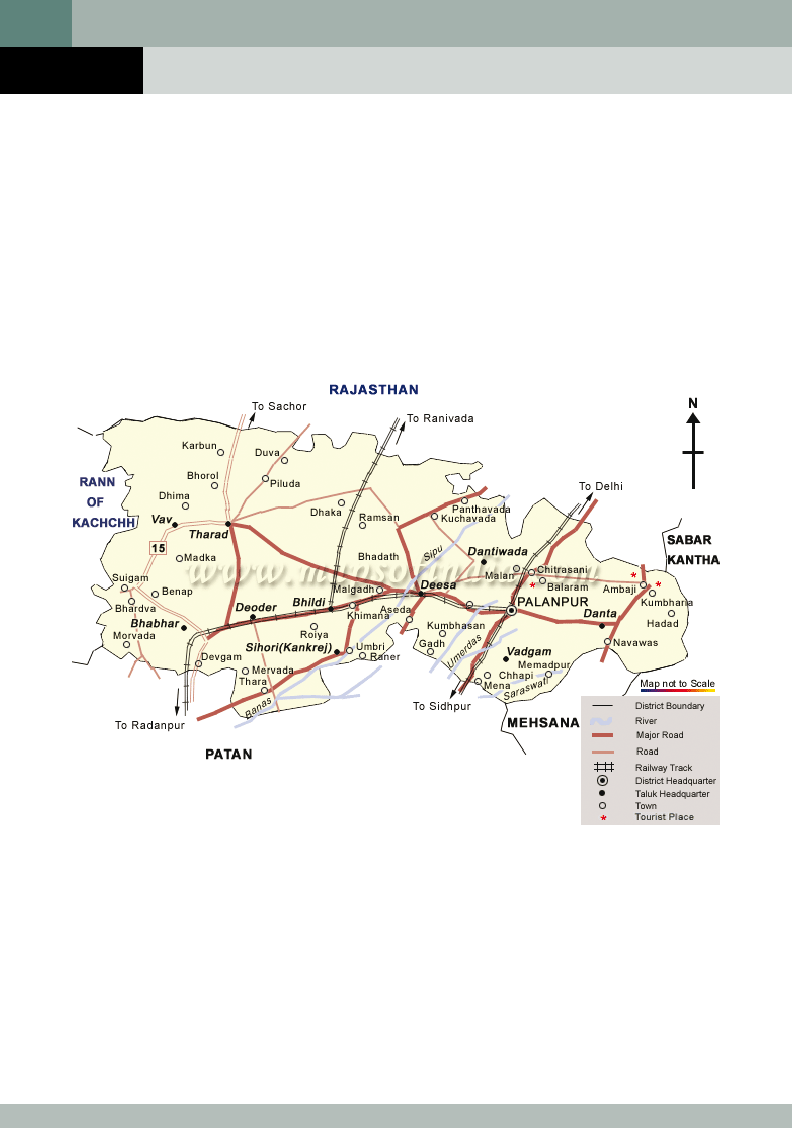
d i str i c t
KACHCHH
Showing CD Blocks
6|

2.3 Page 13

▲back to top


Population, Health & Social Development in gujarat, maharashtra and Rajasthan
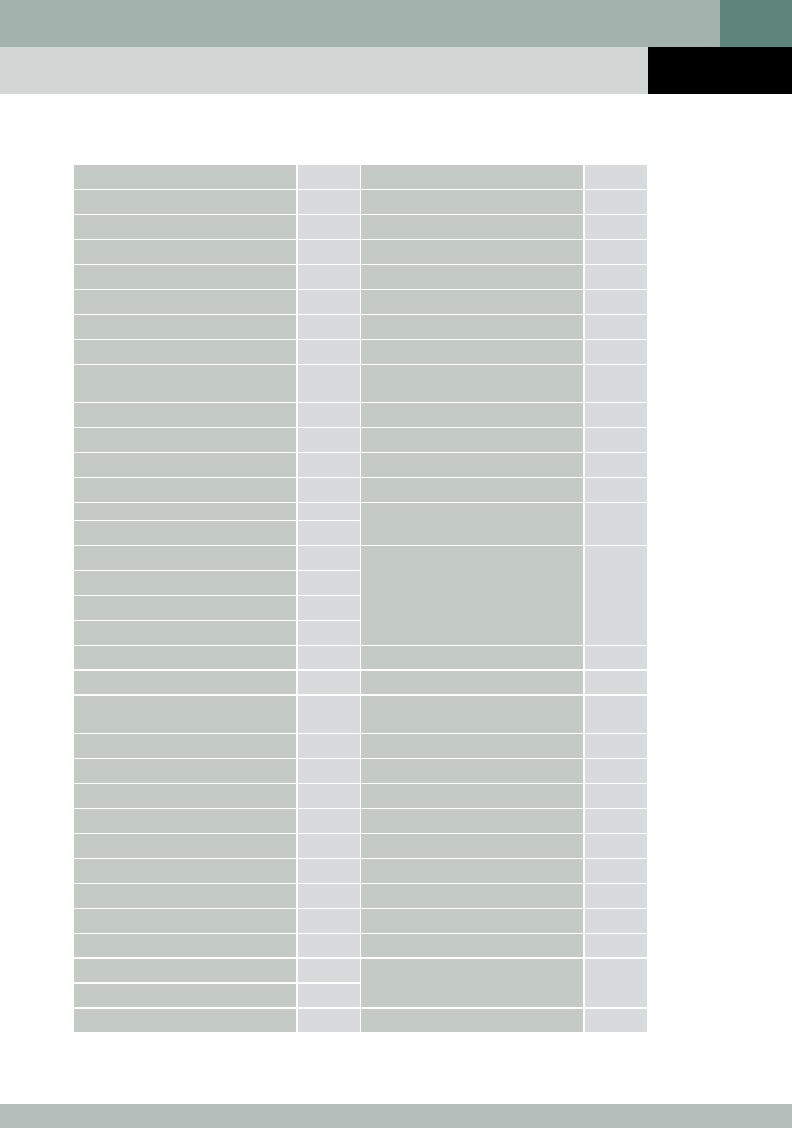
DISTRICT KACHCHH
General information
Area (Sq. Kms.)
Percent to total state’s area
C D Blocks
Towns
No. of Villages
Demographic particulars (Census, 2001)
Population
Persons
Males
Females
Rural (%)
Urban (%)
Scheduled Castes (%)
Scheduled Tribes (%)
Elderly population (60+ years) (%)
Young people (10-24 years) (%)
Adolescent (10-19 years) (%)
Decadal Growth Rate, 1991-2001 (%)
Population density (per sq. km)
Sex Ratio (females per 1000 males)
1991
2001
Child Sex Ratio (0-6 years) (girls per 1000 boys)
1991
2001
Literacy rate
Persons
Males
Females
Total work participation rate
Female work participation rate
Household amenities, (%), Census 2001
45652
Households with kutchha houses
23.3
Households with safe drinking water
10
Households with electricity connection
9 Vital rates
886
Crude Birth Rate, 2001
Total Fertility Rate, 2001
Infant Mortality Rate, 2001
Key RCH indicators from District Level
Household Survey, 2007-08 (%)
1583225
Girls marrying below 18 years
815152
Birth order 3 and above
768073
Current use of any FP Method
70.0
Total unmet need
30.0 Pregnant women who had at least with 3 ANCs
11.74
visits during the last pregnancy
8.22
7.1
32.01
Institutional delivery
22.8
20.90
Children with full immunization
33
Medical/Health Infrastructures/
Institutions
964
942
CHCs
PHCs
929
Sub-Centres
921
Information on HIV/AIDS
59.79
70.39
HIV+ among ANC clinics (%)
48.59
HIV+ among STD clinics (%)
38.3 Number of Integrated Counseling and Testing
21.9
Centres (ICTC formerly VCTC)
Number of Anti Retroviral Therapy (ART) Centres
7.5
82.5
80.36
0.0
0.0
57
16.2
44.7
55.1
24.8
44.5
57.1
49.4
12
37
251
0.50
8
-
|7

2.4 Page 14

▲back to top


Population Foundation of India
d i str i c t
BANAS KANTHA
Showing CD Blocks
8|

2.5 Page 15

▲back to top


Population, Health & Social Development in gujarat, maharashtra and Rajasthan
DISTRICT BANAS KANTHA
General information
Area (Sq. Kms.)
Percent to total state’s area
C D Blocks
Towns
No. of Villages
Demographic particulars (Census, 2001)
Population
Persons
Males
Females
Rural (%)
Urban (%)
Scheduled Castes (%)
Scheduled Tribes (%)
Elderly population (60+ years) (%)
Young people (10-24 years) (%)
Adolescent (10-19 years) (%)
Decadal Growth Rate, 1991-2001 (%)
Population density (per sq. km)
Sex Ratio (females per 1000 males)
1991
2001
Child Sex Ratio (0-6 years) (girls per 1000 boys)
1991
2001
Literacy rate
Persons
Males
Females
Total work participation rate
Female work participation rate
Household amenities, (%), Census 2001
10757
Households with kutchha houses
5.5
Households with safe drinking water
12
Households with electricity connection
7 Vital rates
1244
Crude Birth Rate, 2001
Total Fertility Rate, 2001
Infant Mortality Rate, 2001
Key RCH indicators from District Level
Household Survey, 2007-08 (%)
2504244
Girls marrying below 18 years
1297404
Birth order 3 and above
1206840
Current use of any FP Method
89.0
11.0
10.84
Total unmet need
Pregnant women who had at least with 3 ANCs
visits during the last pregnancy
8.22
5.7
Institutional delivery
31.7
22.8
26.31
Children with full immunization
233
Medical/Health Infrastructures/
Institutions
934
930
CHCs
PHCs
934
Sub-Centres
906
Information on HIV/AIDS
50.97
66.47
HIV+ among ANC clinics (%)
34.40
HIV+ among STD clinics (%)
43.6 Number of Integrated Counseling and Testing
35.5
Centres (ICTC formerly VCTC)
Number of Anti Retroviral Therapy (ART) Centres
11.9
84.9
61.15
31.3
3.9
64
39.6
37.8
54.6
21.5
28.5
61.8
35.1
13
64
422
1.00
-
8
-
|9

2.6 Page 16

▲back to top


Population Foundation of India
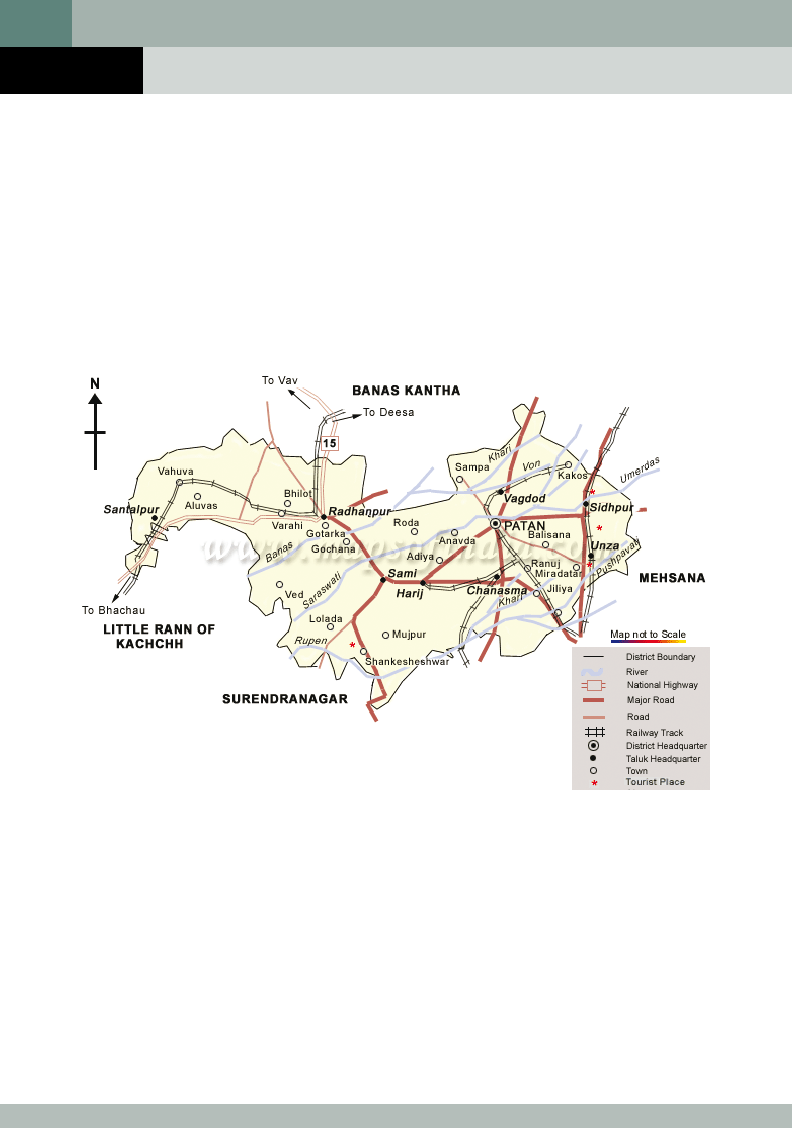
d i str i c t
PATAN
Showing
CD Blocks
10 |

2.7 Page 17

▲back to top


Population, Health & Social Development in gujarat, maharashtra and Rajasthan
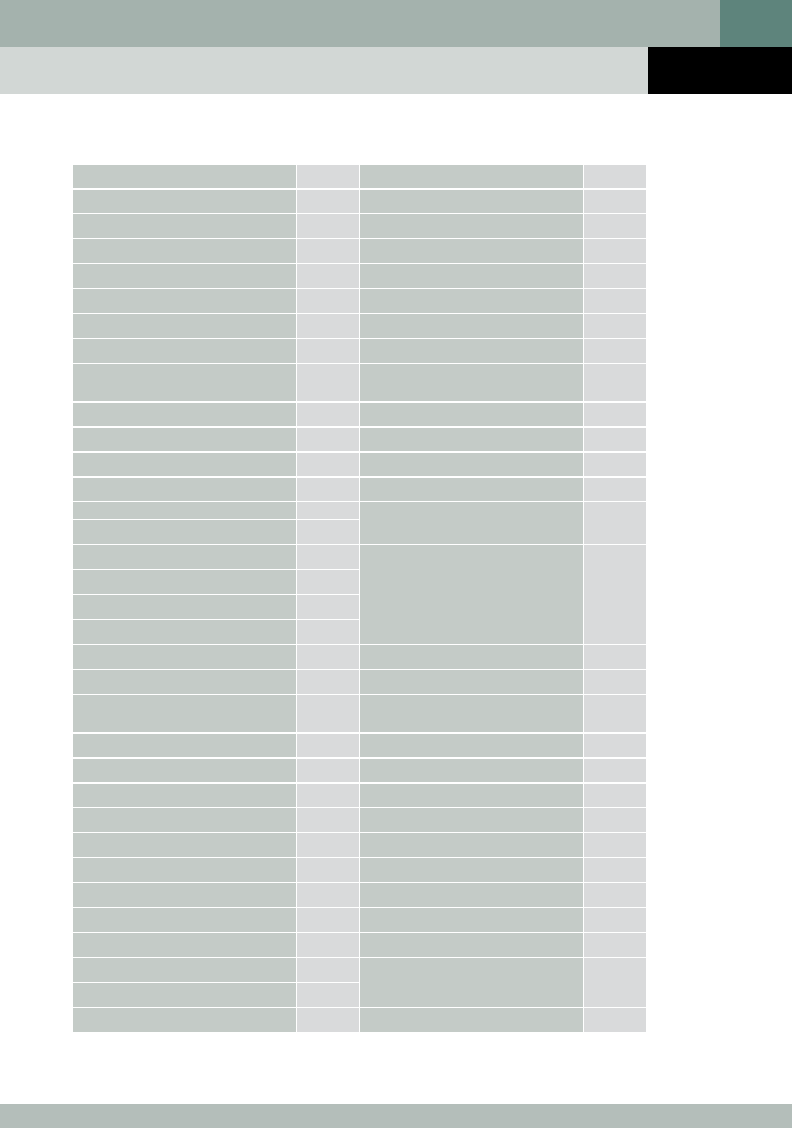
DISTRICT PATAN
General information
Area (Sq. Kms.)
Percent to total state’s area
C D Blocks
Towns
No. of Villages
Demographic particulars (Census, 2001)
Population
Persons
Males
Females
Rural (%)
Urban (%)
Scheduled Castes (%)
Scheduled Tribes (%)
Elderly population (60+ years) (%)
Young people (10-24 years) (%)
Adolescent (10-19 years) (%)
Decadal Growth Rate, 1991-2001 (%)
Population density (per sq. km)
Sex Ratio (females per 1000 males)
1991
2001
Child Sex Ratio (0-6 years) (girls per 1000 boys)
1991
2001
Literacy rate
Persons
Males
Females
Total work participation rate
Female work participation rate
Household amenities, (%), Census 2001
5730.4
Households with kutchha houses
2.9
Households with safe drinking water
8
Households with electricity connection
7 Vital rates
517
Crude Birth Rate, 2001
Total Fertility Rate, 2001
Infant Mortality Rate, 2001
Key RCH indicators from District Level
Household Survey, 2007-08 (%)
1182709
Girls marrying below 18 years
612100
Birth order 3 and above
570609
Current use of any FP Method
79.8
Total unmet need
20.2 Pregnant women who had at least with 3 ANCs
9.88
visits during the last pregnancy
1.07
7.3
Institutional delivery
31.7
22.1
14.08
Children with full immunization
206
Medical/Health Infrastructures/
Institutions
944
932
CHCs
PHCs
902
Sub-Centres
865
Information on HIV/AIDS
60.36
73.63
HIV+ among ANC clinics (%)
46.33
HIV+ among STD clinics (%)
45.1 Number of Integrated Counseling and Testing
36.3
Centres (ICTC formerly VCTC)
Number of Anti Retroviral Therapy (ART) Centres
7.0
89.3
68.48
26.1
3.1
81
33.3
39.6
67.1
14.6
56.4
61.8
69.2
7
29
210
0.50
-
9
-
| 11

2.8 Page 18

▲back to top


Population Foundation of India
d i str i c t
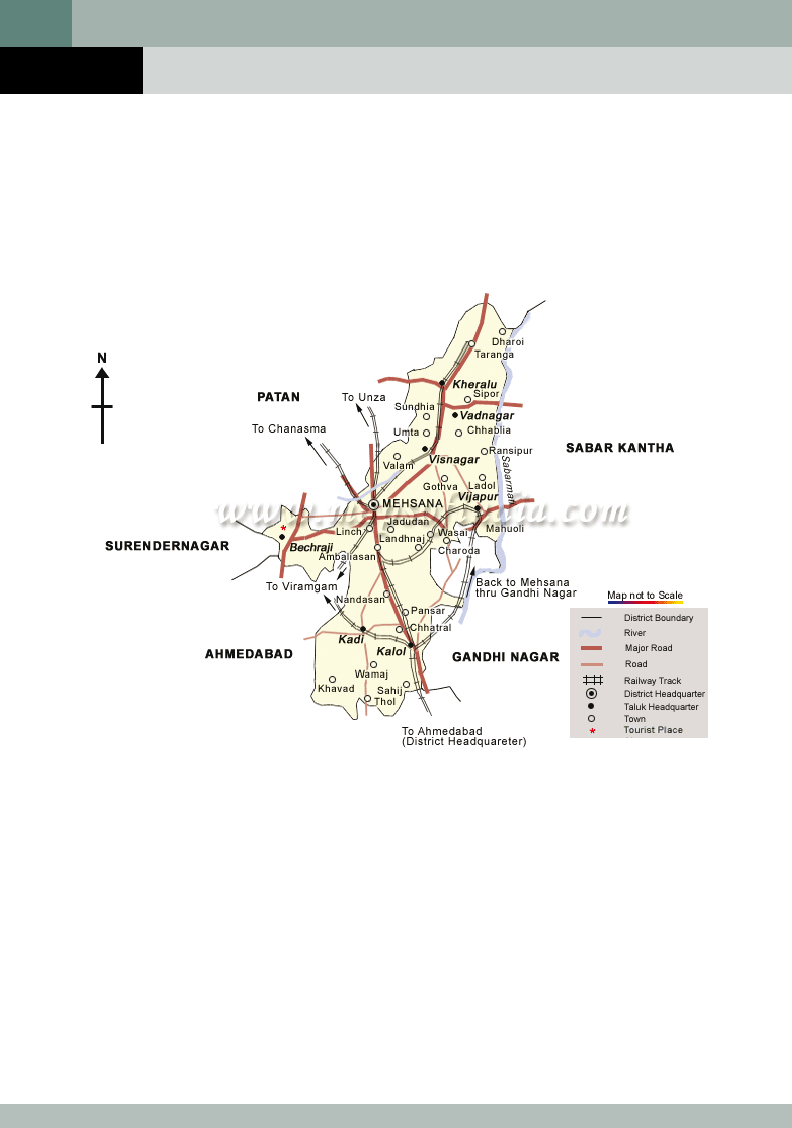
MAHESANA
Showing CD Blocks
12 |

2.9 Page 19

▲back to top


Population, Health & Social Development in gujarat, maharashtra and Rajasthan
DISTRICT MAHESANA
General information
Area (Sq. Kms.)
Percent to total state’s area
C D Blocks
Towns
No. of Villages
Demographic particulars (Census, 2001)
Population
Persons
Males
Females
Rural (%)
Urban (%)
Scheduled Castes (%)
Scheduled Tribes (%)
Elderly population (60+ years) (%)
Young people (10-24 years) (%)
Adolescent (10-19 years) (%)
Decadal Growth Rate, 1991-2001 (%)
Population density (per sq. km)
Sex Ratio (females per 1000 males)
1991
2001
Child Sex Ratio (0-6 years) (girls per 1000 boys)
1991
2001
Literacy rate
Persons
Males
Females
Total work participation rate
Female work participation rate
Household amenities, (%), Census 2001
4382.8
Households with kutchha houses
2.2
Households with safe drinking water
9
Households with electricity connection
12 Vital rates
593
Crude Birth Rate, 2001
Total Fertility Rate, 2001
Infant Mortality Rate, 2001
Key RCH indicators from District Level
Household Survey, 2007-08 (%)
1837892
Girls marrying below 18 years
953842
Birth order 3 and above
884050
Current use of any FP Method
77.6
Total unmet need
22.4 Pregnant women who had at least with 3 ANCs
8.09
visits during the last pregnancy
0.49
7.8
Institutional delivery
31.5
21.7
12.04
Children with full immunization
419
Medical/Health Infrastructures/
Institutions
951
927
CHCs
PHCs
894
Sub-Centres
800
Information on HIV/AIDS
75.22
86.20
HIV+ among ANC clinics (%)
63.65
HIV+ among STD clinics (%)
45.1 Number of Integrated Counseling and Testing
35.8
Centres (ICTC formerly VCTC)
Number of Anti Retroviral Therapy (ART) Centres
4.3
94.2
82.87
22.4
2.5
58
19.4
30.3
64.0
16.8
59.2
84.2
72.7
13
48
288
1.00
-
8
1
| 13

2.10 Page 20

▲back to top


Population Foundation of India
d i str i c t
SABAR KANTHA
Showing CD Blocks
14 |

3 Pages 21-30

▲back to top


3.1 Page 21

▲back to top


3.2 Page 22

▲back to top


Population Foundation of India
d i str i c t
GANDHINAGAR
Showing CD Blocks
16 |

3.3 Page 23

▲back to top


Population, Health & Social Development in gujarat, maharashtra and Rajasthan
DISTRICT GANDHINAGAR
General information
Area (Sq. Kms.)
Percent to total state’s area
C D Blocks
Towns
No. of Villages
Demographic particulars (Census, 2001)
Population
Persons
Males
Females
Rural (%)
Urban (%)
Scheduled Castes (%)
Scheduled Tribes (%)
Elderly population (60+ years) (%)
Young people (10-24 years) (%)
Adolescent (10-19 years) (%)
Decadal Growth Rate, 1991-2001 (%)
Population density (per sq. km)
Sex Ratio (females per 1000 males)
1991
2001
Child Sex Ratio (0-6 years) (girls per 1000 boys)
1991
2001
Literacy rate
Persons
Males
Females
Total work participation rate
Female work participation rate
Household amenities, (%), Census 2001
2163.4
Households with kutchha houses
1.1
Households with safe drinking water
4
Households with electricity connection
11 Vital rates
291
Crude Birth Rate, 2001
Total Fertility Rate, 2001
Infant Mortality Rate, 2001
Key RCH indicators from District Level
Household Survey, 2007-08 (%)
1334455
Girls marrying below 18 years
697999
Birth order 3 and above
636456
Current use of any FP Method
65
Total unmet need
35 Pregnant women who had at least with 3 ANCs
8.69
visits during the last pregnancy
1.32
6.5
Institutional delivery
31.8
21.5
23.88
Children with full immunization
617
Medical/Health Infrastructures/
Institutions
934
912
CHCs
PHCs
879
Sub-Centres
813
Information on HIV/AIDS
76.59
87.74
HIV+ among ANC clinics (%)
64.58
HIV+ among STD clinics (%)
41.5 Number of Integrated Counseling and Testing
28.9
Centres (ICTC formerly VCTC)
Number of Anti Retroviral Therapy (ART) Centres
4.7
97.0
80.72
22.1
2.4
68
26.4
24.7
65.2
16.0
64.6
77.0
60.8
6
24
171
0.50
-
8
-
| 17

3.4 Page 24

▲back to top


Population Foundation of India
d i str i c t
AHMADABAD
Showing CD Blocks
18 |

3.5 Page 25

▲back to top


Population, Health & Social Development in gujarat, maharashtra and Rajasthan
DISTRICT AHMADABAD
General information
Area (Sq. Kms.)
Percent to total state’s area
C D Blocks
Towns
No. of Villages
Demographic particulars (Census, 2001)
Population
Persons
Males
Females
Rural (%)
Urban (%)
Scheduled Castes (%)
Scheduled Tribes (%)
Elderly population (60+ years) (%)
Young people (10-24 years) (%)
Adolescent (10-19 years) (%)
Decadal Growth Rate, 1991-2001 (%)
Population density (per sq. km)
Sex Ratio (females per 1000 males)
1991
2001
Child Sex Ratio (0-6 years) (girls per 1000 boys)
1991
2001
Literacy rate
Persons
Males
Females
Total work participation rate
Female work participation rate
Household amenities, (%), Census 2001
8086.8
Households with kutchha houses
4.1
Households with safe drinking water
11
Households with electricity connection
37 Vital rates
546
Crude Birth Rate, 2001
Total Fertility Rate, 2001
Infant Mortality Rate, 2001
Key RCH indicators from District Level
Household Survey, 2007-08 (%)
5816519
Girls marrying below 18 years
3074556
Birth order 3 and above
2741963
Current use of any FP Method
20
80
10.67
Total unmet need
Pregnant women who had at least with 3 ANCs
visits during the last pregnancy
1.00
6.6
Institutional delivery
31.3
21.2
26.61
Children with full immunization
718
Medical/Health Infrastructures/
Institutions
897
892
CHCs
PHCs
897
Sub-Centres
835
Information on HIV/AIDS
79.50
87.31
HIV+ among ANC clinics (%)
70.83
34.5
13.8
HIV+ among STD clinics (%)
Number of Integrated Counseling and Testing
Centres (ICTC formerly VCTC)
Number of Anti Retroviral Therapy (ART) Centres
3
94.4
91.37
20.5
2.3
47
16.1
21.9
63.2
20.5
65.7
80.3
50.2
9
43
279
0.00
18.00
6
1
| 19

3.6 Page 26

▲back to top


Population Foundation of India
d i str i c t
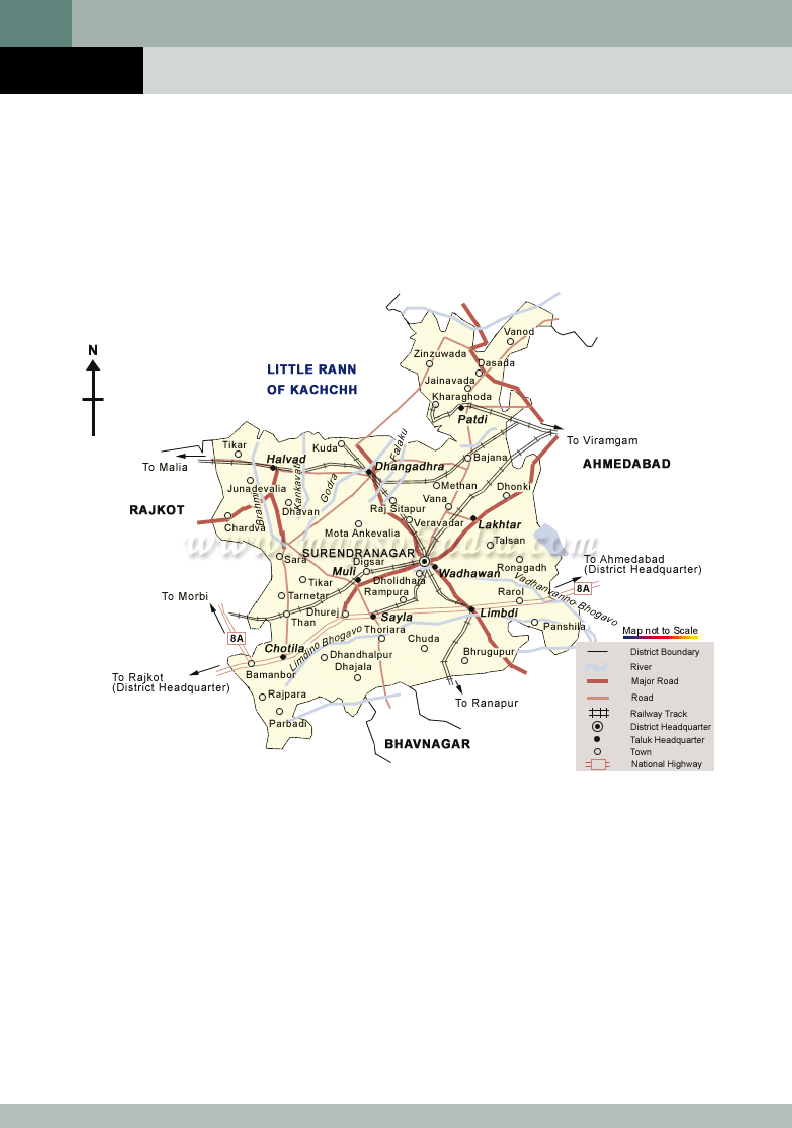
SURENDRANAGAR
Showing CD Blocks
20 |

3.7 Page 27

▲back to top


Population, Health & Social Development in gujarat, maharashtra and Rajasthan
DISTRICT SURENDRANAGAR
General information
Area (Sq. Kms.)
Percent to total state’s area
C D Blocks
Towns
No. of Villages
Demographic particulars (Census, 2001)
Population
Persons
Males
Females
Rural (%)
Urban (%)
Scheduled Castes (%)
Scheduled Tribes (%)
Elderly population (60+ years) (%)
Young people (10-24 years) (%)
Adolescent (10-19 years) (%)
Decadal Growth Rate, 1991-2001 (%)
Population density (per sq. km)
Sex Ratio (females per 1000 males)
1991
2001
Child Sex Ratio (0-6 years) (girls per 1000 boys)
1991
2001
Literacy rate
Persons
Males
Females
Total work participation rate
Female work participation rate
Household amenities, (%), Census 2001
10489.0
Households with kutchha houses
5.4
Households with safe drinking water
10
Households with electricity connection
8 Vital rates
650
Crude Birth Rate, 2001
Total Fertility Rate, 2001
Infant Mortality Rate, 2001
Key RCH indicators from District Level
Household Survey, 2007-08 (%)
1515148
Girls marrying below 18 years
787650
Birth order 3 and above
727498
Current use of any FP Method
73.4
26.6
10.97
Total unmet need
Pregnant women who had at least with 3 ANCs
visits during the last pregnancy
0.95
7.4
Institutional delivery
31.5
22.4
25.34
Children with full immunization
144
Medical/Health Infrastructures/
Institutions
921
924
CHCs
PHCs
905
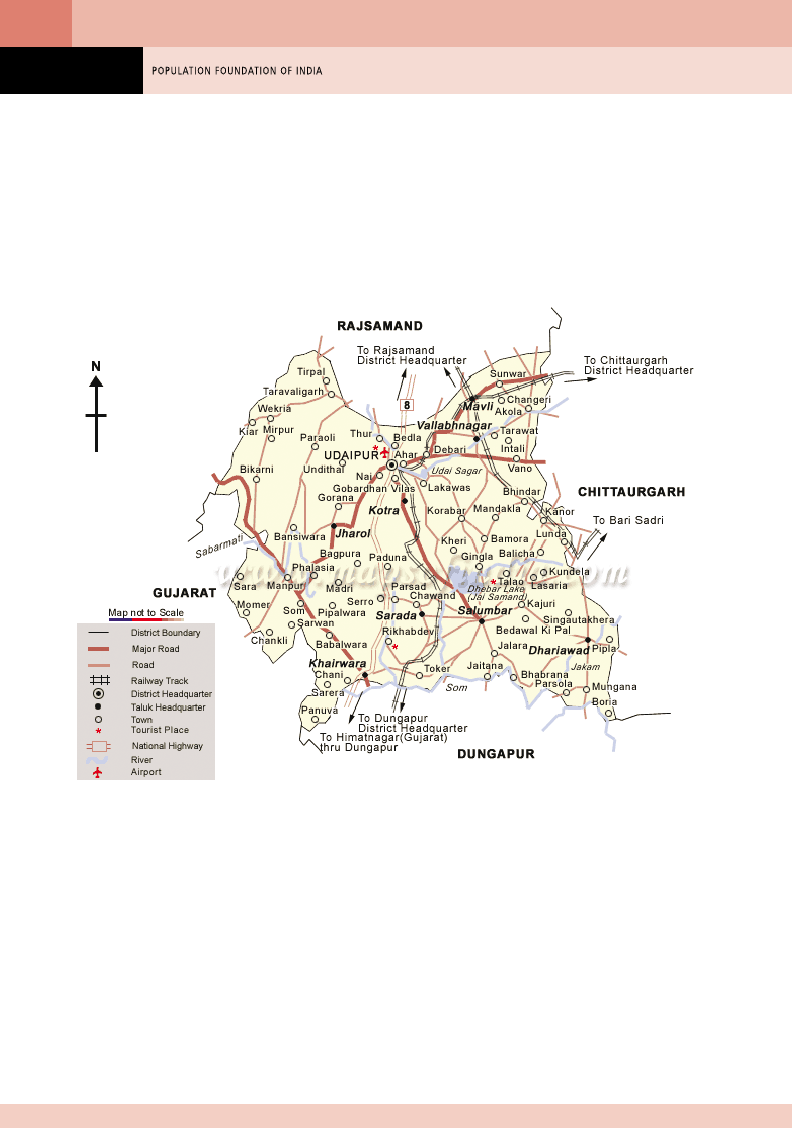
Sub-Centres
886
Information on HIV/AIDS
61.61
74.19
HIV+ among ANC clinics (%)
48.10
HIV+ among STD clinics (%)
42.7 Number of Integrated Counseling and Testing
30.5
Centres (ICTC formerly VCTC)
Number of Anti Retroviral Therapy (ART) Centres
8.7
68.4
86.51
27.6
3.4
60
17.4
36.6
62.1
20.4
40.6
49.0
48.7
10
31
200
1.75
-
14
1
| 21

3.8 Page 28

▲back to top


Population Foundation of India
d i str i c t
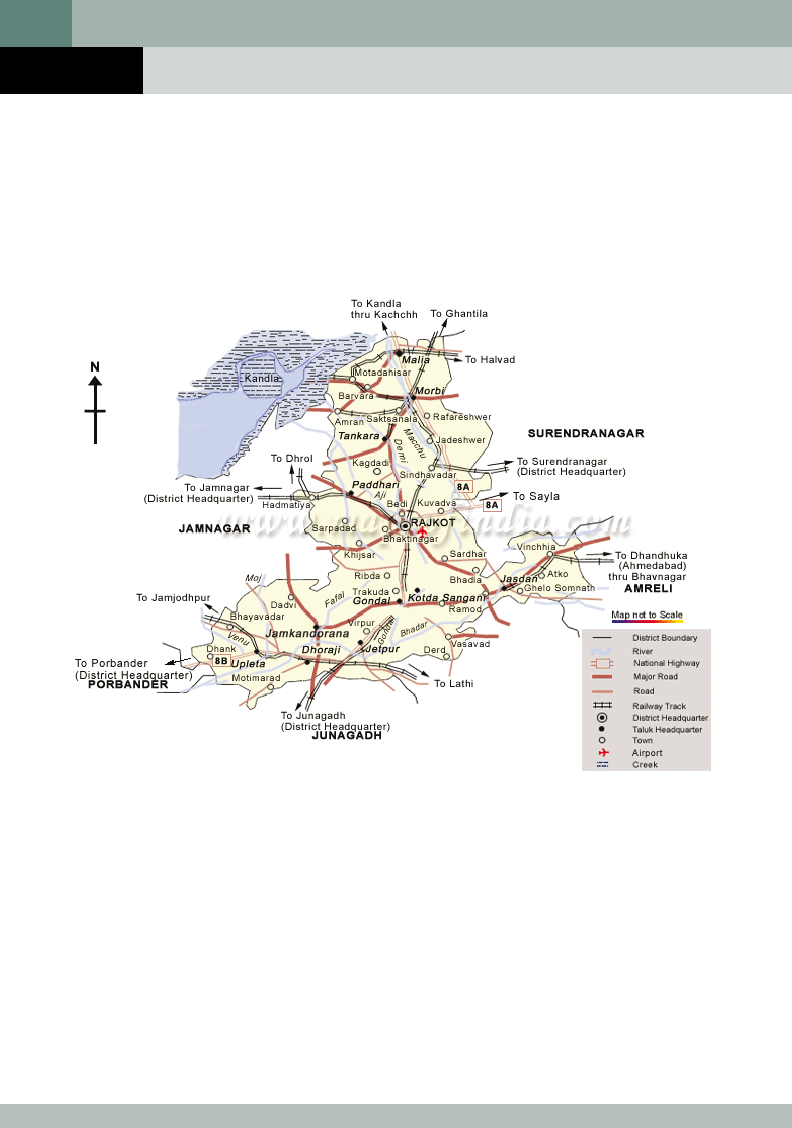
RAJKOT
Showing CD Blocks
22 |

3.9 Page 29

▲back to top


Population, Health & Social Development in gujarat, maharashtra and Rajasthan
DISTRICT RAJKOT
General information
Area (Sq. Kms.)
Percent to total state’s area
C D Blocks
Towns
No. of Villages
Demographic particulars (Census, 2001)
Population
Persons
Males
Females
Rural (%)
Urban (%)
Scheduled Castes (%)
Scheduled Tribes (%)
Elderly population (60+ years) (%)
Young people (10-24 years) (%)
Adolescent (10-19 years) (%)
Decadal Growth Rate, 1991-2001 (%)
Population density (per sq. km)
Sex Ratio (females per 1000 males)
1991
2001
Child Sex Ratio (0-6 years) (girls per 1000 boys)
1991
2001
Literacy rate
Persons
Males
Females
Total work participation rate
Female work participation rate
Household amenities, (%), Census 2001
11203.0
Households with kutchha houses
5.7
Households with safe drinking water
14
Households with electricity connection
13 Vital rates
844
Crude Birth Rate, 2001
Total Fertility Rate, 2001
Infant Mortality Rate, 2001
Key RCH indicators from District Level
Household Survey, 2007-08 (%)
3169881
Girls marrying below 18 years
1642018
Birth order 3 and above
1527863
Current use of any FP Method
48.7
Total unmet need
51.3 Pregnant women who had at least with 3 ANCs
7.71
visits during the last pregnancy
0.42
7.8
Institutional delivery
32.1
22.3
25.60
Children with full immunization
282
Medical/Health Infrastructures/
Institutions
946
930
CHCs
PHCs
916
Sub-Centres
854
Information on HIV/AIDS
74.16
82.61
HIV+ among ANC clinics (%)
65.20
HIV+ among STD clinics (%)
39.3 Number of Integrated Counseling and Testing
21.4
Centres (ICTC formerly VCTC)
Number of Anti Retroviral Therapy (ART) Centres
1.3
83.4
93.09
16.9
1.9
48
11.9
26.8
73.4
14.4
79.6
68.3
74.0
17
43
330
0.75
-
13
1
| 23

3.10 Page 30

▲back to top


Population Foundation of India
d i str i c t
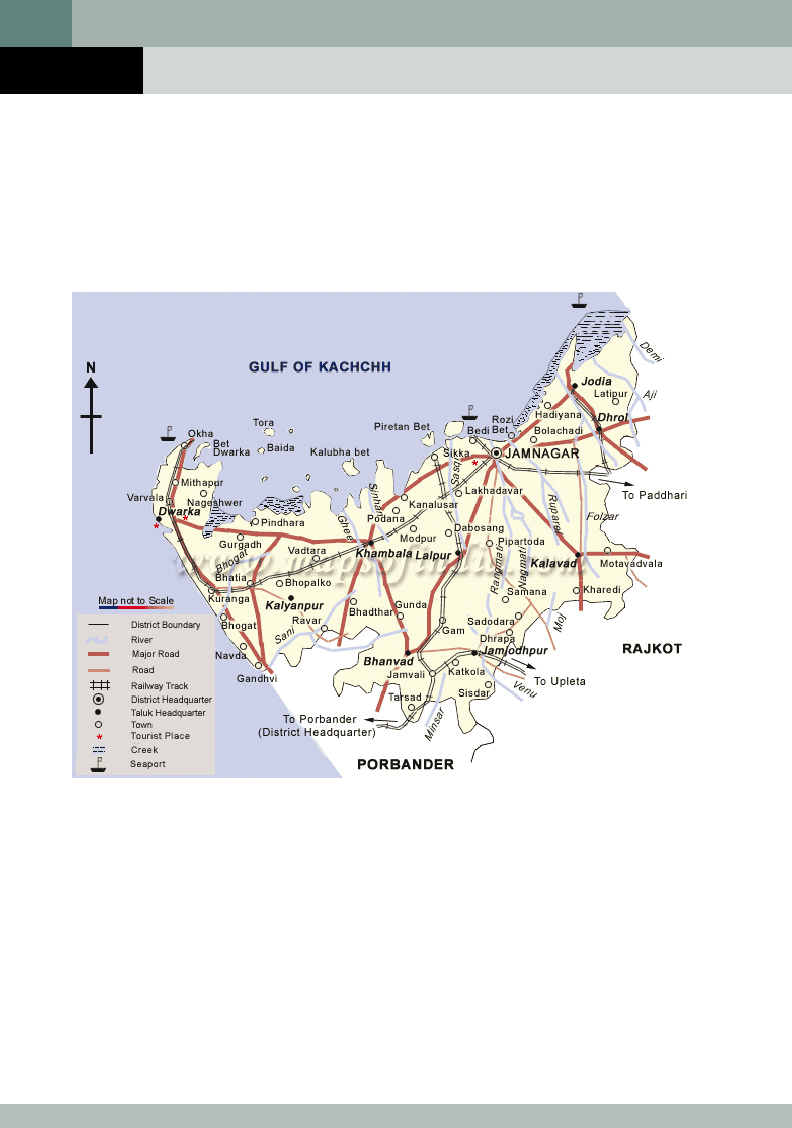
JAMNAGAR
Showing CD Blocks
24 |

4 Pages 31-40

▲back to top


4.1 Page 31

▲back to top


Population, Health & Social Development in gujarat, maharashtra and Rajasthan
DISTRICT JAMNAGAR
General information
Area (Sq. Kms.)
Percent to total state’s area
C D Blocks
Towns
No. of Villages
Demographic particulars (Census, 2001)
Population
Persons
Males
Females
Rural (%)
Urban (%)
Scheduled Castes (%)
Scheduled Tribes (%)
Elderly population (60+ years) (%)
Young people (10-24 years) (%)
Adolescent (10-19 years) (%)
Decadal Growth Rate, 1991-2001 (%)
Population density (per sq. km)
Sex Ratio (females per 1000 males)
1991
2001
Child Sex Ratio (0-6 years) (girls per 1000 boys)
1991
2001
Literacy rate
Persons
Males
Females
Total work participation rate
Female work participation rate
Household amenities, (%), Census 2001
14125.0
Households with kutchha houses
7.2
Households with safe drinking water
10
Households with electricity connection
17 Vital rates
698
Crude Birth Rate, 2001
Total Fertility Rate, 2001
Infant Mortality Rate, 2001
Key RCH indicators from District Level
Household Survey, 2007-08 (%)
1904278
Girls marrying below 18 years
981320
Birth order 3 and above
922958
Current use of any FP Method
56.1
Total unmet need
43.9 Pregnant women who had at least with 3 ANCs
8.13
visits during the last pregnancy
0.55
7.7
Institutional delivery
32.2
22.6
22.39
Children with full immunization
135
Medical/Health Infrastructures/
Institutions
949
941
CHCs
PHCs
916
Sub-Centres
898
Information on HIV/AIDS
66.48
76.25
HIV+ among ANC clinics (%)
56.18
HIV+ among STD clinics (%)
38.6 Number of Integrated Counseling and Testing
21.4
Centres (ICTC formerly VCTC)
Number of Anti Retroviral Therapy (ART) Centres
1.8
76.8
87.20
21.7
2.4
44
5.7
26.3
69.3
15.2
73.5
69.3
55.1
11
36
265
0.50
-
10
1
| 25

4.2 Page 32

▲back to top


Population Foundation of India
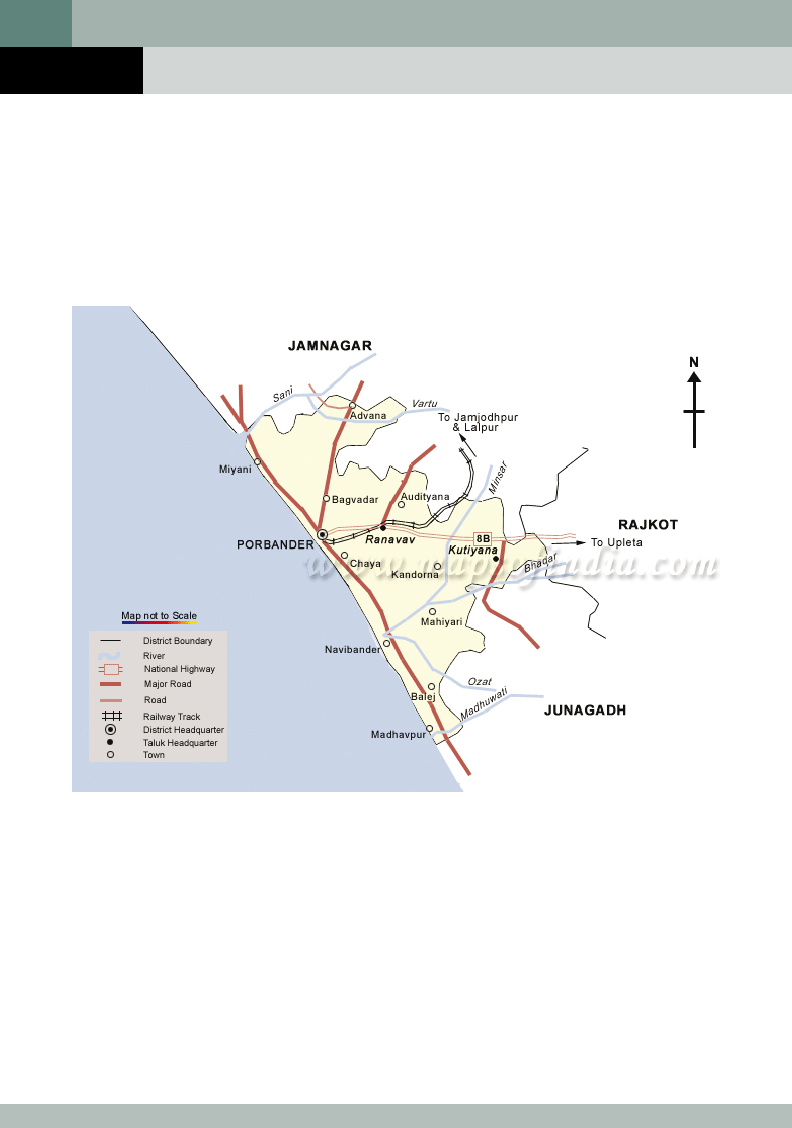
d i str i c t
PORBANDAR
Showing CD Blocks
26 |

4.3 Page 33

▲back to top


Population, Health & Social Development in gujarat, maharashtra and Rajasthan
DISTRICT PORBANDAR
General information
Household amenities, (%), Census 2001
Area (Sq. Kms.)
2297.8
Households with kutchha houses
Percent to total state’s area
1.2
Households with safe drinking water
C D Blocks
3
Households with electricity connection
Towns
7 Vital rates
No. of Villages
182
Crude Birth Rate, 2001
Total Fertility Rate, 2001
Demographic particulars (Census, 2001)
Infant Mortality Rate, 2001
Population
Key RCH indicators from District Level
Household Survey, 2007-08 (%)
Persons 536835
Girls marrying below 18 years
Males 275821
Birth order 3 and above
Females 261014
Current use of any FP Method
Rural (%)
51.3
Total unmet need
Urban (%)
Scheduled Castes (%)
48.7 Pregnant women who had at least with 3 ANCs
8.98
visits during the last pregnancy
Scheduled Tribes (%)
1.20
Elderly population (60+ years) (%)
8.0
Young people (10-24 years) (%)
30.8
Institutional delivery
Adolescent (10-19 years) (%)
21.4
Decadal Growth Rate, 1991-2001 (%)
14.35
Children with full immunization
Population density (per sq. km)
234
Sex Ratio (females per 1000 males)
Medical/Health Infrastructures/
Institutions
1991
960
2001
946
CHCs
Child Sex Ratio (0-6 years) (girls per 1000 boys)
PHCs
1991
909
Sub-Centres
2001
897
Literacy rate
Information on HIV/AIDS
Persons
68.62
Males
78.36
HIV+ among ANC clinics (%)
Females
58.42
HIV+ among STD clinics (%)
Total work participation rate
Female work participation rate
40.1 Number of Integrated Counseling and Testing
23.4
Centres (ICTC formerly VCTC)
Number of Anti Retroviral Therapy (ART) Centres
1
68.4
92.81
21.8
2.5
41
10.0
28.4
62.2
20.5
71.4
68.1
74.8
3
10
85
0.00
-
5
-
| 27

4.4 Page 34

▲back to top


Population Foundation of India
d i str i c t
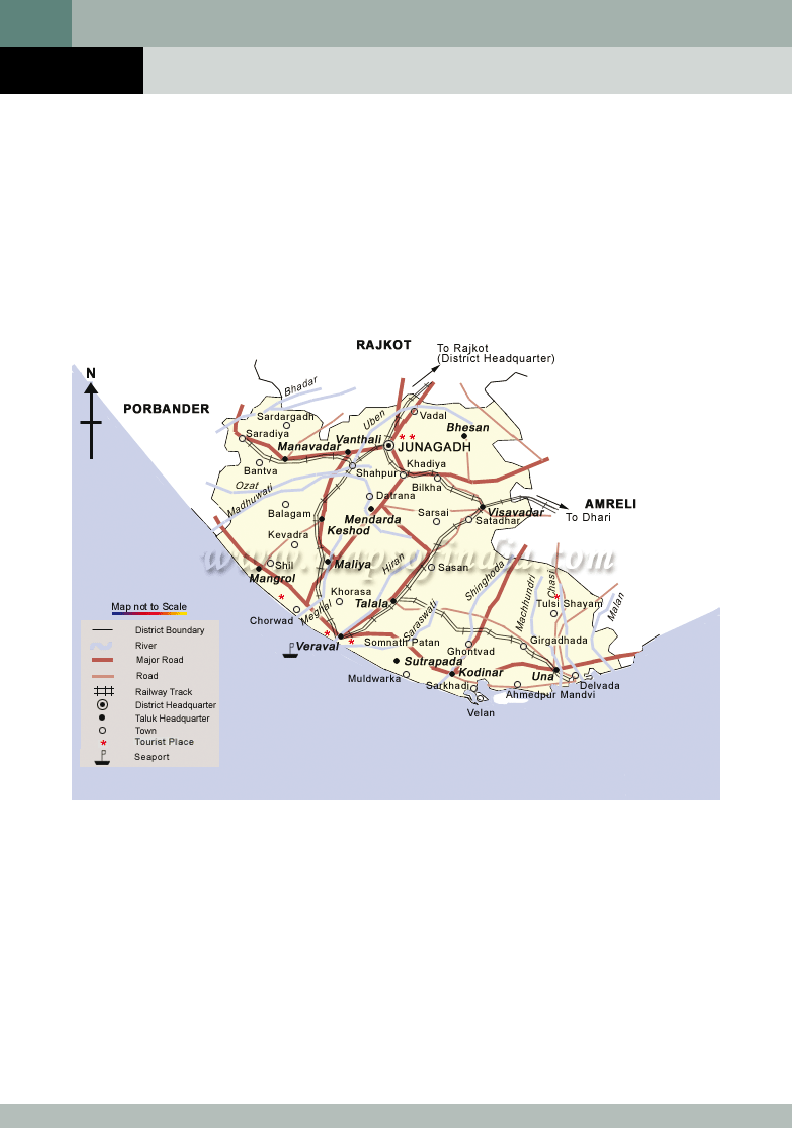
JUNAGADH
Showing CD Blocks
28 |

4.5 Page 35

▲back to top


Population, Health & Social Development in gujarat, maharashtra and Rajasthan
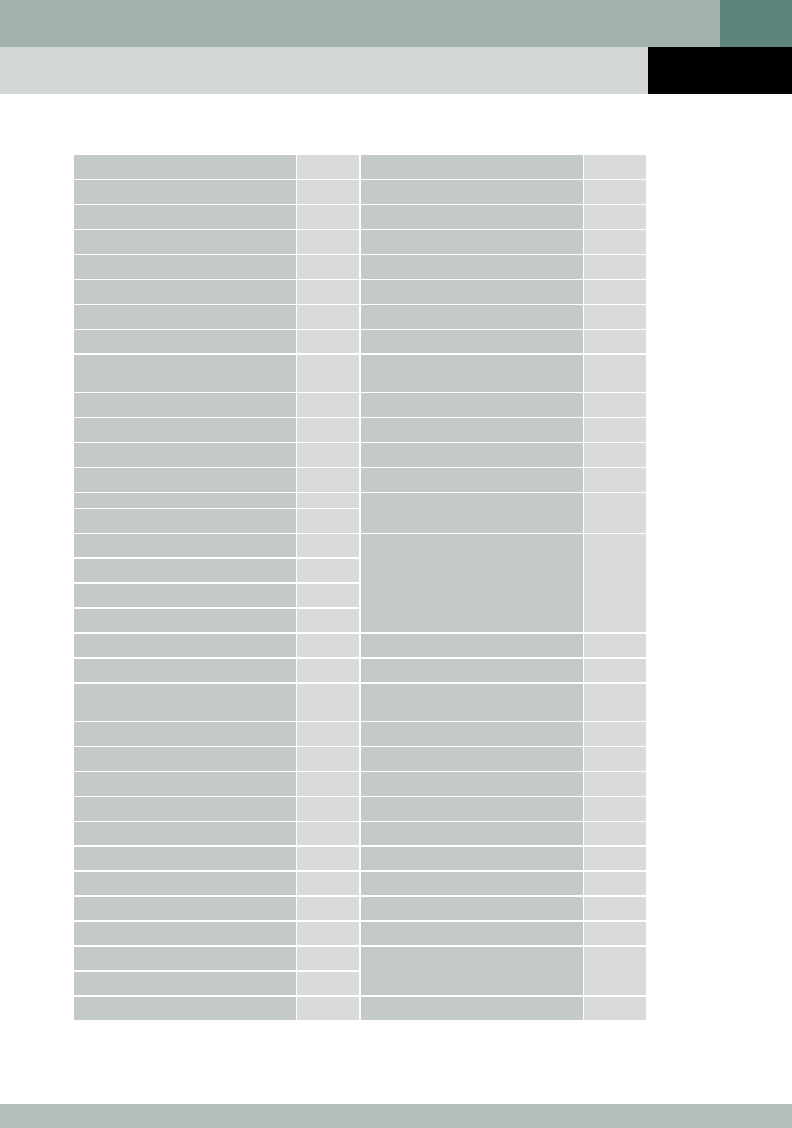
DISTRICT JUNAGADH
General information
Household amenities, (%), Census 2001
Area (Sq. Kms.)
8846.0
Households with kutchha houses
Percent to total state’s area
4.5
Households with safe drinking water
C D Blocks
14
Households with electricity connection
Towns
15 Vital rates
No. of Villages
923
Crude Birth Rate, 2001
Total Fertility Rate, 2001
Demographic particulars (Census, 2001)
Infant Mortality Rate, 2001
Population
Key RCH indicators from District Level
Household Survey, 2007-08 (%)
Persons 2448173
Girls marrying below 18 years
Males 1252350
Birth order 3 and above
Females 1195823
Current use of any FP Method
Rural (%)
Urban (%)
Scheduled Castes (%)
70.9
Total unmet need
29.1 Pregnant women who had at least with 3 ANCs
9.62
visits during the last pregnancy
Scheduled Tribes (%)
0.77
Elderly population (60+ years) (%)
7.4
Young people (10-24 years) (%)
31.8
Institutional delivery
Adolescent (10-19 years) (%)
22.4
Decadal Growth Rate, 1991-2001 (%)
17.08
Children with full immunization
Population density (per sq. km)
277
Sex Ratio (females per 1000 males)
Medical/Health Infrastructures/
Institutions
1991
960
2001
955
CHCs
Child Sex Ratio (0-6 years) (girls per 1000 boys)
PHCs
1991
930
Sub-Centres
2001
902
Literacy rate
Information on HIV/AIDS
Persons
67.78
Males
78.74
HIV+ among ANC clinics (%)
Females
56.43
HIV+ among STD clinics (%)
Total work participation rate
Female work participation rate
40.9 Number of Integrated Counseling and Testing
26.5
Centres (ICTC formerly VCTC)
Number of Anti Retroviral Therapy (ART) Centres
1
80.6
94.36
23.1
2.6
50
5.3
27.9
64.8
17.5
75.4
56.3
77.6
15
54
390
0.50
-
10
-
| 29

4.6 Page 36

▲back to top


Population Foundation of India
d i str i c t
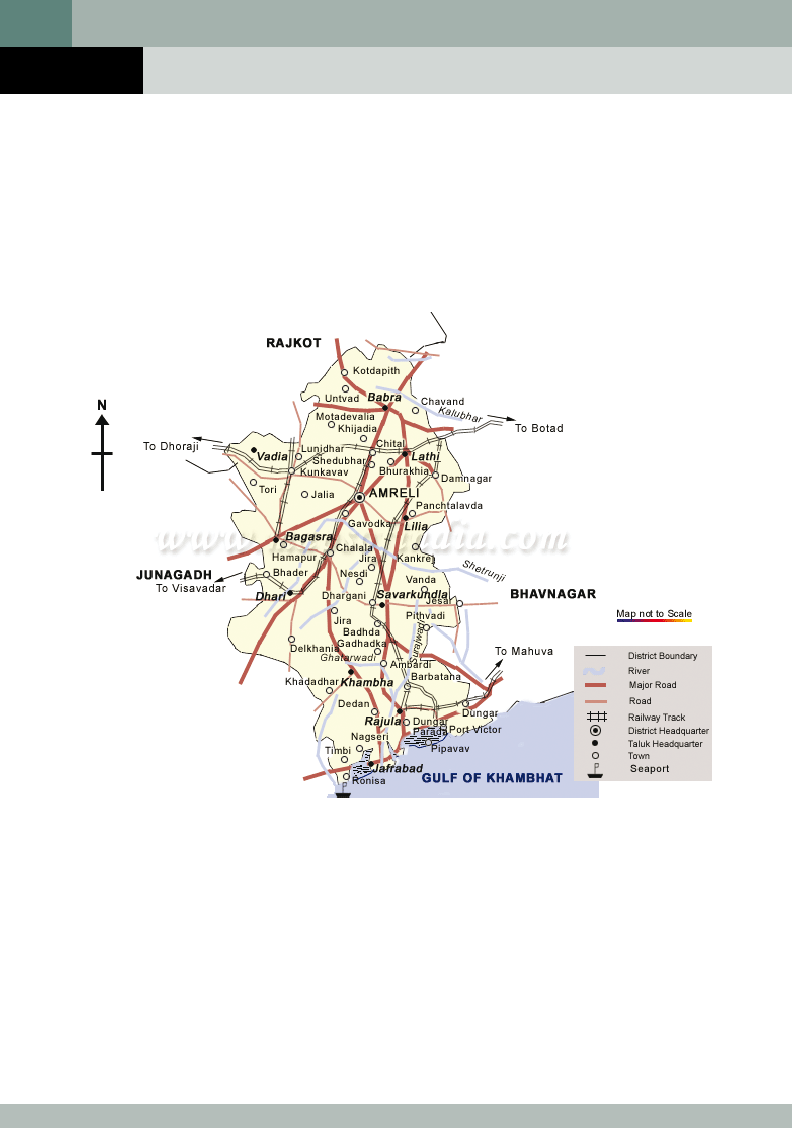
AMRELI
Showing CD Blocks
30 |

4.7 Page 37

▲back to top


Population, Health & Social Development in gujarat, maharashtra and Rajasthan
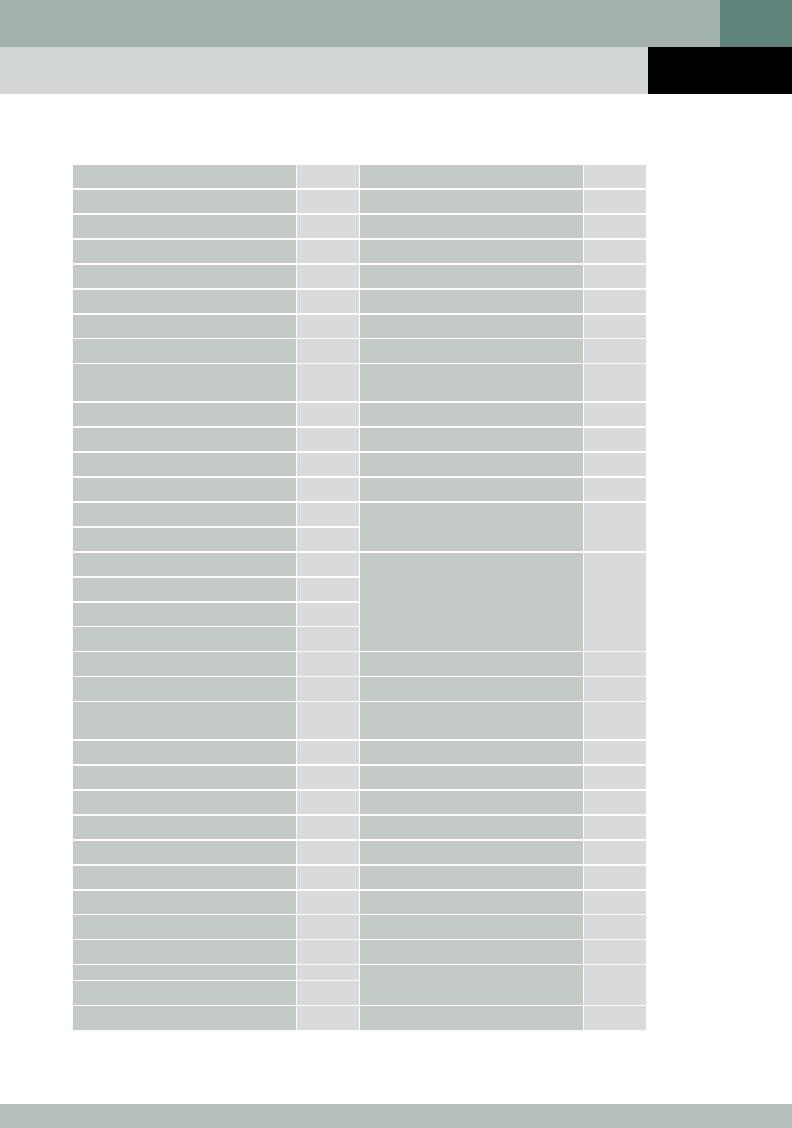
DISTRICT AMRELI
General information
Household amenities, (%), Census 2001
Area (Sq. Kms.)
7397
Households with kutchha houses
2.9
Percent to total state’s area
3.8
Households with safe drinking water
80.5
C D Blocks
11
Households with electricity connection
89.6
Towns
9 Vital rates
No. of Villages
615
Crude Birth Rate, 2001
21.1
Total Fertility Rate, 2001
2.5
Demographic particulars (Census, 2001)
Infant Mortality Rate, 2001
41
Population
Key RCH indicators from District Level
Household Survey, 2007-08 (%)
Persons 1393918
Girls marrying below 18 years
11.0
Males 701593
Birth order 3 and above
32.4
Females 692325
Current use of any FP Method
76.8
Rural (%)
77.6
Total unmet need
10.7
Urban (%)
Scheduled Castes (%)
22.4 Pregnant women who had at least with 3 ANCs
8.3
visits during the last pregnancy
64.4
Scheduled Tribes (%)
0.2
Elderly population (60+ years) (%)
8.8
Young people (10-24 years) (%)
32.2
Institutional delivery
50.8
Adolescent (10-19 ye ars) (%)
11.5
Decadal Growth Rate, 1991-2001 (%)
6.5
Children with full immunization
60.5
Population density (per sq. km)
188
Sex Ratio (females per 1000 males)
Medical/Health Infrastructures/
Institutions
1991
985
2001
987
CHCs
13
Child Sex Ratio (0-6 years) (girls per 1000 boys)
PHCs
35
1991
923
Sub-Centres
247
2001
892
Literacy rate
Information on HIV/AIDS
Persons
66.1
Males
76.4
HIV+ among ANC clinics (%)
0.00
Females
55.8
HIV+ among STD clinics (%)
-
Total work participation rate
Female work participation rate
43.1 Number of Integrated Counseling and Testing
31.0
Centres (ICTC formerly VCTC)
9
Number of Anti Retroviral Therapy (ART) Centres
-
| 31

4.8 Page 38

▲back to top


Population Foundation of India
d i str i c t
BHAVNAGAR
Showing CD Blocks
32 |

4.9 Page 39

▲back to top


Population, Health & Social Development in gujarat, maharashtra and Rajasthan
DISTRICT BHAVNAGAR
General information
Household amenities, (%), Census 2001
Area (Sq. Kms.)
9981
Households with kutchha houses
5.1
Percent to total state’s area
5.1
Households with safe drinking water
73.4
C D Blocks
11
Households with electricity connection
91.0
Towns
15 Vital rates
No. of Villages
790
Crude Birth Rate, 2001
25.3
Total Fertility Rate, 2001
3.0
Demographic particulars (Census, 2001)
Infant Mortality Rate, 2001
47
Population
Key RCH indicators from District Level
Household Survey, 2007-08 (%)
Persons 2469630
Girls marrying below 18 years
10.9
Males 1274920
Birth order 3 and above
26.4
Females 1194710
Current use of any FP Method
64.2
Rural (%)
59.6
Total unmet need
20.8
Urban (%)
Scheduled Castes (%)
40.4 Pregnant women who had at least with 3 ANCs
5.8
visits during the last pregnancy
57.3
Scheduled Tribes (%)
0.3
Elderly population (60+ years) (%)
6.4
Young people (10-24 years) (%)
32.0
Institutional delivery
58.4
Adolescent (10-19 years) (%)
23.2
Decadal Growth Rate, 1991-2001 (%)
19.3
Children with full immunization
50.8
Population density (per sq. km)
247
Sex Ratio (females per 1000 males)
Medical/Health Infrastructures/
Institutions
1991
944
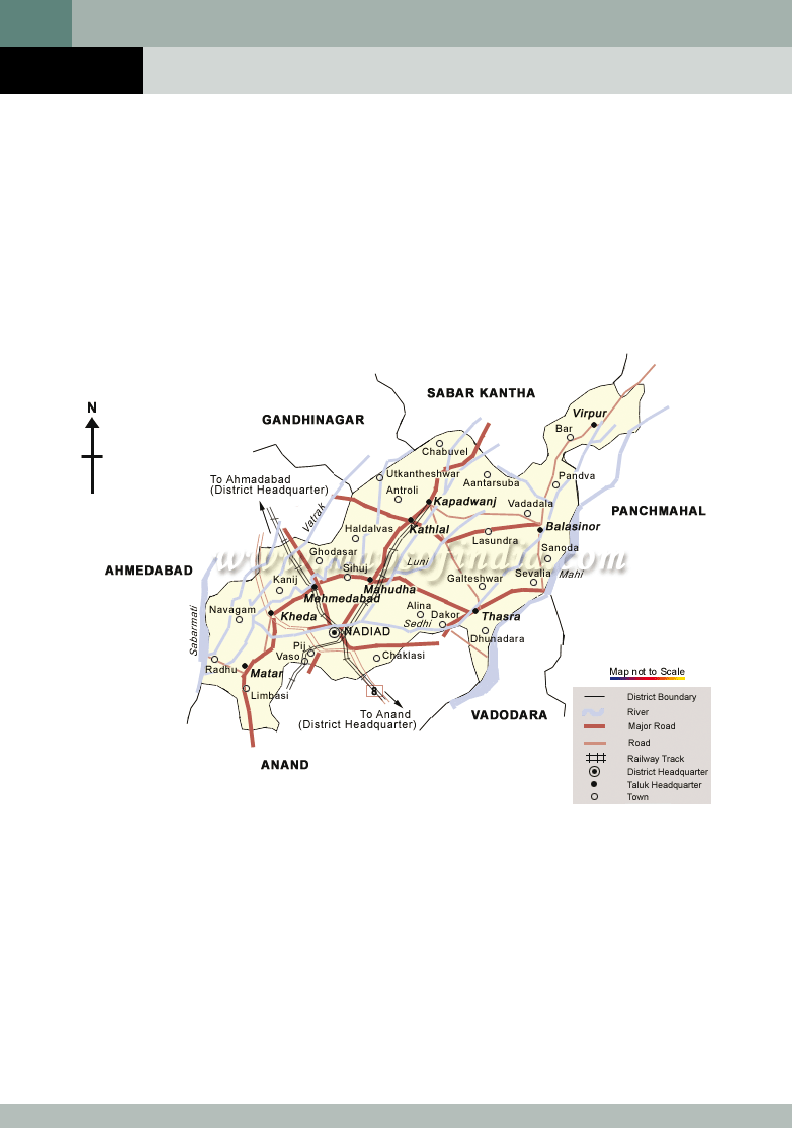
2001
937
CHCs
14
Child Sex Ratio (0-6 years) (girls per 1000 boys)
PHCs
43
1991
925
Sub-Centres
360
2001
881
Literacy rate
Information on HIV/AIDS
Persons
66.2
Males
78.0
HIV+ among ANC clinics (%)
0.75
Females
53.7
HIV+ among STD clinics (%)
7.34
Total work participation rate
Female work participation rate
38.2 Number of Integrated Counseling and Testing
22.1
Centres (ICTC formerly VCTC)
11
Number of Anti Retroviral Therapy (ART) Centres
1
| 33

4.10 Page 40

▲back to top


Population Foundation of India
d i str i c t
ANAND
Showing CD Blocks
34 |

5 Pages 41-50

▲back to top


5.1 Page 41

▲back to top


Population, Health & Social Development in gujarat, maharashtra and Rajasthan
DISTRICT ANAND
General information
Household amenities, (%), Census 2001
Area (Sq. Kms.)
2941
Households with kutchha houses
3.6
Percent to total state’s area
1.5
Households with safe drinking water
86.9
C D Blocks
8
Households with electricity connection
73.3
Towns
14 Vital rates
No. of Villages
350
Crude Birth Rate, 2001
21.7
Total Fertility Rate, 2001
2.4
Demographic particulars (Census, 2001)
Infant Mortality Rate, 2001
71
Population
Key RCH indicators from District Level
Household Survey, 2007-08 (%)
Persons 1856872
Girls marrying below 18 years
21.3
Males 972000
Birth order 3 and above
30.2
Females 884872
Current use of any FP Method
61.9
Rural (%)
73.4
Total unmet need
20.0
Urban (%)
Scheduled Castes (%)
26.6 Pregnant women who had at least with 3 ANCs
5.3
visits during the last pregnancy
70.5
Scheduled Tribes (%)
1.2
Elderly population (60+ years) (%)
7.2
Young people (10-24 years) (%)
30.5
Institutional delivery
78.3
Adolescent (10-19 years) (%)
20.7
Decadal Growth Rate, 1991-2001 (%)
13.0
Children with full immunization
77.0
Population density (per sq. km)
631
Sex Ratio (females per 1000 males)
Medical/Health Infrastructures/
Institutions
1991
912
2001
910
CHCs
10
Child Sex Ratio (0-6 years) (girls per 1000 boys)
PHCs
43
1991
897
Sub-Centres
274
2001
848
Literacy rate
Information on HIV/AIDS
Persons
74.5
Males
86.1
HIV+ among ANC clinics (%)
0.25
Females
61.9
HIV+ among STD clinics (%)
-
Total work participation rate
Female work participation rate
42.3 Number of Integrated Counseling and Testing
28.2
Centres (ICTC formerly VCTC)
8
Number of Anti Retroviral Therapy (ART) Centres
-
| 35

5.2 Page 42

▲back to top


Population Foundation of India
d i str i c t
KHEDA
Showing
CD Blocks
36 |

5.3 Page 43

▲back to top


Population, Health & Social Development in gujarat, maharashtra and Rajasthan
DISTRICT KHEDA
General information
Household amenities, (%), Census 2001
Area (Sq. Kms.)
4219
Households with kutchha houses
5.4
Percent to total state’s area
2.2
Households with safe drinking water
83.8
C D Blocks
10
Households with electricity connection
65.7
Towns
10 Vital rates
No. of Villages
612
Crude Birth Rate, 2001
23.1
Total Fertility Rate, 2001
2.6
Demographic particulars (Census, 2001)
Infant Mortality Rate, 2001
75
Population
Key RCH indicators from District Level
Household Survey, 2007-08 (%)
Persons 2024216
Girls marrying below 18 years
31.3
Males 1052823
Birth order 3 and above
20.2
Females 971393
Current use of any FP Method
69.3
Rural (%)
80.4
Total unmet need
15.5
Urban (%)
Scheduled Castes (%)
19.6 Pregnant women who had at least with 3 ANCs
5.2
visits during the last pregnancy
67.7
Scheduled Tribes (%)
1.6
Elderly population (60+ years) (%)
4.5
Young people (10-24 years) (%)
29.7
Institutional delivery
69.0
Adolescent (10-19 years) (%)
20.2
Decadal Growth Rate, 1991-2001 (%)
13.2
Children with full immunization
61.8
Population density (per sq. km)
480
Sex Ratio (females per 1000 males)
Medical/Health Infrastructures/
Institutions
1991
924
2001
923
CHCs
11
Child Sex Ratio (0-6 years) (girls per 1000 boys)
PHCs
50
1991
900
Sub-Centres
317
2001
875
Literacy rate
Information on HIV/AIDS
Persons
72.0
Males
86.0
HIV+ among ANC clinics (%)
0.00
Females
56.9
HIV+ among STD clinics (%)
-
Total work participation rate
Female work participation rate
44.9 Number of Integrated Counseling and Testing
33.8
Centres (ICTC formerly VCTC)
7
Number of Anti Retroviral Therapy (ART) Centres
-
| 37

5.4 Page 44

▲back to top


Population Foundation of India
d i str i c t
PANCH MAHALS
Showing CD Blocks
38 |

5.5 Page 45

▲back to top


Population, Health & Social Development in gujarat, maharashtra and Rajasthan
DISTRICT PANCH MAHALS
General information
Household amenities, (%), Census 2001
Area (Sq. Kms.)
5210
Households with kutchha houses
8.5
Percent to total state’s area
2.7
Households with safe drinking water
63.5
C D Blocks
11
Households with electricity connection
57.5
Towns
9 Vital rates
No. of Villages
1201
Crude Birth Rate, 2001
27.7
Total Fertility Rate, 2001
3.5
Demographic particulars (Census, 2001)
Infant Mortality Rate, 2001
71
Population
Key RCH indicators from District Level
Household Survey, 2007-08 (%)
Persons 2025277
Girls marrying below 18 years
25.3
Males 1044937
Birth order 3 and above
33.1
Females 980340
Current use of any FP Method
64.8
Rural (%)
86.5
Total unmet need
18.5
Urban (%)
Scheduled Castes (%)
13.5 Pregnant women who had at least with 3 ANCs
4.6
visits during the last pregnancy
55.0
Scheduled Tribes (%)
27.5
Elderly population (60+ years) (%)
7.1
Young people (10-24 years) (%)
30.1
Institutional delivery
52.4
Adolescent (10-19 years) (%)
21.4
Decadal Growth Rate, 1991-2001 (%)
20.4
Children with full immunization
47.5
Population density (per sq. km)
389
Sex Ratio (females per 1000 males)
Medical/Health Infrastructures/
Institutions
1991
934
2001
938
CHCs
14
Child Sex Ratio (0-6 years) (girls per 1000 boys)
PHCs
64
1991
971
Sub-Centres
400
2001
934
Literacy rate
Information on HIV/AIDS
Persons
60.9
Males
75.9
HIV+ among ANC clinics (%)
0.00
Females
44.9
HIV+ among STD clinics (%)
0.4
Total work participation rate
Female work participation rate
48.2 Number of Integrated Counseling and Testing
42.7
Centres (ICTC formerly VCTC)
7
Number of Anti Retroviral Therapy (ART) Centres
-
| 39

5.6 Page 46

▲back to top


Population Foundation of India
d i str i c t
DOHAD
Showing
CD Blocks
40 |

5.7 Page 47

▲back to top


Population, Health & Social Development in gujarat, maharashtra and Rajasthan
DISTRICT DOHAD
General information
Household amenities, (%), Census 2001
Area (Sq. Kms.)
3655
Households with kutchha houses
20.2
Percent to total state’s area
1.9
Households with safe drinking water
59.4
C D Blocks
7
Households with electricity connection
39.2
Towns
5 Vital rates
No. of Villages
693
Crude Birth Rate, 2001
34.2
Total Fertility Rate, 2001
4.3
Demographic particulars (Census, 2001)
Infant Mortality Rate, 2001
81
Population
Key RCH indicators from District Level
Household Survey, 2007-08 (%)
Persons 1636433
Girls marrying below 18 years
27.7
Males 824208
Birth order 3 and above
53.2
Females 812225
Current use of any FP Method
44.3
Rural (%)
88.5
Total unmet need
36.4
Urban (%)
Scheduled Castes (%)
11.5 Pregnant women who had at least with 3 ANCs
2.0
visits during the last pregnancy
48.5
Scheduled Tribes (%)
72.3
Elderly population (60+ years) (%)
3.3
Young people (10-24 years) (%)
30.8
Institutional delivery
60.4
Adolescent (10-19 years) (%)
22.4
Decadal Growth Rate, 1991-2001 (%)
28.4
Children with full immunization
34.6
Population density (per sq. km)
448
Sex Ratio (females per 1000 males)
Medical/Health Infrastructures/
Institutions
1991
976
2001
985
CHCs
11
Child Sex Ratio (0-6 years) (girls per 1000 boys)
PHCs
61
1991
1000
Sub-Centres
332
2001
966
Literacy rate
Information on HIV/AIDS
Persons
45.2
Males
58.9
HIV+ among ANC clinics (%)
1.38
Females
31.3
HIV+ among STD clinics (%)
-
Total work participation rate
Female work participation rate
49.8 Number of Integrated Counseling and Testing
47.9
Centres (ICTC formerly VCTC)
6
Number of Anti Retroviral Therapy (ART) Centres
-
| 41

5.8 Page 48

▲back to top


Population Foundation of India
d i str i c t
VADODARA
Showing CD Blocks
42 |

5.9 Page 49

▲back to top


Population, Health & Social Development in gujarat, maharashtra and Rajasthan
DISTRICT VADODARA
General information
Household amenities, (%), Census 2001
Area (Sq. Kms.)
7550
Households with kutchha houses
6.9
Percent to total state’s area
3.9
Households with safe drinking water
92.6
C D Blocks
12
Households with electricity connection
78.1
Towns
18 Vital rates
No. of Villages
1548
Crude Birth Rate, 2001
21.3
Total Fertility Rate, 2001
2.4
Demographic particulars (Census, 2001)
Infant Mortality Rate, 2001
63
Population
Key RCH indicators from District Level
Household Survey, 2007-08 (%)
Persons 3641802
Girls marrying below 18 years
20.0
Males 1897368
Birth order 3 and above
27.1
Females 1744434
Current use of any FP Method
68.9
Rural (%)
52.6
Total unmet need
15.5
Urban (%)
Scheduled Castes (%)
47.4 Pregnant women who had at least with 3 ANCs
5.6
visits during the last pregnancy
47.0
Scheduled Tribes (%)
26.6
Elderly population (60+ years) (%)
7.1
Young people (10-24 years) (%)
29.2
Institutional delivery
54.4
Adolescent (10-19 years) (%)
19.9
Decadal Growth Rate, 1991-2001 (%)
19.8
Children with full immunization
63.0
Population density (per sq. km)
482
Sex Ratio (females per 1000 males)
Medical/Health Infrastructures/
Institutions
1991
913
2001
919
CHCs
16
Child Sex Ratio (0-6 years) (girls per 1000 boys)
PHCs
76
1991
934
Sub-Centres
465
2001
885
Literacy rate
Information on HIV/AIDS
Persons
70.8
Males
80.0
HIV+ among ANC clinics (%)
0.25
Females
60.7
HIV+ among STD clinics (%)
3.4
Total work participation rate
Female work participation rate
41.7 Number of Integrated Counseling and Testing
26.3
Centres (ICTC formerly VCTC)
10
Number of Anti Retroviral Therapy (ART) Centres
1
| 43

5.10 Page 50

▲back to top


Population Foundation of India
d i str i c t
NARMADA
Showing CD Blocks
44 |

6 Pages 51-60

▲back to top


6.1 Page 51

▲back to top


Population, Health & Social Development in gujarat, maharashtra and Rajasthan
DISTRICT NARMADA
General information
Household amenities, (%), Census 2001
Area (Sq. Kms.)
2755
Households with kutchha houses
7.8
Percent to total state’s area
1.4
Households with safe drinking water
89.4
C D Blocks
4
Households with electricity connection
52.0
Towns
3 Vital rates
No. of Villages
552
Crude Birth Rate, 2001
24.6
Total Fertility Rate, 2001
2.8
Demographic particulars (Census, 2001)
Infant Mortality Rate, 2001
72
Population
Key RCH indicators from District Level
Household Survey, 2007-08 (%)
Persons 514404
Girls marrying below 18 years
19.7
Males 263986
Birth order 3 and above
37.8
Females 250418
Current use of any FP Method
63.8
Rural (%)
89.5
Total unmet need
19.2
Urban (%)
Scheduled Castes (%)
10.5 Pregnant women who had at least with 3 ANCs
1.9
visits during the last pregnancy
45.1
Scheduled Tribes (%)
78.1
Elderly population (60+ years) (%)
7.0
Young people (10-24 years) (%)
29.0
Institutional delivery
28.4
Adolescent (10-19 years) (%)
20.8
Decadal Growth Rate, 1991-2001 (%)
14.4
Children with full immunization
60.9
Population density (per sq. km)
187
Sex Ratio (females per 1000 males)
Medical/Health Infrastructures/
Institutions
1991
947
2001
949
CHCs
4
Child Sex Ratio (0-6 years) (girls per 1000 boys)
PHCs
21
1991
985
Sub-Centres
116
2001
945
Literacy rate
Information on HIV/AIDS
Persons
59.9
Males
72.4
HIV+ among ANC clinics (%)
0.00
Females
46.6
HIV+ among STD clinics (%)
-
Total work participation rate
Female work participation rate
50.4 Number of Integrated Counseling and Testing
43.9
Centres (ICTC formerly VCTC)
2
Number of Anti Retroviral Therapy (ART) Centres
-
| 45

6.2 Page 52

▲back to top


Population Foundation of India
d i str i c t
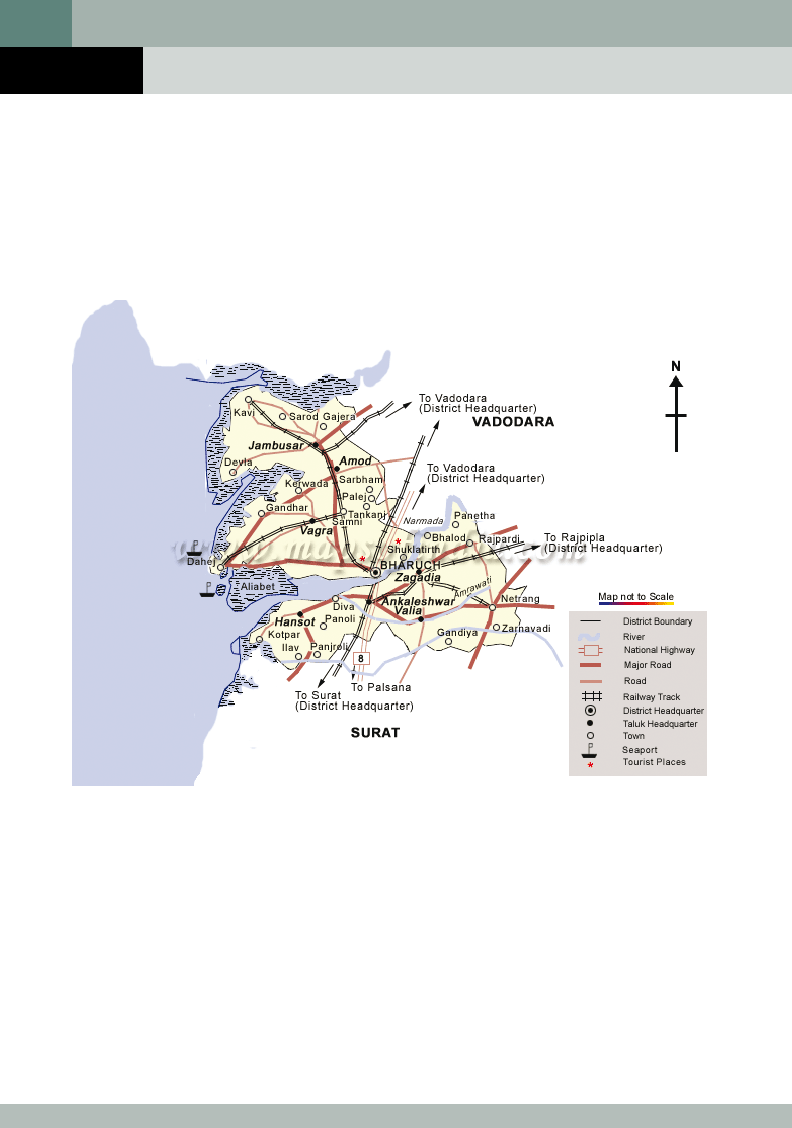
BHARUCH
Showing CD Blocks
46 |

6.3 Page 53

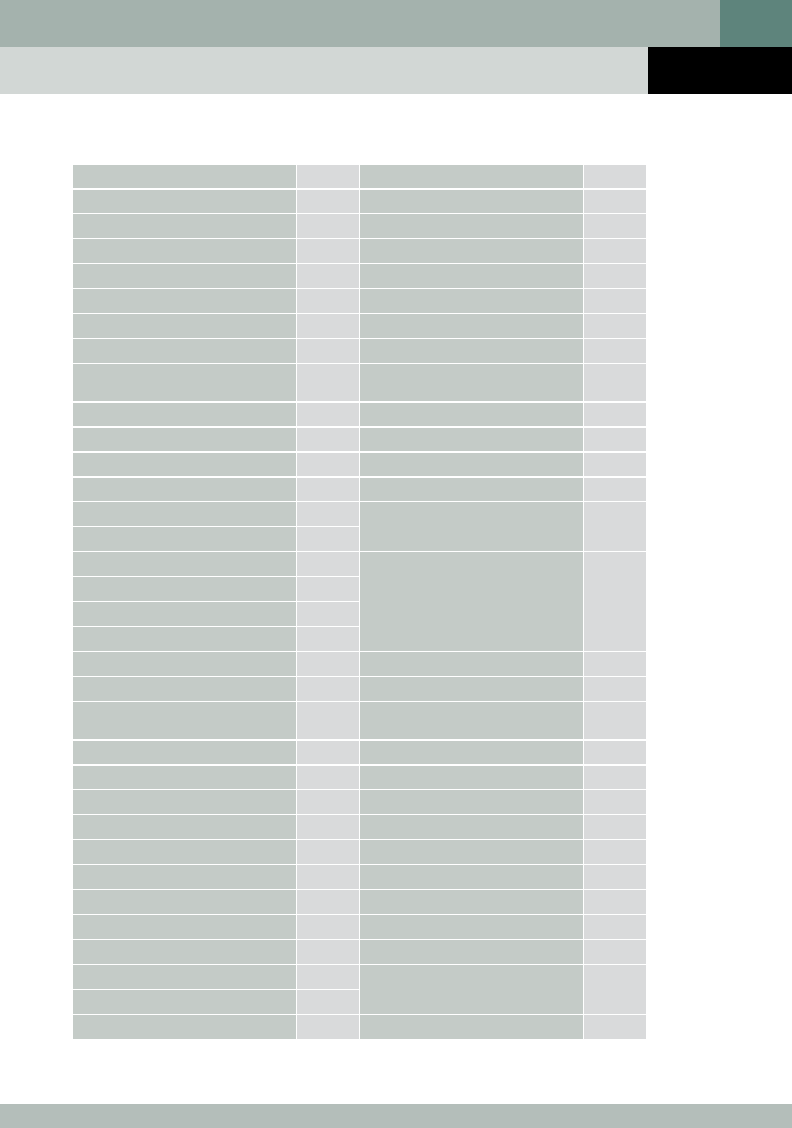
▲back to top


Population, Health & Social Development in gujarat, maharashtra and Rajasthan
DISTRICT BHARUCH
General information
Household amenities, (%), Census 2001
Area (Sq. Kms.)
6527
Households with kutchha houses
2.8
Percent to total state’s area
3.3
Households with safe drinking water
87.3
C D Blocks
8
Households with electricity connection
77.7
Towns
10 Vital rates
No. of Villages
657
Crude Birth Rate, 2001
22.3
Total Fertility Rate, 2001
2.5
Demographic particulars (Census, 2001)
Infant Mortality Rate, 2001
57
Population
Key RCH indicators from District Level
Household Survey, 2007-08 (%)
Persons 4995174
Girls marrying below 18 years
12.2
Males 2722539
Birth order 3 and above
23.6
Females 2272635
Current use of any FP Method
70.3
Rural (%)
73.8
Total unmet need
16.0
Urban (%)
Scheduled Castes (%)
26.2 Pregnant women who had at least with 3 ANCs
3.4
visits during the last pregnancy
64.3
Scheduled Tribes (%)
28.2
Elderly population (60+ years) (%)
7.0
Young people (10-24 years) (%)
29.8
Institutional delivery
47.8
Adolescent (10-19 years) (%)
20.7
Decadal Growth Rate, 1991-2001 (%)
47.0
Children with full immunization
59.9
Population density (per sq. km)
210
Sex Ratio (females per 1000 males)
Medical/Health Infrastructures/ Institutions
1991
925
2001
835
CHCs
8
Child Sex Ratio (0-6 years) (girls per 1000 boys)
PHCs
39
1991
955
Sub-Centres
200
2001
871
Literacy rate
Information on HIV/AIDS
Persons
74.7
Males
81.5
HIV+ among ANC clinics (%)
0.75
Females
66.4
HIV+ among STD clinics (%)
-
Total work participation rate
Female work participation rate
41.6 Number of Integrated Counseling and Testing
25.4
Centres (ICTC formerly VCTC)
6
Number of Anti Retroviral Therapy (ART) Centres
-
| 47

6.4 Page 54

▲back to top


Population Foundation of India
d i str i c t
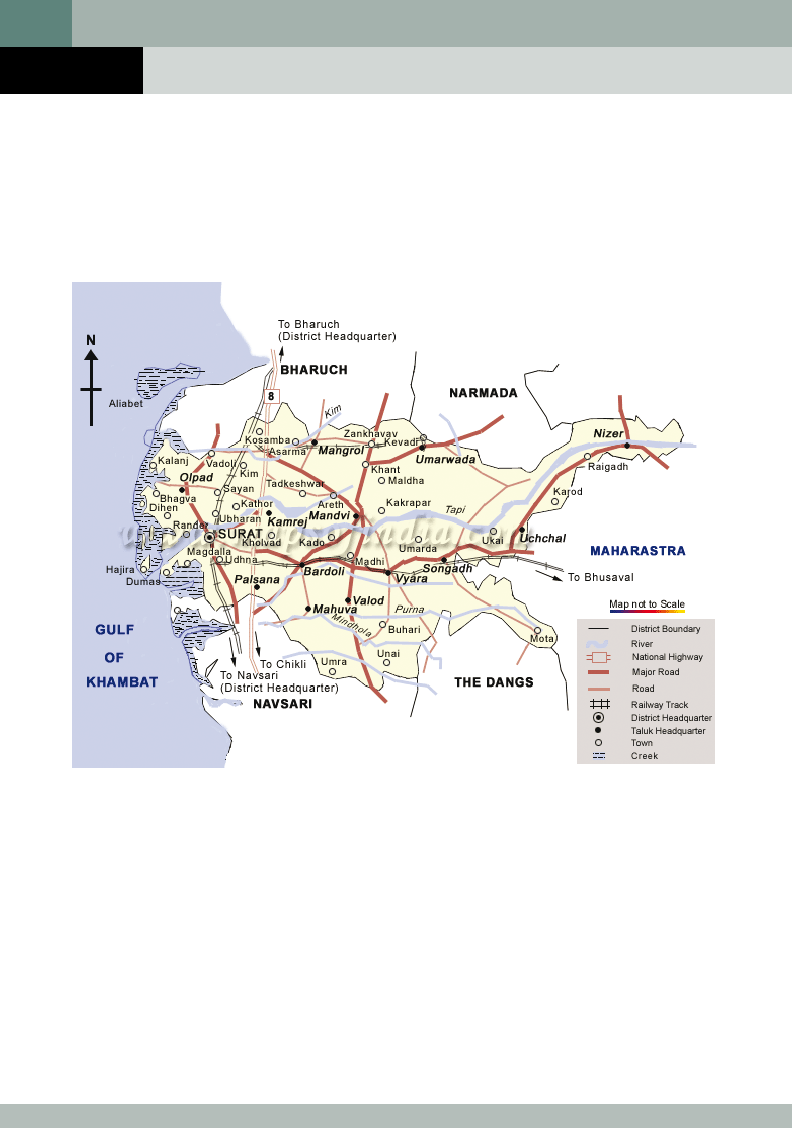
SURAT
Showing
CD Blocks
48 |

6.5 Page 55

▲back to top


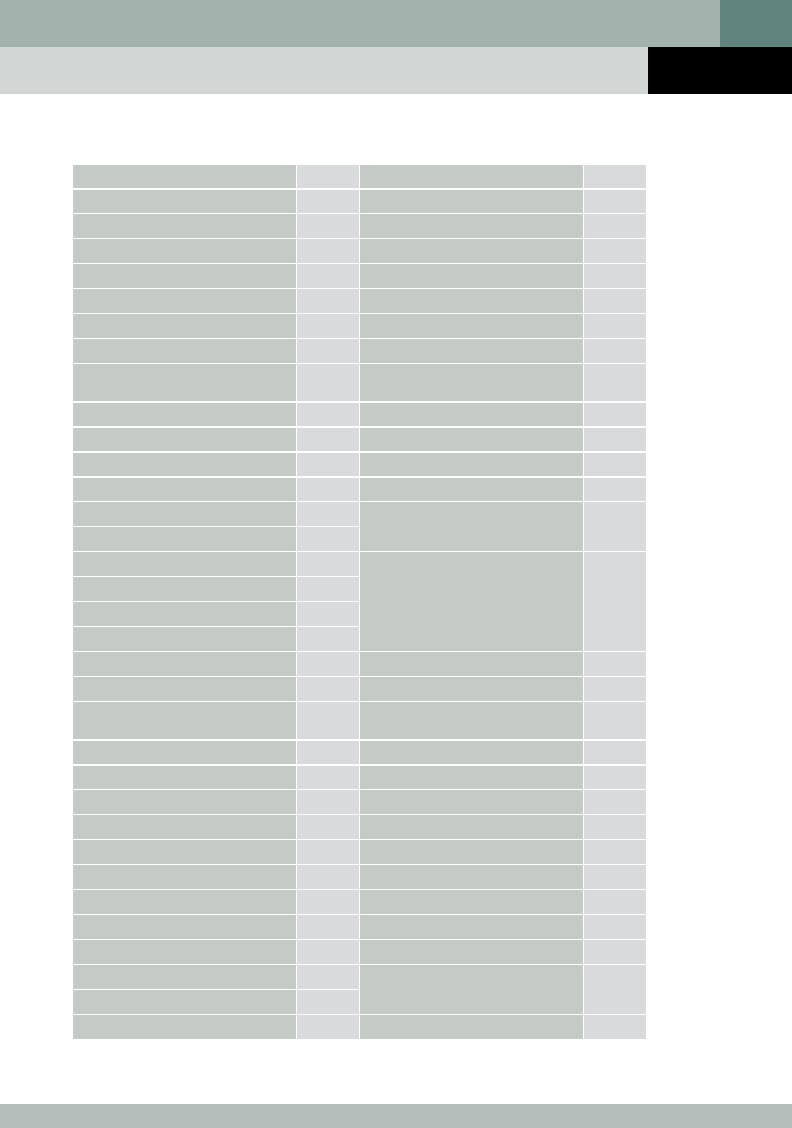
Population, Health & Social Development in gujarat, maharashtra and Rajasthan
DISTRICT SURAT
General information
Household amenities, (%), Census 2001
Area (Sq. Kms.)
7657
Households with kutchha houses
2.6
Percent to total state’s area
3.9
Households with safe drinking water
87.3
C D Blocks
15
Households with electricity connection
84.8
Towns
20 Vital rates
No. of Villages
1167
Crude Birth Rate, 2001
23.2
Total Fertility Rate, 2001
2.5
Demographic particulars (Census, 2001)
Infant Mortality Rate, 2001
44
Population
Key RCH indicators from District Level
Household Survey, 2007-08 (%)
Persons 1370656
Girls marrying below 18 years
10.9
Males 713676
Birth order 3 and above
15.9
Females 656980
Current use of any FP Method
68.9
Rural (%)
40.5
Total unmet need
17.0
Urban (%)
Scheduled Castes (%)
59.5 Pregnant women who had at least with 3 ANCs
4.5
visits during the last pregnancy
76.5
Scheduled Tribes (%)
32.4
Elderly population (60+ years) (%)
5.2
Young people (10-24 years) (%)
31.2
Institutional delivery
72.3
Adolescent (10-19 years) (%)
20.1
Decadal Growth Rate, 1991-2001 (%)
19.3
Children with full immunization
87.8
Population density (per sq. km)
652
Sex Ratio (females per 1000 males)
Medical/Health Infrastructures/
Institutions
1991
901
2001
921
CHCs
17
Child Sex Ratio (0-6 years) (girls per 1000 boys)
PHCs
78
1991
944
Sub-Centres
601
2001
917
Literacy rate
Information on HIV/AIDS
Persons
74.4
Males
83.0
HIV+ among ANC clinics (%)
1.25
Females
65.1
HIV+ among STD clinics (%)
8.8
Total work participation rate
Female work participation rate
43.7 Number of Integrated Counseling and Testing
25.3
Centres (ICTC formerly VCTC)
14
Number of Anti Retroviral Therapy (ART) Centres
2
| 49

6.6 Page 56

▲back to top


Population Foundation of India
d i str i c t
THE DANGS
Showing CD Blocks
50 |

6.7 Page 57

▲back to top


Population, Health & Social Development in gujarat, maharashtra and Rajasthan
DISTRICT THE DANGS
General information
Household amenities, (%), Census 2001
Area (Sq. Kms.)
1764
Households with kutchha houses
2.9
Percent to total state’s area
0.9
Households with safe drinking water
58.1
C D Blocks
1
Households with electricity connection
48.3
Towns
0 Vital rates
No. of Villages
311
Crude Birth Rate, 2001
32.8
Total Fertility Rate, 2001
3.8
Demographic particulars (Census, 2001)
Infant Mortality Rate, 2001
66
Population
Key RCH indicators from District Level
Household Survey, 2007-08 (%)
Persons 186729
Girls marrying below 18 years
31.1
Males
93974
Birth order 3 and above
37.1
Females
92755
Current use of any FP Method
53.2
Rural (%)
100.0
Total unmet need
26.2
Urban (%)
Scheduled Castes (%)
0.0 Pregnant women who had at least with 3 ANCs
0.5
visits during the last pregnancy
19.3
Scheduled Tribes (%)
93.8
Elderly population (60+ years) (%)
5.5
Young people (10-24 years) (%)
28.9
Institutional delivery
9.4
Adolescent (10-19 years) (%)
20.9
Decadal Growth Rate, 1991-2001 (%)
29.6
Children with full immunization
36.4
Population density (per sq. km)
106
Sex Ratio (females per 1000 males)
Medical/Health Infrastructures/
Institutions
1991
983
2001
987
CHCs
1
Child Sex Ratio (0-6 years) (girls per 1000 boys)
PHCs
7
1991
999
Sub-Centres
47
2001
974
Literacy rate
Information on HIV/AIDS
Persons
59.7
Males
70.7
HIV+ among ANC clinics (%)
0.00
Females
48.5
HIV+ among STD clinics (%)
-
Total work participation rate
Female work participation rate
49.8 Number of Integrated Counseling and Testing
47.2
Centres (ICTC formerly VCTC)
2
Number of Anti Retroviral Therapy (ART) Centres
-
| 51

6.8 Page 58

▲back to top


Population Foundation of India
d i str i c t
NAVSARI
Showing CD Blocks
52 |

6.9 Page 59

▲back to top


Population, Health & Social Development in gujarat, maharashtra and Rajasthan
DISTRICT NAVSARI
General information
Household amenities, (%), Census 2001
Area (Sq. Kms.)
2209
Households with kutchha houses
2.0
Percent to total state’s area
1.1
Households with safe drinking water
78.9
C D Blocks
5
Households with electricity connection
86.5
Towns
11 Vital rates
No. of Villages
374
Crude Birth Rate, 2001
17.9
Total Fertility Rate, 2001
2.0
Demographic particulars (Census, 2001)
Infant Mortality Rate, 2001
52
Population
Key RCH indicators from District Level
Household Survey, 2007-08 (%)
Persons 1229463
Girls marrying below 18 years
6.6
Males 628988
Birth order 3 and above
20.8
Females 600475
Current use of any FP Method
66.4
Rural (%)
72.8
Total unmet need
16.6
Urban (%)
Scheduled Castes (%)
27.2 Pregnant women who had at least with 3 ANCs
3.2
visits during the last pregnancy
81.1
Scheduled Tribes (%)
48.1
Elderly population (60+ years) (%)
8.0
Young people (10-24 years) (%)
29.6
Institutional delivery
80.8
Adolescent (10-19 years) (%)
20.1
Decadal Growth Rate, 1991-2001 (%)
13.2
Children with full immunization
80.4
Population density (per sq. km)
557
Sex Ratio (females per 1000 males)
Medical/Health Infrastructures/
Institutions
1991
955
2001
955
CHCs
10
Child Sex Ratio (0-6 years) (girls per 1000 boys)
PHCs
36
1991
958
Sub-Centres
281
2001
915
Literacy rate
Information on HIV/AIDS
Persons
75.8
Males
82.8
HIV+ among ANC clinics (%)
1.00
Females
68.6
HIV+ among STD clinics (%)
4.0
Total work participation rate
Female work participation rate
44.3 Number of Integrated Counseling and Testing
31.6
Centres (ICTC formerly VCTC)
9
Number of Anti Retroviral Therapy (ART) Centres
-
| 53

6.10 Page 60

▲back to top


Population Foundation of India
d i str i c t
VALSAD
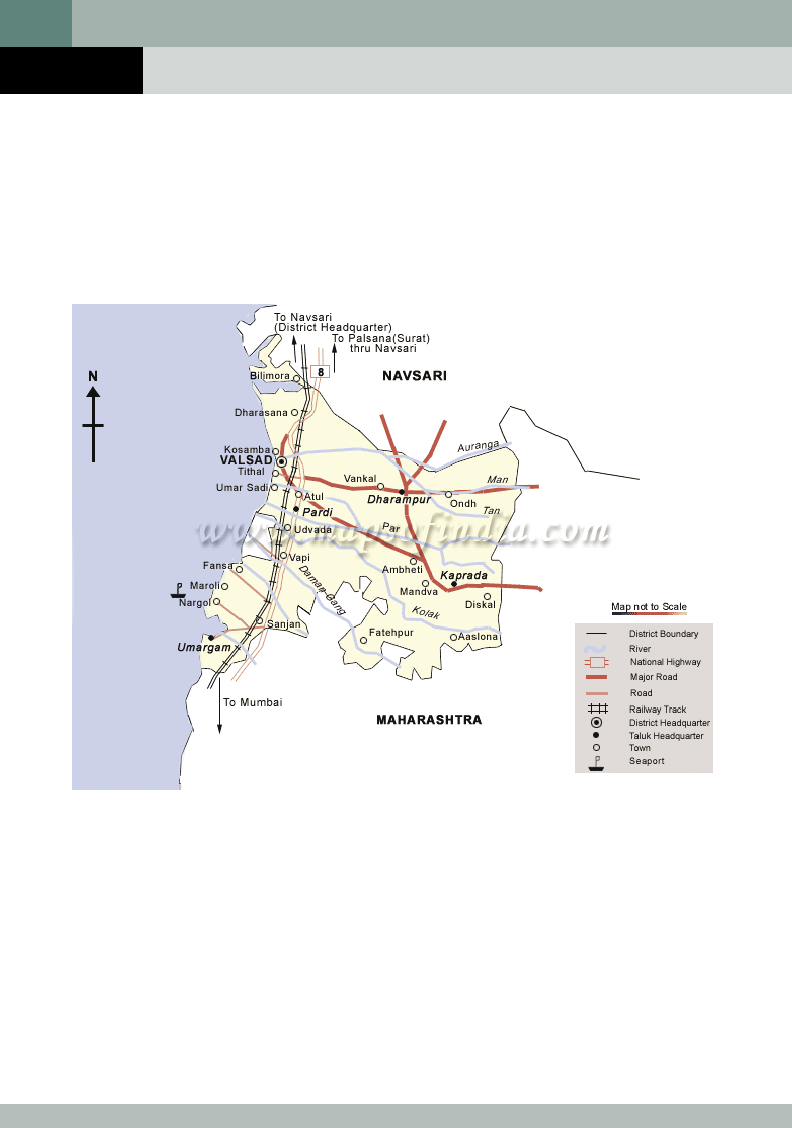
Showing CD Blocks
54 |

7 Pages 61-70

▲back to top


7.1 Page 61

▲back to top


Population, Health & Social Development in gujarat, maharashtra and Rajasthan
DISTRICT VALSAD
General information
Household amenities, (%), Census 2001
Area (Sq. Kms.)
3035
Households with kutchha houses
2.6
Percent to total state’s area
1.5
Households with safe drinking water
75.9
C D Blocks
5
Households with electricity connection
83.2
Towns
18 Vital rates
No. of Villages
450
Crude Birth Rate, 2001
22.7
Total Fertility Rate, 2001
2.5
Demographic particulars (Census, 2001)
Infant Mortality Rate, 2001
38
Population
Key RCH indicators from District Level
Household Survey, 2007-08 (%)
Persons 1410553
Girls marrying below 18 years
13.8
Males 734799
Birth order 3 and above
23.3
Females 675754
Current use of any FP Method
64.3
Rural (%)
70.5
Total unmet need
20.5
Urban (%)
Scheduled Castes (%)
29.5 Pregnant women who had at least with 3 ANCs
2.6
visits during the last pregnancy
56.6
Scheduled Tribes (%)
54.8
Elderly population (60+ years) (%)
6.5
Young people (10-24 years) (%)
28.9
Institutional delivery
68.4
Adolescent (10-19 years) (%)
19.2
Decadal Growth Rate, 1991-2001 (%)
29.7
Children with full immunization
51.1
Population density (per sq. km)
465
Sex Ratio (females per 1000 males)
Medical/Health Infrastructures/
Institutions
1991
957
2001
920
CHCs
10
Child Sex Ratio (0-6 years) (girls per 1000 boys)
PHCs
39
1991
976
Sub-Centres
330
2001
933
Literacy rate
Information on HIV/AIDS
Persons
69.2
Males
77.9
HIV+ among ANC clinics (%)
0.00
Females
59.6
HIV+ among STD clinics (%)
-
Total work participation rate
Female work participation rate
46.1 Number of Integrated Counseling and Testing
33.8
Centres (ICTC formerly VCTC)
5
Number of Anti Retroviral Therapy (ART) Centres
-
| 55

7.2 Page 62

▲back to top


Maharashtra
at a glance

7.3 Page 63

▲back to top


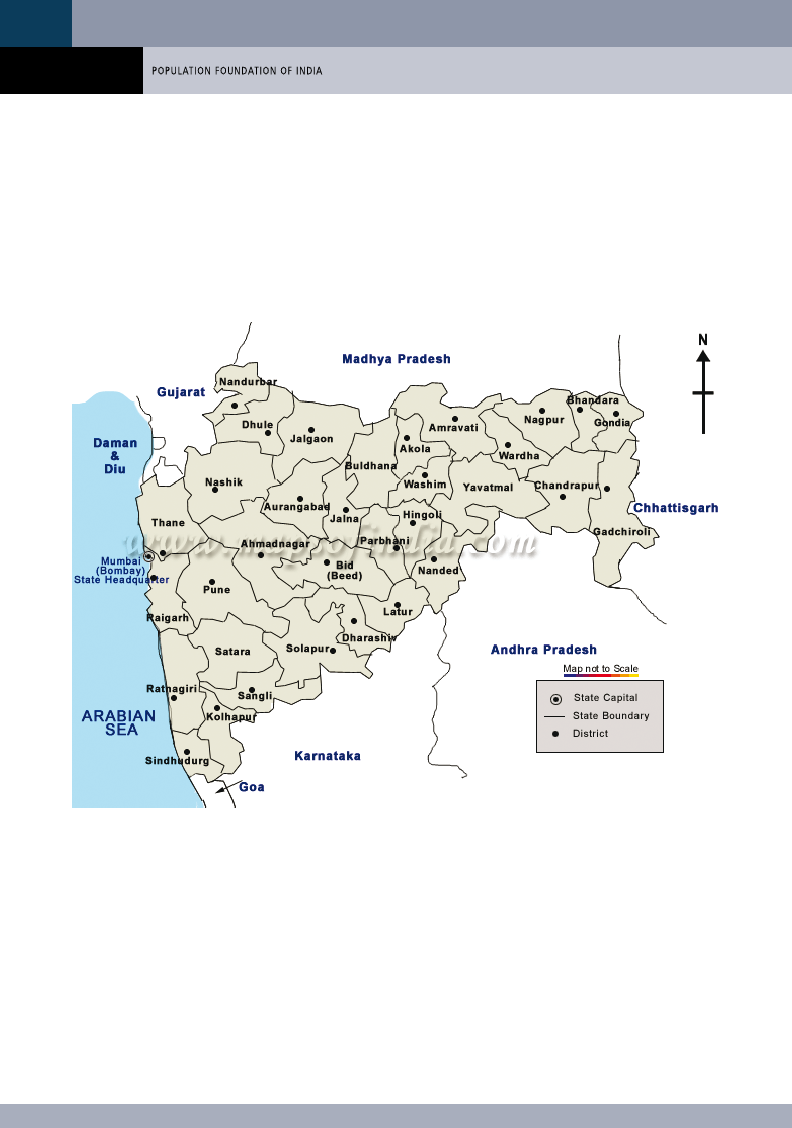
MAHARASHTRA
Showing
Districts
58 |

7.4 Page 64

▲back to top


STATE PROFILE
MAHARASHTRA
Key Demographic, Health and RCH Indicators at a glance
General information
Area (sq. kms.)
No. of Districts
No. of CD Blocks
No. of Villages
No. of Towns
Demographic particulars (Census, 2001)
Population
Persons
Males
Females
Rural (%)
Urban (%)
Scheduled Castes (%)
Scheduled Tribes (%)
Elderly population (60+ years) (%)
Young people (10-24 years) (%)
Adolescents (10-19 years) (%)
Decadal Growth Rate, 1991-2001 (%)
Population density (per sq. km)
Sex Ratio (females per 1000 males)
Child Sex Ratio (0-6 years) (girls per 1000 boys)
Literacy rate (7+)
Persons
Males
Females
Work participation rate
Female work participation rate
Proportion of people living below poverty line, 2004-05
Per capita net state domestic product at current prices in rupees, 2007-08
Human Development Index (HDI), 2001 (among 28 states)
Value
Rank
Social Development Index (SDI), 2001 (among 20 major states)
Rural
Value
Rank
Urban
Value
Rank
Household amenities (%), Census 2001
Households with kutchha houses
Households with safe drinking water
Households with electricity connection
Vital indices
Crude Birth Rate (CBR), 2008, SRS
Total Fertility Rate (TFR), 2007, SRS
307713
35
353
43711
33
96878627
50400596
46478031
57.6
42.4
10.2
8.9
8.7
30.8
21.6
22.7
315
922
913
76.9
86.0
67.0
42.5
30.8
25.2
NA
0.743
3
40.16
10
46.48
12
7.8
79.8
77.5
17.9
2.0
| 59

7.5 Page 65

▲back to top


Age Specific Fertility Rates, 2007, SRS
15-19 years
20-24 years
25-29 years
30-34 years
35-39 years
40-44 years
45-49 years
General Fertility Rate, 2007,SRS
Gross Reproduction Rate, 2007, SRS
Life Expectancy at Birth, 2000-2004, SRS
Crude Death Rate (CDR), 2008, SRS
Maternal Mortality Ratio (MMR), 2004-06, RGI
Child Mortality Rate(CMR), 2007, SRS
Infant Mortality Rate (IMR), 2008, SRS
Neo-natal mortality rate, 2007, SRS
Early neo-natal mortality rate, 2007, SRS
Late neo-natal mortality rate, 2007, SRS
Post neo-natal mortality rate, 2007, SRS
Peri-natal mortality rate, 2007, SRS
Still birth rate, 2007, SRS
Key RCH and nutrition indicators (%)
Girls marrying below 18 years, DLHS, 2007-08
Women(20-24) reporting birth of order 2 & above, DLHS, 2007-08
Current use of any FP method, DLHS, 2007-08
Total unmet need, DLHS, 2007-08
Mothers who received any antenatal check-up, DLHS, 2007-08
Mothers who had three or more ANC, DLHS, 2007-08
Mothers who consumed 100 IFA tablets, DLHS, 2007-08
Safe delivery, DLHS, 2007-08
Institutional delivery, DLHS, 2007-08
Children with full immunization (12-23 months), DLHS, 2007-08
Children under 3 years who are underweight, NFHS-3, 2005-06
Children under 3 years who are stunted, NFHS-3, 2005-06
Children under 3 years who are wasted, NFHS-3, 2005-06
Children age 6-59 months who are anaemic, NFHS-3, 2005-06
Ever married women age 15-49 years who are anaemic, NFHS-3, 2005-06
Medical/Health Infrastructures/Institutions
Community Health Centres (CHCs)
Primary Health Centres (PHCs)
Sub Centres (SCs)
Information on HIV/AIDS (%)
Women who have heard of HIV/AIDS, NFHS-3, 2005-06
Men who have heard of HIV/AIDS, NFHS-3, 2005-06
Women who know that consistent condom use can reduce the chances of getting HIV/AIDS, NFHS-3,
2005-06
Men who know that consistent condom use can reduce the chances of getting HIV/AIDS, NFHS-3,
2005-06
HIV+ among ANC clinics (%)
HIV+ among STD clinics (%)
Number of Integrated Counseling and Testing Centres (ICTC formerly VCTC)
Number of Prevention of Parent To Child Transmission Centres (PPTCTC)
Number of Anti Retroviral Therapy (ART) Centres
41.6
194.2
112.1
38.8
9.3
2.0
0.6
68.4
0.9
66.6
6.6
130
8
33
25
21
5
9
32
12
17.7
51.0
63.8
14.2
91.8
76.0
45.7
69.4
63.6
69.1
37.0
46.3
16.5
63.4
48.4
407
1816
10579
81.6
92.5
46.9
80.4
0.87
13.2
606
587
39
60 |

7.6 Page 66

▲back to top


districts
at a glance

7.7 Page 67

▲back to top


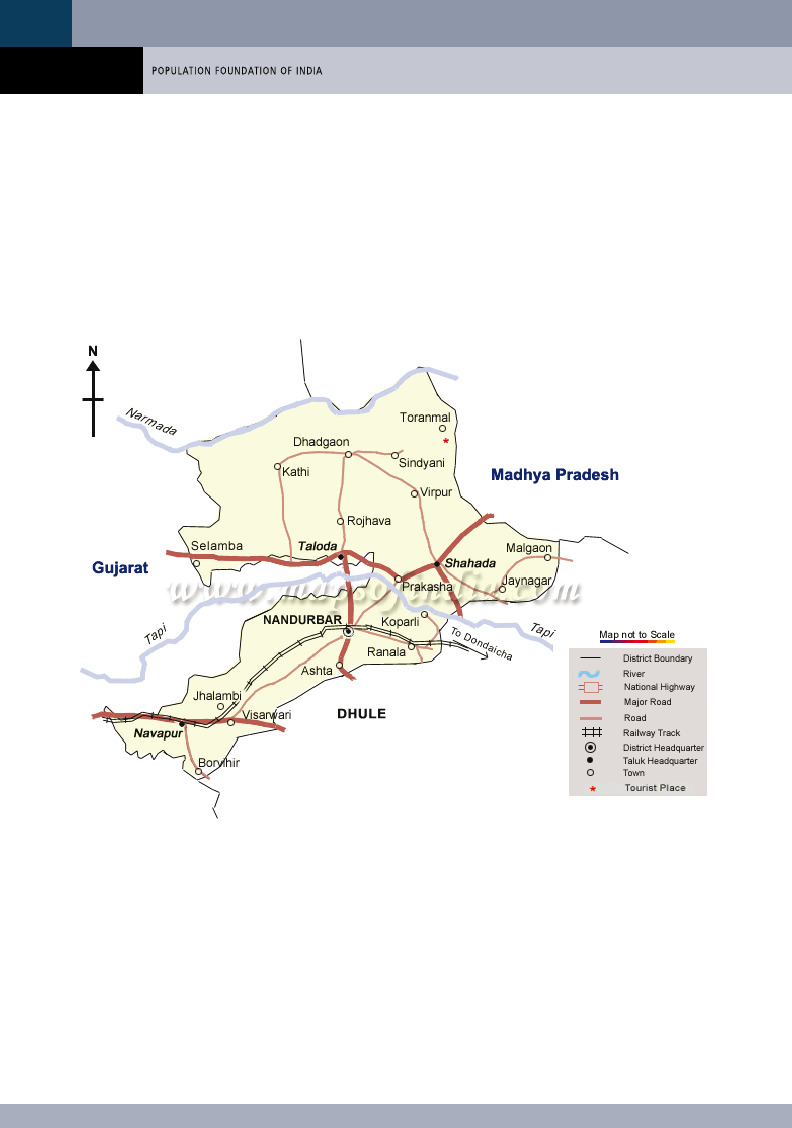
district
NANDURBAR
Showing CD Blocks
62 |

7.8 Page 68

▲back to top


DISTRICT NANDURBAR
General information
Household amenities, (%), Census 2001
Area (Sq. Kms.)
5955
Households with kutchha houses
17.6
Percent to total state’s area
1.9
Households with safe drinking water
83.9
C D Blocks
9
Households with electricity connection
47.2
Towns
5 Vital rates
No. of Villages
935
Crude Birth Rate, 2001
27.0
Total Fertility Rate, 2001
3.3
Demographic particulars (Census, 2001)
Infant Mortality Rate, 2001
68
Population
Key RCH indicators from District Level
Household Survey, 2007-08 (%)
Persons 1311709
Girls marrying below 18 years
25.5
Males 663511
Birth order 3 and above
41.8
Females 648198
Current use of any FP Method
58.8
Rural (%)
85.5
Total unmet need
19.1
Urban (%)
Scheduled Castes (%)
15.5 Pregnant women who had at least with 3 ANCs
3.2
visits during the last pregnancy
38.3
Scheduled Tribes (%)
65.5
Elderly population (60+ years) (%)
7.2
Young people (10-24 years) (%)
30.8
Institutional delivery
25.3
Adolescent (10-19 years) (%)
22.8
Decadal Growth Rate, 1991-2001 (%)
23.2
Children with full immunization
22.4
Population density (per sq. km)
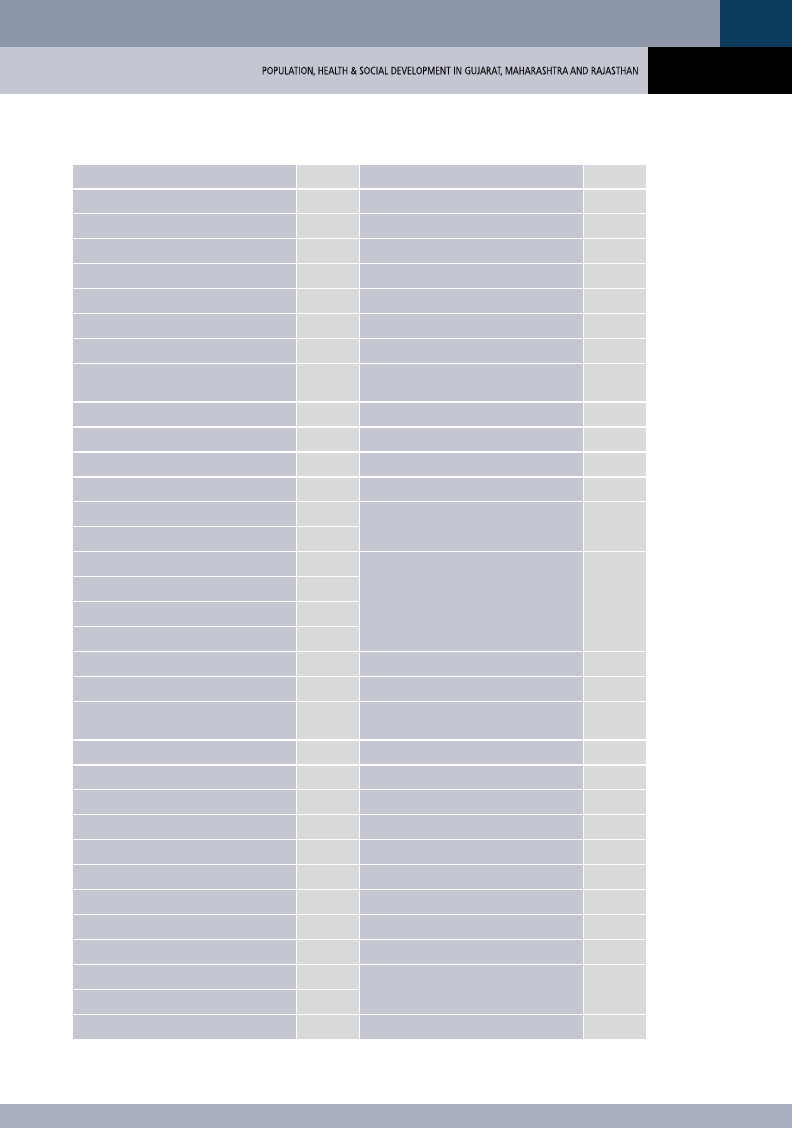
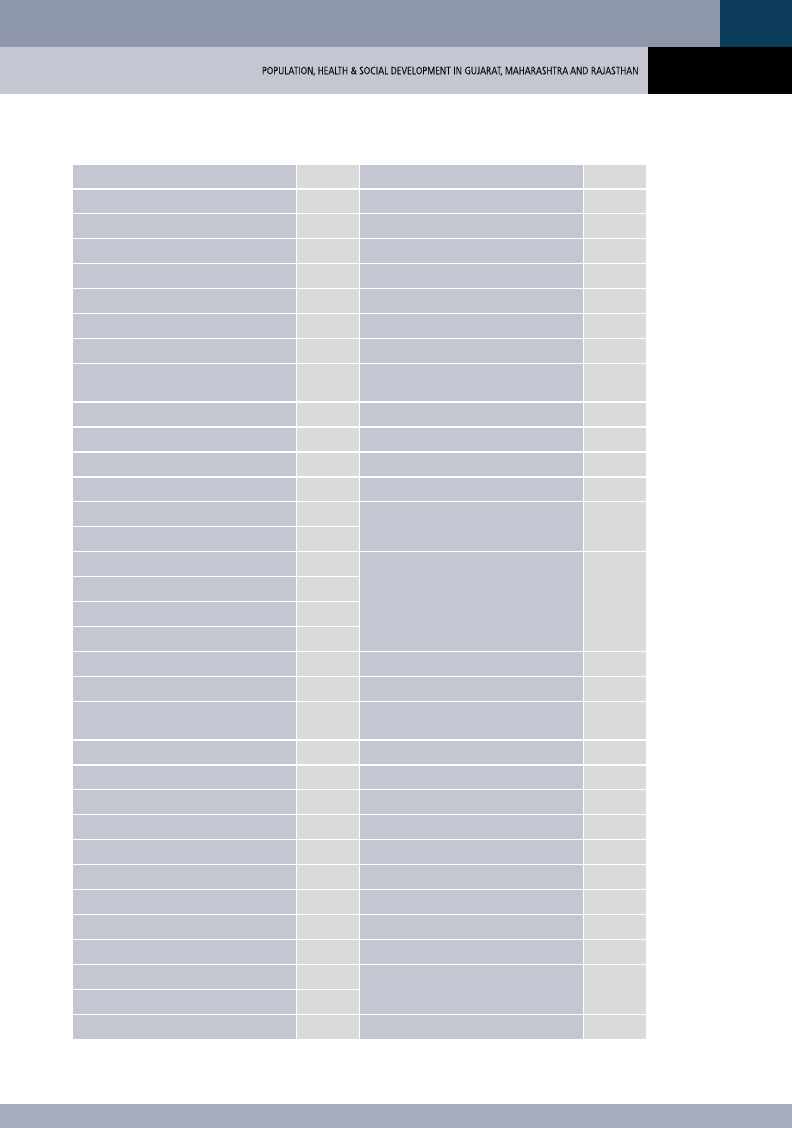
220
Sex Ratio (females per 1000 males)
Medical/Health Infrastructures/
Institutions
1991
975
2001
977
CHCs
12
Child Sex Ratio (0-6 years) (girls per 1000 boys)
PHCs
58
1991
980
Sub-Centres
290
2001
961
Literacy rate
Information on HIV/AIDS
Persons
55.8
Males
66.2
HIV+ among ANC clinics (%)
0.75
Females
45.2
HIV+ among STD clinics (%)
-
Total work participation rate
Female work participation rate
46.5 Number of Integrated Counseling and Testing
41.0
Centres (ICTC formerly VCTC)
13
Number of Anti Retroviral Therapy (ART) Centres
1
| 63

7.9 Page 69

▲back to top


district
DHULE
Showing CD Blocks
64 |

7.10 Page 70

▲back to top


DISTRICT DHULE
General information
Household amenities, (%), Census 2001
Area (Sq. Kms.)
7195
Households with kutchha houses
25.0
Percent to total state’s area
2.34
Households with safe drinking water
87.6
C D Blocks
4
Households with electricity connection
72.6
Towns
3 Vital rates
No. of Villages
678
Crude Birth Rate, 2001
22.5
Total Fertility Rate, 2001
2.7
Demographic particulars (Census, 2001)
Infant Mortality Rate, 2001
59
Population
Key RCH indicators from District Level
Household Survey, 2007-08 (%)
Persons 1707947
Girls marrying below 18 years
15.5
Males 878372
Birth order 3 and above
26.5
Females 829575
Current use of any FP Method
69.7
Rural (%)
73.9
Total unmet need
10.9
Urban (%)
Scheduled Castes (%)
26.1 Pregnant women who had at least with 3 ANCs
6.4
visits during the last pregnancy
51.7
Scheduled Tribes (%)
26.0
Elderly population (60+ years) (%)
9.3
Young people (10-24 years) (%)
31.5
Institutional delivery
50.5
Adolescent (10-19 years) (%)
22.7
Decadal Growth Rate, 1991-2001 (%)
16.0
Children with full immunization
39.7
Population density (per sq. km)
237
Sex Ratio (females per 1000 males)
Medical/Health Infrastructures/
Institutions
1991
945
2001
944
CHCs
7
Child Sex Ratio (0-6 years) (girls per 1000 boys)
PHCs
41
1991
945
Sub-Centres
232
2001
906
Literacy rate
Information on HIV/AIDS
Persons
71.7
Males
81.4
HIV+ among ANC clinics (%)
2.25
Females
61.4
HIV+ among STD clinics (%)
-
Total work participation rate
Female work participation rate
43.2 Number of Integrated Counseling and Testing
34.2
Centres (ICTC formerly VCTC)
12
Number of Anti Retroviral Therapy (ART) Centres
1
| 65

8 Pages 71-80

▲back to top


8.1 Page 71

▲back to top


district
JALGAON
Showing CD Blocks
66 |

8.2 Page 72

▲back to top


DISTRICT JALGAON
General information
Household amenities, (%), Census 2001
Area (Sq. Kms.)
11765
Households with kutchha houses
30.9
Percent to total state’s area
3.82
Households with safe drinking water
93.1
C D Blocks
15
Households with electricity connection
79.3
Towns
15 Vital rates
No. of Villages
1491
Crude Birth Rate, 2001
21.7
Total Fertility Rate, 2001
2.7
Demographic particulars (Census, 2001)
Infant Mortality Rate, 2001
52
Population
Key RCH indicators from District Level
Household Survey, 2007-08 (%)
Persons 3682690
Girls marrying below 18 years
20.1
Males 1905493
Birth order 3 and above
32.9
Females 1777197
Current use of any FP Method
68.7
Rural (%)
71.4
Total unmet need
11.3
Urban (%)
Scheduled Castes (%)
28.6 Pregnant women who had at least with 3 ANCs
7.8
visits during the last pregnancy
59.5
Scheduled Tribes (%)
11.8
Elderly population (60+ years) (%)
9.7
Young people (10-24 years) (%)
31.7
Institutional delivery
53.1
Adolescent (10-19 years) (%)
22.7
Decadal Growth Rate, 1991-2001 (%)
15.4
Children with full immunization
58.6
Population density (per sq. km)
313
Sex Ratio (females per 1000 males)
Medical/Health Infrastructures/
Institutions
1991
940
2001
933
CHCs
20
Child Sex Ratio (0-6 years) (girls per 1000 boys)
PHCs
77
1991
925
Sub-Centres
442
2001
880
Literacy rate
Information on HIV/AIDS
Persons
75.4
Males
85.9
HIV+ among ANC clinics (%)
3
Females
64.3
HIV+ among STD clinics (%)
10.8
Total work participation rate
Female work participation rate
42.5 Number of Integrated Counseling and Testing
33.0
Centres (ICTC formerly VCTC)
20
Number of Anti Retroviral Therapy (ART) Centres
1
| 67

8.3 Page 73

▲back to top


district
BULDANA
Showing CD Blocks
68 |

8.4 Page 74

▲back to top


DISTRICT BULDANA
General information
Household amenities, (%), Census 2001
Area (Sq. Kms.)
9661
Households with kutchha houses
6.3
Percent to total state’s area
3.1
Households with safe drinking water
70.1
C D Blocks
13
Households with electricity connection
62.2
Towns
11 Vital rates
No. of Villages
1297
Crude Birth Rate, 2001
23.5
Total Fertility Rate, 2001
3.0
Demographic particulars (Census, 2001)
Infant Mortality Rate, 2001
57
Population
Key RCH indicators from District Level
Household Survey, 2007-08 (%)
Persons 2232480
Girls marrying below 18 years
19.0
Males 1147403
Birth order 3 and above
20.6
Females 1085077
Current use of any FP Method
64.5
Rural (%)
78.8
Total unmet need
15.2
Urban (%)
Scheduled Castes (%)
21.2 Pregnant women who had at least with 3 ANCs
10.8
visits during the last pregnancy
67.6
Scheduled Tribes (%)
5.2
Elderly population (60+ years) (%)
9.9
Young people (10-24 years) (%)
31.7
Institutional delivery
66.6
Adolescent (10-19 years) (%)
23.3
Decadal Growth Rate, 1991-2001 (%)
18.0
Children with full immunization
73.0
Population density (per sq. km)
117
Sex Ratio (females per 1000 males)
Medical/Health Infrastructures/
Institutions
1991
953
2001
946
CHCs
14
Child Sex Ratio (0-6 years) (girls per 1000 boys)
PHCs
52
1991
945
Sub-Centres
280
2001
908
Literacy rate
Information on HIV/AIDS
Persons
75.8
Males
86.9
HIV+ among ANC clinics (%)
1.75
Females
64.1
HIV+ among STD clinics (%)
-
Total work participation rate
Female work participation rate
45.5 Number of Integrated Counseling and Testing
38.7
Centres (ICTC formerly VCTC)
20
Number of Anti Retroviral Therapy (ART) Centres
-
| 69

8.5 Page 75

▲back to top


district
AKOLA
Showing CD Blocks
70 |

8.6 Page 76

▲back to top


DISTRICT AKOLA
General information
Household amenities, (%), Census 2001
Area (Sq. Kms.)
5676
Households with kutchha houses
2.9
Percent to total state’s area
1.8
Households with safe drinking water
82.0
C D Blocks
7
Households with electricity connection
70.9
Towns
8 Vital rates
No. of Villages
862
Crude Birth Rate, 2001
22.3
Total Fertility Rate, 2001
2.7
Demographic particulars (Census, 2001)
Infant Mortality Rate, 2001
51
Population
Key RCH indicators from District Level
Household Survey, 2007-08 (%)
Persons 1630239
Girls marrying below 18 years
8.4
Males 841253
Birth order 3 and above
24.0
Females 788986
Current use of any FP Method
68.9
Rural (%)
61.5
Total unmet need
12.6
Urban (%)
Scheduled Castes (%)
38.5 Pregnant women who had at least with 3 ANCs
10.3
visits during the last pregnancy
69.4
Scheduled Tribes (%)
6.1
Elderly population (60+ years) (%)
9.4
Young people (10-24 years) (%)
31.8
Institutional delivery
74.4
Adolescent (10-19 years) (%)
22.9
Decadal Growth Rate, 1991-2001 (%)
20.5
Children with full immunization
76.7
Population density (per sq. km)
287
Sex Ratio (females per 1000 males)
Medical/Health Infrastructures/
Institutions
1991
934
2001
938
CHCs
6
Child Sex Ratio (0-6 years) (girls per 1000 boys)
PHCs
30
1991
946
Sub-Centres
178
2001
933
Literacy rate
Information on HIV/AIDS
Persons
81.4
Males
88.9
HIV+ among ANC clinics (%)
1.25
Females
73.4
HIV+ among STD clinics (%)
9.2
Total work participation rate
Female work participation rate
39.8 Number of Integrated Counseling and Testing
26.9
Centres (ICTC formerly VCTC)
12
Number of Anti Retroviral Therapy (ART) Centres
1
| 71

8.7 Page 77

▲back to top


district
WASHIM
Showing CD Blocks
72 |

8.8 Page 78

▲back to top


DISTRICT WASHIM
General information
Household amenities, (%), Census 2001
Area (Sq. Kms.)
4898
Households with kutchha houses
3.1
Percent to total state’s area
1.6
Households with safe drinking water
58.6
C D Blocks
6
Households with electricity connection
57.2
Towns
4 Vital rates
No. of Villages
702
Crude Birth Rate, 2001
24.3
Total Fertility Rate, 2001
3.0
Demographic particulars (Census, 2001)
Infant Mortality Rate, 2001
53
Population
Key RCH indicators from District Level
Household Survey, 2007-08 (%)
Persons 1020216
Girls marrying below 18 years
23.4
Males 526094
Birth order 3 and above
23.3
Females 494122
Current use of any FP Method
66.9
Rural (%)
82.5
Total unmet need
14.7
Urban (%)
Scheduled Castes (%)
17.5 Pregnant women who had at least with 3 ANCs
15.9
visits during the last pregnancy
69.0
Scheduled Tribes (%)
7.0
Elderly population (60+ years) (%)
9.7
Young people (10-24 years) (%)
31.3
Institutional delivery
65.1
Adolescent (10-19 years) (%)
23.0
Decadal Growth Rate, 1991-2001 (%)
18.3
Children with full immunization
75.7
Population density (per sq. km)
208
Sex Ratio (females per 1000 males)
Medical/Health Infrastructures/
Institutions
1991
946
2001
939
CHCs
8
Child Sex Ratio (0-6 years) (girls per 1000 boys)
PHCs
25
1991
935
Sub-Centres
153
2001
917
Literacy rate
Information on HIV/AIDS
Persons
73.4
Males
85.4
HIV+ among ANC clinics (%)
0.25
Females
60.6
HIV+ among STD clinics (%)
-
Total work participation rate
Female work participation rate
44.6 Number of Integrated Counseling and Testing
38.0
Centres (ICTC formerly VCTC)
9
Number of Anti Retroviral Therapy (ART) Centres
-
| 73

8.9 Page 79

▲back to top


district
AMRAVATI
Showing CD Blocks
74 |

8.10 Page 80

▲back to top


DISTRICT AMRAVATI
General information
Household amenities, (%), Census 2001
Area (Sq. Kms.)
12210
Households with kutchha houses
2.6
Percent to total state’s area
4.0
Households with safe drinking water
84.5
C D Blocks
14
Households with electricity connection
72.1
Towns
11 Vital rates
No. of Villages
1679
Crude Birth Rate, 2001
21.2
Total Fertility Rate, 2001
2.5
Demographic particulars (Census, 2001)
Infant Mortality Rate, 2001
65
Population
Key RCH indicators from District Level
Household Survey, 2007-08 (%)
Persons
2607160
Girls marrying below 18 years
9.8
Males
1345614
Birth order 3 and above
25.4
Females
1261546
Current use of any FP Method
72.7
Rural (%)
65.5
Total unmet need
10.3
Urban (%)
Scheduled Castes (%)
34.5 Pregnant women who had at least with 3 ANCs
17.1
visits during the last pregnancy
77.8
Scheduled Tribes (%)
13.7
Elderly population (60+ years) (%)
10.0
Young people (10-24 years) (%)
31.3
Institutional delivery
63.6
Adolescent (10-19 years) (%)
22.3
Decadal Growth Rate, 1991-2001 (%)
18.5
Children with full immunization
65.7
Population density (per sq. km)
132
Sex Ratio (females per 1000 males)
Medical/Health Infrastructures/
Institutions
1991
936
2001
938
CHCs
13
Child Sex Ratio (0-6 years) (girls per 1000 boys)
PHCs
56
1991
950
Sub-Centres
333
2001
941
Literacy rate
Information on HIV/AIDS
Persons
82.5
Males
88.9
HIV+ among ANC clinics (%)
0.50
Females
75.7
HIV+ among STD clinics (%)
-
Total work participation rate
Female work participation rate
42.0 Number of Integrated Counseling and Testing
29.5
Centres (ICTC formerly VCTC)
16
Number of Anti Retroviral Therapy (ART) Centres
-
| 75

9 Pages 81-90

▲back to top


9.1 Page 81

▲back to top


district
WARDHA
Showing CD Blocks
76 |

9.2 Page 82

▲back to top


DISTRICT WARDHA
General information
Household amenities, (%), Census 2001
Area (Sq. Kms.)
6309
Households with kutchha houses
2.6
Percent to total state’s area
2.1
Households with safe drinking water
68.4
C D Blocks
8
Households with electricity connection
80.2
Towns
7 Vital rates
No. of Villages
1004
Crude Birth Rate, 2001
19.2
Total Fertility Rate, 2001
2.3
Demographic particulars (Census, 2001)
Infant Mortality Rate, 2001
56
Population
Key RCH indicators from District Level
Household Survey, 2007-08 (%)
Persons 1236736
Girls marrying below 18 years
-
Males 638990
Birth order 3 and above
13.2
Females 597746
Current use of any FP Method
78.6
Rural (%)
73.7
Total unmet need
6.4
Urban (%)
Scheduled Castes (%)
26.3 Pregnant women who had at least with 3 ANCs
12.8
visits during the last pregnancy
88.2
Scheduled Tribes (%)
12.5
Elderly population (60+ years) (%)
10.9
Young people (10-24 years) (%)
30.4
Institutional delivery
81.4
Adolescent (10-19 years) (%)
21.3
Decadal Growth Rate, 1991-2001 (%)
15.3
Children with full immunization
87.9
Population density (per sq. km)
196
Sex Ratio (females per 1000 males)
Medical/Health Infrastructures/
Institutions
1991
939
2001
935
CHCs
8
Child Sex Ratio (0-6 years) (girls per 1000 boys)
PHCs
27
1991
952
Sub-Centres
181
2001
928
Literacy rate
Information on HIV/AIDS
Persons
80.1
Males
87.2
HIV+ among ANC clinics (%)
0.50
Females
72.5
HIV+ among STD clinics (%)
-
Total work participation rate
Female work participation rate
44.5 Number of Integrated Counseling and Testing
33.8
Centres (ICTC formerly VCTC)
12
Number of Anti Retroviral Therapy (ART) Centres
1
| 77

9.3 Page 83

▲back to top


district
NAGPUR
Showing CD Blocks
78 |

9.4 Page 84

▲back to top


DISTRICT NAGPUR
General information
Household amenities, (%), Census 2001
Area (Sq. Kms.)
9892
Households with kutchha houses
3.4
Percent to total state’s area
3.2
Households with safe drinking water
82.0
C D Blocks
14
Households with electricity connection
86.3
Towns
29 Vital rates
No. of Villages
1628
Crude Birth Rate, 2001
20.2
Total Fertility Rate, 2001
2.2
Demographic particulars (Census, 2001)
Infant Mortality Rate, 2001
52
Population
Key RCH indicators from District Level
Household Survey, 2007-08 (%)
Persons 4067637
Girls marrying below 18 years
1.2
Males 2105314
Birth order 3 and above
15.1
Females 1962323
Current use of any FP Method
70.4
Rural (%)
35.7
Total unmet need
12.4
Urban (%)
Scheduled Castes (%)
64.3 Pregnant women who had at least with 3 ANCs
17.2
visits during the last pregnancy
95.0
Scheduled Tribes (%)
11.0
Elderly population (60+ years) (%)
8.3
Young people (10-24 years) (%)
30.4
Institutional delivery
82.2
Adolescent (10-19 years) (%)
21.5
Decadal Growth Rate, 1991-2001 (%)
23.3
Children with full immunization
86.0
Population density (per sq. km)
411
Sex Ratio (females per 1000 males)
Medical/Health Infrastructures/
Institutions
1991
922
2001
932
CHCs
11
Child Sex Ratio (0-6 years) (girls per 1000 boys)
PHCs
49
1991
951
Sub-Centres
316
2001
941
Literacy rate
Information on HIV/AIDS
Persons
84.0
Males
90.2
HIV+ among ANC clinics (%)
1.75
Females
77.4
HIV+ among STD clinics (%)
20.4
Total work participation rate
Female work participation rate
37.8 Number of Integrated Counseling and Testing
22.8
Centres (ICTC formerly VCTC)
23
Number of Anti Retroviral Therapy (ART) Centres
2
| 79

9.5 Page 85

▲back to top


district
BHANDARA
Showing CD Blocks
80 |

9.6 Page 86

▲back to top


DISTRICT BHANDARA
General information
Household amenities, (%), Census 2001
Area (Sq. Kms.)
4087
Households with kutchha houses
2.1
Percent to total state’s area
1.3
Households with safe drinking water
65.3
C D Blocks
7
Households with electricity connection
69.9
Towns
6 Vital rates
No. of Villages
778
Crude Birth Rate, 2001
20.7
Total Fertility Rate, 2001
2.4
Demographic particulars (Census, 2001)
Infant Mortality Rate, 2001
63
Population
Key RCH indicators from District Level
Household Survey, 2007-08 (%)
Persons 1136146
Girls marrying below 18 years
2.1
Males 573445
Birth order 3 and above
14.5
Females 562701
Current use of any FP Method
70.3
Rural (%)
84.5
Total unmet need
11.5
Urban (%)
Scheduled Castes (%)
15.5 Pregnant women who had at least with 3 ANCs
17.8
visits during the last pregnancy
85.5
Scheduled Tribes (%)
8.6
Elderly population (60+ years) (%)
8.8
Young people (10-24 years) (%)
30.7
Institutional delivery
57.0
Adolescent (10-19 years) (%)
21.8
Decadal Growth Rate, 1991-2001 (%)
11.2
Children with full immunization
71.0
Population density (per sq. km)
278
Sex Ratio (females per 1000 males)
Medical/Health Infrastructures/
Institutions
1991
980
2001
981
CHCs
8
Child Sex Ratio (0-6 years) (girls per 1000 boys)
PHCs
33
1991
963
Sub-Centres
193
2001
956
Literacy rate
Information on HIV/AIDS
Persons
78.5
Males
89.0
HIV+ among ANC clinics (%)
0.75
Females
67.8
HIV+ among STD clinics (%)
-
Total work participation rate
Female work participation rate
47.3 Number of Integrated Counseling and Testing
41.6
Centres (ICTC formerly VCTC)
12
Number of Anti Retroviral Therapy (ART) Centres
1
| 81

9.7 Page 87

▲back to top


district
GONDIYA
Showing CD Blocks
82 |

9.8 Page 88

▲back to top


DISTRICT GONDIYA
General information
Household amenities, (%), Census 2001
Area (Sq. Kms.)
5234
Households with kutchha houses
2.0
Percent to total state’s area
1.7
Households with safe drinking water
53.0
C D Blocks
8
Households with electricity connection
58.4
Towns
2 Vital rates
No. of Villages
893
Crude Birth Rate, 2001
21.8
Total Fertility Rate, 2001
2.5
Demographic particulars (Census, 2001)
Infant Mortality Rate, 2001
73
Population
Key RCH indicators from District Level
Household Survey, 2007-08 (%)
Persons 1200707
Girls marrying below 18 years
3.0
Males 598834
Birth order 3 and above
20.6
Females 601873
Current use of any FP Method
65.7
Rural (%)
88.1
Total unmet need
13.3
Urban (%)
Scheduled Castes (%)
11.9 Pregnant women who had at least with 3 ANCs
14.0
visits during the last pregnancy
84.5
Scheduled Tribes (%)
16.4
Elderly population (60+ years) (%)
8.2
Young people (10-24 years) (%)
30.4
Institutional delivery
92.1
Adolescent (10-19 years) (%)
21.8
Decadal Growth Rate, 1991-2001 (%)
10.5
Children with full immunization
86.4
Population density (per sq. km)
229
Sex Ratio (females per 1000 males)
Medical/Health Infrastructures/
Institutions
1991
995
2001
1005
CHCs
10
Child Sex Ratio (0-6 years) (girls per 1000 boys)
PHCs
39
1991
978
Sub-Centres
237
2001
958
Literacy rate
Information on HIV/AIDS
Persons
78.5
Males
89.6
HIV+ among ANC clinics (%)
1.25
Females
67.6
HIV+ among STD clinics (%)
-
Total work participation rate
Female work participation rate
48.3 Number of Integrated Counseling and Testing
43.3
Centres (ICTC formerly VCTC)
12
Number of Anti Retroviral Therapy (ART) Centres
-
| 83

9.9 Page 89

▲back to top


district
GADCHIROLI
Showing CD Blocks
84 |

9.10 Page 90

▲back to top


DISTRICT GADCHIROLI
General information
Household amenities, (%), Census 2001
Area (Sq. Kms.)
14412
Households with kutchha houses
5.1
Percent to total state’s area
4.7
Households with safe drinking water
58.5
C D Blocks
12
Households with electricity connection
43.6
Towns
2 Vital rates
No. of Villages
1521
Crude Birth Rate, 2001
25.8
Total Fertility Rate, 2001
2.9
Demographic particulars (Census, 2001)
Infant Mortality Rate, 2001
87
Population
Key RCH indicators from District Level
Household Survey, 2007-08 (%)
Persons 970294
Girls marrying below 18 years
9.9
Males 491101
Birth order 3 and above
31.5
Females 479193
Current use of any FP Method
59.1
Rural (%)
93.1
Total unmet need
17.3
Urban (%)
Scheduled Castes (%)
6.9 Pregnant women who had at least with 3 ANCs
11.2
visits during the last pregnancy
71.7
Scheduled Tribes (%)
38.3
Elderly population (60+ years) (%)
7.0
Young people (10-24 years) (%)
30.2
Institutional delivery
23.6
Adolescent (10-19 years) (%)
31.9
Decadal Growth Rate, 1991-2001 (%)
23.3
Children with full immunization
43.4
Population density (per sq. km)
67
Sex Ratio (females per 1000 males)
Medical/Health Infrastructures/
Institutions
1991
976
2001
976
CHCs
12
Child Sex Ratio (0-6 years) (girls per 1000 boys)
PHCs
45
1991
980
Sub-Centres
376
2001
965
Literacy rate
Information on HIV/AIDS
Persons
60.1
Males
71.7
HIV+ among ANC clinics (%)
0.50
Females
48.1
HIV+ among STD clinics (%)
-
Total work participation rate
Female work participation rate
51.2 Number of Integrated Counseling and Testing
46.9
Centres (ICTC formerly VCTC)
14
Number of Anti Retroviral Therapy (ART) Centres
1
| 85

10 Pages 91-100

▲back to top


10.1 Page 91

▲back to top


district
CHANDRAPUR
Showing CD Blocks
86 |

10.2 Page 92

▲back to top


DISTRICT CHANDRAPUR
General information
Household amenities, (%), Census 2001
Area (Sq. Kms.)
11443
Households with kutchha houses
3.9
Percent to total state’s area
3.7
Households with safe drinking water
67.1
C D Blocks
14
Households with electricity connection
62.0
Towns
14 Vital rates
No. of Villages
1472
Crude Birth Rate, 2001
20.9
Total Fertility Rate, 2001
2.4
Demographic particulars (Census, 2001)
Infant Mortality Rate, 2001
69
Population
Key RCH indicators from District Level
Household Survey, 2007-08 (%)
Persons 2071101
Girls marrying below 18 years
2.3
Males 1062993
Birth order 3 and above
9.6
Females 1008108
Current use of any FP Method
67.5
Rural (%)
67.9
Total unmet need
10.2
Urban (%)
Scheduled Castes (%)
32.1 Pregnant women who had at least with 3 ANCs
14.3
visits during the last pregnancy
82.4
Scheduled Tribes (%)
18.1
Elderly population (60+ years) (%)
8.4
Young people (10-24 years) (%)
31.0
Institutional delivery
54.8
Adolescent (10-19 years) (%)
21.9
Decadal Growth Rate, 1991-2001 (%)
17.3
Children with full immunization
75.5
Population density (per sq. km)
181
Sex Ratio (females per 1000 males)
Medical/Health Infrastructures/
Institutions
1991
948
2001
948
CHCs
13
Child Sex Ratio (0-6 years) (girls per 1000 boys)
PHCs
58
1991
965
Sub-Centres
339
2001
939
Literacy rate
Information on HIV/AIDS
Persons
73.2
Males
82.9
HIV+ among ANC clinics (%)
3.50
Females
62.9
HIV+ among STD clinics (%)
8.4
Total work participation rate
Female work participation rate
44.9 Number of Integrated Counseling and Testing
36.0
Centres (ICTC formerly VCTC)
15
Number of Anti Retroviral Therapy (ART) Centres
2
| 87

10.3 Page 93

▲back to top


district
YAVATMAL
Showing CD Blocks
88 |

10.4 Page 94

▲back to top


DISTRICT YAVATMAL
General information
Household amenities, (%), Census 2001
Area (Sq. Kms.)
13582
Households with kutchha houses
3.1
Percent to total state’s area
4.4
Households with safe drinking water
63.2
C D Blocks
16
Households with electricity connection
54.8
Towns
13 Vital rates
No. of Villages
1856
Crude Birth Rate, 2001
23.7
Total Fertility Rate, 2001
2.9
Demographic particulars (Census, 2001)
Infant Mortality Rate, 2001
60
Population
Key RCH indicators from District Level
Household Survey, 2007-08 (%)
Persons 2458271
Girls marrying below 18 years
11.1
Males 1265681
Birth order 3 and above
21.9
Females 1192590
Current use of any FP Method
67.6
Rural (%)
81.4
Total unmet need
13.4
Urban (%)
Scheduled Castes (%)
18.6 Pregnant women who had at least with 3 ANCs
10.3
visits during the last pregnancy
70.6
Scheduled Tribes (%)
19.3
Elderly population (60+ years) (%)
9.2
Young people (10-24 years) (%)
31.3
Institutional delivery
53.5
Adolescent (10-19 years) (%)
22.3
Decadal Growth Rate, 1991-2001 (%)
18.5
Children with full immunization
75.5
Population density (per sq. km)
181
Sex Ratio (females per 1000 males)
Medical/Health Infrastructures/
Institutions
1991
951
2001
942
CHCs
17
Child Sex Ratio (0-6 years) (girls per 1000 boys)
PHCs
63
1991
961
Sub-Centres
435
2001
932
Literacy rate
Information on HIV/AIDS
Persons
73.6
Males
84.1
HIV+ among ANC clinics (%)
2.75
Females
62.5
HIV+ among STD clinics (%)
-
Total work participation rate
Female work participation rate
44.5 Number of Integrated Counseling and Testing
37.2
Centres (ICTC formerly VCTC)
19
Number of Anti Retroviral Therapy (ART) Centres
1
| 89

10.5 Page 95

▲back to top


district
NANDED
Showing CD Blocks
90 |

10.6 Page 96

▲back to top


DISTRICT NANDED
General information
Household amenities, (%), Census 2001
Area (Sq. Kms.)
10528
Households with kutchha houses
6.5
Percent to total state’s area
3.4
Households with safe drinking water
77.4
C D Blocks
16
Households with electricity connection
61.3
Towns
13 Vital rates
No. of Villages
1546
Crude Birth Rate, 2001
25.5
Total Fertility Rate, 2001
3.3
Demographic particulars (Census, 2001)
Infant Mortality Rate, 2001
59
Population
Key RCH indicators from District Level
Household Survey, 2007-08 (%)
Persons 2876259
Girls marrying below 18 years
32.0
Males 1481358
Birth order 3 and above
30.2
Females 1394901
Current use of any FP Method
60.1
Rural (%)
76.0
Total unmet need
16.5
Urban (%)
Scheduled Castes (%)
24.0 Pregnant women who had at least with 3 ANCs
17.3
visits during the last pregnancy
74.5
Scheduled Tribes (%)
8.8
Elderly population (60+ years) (%)
9.3
Young people (10-24 years) (%)
31.4
Institutional delivery
55.8
Adolescent (10-19 years) (%)
23.4
Decadal Growth Rate, 1991-2001 (%)
23.1
Children with full immunization
79.4
Population density (per sq. km)
273
Sex Ratio (females per 1000 males)
Medical/Health Infrastructures/
Institutions
1991
945
2001
942
CHCs
14
Child Sex Ratio (0-6 years) (girls per 1000 boys)
PHCs
64
1991
960
Sub-Centres
377
2001
928
Literacy rate
Information on HIV/AIDS
Persons
67.8
Males
80.4
HIV+ among ANC clinics (%)
1.0
Females
54.4
HIV+ among STD clinics (%)
-
Total work participation rate
Female work participation rate
41.8 Number of Integrated Counseling and Testing
34.4
Centres (ICTC formerly VCTC)
20
Number of Anti Retroviral Therapy (ART) Centres
1
| 91

10.7 Page 97

▲back to top


district
HINGOLI
Showing CD Blocks
92 |

10.8 Page 98

▲back to top


DISTRICT HINGOLI
General information
Area (Sq. Kms.)
Percent to total state’s area
C D Blocks
Towns
No. of Villages
Demographic particulars (Census, 2001)
Population
Persons
Males
Females
Rural (%)
Urban (%)
Scheduled Castes (%)
Scheduled Tribes (%)
Elderly population (60+ years) (%)
Young people (10-24 years) (%)
Adolescent (10-19 years) (%)
Decadal Growth Rate, 1991-2001 (%)
Population density (per sq. km)
Sex Ratio (females per 1000 males)
1991
2001
Child Sex Ratio (0-6 years) (girls per 1000 boys)
1991
2001
Literacy rate
Persons
Males
Females
Total work participation rate
Female work participation rate
Household amenities, (%), Census 2001
4827
Households with kutchha houses
1.6
Households with safe drinking water
5
Households with electricity connection
4 Vital rates
672
Crude Birth Rate, 2001
Total Fertility Rate, 2001
Infant Mortality Rate, 2001
Key RCH indicators from District Level
Household Survey, 2007-08 (%)
987160
Girls marrying below 18 years
505373
Birth order 3 and above
481787
Current use of any FP Method
84.4
Total unmet need
15.6 Pregnant women who had at least with 3 ANCs
10.2
visits during the last pregnancy
8.8
10.5
Institutional delivery
30.4
22.7
19.8
Children with full immunization
205
Medical/Health Infrastructures/
Institutions
952
953
CHCs
PHCs
958
Sub-Centres
926
Information on HIV/AIDS
66.3
80.7
HIV+ among ANC clinics (%)
51.2
HIV+ among STD clinics (%)
46.6 Number of Integrated Counseling and Testing
41.6
Centres (ICTC formerly VCTC)
Number of Anti Retroviral Therapy (ART) Centres
5.6
74.6
60.1
26.1
3.4
57
41.0
32.0
62.6
12.5
68.7
41.5
62.4
5
24
132
3.25
-
6
-
| 93

10.9 Page 99

▲back to top


district
PARBHANI
Showing CD Blocks
94 |

10.10 Page 100

▲back to top


DISTRICT PARBHANI
General information
Household amenities, (%), Census 2001
Area (Sq. Kms.)
6214
Households with kutchha houses
4.3
Percent to total state’s area
2.0
Households with safe drinking water
84.2
C D Blocks
9
Households with electricity connection
62.3
Towns
8 Vital rates
No. of Villages
830
Crude Birth Rate, 2001
25.2
Total Fertility Rate, 2001
3.3
Demographic particulars (Census, 2001)
Infant Mortality Rate, 2001
52
Population
Key RCH indicators from District Level
Household Survey, 2007-08 (%)
Persons 1527715
Girls marrying below 18 years
29.1
Males 780191
Birth order 3 and above
30.5
Females 747524
Current use of any FP Method
58.1
Rural (%)
68.2
Total unmet need
18.9
Urban (%)
Scheduled Castes (%)
31.8 Pregnant women who had at least with 3 ANCs
10.0
visits during the last pregnancy
67.7
Scheduled Tribes (%)
2.3
Elderly population (60+ years) (%)
10.5
Young people (10-24 years) (%)
30.4
Institutional delivery
64.7
Adolescent (10-19 years) (%)
22.9
Decadal Growth Rate, 1991-2001 (%)
15.3
Children with full immunization
76.7
Population density (per sq. km)
246
Sex Ratio (females per 1000 males)
Medical/Health Infrastructures/
Institutions
1991
954
2001
958
CHCs
8
Child Sex Ratio (0-6 years) (girls per 1000 boys)
PHCs
31
1991
953
Sub-Centres
214
2001
922
Literacy rate
Information on HIV/AIDS
Persons
66.1
Males
79.6
HIV+ among ANC clinics (%)
1.75
Females
52.0
HIV+ among STD clinics (%)
-
Total work participation rate
Female work participation rate
42.2 Number of Integrated Counseling and Testing
34.8
Centres (ICTC formerly VCTC)
10
Number of Anti Retroviral Therapy (ART) Centres
1
| 95

11 Pages 101-110

▲back to top


11.1 Page 101

▲back to top


district
JALNA
Showing
CD Blocks
96 |

11.2 Page 102

▲back to top


DISTRICT JALNA
General information
Household amenities, (%), Census 2001
Area (Sq. Kms.)
7718
Households with kutchha houses
12.4
Percent to total state’s area
2.5
Households with safe drinking water
74.2
C D Blocks
8
Households with electricity connection
61.1
Towns
4 Vital rates
No. of Villages
963
Crude Birth Rate, 2001
24.6
Total Fertility Rate, 2001
3.2
Demographic particulars (Census, 2001)
Infant Mortality Rate, 2001
61
Population
Key RCH indicators from District Level
Household Survey, 2007-08 (%)
Persons 1612980
Girls marrying below 18 years
34.1
Males 826903
Birth order 3 and above
25.0
Females 786077
Current use of any FP Method
55.6
Rural (%)
80.9
Total unmet need
21.1
Urban (%)
Scheduled Castes (%)
19.1 Pregnant women who had at least with 3 ANCs
11.2
visits during the last pregnancy
69.2
Scheduled Tribes (%)
2.0
Elderly population (60+ years) (%)
10.6
Young people (10-24 years) (%)
30.8
Institutional delivery
65.6
Adolescent (10-19 years) (%)
23.2
Decadal Growth Rate, 1991-2001 (%)
18.2
Children with full immunization
74.9
Population density (per sq. km)
209
Sex Ratio (females per 1000 males)
Medical/Health Infrastructures/
Institutions
1991
958
2001
951
CHCs
9
Child Sex Ratio (0-6 years) (girls per 1000 boys)
PHCs
39
1991
951
Sub-Centres
213
2001
903
Literacy rate
Information on HIV/AIDS
Persons
64.4
Males
79.1
HIV+ among ANC clinics (%)
2.25
Females
49.0
HIV+ among STD clinics (%)
-
Total work participation rate
Female work participation rate
44.4 Number of Integrated Counseling and Testing
38.4
Centres (ICTC formerly VCTC)
11
Number of Anti Retroviral Therapy (ART) Centres
1
| 97

11.3 Page 103

▲back to top


district
AURANGABAD
Showing CD Blocks
98 |

11.4 Page 104

▲back to top


DISTRICT AURANGABAD
General information
Household amenities, (%), Census 2001
Area (Sq. Kms.)
10107
Households with kutchha houses
15.3
Percent to total state’s area
3.3
Households with safe drinking water
79.8
C D Blocks
9
Households with electricity connection
76.9
Towns
9 Vital rates
No. of Villages
1300
Crude Birth Rate, 2001
24.1
Total Fertility Rate, 2001
3.1
Demographic particulars (Census, 2001)
Infant Mortality Rate, 2001
54
Population
Key RCH indicators from District Level
Household Survey, 2007-08 (%)
Persons 2897013
Girls marrying below 18 years
38.3
Males 1505363
Birth order 3 and above
33.0
Females 1391650
Current use of any FP Method
59.0
Rural (%)
62.5
Total unmet need
20.2
Urban (%)
Scheduled Castes (%)
37.5 Pregnant women who had at least with 3 ANCs
13.0
visits during the last pregnancy
58.0
Scheduled Tribes (%)
3.5
Elderly population (60+ years) (%)
8.9
Young people (10-24 years) (%)
31.9
Institutional delivery
65.7
Adolescent (10-19 years) (%)
23.2
Decadal Growth Rate, 1991-2001 (%)
32.0
Children with full immunization
65.9
Population density (per sq. km)
188
Sex Ratio (females per 1000 males)
Medical/Health Infrastructures/
Institutions
1991
922
2001
924
CHCs
8
Child Sex Ratio (0-6 years) (girls per 1000 boys)
PHCs
50
1991
933
Sub-Centres
279
2001
890
Literacy rate
Information on HIV/AIDS
Persons
72.9
Males
84.9
HIV+ among ANC clinics (%)
1.50
Females
60.1
HIV+ among STD clinics (%)
10.0
Total work participation rate
Female work participation rate
40.6 Number of Integrated Counseling and Testing
31.1
Centres (ICTC formerly VCTC)
20
Number of Anti Retroviral Therapy (ART) Centres
1
| 99

11.5 Page 105

▲back to top


district
NASHIK
Showing
CD Blocks
100 |

11.6 Page 106

▲back to top


DISTRICT NASHIK
General information
Household amenities, (%), Census 2001
Area (Sq. Kms.)
15530
Households with kutchha houses
15.3
Percent to total state’s area
5.1
Households with safe drinking water
70.3
C D Blocks
15
Households with electricity connection
69.8
Towns
18 Vital rates
No. of Villages
1923
Crude Birth Rate, 2001
25.0
Total Fertility Rate, 2001
3.1
Demographic particulars (Census, 2001)
Infant Mortality Rate, 2001
53
Population
Key RCH indicators from District Level
Household Survey, 2007-08 (%)
Persons 4993796
Girls marrying below 18 years
22.9
Males 2590912
Birth order 3 and above
23.7
Females 2402884
Current use of any FP Method
70.2
Rural (%)
61.2
Total unmet need
13.5
Urban (%)
Scheduled Castes (%)
38.8 Pregnant women who had at least with 3 ANCs
8.5
visits during the last pregnancy
72.6
Scheduled Tribes (%)
23.9
Elderly population (60+ years) (%)
7.5
Young people (10-24 years) (%)
32.0
Institutional delivery
63.4
Adolescent (10-19 years) (%)
22.7
Decadal Growth Rate, 1991-2001 (%)
29.5
Children with full immunization
66.5
Population density (per sq. km)
322
Sex Ratio (females per 1000 males)
Medical/Health Infrastructures/
Institutions
1991
940
2001
927
CHCs
26
Child Sex Ratio (0-6 years) (girls per 1000 boys)
PHCs
106
1991
954
Sub-Centres
577
2001
920
Literacy rate
Information on HIV/AIDS
Persons
74.4
Males
83.7
HIV+ among ANC clinics (%)
1.25
Females
64.4
HIV+ among STD clinics (%)
-
Total work participation rate
Female work participation rate
43.8 Number of Integrated Counseling and Testing
34.0
Centres (ICTC formerly VCTC)
36
Number of Anti Retroviral Therapy (ART) Centres
1
| 101

11.7 Page 107

▲back to top


district
THANE
Showing
CD Blocks
102 |

11.8 Page 108

▲back to top


DISTRICT THANE
General information
Household amenities, (%), Census 2001
Area (Sq. Kms.)
9558
Households with kutchha houses
3.8
Percent to total state’s area
3.1
Households with safe drinking water
85.9
C D Blocks
15
Households with electricity connection
89.7
Towns
37 Vital rates
No. of Villages
1727
Crude Birth Rate, 2001
23.4
Total Fertility Rate, 2001
2.6
Demographic particulars (Census, 2001)
Infant Mortality Rate, 2001
44
Population
Key RCH indicators from District Level
Household Survey, 2007-08 (%)
Persons 8131849
Girls marrying below 18 years
18.6
Males 4377747
Birth order 3 and above
26.4
Females 3754102
Current use of any FP Method
59.7
Rural (%)
27.0
Total unmet need
19.5
Urban (%)
Scheduled Castes (%)
72.6 Pregnant women who had at least with 3 ANCs
4.2
visits during the last pregnancy
83.3
Scheduled Tribes (%)
14.6
Elderly population (60+ years) (%)
5.2
Young people (10-24 years) (%)
30.5
Institutional delivery
71.8
Adolescent (10-19 years) (%)
20.3
Decadal Growth Rate, 1991-2001 (%)
54.9
Children with full immunization
80.5
Population density (per sq. km)
851
Sex Ratio (females per 1000 males)
Medical/Health Infrastructures/
Institutions
1991
879
2001
858
CHCs
14
Child Sex Ratio (0-6 years) (girls per 1000 boys)
PHCs
79
1991
952
Sub-Centres
492
2001
931
Literacy rate
Information on HIV/AIDS
Persons
80.7
Males
87.1
HIV+ among ANC clinics (%)
1.75
Females
73.1
HIV+ among STD clinics (%)
6.0
Total work participation rate
Female work participation rate
39.1 Number of Integrated Counseling and Testing
19.6
Centres (ICTC formerly VCTC)
36
Number of Anti Retroviral Therapy (ART) Centres
1
| 103

11.9 Page 109

▲back to top


district
MUMBAI
(SUBURBAN)
Showing CD Blocks
104 |

11.10 Page 110

▲back to top


DISTRICT MUMBAI (SUBURBAN)
General information
Household amenities, (%), Census 2001
Area (Sq. Kms.)
446
Households with kutchha houses
3.8
Percent to total state’s area
0.14
Households with safe drinking water
99.3
C D Blocks
-
Households with electricity connection
97.9
Towns
1 Vital rates
No. of Villages
-
Crude Birth Rate, 2001
18.2
Total Fertility Rate, 2001
2.0
Demographic particulars (Census, 2001)
Infant Mortality Rate, 2001
42
Population
Key RCH indicators from District Level
Household Survey, 2007-08 (%)
Persons 8640419
Girls marrying below 18 years
10.0
Males 4741720
Birth order 3 and above
20.1
Females 3898699
Current use of any FP Method
61.1
Rural (%)
0.0
Total unmet need
21.4
Urban (%)
Scheduled Castes (%)
100.0 Pregnant women who had at least with 3 ANCs
4.7
visits during the last pregnancy
90.0
Scheduled Tribes (%)
0.8
Elderly population (60+ years) (%)
6.0
Young people (10-24 years) (%)
31.0
Institutional delivery
93.3
Adolescent (10-19 years) (%)
20.0
Decadal Growth Rate, 1991-2001 (%)
27.2
Children with full immunization
86.7
Population density (per sq. km)
19373
Sex Ratio (females per 1000 males)
Medical/Health Infrastructures/
Institutions
1991
831
2001
822
CHCs
-
Child Sex Ratio (0-6 years) (girls per 1000 boys)
PHCs
-
1991
933
Sub-Centres
-
2001
922
Literacy rate
Information on HIV/AIDS
Persons
86.9
Males
91.6
HIV+ among ANC clinics (%)
5.0
Females
81.1
HIV+ among STD clinics (%)
-
Total work participation rate
Female work participation rate
36.5 Number of Integrated Counseling and Testing
12.8
Centres (ICTC formerly VCTC)
-
Number of Anti Retroviral Therapy (ART) Centres
5
| 105

12 Pages 111-120

▲back to top


12.1 Page 111

▲back to top


district
MUMBAI
Showing CD Blocks
106 |

12.2 Page 112

▲back to top


DISTRICT MUMBAI
General information
Household amenities, (%), Census 2001
Area (Sq. Kms.)
157
Households with kutchha houses
2.1
Percent to total state’s area
0.1
Households with safe drinking water
98.8
C D Blocks
-
Households with electricity connection
97.8
Towns
1 Vital rates
No. of Villages
-
Crude Birth Rate, 2001
14.6
Total Fertility Rate, 2001
1.6
Demographic particulars (Census, 2001)
Infant Mortality Rate, 2001
37
Population
Key RCH indicators from District Level
Household Survey, 2007-08 (%)
Persons 3338031
Girls marrying below 18 years
8.8
Males 1878246
Birth order 3 and above
23.0
Females 1459785
Current use of any FP Method
58.6
Rural (%)
0.0
Total unmet need
20.7
Urban (%)
Scheduled Castes (%)
100.0 Pregnant women who had at least with 3 ANCs
5.5
visits during the last pregnancy
91.7
Scheduled Tribes (%)
0.6
Elderly population (60+ years) (%)
7.7
Young people (10-24 years) (%)
30.6
Institutional delivery
91.9
Adolescent (10-19 years) (%)
18.8
Decadal Growth Rate, 1991-2001 (%)
4.8
Children with full immunization
81.5
Population density (per sq. km)
21261
Sex Ratio (females per 1000 males)
Medical/Health Infrastructures/
Institutions
1991
791
2001
777
CHCs
Child Sex Ratio (0-6 years) (girls per 1000 boys)
PHCs
-
1991
933
Sub-Centres
-
2001
921
Literacy rate
Information on HIV/AIDS
Persons
86.4
Males
90.2
HIV+ among ANC clinics (%)
2.25
Females
81.4
HIV+ among STD clinics (%)
21.2
Total work participation rate
Female work participation rate
39.3 Number of Integrated Counseling and Testing
13.7
Centres (ICTC formerly VCTC)
-
Number of Anti Retroviral Therapy (ART) Centres
-
| 107

12.3 Page 113

▲back to top


district
RAIGARH
Showing CD Blocks
108 |

12.4 Page 114

▲back to top


DISTRICT RAIGARH
General information
Household amenities, (%), Census 2001
Area (Sq. Kms.)
7152
Households with kutchha houses
3.7
Percent to total state’s area
2.3
Households with safe drinking water
68.7
C D Blocks
15
Households with electricity connection
87.1
Towns
26 Vital rates
No. of Villages
1859
Crude Birth Rate, 2001
21.8
Total Fertility Rate, 2001
2.3
Demographic particulars (Census, 2001)
Infant Mortality Rate, 2001
42
Population
Key RCH indicators from District Level
Household Survey, 2007-08 (%)
Persons 2207929
Girls marrying below 18 years
7.1
Males 1117628
Birth order 3 and above
20.1
Females 1090301
Current use of any FP Method
62.9
Rural (%)
75.8
Total unmet need
16.8
Urban (%)
Scheduled Castes (%)
24.2 Pregnant women who had at least with 3 ANCs
2.4
visits during the last pregnancy
84.1
Scheduled Tribes (%)
12.2
Elderly population (60+ years) (%)
8.1
Young people (10-24 years) (%)
30.3
Institutional delivery
69.2
Adolescent (10-19 years) (%)
21.2
Decadal Growth Rate, 1991-2001 (%)
20.9
Children with full immunization
81.2
Population density (per sq. km)
309
Sex Ratio (females per 1000 males)
Medical/Health Infrastructures/
Institutions
1991
1010
2001
976
CHCs
13
Child Sex Ratio (0-6 years) (girls per 1000 boys)
PHCs
55
1991
961
Sub-Centres
188
2001
938
Literacy rate
Information on HIV/AIDS
Persons
77.0
Males
86.2
HIV+ among ANC clinics (%)
1.75
Females
67.8
HIV+ among STD clinics (%)
-
Total work participation rate
Female work participation rate
41.4 Number of Integrated Counseling and Testing
29.8
Centres (ICTC formerly VCTC)
19
Number of Anti Retroviral Therapy (ART) Centres
1
| 109

12.5 Page 115

▲back to top


district
PUNE
Showing
CD Blocks
110 |

12.6 Page 116

▲back to top


DISTRICT PUNE
General information
Household amenities, (%), Census 2001
Area (Sq. Kms.)
15643
Households with kutchha houses
5.1
Percent to total state’s area
5.1
Households with safe drinking water
84.3
C D Blocks
14
Households with electricity connection
87.9
Towns
25 Vital rates
No. of Villages
1844
Crude Birth Rate, 2001
20.6
Total Fertility Rate, 2001
2.3
Demographic particulars (Census, 2001)
Infant Mortality Rate, 2001
33
Population
Key RCH indicators from District Level
Household Survey, 2007-08 (%)
Persons 7232555
Girls marrying below 18 years
18.2
Males 3769128
Birth order 3 and above
15.2
Females 3463427
Current use of any FP Method
72.2
Rural (%)
41.9
Total unmet need
12.5
Urban (%)
Scheduled Castes (%)
58.1 Pregnant women who had at least with 3 ANCs
10.5
visits during the last pregnancy
89.3
Scheduled Tribes (%)
3.6
Elderly population (60+ years) (%)
8.1
Young people (10-24 years) (%)
30.6
Institutional delivery
83.1
Adolescent (10-19 years) (%)
20.7
Decadal Growth Rate, 1991-2001 (%)
30.6
Children with full immunization
83.5
Population density (per sq. km)
462
Sex Ratio (females per 1000 males)
Medical/Health Infrastructures/
Institutions
1991
933
2001
919
CHCs
29
Child Sex Ratio (0-6 years) (girls per 1000 boys)
PHCs
96
1991
943
Sub-Centres
539
2001
902
Literacy rate
Information on HIV/AIDS
Persons
80.5
Males
88.3
HIV+ among ANC clinics (%)
1.0
Females
71.9
HIV+ among STD clinics (%)
-
Total work participation rate
Female work participation rate
40.8 Number of Integrated Counseling and Testing
27.1
Centres (ICTC formerly VCTC)
44
Number of Anti Retroviral Therapy (ART) Centres
4
| 111

12.7 Page 117

▲back to top


district
AHMADNAGAR
Showing CD Blocks
112 |

12.8 Page 118

▲back to top


DISTRICT AHMADNAGAR
General information
Household amenities, (%), Census 2001
Area (Sq. Kms.)
17048
Households with kutchha houses
22.3
Percent to total state’s area
5.5
Households with safe drinking water
61.2
C D Blocks
14
Households with electricity connection
64.0
Towns
18 Vital rates
No. of Villages
1578
Crude Birth Rate, 2001
21.8
Total Fertility Rate, 2001
2.7
Demographic particulars (Census, 2001)
Infant Mortality Rate, 2001
44
Population
Key RCH indicators from District Level
Household Survey, 2007-08 (%)
Persons 4040642
Girls marrying below 18 years
14.1
Males 2083053
Birth order 3 and above
20.9
Females 1957589
Current use of any FP Method
69.3
Rural (%)
80.1
Total unmet need
13.1
Urban (%)
Scheduled Castes (%)
19.9 Pregnant women who had at least with 3 ANCs
12.0
visits during the last pregnancy
83.3
Scheduled Tribes (%)
7.5
Elderly population (60+ years) (%)
9.9
Young people (10-24 years) (%)
31.0
Institutional delivery
80.1
Adolescent (10-19 years) (%)
22.3
Decadal Growth Rate, 1991-2001 (%)
21.2
Children with full immunization
90.4
Population density (per sq. km)
237
Sex Ratio (females per 1000 males)
Medical/Health Infrastructures/
Institutions
1991
949
2001
940
CHCs
21
Child Sex Ratio (0-6 years) (girls per 1000 boys)
PHCs
96
1991
946
Sub-Centres
555
2001
884
Literacy rate
Information on HIV/AIDS
Persons
75.3
Males
85.7
HIV+ among ANC clinics (%)
1.50
Females
64.4
HIV+ among STD clinics (%)
-
Total work participation rate
Female work participation rate
46.0 Number of Integrated Counseling and Testing
38.9
Centres (ICTC formerly VCTC)
30
Number of Anti Retroviral Therapy (ART) Centres
1
| 113

12.9 Page 119

▲back to top


district
BID
Showing CD Blocks
114 |

12.10 Page 120

▲back to top


DISTRICT BID
General information
Household amenities, (%), Census 2001
Area (Sq. Kms.)
10693
Households with kutchha houses
9.6
Percent to total state’s area
3.5
Households with safe drinking water
80.0
C D Blocks
11
Households with electricity connection
66.7
Towns
6 Vital rates
No. of Villages
1354
Crude Birth Rate, 2001
23.5
Total Fertility Rate, 2001
3.2
Demographic particulars (Census, 2001)
Infant Mortality Rate, 2001
46
Population
Key RCH indicators from District Level
Household Survey, 2007-08 (%)
Persons 2161250
Girls marrying below 18 years
37.0
Males 1116356
Birth order 3 and above
28.3
Females 1044894
Current use of any FP Method
62.4
Rural (%)
82.1
Total unmet need
16.0
Urban (%)
Scheduled Castes (%)
17.9 Pregnant women who had at least with 3 ANCs
13.0
visits during the last pregnancy
59.2
Scheduled Tribes (%)
1.1
Elderly population (60+ years) (%)
11.5
Young people (10-24 years) (%)
30.4
Institutional delivery
68.3
Adolescent (10-19 years) (%)
23.1
Decadal Growth Rate, 1991-2001 (%)
18.5
Children with full immunization
77.6
Population density (per sq. km)
202
Sex Ratio (females per 1000 males)
Medical/Health Infrastructures/
Institutions
1991
944
2001
936
CHCs
13
Child Sex Ratio (0-6 years) (girls per 1000 boys)
PHCs
50
1991
939
Sub-Centres
280
2001
893
Literacy rate
Information on HIV/AIDS
Persons
68.0
Males
80.7
HIV+ among ANC clinics (%)
1.50
Females
54.5
HIV+ among STD clinics (%)
-
Total work participation rate
Female work participation rate
44.3 Number of Integrated Counseling and Testing
39.2
Centres (ICTC formerly VCTC)
17
Number of Anti Retroviral Therapy (ART) Centres
1
| 115

13 Pages 121-130

▲back to top


13.1 Page 121

▲back to top


district
LATUR
Showing
CD Blocks
116 |

13.2 Page 122

▲back to top


DISTRICT LATUR
General information
Household amenities, (%), Census 2001
Area (Sq. Kms.)
7157
Households with kutchha houses
3.5
Percent to total state’s area
2.3
Households with safe drinking water
85.9
C D Blocks
10
Households with electricity connection
73.2
Towns
5 Vital rates
No. of Villages
921
Crude Birth Rate, 2001
24.1
Total Fertility Rate, 2001
3.1
Demographic particulars (Census, 2001)
Infant Mortality Rate, 2001
46
Population
Key RCH indicators from District Level
Household Survey, 2007-08 (%)
Persons 2080285
Girls marrying below 18 years
34.1
Males 1075257
Birth order 3 and above
25.9
Females 1005028
Current use of any FP Method
64.7
Rural (%)
76.4
Total unmet need
18.2
Urban (%)
Scheduled Castes (%)
23.6 Pregnant women who had at least with 3 ANCs
19.4
visits during the last pregnancy
77.2
Scheduled Tribes (%)
2.3
Elderly population (60+ years) (%)
11.0
Young people (10-24 years) (%)
31.6
Institutional delivery
63.9
Adolescent (10-19 years) (%)
23.4
Decadal Growth Rate, 1991-2001 (%)
24.0
Children with full immunization
76.6
Population density (per sq. km)
291
Sex Ratio (females per 1000 males)
Medical/Health Infrastructures/
Institutions
1991
942
2001
935
CHCs
11
Child Sex Ratio (0-6 years) (girls per 1000 boys)
PHCs
46
1991
-
Sub-Centres
252
2001
917
Literacy rate
Information on HIV/AIDS
Persons
71.5
Males
82.9
HIV+ among ANC clinics (%)
1.75
Females
59.4
HIV+ among STD clinics (%)
10.0
Total work participation rate
Female work participation rate
40.4 Number of Integrated Counseling and Testing
31.3
Centres (ICTC formerly VCTC)
15
Number of Anti Retroviral Therapy (ART) Centres
1
| 117

13.3 Page 123

▲back to top


district
Osmanabad
Showing CD Blocks
118 |

13.4 Page 124

▲back to top


DISTRICT OSMANABAD
General information
Household amenities, (%), Census 2001
Area (Sq. Kms.)
7569
Households with kutchha houses
6.7
Percent to total state’s area
2.5
Households with safe drinking water
88.3
C D Blocks
8
Households with electricity connection
65.4
Towns
8 Vital rates
No. of Villages
729
Crude Birth Rate, 2001
23.2
Total Fertility Rate, 2001
3.0
Demographic particulars (Census, 2001)
Infant Mortality Rate, 2001
47
Population
Key RCH indicators from District Level
Household Survey, 2007-08 (%)
Persons 1486586
Girls marrying below 18 years
32.0
Males 769368
Birth order 3 and above
22.7
Females 717218
Current use of any FP Method
66.8
Rural (%)
84.3
Total unmet need
14.0
Urban (%)
Scheduled Castes (%)
15.7 Pregnant women who had at least with 3 ANCs
16.5
visits during the last pregnancy
72.4
Scheduled Tribes (%)
1.9
Elderly population (60+ years) (%)
12.6
Young people (10-24 years) (%)
30.5
Institutional delivery
58.8
Adolescent (10-19 years) (%)
22.8
Decadal Growth Rate, 1991-2001 (%)
15.4
Children with full immunization
78.5
Population density (per sq. km)
196
Sex Ratio (females per 1000 males)
Medical/Health Infrastructures/
Institutions
1991
937
2001
932
CHCs
8
Child Sex Ratio (0-6 years) (girls per 1000 boys)
PHCs
42
1991
-
Sub-Centres
206
2001
893
Literacy rate
Information on HIV/AIDS
Persons
69.0
Males
80.4
HIV+ among ANC clinics (%)
3
Females
56.9
HIV+ among STD clinics (%)
-
Total work participation rate
Female work participation rate
44.0 Number of Integrated Counseling and Testing
36.7
Centres (ICTC formerly VCTC)
13
Number of Anti Retroviral Therapy (ART) Centres
1
| 119

13.5 Page 125

▲back to top


district
SOLAPUR
Showing CD Blocks
120 |

13.6 Page 126

▲back to top


DISTRICT SOLAPUR
General information
Household amenities, (%), Census 2001
Area (Sq. Kms.)
14895
Households with kutchha houses
11.9
Percent to total state’s area
4.8
Households with safe drinking water
77.9
C D Blocks
11
Households with electricity connection
60.8
Towns
10 Vital rates
No. of Villages
1138
Crude Birth Rate, 2001
22.2
Total Fertility Rate, 2001
2.7
Demographic particulars (Census, 2001)
Infant Mortality Rate, 2001
47
Population
Key RCH indicators from District Level
Household Survey, 2007-08 (%)
Persons 3849543
Girls marrying below 18 years
22.1
Males 1989623
Birth order 3 and above
24.1
Females 1859920
Current use of any FP Method
73.3
Rural (%)
68.2
Total unmet need
10.0
Urban (%)
Scheduled Castes (%)
31.8 Pregnant women who had at least with 3 ANCs
15.0
visits during the last pregnancy
86.5
Scheduled Tribes (%)
1.8
Elderly population (60+ years) (%)
9.6
Young people (10-24 years) (%)
30.3
Institutional delivery
96.9
Adolescent (10-19 years) (%)
22.0
Decadal Growth Rate, 1991-2001 (%)
19.3
Children with full immunization
79.2
Population density (per sq. km)
258
Sex Ratio (females per 1000 males)
Medical/Health Infrastructures/
Institutions
1991
934
2001
935
CHCs
13
Child Sex Ratio (0-6 years) (girls per 1000 boys)
PHCs
77
1991
935
Sub-Centres
431
2001
894
Literacy rate
Information on HIV/AIDS
Persons
71.3
Males
82.0
HIV+ among ANC clinics (%)
2
Females
59.8
HIV+ among STD clinics (%)
-
Total work participation rate
Female work participation rate
45.3 Number of Integrated Counseling and Testing
36.9
Centres (ICTC formerly VCTC)
21
Number of Anti Retroviral Therapy (ART) Centres
1
| 121

13.7 Page 127

▲back to top


district
SATARA
Showing
CD Blocks
122 |

13.8 Page 128

▲back to top


DISTRICT SATARA
General information
Household amenities, (%), Census 2001
Area (Sq. Kms.)
10480
Households with kutchha houses
4.8
Percent to total state’s area
3.4
Households with safe drinking water
83.2
C D Blocks
11
Households with electricity connection
82.6
Towns
15 Vital rates
No. of Villages
1716
Crude Birth Rate, 2001
19.2
Total Fertility Rate, 2001
2.3
Demographic particulars (Census, 2001)
Infant Mortality Rate, 2001
34
Population
Key RCH indicators from District Level
Household Survey, 2007-08 (%)
Persons 2808994
Girls marrying below 18 years
8.5
Males 1408326
Birth order 3 and above
17.6
Females 1400668
Current use of any FP Method
70.6
Rural (%)
85.8
Total unmet need
11.4
Urban (%)
Scheduled Castes (%)
14.2 Pregnant women who had at least with 3 ANCs
8.8
visits during the last pregnancy
93.5
Scheduled Tribes (%)
0.8
Elderly population (60+ years) (%)
11.3
Young people (10-24 years) (%)
29.4
Institutional delivery
87.4
Adolescent (10-19 years) (%)
20.9
Decadal Growth Rate, 1991-2001 (%)
14.1
Children with full immunization
93.1
Population density (per sq. km)
268
Sex Ratio (females per 1000 males)
Medical/Health Infrastructures/
Institutions
1991
1029
2001
995
CHCs
14
Child Sex Ratio (0-6 years) (girls per 1000 boys)
PHCs
71
1991
941
Sub-Centres
400
2001
877
Literacy rate
Information on HIV/AIDS
Persons
78.2
Males
88.2
HIV+ among ANC clinics (%)
3
Females
68.4
HIV+ among STD clinics (%)
-
Total work participation rate
Female work participation rate
46.4 Number of Integrated Counseling and Testing
39.1
Centres (ICTC formerly VCTC)
22
Number of Anti Retroviral Therapy (ART) Centres
1
| 123

13.9 Page 129

▲back to top


district
RATNAGIRI
Showing CD Blocks
124 |

13.10 Page 130

▲back to top


DISTRICT RATNAGIRI
General information
Household amenities, (%), Census 2001
Area (Sq. Kms.)
8208
Households with kutchha houses
2.2
Percent to total state’s area
2.7
Households with safe drinking water
46.2
C D Blocks
9
Households with electricity connection
90.2
Towns
10 Vital rates
No. of Villages
1539
Crude Birth Rate, 2001
20.5
Total Fertility Rate, 2001
2.1
Demographic particulars (Census, 2001)
Infant Mortality Rate, 2001
35
Population
Key RCH indicators from District Level
Household Survey, 2007-08 (%)
Persons 1696777
Girls marrying below 18 years
2.0
Males 794498
Birth order 3 and above
20.9
Females 902279
Current use of any FP Method
60.4
Rural (%)
88.7
Total unmet need
21.9
Urban (%)
Scheduled Castes (%)
11.3 Pregnant women who had at least with 3 ANCs
1.4
visits during the last pregnancy
83.0
Scheduled Tribes (%)
1.2
Elderly population (60+ years) (%)
11.9
Young people (10-24 years) (%)
28.7
Institutional delivery
73.2
Adolescent (10-19 years) (%)
21.0
Decadal Growth Rate, 1991-2001 (%)
9.9
Children with full immunization
80.7
Population density (per sq. km)
207
Sex Ratio (females per 1000 males)
Medical/Health Infrastructures/
Institutions
1991
1205
2001
1136
CHCs
10
Child Sex Ratio (0-6 years) (girls per 1000 boys)
PHCs
67
1991
961
Sub-Centres
378
2001
952
Literacy rate
Information on HIV/AIDS
Persons
75.1
Males
85.9
HIV+ among ANC clinics (%)
0.50
Females
65.8
HIV+ among STD clinics (%)
-
Total work participation rate
Female work participation rate
45.0 Number of Integrated Counseling and Testing
39.5
Centres (ICTC formerly VCTC)
14
Number of Anti Retroviral Therapy (ART) Centres
1
| 125

14 Pages 131-140

▲back to top


14.1 Page 131

▲back to top


district
SINDHUDURG
Showing CD Blocks
126 |

14.2 Page 132

▲back to top


DISTRICT SINDHUDURG
General information
Household amenities, (%), Census 2001
Area (Sq. Kms.)
5207
Households with kutchha houses
2.5
Percent to total state’s area
1.7
Households with safe drinking water
25.9
C D Blocks
8
Households with electricity connection
92.9
Towns
5 Vital rates
No. of Villages
743
Crude Birth Rate, 2001
17.4
Total Fertility Rate, 2001
1.8
Demographic particulars (Census, 2001)
Infant Mortality Rate, 2001
33
Population
Key RCH indicators from District Level
Household Survey, 2007-08 (%)
Persons 868825
Girls marrying below 18 years
-
Males 417890
Birth order 3 and above
14.5
Females 450935
Current use of any FP Method
58.4
Rural (%)
90.5
Total unmet need
22.8
Urban (%)
Scheduled Castes (%)
9.5 Pregnant women who had at least with 3 ANCs
4.4
visits during the last pregnancy
92.3
Scheduled Tribes (%)
0.6
Elderly population (60+ years) (%)
13.1
Young people (10-24 years) (%)
27.7
Institutional delivery
92.6
Adolescent (10-19 years) (%)
19.6
Decadal Growth Rate, 1991-2001 (%)
3.6
Children with full immunization
84.5
Population density (per sq. km)
167
Sex Ratio (females per 1000 males)
Medical/Health Infrastructures/
Institutions
1991
1139
2001
1079
CHCs
10
Child Sex Ratio (0-6 years) (girls per 1000 boys)
PHCs
38
1991
963
Sub-Centres
248
2001
944
Literacy rate
Information on HIV/AIDS
Persons
80.3
Males
90.3
HIV+ among ANC clinics (%)
0.25
Females
71.2
HIV+ among STD clinics (%)
-
Total work participation rate
Female work participation rate
46.6 Number of Integrated Counseling and Testing
39.2
Centres (ICTC formerly VCTC)
12
Number of Anti Retroviral Therapy (ART) Centres
-
| 127

14.3 Page 133

▲back to top


district
KOLHAPUR
Showing CD Blocks
128 |

14.4 Page 134

▲back to top


DISTRICT KOLHAPUR
General information
Household amenities, (%), Census 2001
Area (Sq. Kms.)
7685
Households with kutchha houses
1.4
Percent to total state’s area
2.5
Households with safe drinking water
88.2
C D Blocks
12
Households with electricity connection
89.4
Towns
18 Vital rates
No. of Villages
1196
Crude Birth Rate, 2001
19.3
Total Fertility Rate, 2001
2.3
Demographic particulars (Census, 2001)
Infant Mortality Rate, 2001
38
Population
Key RCH indicators from District Level
Household Survey, 2007-08 (%)
Persons 3523162
Girls marrying below 18 years
16.1
Males 1807470
Birth order 3 and above
18.8
Females 1715692
Current use of any FP Method
70.6
Rural (%)
70.2
Total unmet need
12.7
Urban (%)
Scheduled Castes (%)
29.8 Pregnant women who had at least with 3 ANCs
12.8
visits during the last pregnancy
82.2
Scheduled Tribes (%)
0.6
Elderly population (60+ years) (%)
9.4
Young people (10-24 years) (%)
29.0
Institutional delivery
89.1
Adolescent (10-19 years) (%)
20.2
Decadal Growth Rate, 1991-2001 (%)
17.6
Children with full immunization
78.3
Population density (per sq. km)
458
Sex Ratio (females per 1000 males)
Medical/Health Infrastructures/
Institutions
1991
961
2001
949
CHCs
17
Child Sex Ratio (0-6 years) (girls per 1000 boys)
PHCs
73
1991
931
Sub-Centres
413
2001
838
Literacy rate
Information on HIV/AIDS
Persons
76.9
Males
87.5
HIV+ among ANC clinics (%)
2.75
Females
66.0
HIV+ among STD clinics (%)
-
Total work participation rate
Female work participation rate
46.9 Number of Integrated Counseling and Testing
36.7
Centres (ICTC formerly VCTC)
25
Number of Anti Retroviral Therapy (ART) Centres
1
| 129

14.5 Page 135

▲back to top


district
SANGLI
Showing
CD Blocks
130 |

14.6 Page 136

▲back to top


DISTRICT SANGLI
General information
Household amenities, (%), Census 2001
Area (Sq. Kms.)
8572
Households with kutchha houses
6.0
Percent to total state’s area
2.8
Households with safe drinking water
81.1
C D Blocks
9
Households with electricity connection
76.8
Towns
8 Vital rates
No. of Villages
721
Crude Birth Rate, 2001
19.4
Total Fertility Rate, 2001
2.3
Demographic particulars (Census, 2001)
Infant Mortality Rate, 2001
35
Population
Key RCH indicators from District Level
Household Survey, 2007-08 (%)
Persons 2583524
Girls marrying below 18 years
14.1
Males 1320088
Birth order 3 and above
18.6
Females 1263436
Current use of any FP Method
70.4
Rural (%)
75.5
Total unmet need
10.2
Urban (%)
Scheduled Castes (%)
24.5 Pregnant women who had at least with 3 ANCs
12.1
visits during the last pregnancy
83.3
Scheduled Tribes (%)
0.7
Elderly population (60+ years) (%)
10.8
Young people (10-24 years) (%)
29.1
Institutional delivery
75.9
Adolescent (10-19 years) (%)
20.5
Decadal Growth Rate, 1991-2001 (%)
17.6
Children with full immunization
87.1
Population density (per sq. km)
301
Sex Ratio (females per 1000 males)
Medical/Health Infrastructures/
Institutions
1991
958
2001
957
CHCs
11
Child Sex Ratio (0-6 years) (girls per 1000 boys)
PHCs
59
1991
924
Sub-Centres
320
2001
851
Literacy rate
Information on HIV/AIDS
Persons
76.6
Males
86.3
HIV+ among ANC clinics (%)
4
Females
66.7
HIV+ among STD clinics (%)
28.4
Total work participation rate
Female work participation rate
47.2 Number of Integrated Counseling and Testing
37.9
Centres (ICTC formerly VCTC)
22
Number of Anti Retroviral Therapy (ART) Centres
2
| 131

14.7 Page 137

▲back to top


RAJASTHAN
at a glance

14.8 Page 138

▲back to top


RAJASTHAN
Showing Districts
134 |

14.9 Page 139

▲back to top


STATE PROFILE
RAJASTHAN
Key Demographic, Health and RCH Indicators at a glance
General information
Area (sq. kms.)
No. of Districts
No. of CD Blocks
No. of Villages
No. of Towns
Demographic particulars (Census, 2001)
Population
Persons
Males
Females
Rural (%)
Urban (%)
Scheduled Castes (%)
Scheduled Tribes (%)
Elderly population (60+ years) (%)
Young people (10-24 years) (%)
Adolescents (10-19 years) (%)
Decadal Growth Rate, 1991-2001 (%)
Population density (per sq. km)
Sex Ratio (females per 1000 males)
Child Sex Ratio (0-6 years) (girls per 1000 boys)
Literacy rate (7+)
Persons
Males
Females
Work participation rate
Female work participation rate
Proportion of people living below poverty line, 2004-05
Per capita net state domestic product at current prices in rupees, 2005-06
Human Development Index (HDI), 2001 (among 28 states)
Value
Rank
Social Development Index (SDI), 2001 (among 20 major states)
Rural
Value
Rank
Urban
Value
Rank
Household amenities (%), Census 2001
Households with kutchha houses
Households with safe drinking water
Households with electricity connection
Vital indices
Crude Birth Rate (CBR), 2008, SRS
Total Fertility Rate (TFR), 2007, SRS
342239
32
241
41352
9
56507188
29420011
27087177
76.6
23.4
17.2
12.6
6.8
31.1
22.6
28.4
165
921
909
60.4
75.7
43.9
42.1
33.5
17.5
15219
0.540
20
34.93
13
46.09
13
14.1
68.2
54.7
27.5
3.4
| 135

14.10 Page 140

▲back to top


Age Specific Fertility Rates, 2007, SRS
15-19 years
20-24 years
25-29 years
30-34 years
35-39 years
40-44 years
45-49 years
General Fertility Rate, 2007,SRS
Gross Reproduction Rate, 2007, SRS
Life Expectancy at Birth, 2000-2004, SRS
Crude Death Rate (CDR), 2008, SRS
Maternal Mortality Ratio (MMR), 2004-06, RGI
Child Mortality Rate(CMR), 2007, SRS
Infant Mortality Rate (IMR), 2008, SRS
Neo-natal mortality rate, 2007, SRS
Early neo-natal mortality rate, 2007, SRS
Late neo-natal mortality rate, 2007, SRS
Post neo-natal mortality rate, 2007, SRS
Peri-natal mortality rate, 2007, SRS
Still birth rate, 2007, SRS
Key RCH and nutrition indicators (%)
Girls marrying below 18 years, DLHS, 2007-08
Women(20-24) reporting birth of order 2 & above, DLHS, 2007-08
Current use of any FP method, DLHS, 2007-08
Total unmet need, DLHS, 2007-08
Mothers who received any antenatal check-up, DLHS, 2007-08
Mothers who had three or more ANC, DLHS, 2007-08
Mothers who consumed 100 IFA tablets, DLHS, 2007-08
Safe delivery, DLHS, 2007-08
Institutional delivery, DLHS, 2007-08
Children with full immunization (12-23 months), DLHS, 2007-08
Children under 3 years who are underweight, NFHS-3, 2005-06
Children under 3 years who are stunted, NFHS-3, 2005-06
Children under 3 years who are wasted, NFHS-3, 2005-06
Children age 6-35 months who are anaemic, NFHS-3, 2005-06
Ever married women age 15-49 years who are anaemic, NFHS-3, 2005-06
Medical/Health Infrastructures/Institutions
Community Health Centres (CHCs)
Primary Health Centres (PHCs)
Sub Centres (SCs)
Information on HIV/AIDS (%)
Women who have heard of HIV/AIDS, NFHS-3, 2005-06
Men who have heard of HIV/AIDS, NFHS-3, 2005-06
Women who know that consistent condom use can reduce the chances of getting HIV/AIDS, NFHS-3,
2005-06
Men who know that consistent condom use can reduce the chances of getting HIV/AIDS, NFHS-3,
2005-06
HIV+ among ANC clinics (%)
HIV+ among STD clinics (%)
Number of Integrated Counseling and Testing Centres (ICTC formerly VCTC)
Number of Prevention of Parent To Child Transmission Centres (PPTCTC)
Number of Anti Retroviral Therapy (ART) Centres
41.9
274.3
201.9
102.3
42.6
17.7
7.3
115.9
1.6
61.5
6.8
388
19
63
44
34
9
22
43
10
41.0
45.9
57.0
17.9
56.6
27.7
15.6
52.7
45.5
48.8
39.9
43.7
20.4
69.7
53.1
349
1503
10742
38.0
76.2
29.8
63.8
0.29
2.16
72
30
4
136 |

15 Pages 141-150

▲back to top


15.1 Page 141

▲back to top


districts
at a glance

15.2 Page 142

▲back to top


d i str i c t
AJMER
Showing
CD Blocks
138 |

15.3 Page 143

▲back to top


DISTRICT AJMER
General information
Area (Sq. Kms.)
Percent to total state’s area
C D Blocks
Towns
No. of Villages
Demographic particulars (Census, 2001)
Population
Persons
Males
Females
Rural (%)
Urban (%)
Scheduled Castes (%)
Scheduled Tribes (%)
Elderly population (60+ years) (%)
Young people (10-24 years) (%)
Adolescents (10-19 years) (%)
Decadal Growth Rate, 1991-2001 (%)
Population density (per sq. km)
Sex Ratio (females per 1000 males)
1991
2001
Child Sex Ratio (0-6 years) (girls per 1000 boys)
1991
2001
Literacy rate (7+)
Persons
Males
Females
Total work participation rate
Female work participation rate
Household amenities, (%), Census 2001
8481
Households with kutchha houses
2.5
Households with safe drinking water
9
Households with electricity connection
10 Vital rates
1025
Crude Birth Rate, 2001
Total Fertility Rate, 2001
Infant Mortality Rate, 2001
Key RCH indicators from District Level
Household Survey, 2007-08 (%)
2181670
Girls marrying below 18 years
1129920
Birth order 3 and above
1051750
Current use of any FP Method
59.9
Total unmet need
40.1
17.71
2.41
Mothers who had at least 3 ANC visits during
the last pregnancy
7.2
30.7
Institutional delivery
22.1
26.10
Children with full immunization
257
Medical/Health Infrastructures/
Institutions
918
931
CHCs
PHCs
913
Sub-Centres
922
Information on HIV/AIDS
64.65
79.37
HIV+ among ANC clinics (%)
48.86
HIV+ among STD clinics (%)
39.3 Number of Integrated Counseling and Testing
28.0
Centres (ICTC formerly VCTC)
Number of Anti Retroviral Therapy (ART) Centres
10.6
76.9
66.04
29.1
3.7
81
46.9
38.7
51.7
19.5
47.0
49.3
42.6
11
43
290
0.00
7.20
7
-
| 139

15.4 Page 144

▲back to top


d i str i c t
ALWAR
Showing
CD Blocks
140 |

15.5 Page 145

▲back to top


DISTRICT ALWAR
General information
Area (Sq. Kms.)
Percent to total state’s area
C D Blocks
Towns
No. of Villages
Demographic particulars (Census, 2001)
Population
Persons
Males
Females
Rural (%)
Urban (%)
Scheduled Castes (%)
Scheduled Tribes (%)
Elderly population (60+ years) (%)
Young people (10-24 years) (%)
Adolescents (10-19 years)(%)
Decadal Growth Rate, 1991-2001 (%)
Population density (per sq. km)
Sex Ratio (females per 1000 males)
1991
2001
Child Sex Ratio (0-6 years) (girls per 1000 boys)
1991
2001
Literacy rate (7+)
Persons
Males
Females
Total work participation rate
Female work participation rate
Household amenities, (%), Census 2001
8380
Households with kutchha houses
2.4
Households with safe drinking water
12
Households with electricity connection
10 Vital rates
1954
Crude Birth Rate, 2001
Total Fertility Rate, 2001
Infant Mortality Rate, 2001
Key RCH indicators from District Level
Household Survey, 2007-08 (%)
2992592
Girls marrying below 18 years
1586752
Birth order 3 and above
1405840
Current use of any FP Method
85.5
Total unmet need
14.5
18.01
8.02
Mothers who had at least 3 ANC visits during
the last pregnancy
6.8
31.7
Institutional delivery
23.2
30.23
Children with full immunization
357
Medical/Health Infrastructures/
Institutions
880
886
CHCs
PHCs
914
Sub-Centres
887
Information on HIV/AIDS
61.74
78.09
HIV+ among ANC clinics (%)
43.28
HIV+ among STD clinics (%)
48.7 Number of Integrated Counseling and Testing
43.9
Centres (ICTC formerly VCTC)
Number of Anti Retroviral Therapy (ART) Centres
12.3
64.8
52.36
33.2
4.5
74
38.3
32.1
61.2
19.4
14.4
45.9
25.1
21
73
488
0.50
2.80
2
-
| 141

15.6 Page 146

▲back to top


d i str i c t
BANSWARA
Showing CD Blocks
142 |

15.7 Page 147

▲back to top


DISTRICT BANSWARA
General information
Area (Sq. Kms.)
Percent to total state’s area
C D Blocks
Towns
No. of Villages
Demographic particulars (Census, 2001)
Population
Persons
Males
Females
Rural (%)
Urban (%)
Scheduled Castes (%)
Scheduled Tribes (%)
Elderly population (60+ years) (%)
Young people (10-24 years) (%)
Adolescents (10-19 years)(%)
Decadal Growth Rate, 1991-2001 (%)
Population density (per sq. km)
Sex Ratio (females per 1000 males)
1991
2001
Child Sex Ratio (0-6 years) (girls per 1000 boys)
1991
2001
Literacy rate (7+)
Persons
Males
Females
Total work participation rate
Female work participation rate
Household amenities, (%), Census 2001
5037
Households with kutchha houses
1.5
Households with safe drinking water
5
Households with electricity connection
4 Vital rates
1476
Crude Birth Rate, 2001
Total Fertility Rate, 2001
Infant Mortality Rate, 2001
Key RCH indicators from District Level
Household Survey, 2007-08 (%)
1501589
Girls marrying below 18 years
760686
Birth order 3 and above
740903
Current use of any FP Method
92.9
Total unmet need
7.1
4.28
72.27
Mothers who had at least 3 ANC visits during
the last pregnancy
5.8
29.7
Institutional delivery
21.6
29.84
Children with full immunization
298
Medical/Health Infrastructures/
Institutions
969
974
CHCs
PHCs
976
Sub-Centres
964
Information on HIV/AIDS
44.63
60.45
HIV+ among ANC clinics (%)
28.43
HIV+ among STD clinics (%)
47.2 Number of Integrated Counseling and Testing
43.9
Centres (ICTC formerly VCTC)
Number of Anti Retroviral Therapy (ART) Centres
7.7
69.7
27.15
38.0
4.8
104
35.1
47.8
63.4
8.7
19.0
46.7
82.8
12
43
330
0
-
2
-
| 143

15.8 Page 148

▲back to top


d i str i c t
baran
Showing
CD Blocks
144 |

15.9 Page 149

▲back to top


DISTRICT BARAN
General information
Area (Sq. Kms.)
Percent to total state’s area
C D Blocks
Towns
No. of Villages
Demographic particulars (Census, 2001)
Population
Persons
Males
Females
Rural (%)
Urban (%)
Scheduled Castes (%)
Scheduled Tribes (%)
Elderly population (60+ years) (%)
Young people (10-24 years) (%)
Adolescents (10-19 years)(%)
Decadal Growth Rate, 1991-2001 (%)
Population density (per sq. km)
Sex Ratio (females per 1000 males)
1991
2001
Child Sex Ratio (0-6 years) (girls per 1000 boys)
1991
2001
Literacy rate (7+)
Persons
Males
Females
Total work participation rate
Female work participation rate
Household amenities, (%), Census 2001
6992
Households with kutchha houses
2.0
Households with safe drinking water
8
Households with electricity connection
6 Vital rates
1089
Crude Birth Rate, 2001
Total Fertility Rate, 2001
Infant Mortality Rate, 2001
Key RCH indicators from District Level
Household Survey, 2007-08 (%)
1021653
Girls marrying below 18 years
535137
Birth order 3 and above
486516
Current use of any FP Method
83.2
Total unmet need
16.8
17.72
21.23
Mothers who had at least 3 ANC visits during
the last pregnancy
7.0
31.1
Institutional delivery
22.9
26.19
Children with full immunization
146
Medical/Health Infrastructures/
Institutions
896
909
CHCs
PHCs
930
Sub-Centres
918
Information on HIV/AIDS
59.50
75.78
HIV+ among ANC clinics (%)
41.55
HIV+ among STD clinics (%)
42.7 Number of Integrated Counseling and Testing
35.6
Centres (ICTC formerly VCTC)
Number of Anti Retroviral Therapy (ART) Centres
4.3
84.9
53.33
31.3
4.0
88
52.1
38.3
57.0
17.8
37.6
58.4
47.9
9
35
205
0
-
1
-
| 145

15.10 Page 150

▲back to top


d i str i c t
BARMER
Showing CD Blocks
146 |

16 Pages 151-160

▲back to top


16.1 Page 151

▲back to top


DISTRICT BARMER
General information
Area (Sq. Kms.)
Percent to total state’s area
C D Blocks
Towns
No. of Villages
Demographic particulars (Census, 2001)
Population
Persons
Males
Females
Rural (%)
Urban (%)
Scheduled Castes (%)
Scheduled Tribes (%)
Elderly population (60+ years) (%)
Young people (10-24 years) (%)
Adolescents (10-19 years)(%)
Decadal Growth Rate, 1991-2001 (%)
Population density (per sq. km)
Sex Ratio (females per 1000 males)
1991
2001
Child Sex Ratio (0-6 years) (girls per 1000 boys)
1991
2001
Literacy rate (7+)
Persons
Males
Females
Total work participation rate
Female work participation rate
Household amenities, (%), Census 2001
28387
Households with kutchha houses
8.3
Households with safe drinking water
8
Households with electricity connection
2 Vital rates
1933
Crude Birth Rate, 2001
Total Fertility Rate, 2001
Infant Mortality Rate, 2001
Key RCH indicators from District Level
Household Survey, 2007-08 (%)
1964835
Girls marrying below 18 years
1038247
Birth order 3 and above
926588
Current use of any FP Method
92.6
Total unmet need
7.4
15.73
6.04
Mothers who had at least 3 ANC visits during
the last pregnancy
6.6
29.9
Institutional delivery
21.7
36.83
Children with full immunization
69
Medical/Health Infrastructures/
Institutions
891
892
CHCs
PHCs
901
Sub-Centres
918
Information on HIV/AIDS
58.99
72.76
HIV+ among ANC clinics (%)
43.45
HIV+ among STD clinics (%)
46.8 Number of Integrated Counseling and Testing
41.8
Centres (ICTC formerly VCTC)
Number of Anti Retroviral Therapy (ART) Centres
57.8
43.4
23.23
40.0
5.7
78
28.7
53.3
52.6
18.0
19.8
21.3
51.0
14
58
478
0.00
2.40
2
-
| 147

16.2 Page 152

▲back to top


d i str i c t
BHARATPUR
Showing CD Blocks
148 |

16.3 Page 153

▲back to top


DISTRICT BHARATPUR
General information
Area (Sq. Kms.)
Percent to total state’s area
C D Blocks
Towns
No. of Villages
Demographic particulars (Census, 2001)
Population
Persons
Males
Females
Rural (%)
Urban (%)
Scheduled Castes (%)
Scheduled Tribes (%)
Elderly population (60+ years) (%)
Young people (10-24 years) (%)
Adolescents (10-19 years)(%)
Decadal Growth Rate, 1991-2001 (%)
Population density (per sq. km)
Sex Ratio (females per 1000 males)
1991
2001
Child Sex Ratio (0-6 years) (girls per 1000 boys)
1991
2001
Literacy rate (7+)
Persons
Males
Females
Total work participation rate
Female work participation rate
Household amenities, (%), Census 2001
5066
Households with kutchha houses
1.5
Households with safe drinking water
10
Households with electricity connection
10 Vital rates
1366
Crude Birth Rate, 2001
Total Fertility Rate, 2001
Infant Mortality Rate, 2001
Key RCH indicators from District Level
Household Survey, 2007-08 (%)
2101142
Girls marrying below 18 years
1133425
Birth order 3 and above
967717
Current use of any FP Method
80.5
Total unmet need
19.5
21.70
2.24
Mothers who had at least 3 ANC visits during
the last pregnancy
6.6
31.6
Institutional delivery
23.4
27.05
Children with full immunization
414
Medical/Health Infrastructures/
Institutions
832
854
CHCs
PHCs
879
Sub-Centres
878
Information on HIV/AIDS
63.57
80.54
HIV+ among ANC clinics (%)
43.56
HIV+ among STD clinics (%)
40.6 Number of Integrated Counseling and Testing
33.0
Centres (ICTC formerly VCTC)
Number of Anti Retroviral Therapy (ART) Centres
12
37.6
54.39
34.8
4.9
76
30.8
36.4
45.4
28.1
8.0
43.9
16.9
12
56
396
0.00
3
-
| 149

16.4 Page 154

▲back to top


d i str i c t
BHILWARA
Showing CD Blocks
150 |

16.5 Page 155

▲back to top


DISTRICT BHILWARA
General information
Area (Sq. Kms.)
Percent to total state’s area
C D Blocks
Towns
No. of Villages
Demographic particulars (Census, 2001)
Population
Persons
Males
Females
Rural (%)
Urban (%)
Scheduled Castes (%)
Scheduled Tribes (%)
Elderly population (60+ years) (%)
Young people (10-24 years) (%)
Adolescents (10-19 years)(%)
Decadal Growth Rate, 1991-2001 (%)
Population density (per sq. km)
Sex Ratio (females per 1000 males)
1991
2001
Child Sex Ratio (0-6 years) (girls per 1000 boys)
1991
2001
Literacy rate (7+)
Persons
Males
Females
Total work participation rate
Female work participation rate
Household amenities, (%), Census 2001
10455
Households with kutchha houses
3.1
Households with safe drinking water
12
Households with electricity connection
8 Vital rates
1693
Crude Birth Rate, 2001
Total Fertility Rate, 2001
Infant Mortality Rate, 2001
Key RCH indicators from District Level
Household Survey, 2007-08 (%)
2013789
Girls marrying below 18 years
1026650
Birth order 3 and above
987139
Current use of any FP Method
79.4
Total unmet need
20.6
15.72
8.97
Mothers who had at least 3 ANC visits during
the last pregnancy
7.8
28.3
Institutional delivery
20.3
26.14
Children with full immunization
192
Medical/Health Infrastructures/
Institutions
945
962
CHCs
PHCs
953
Sub-Centres
948
Information on HIV/AIDS
50.74
67.39
HIV+ among ANC clinics (%)
33.48
HIV+ among STD clinics (%)
46.7 Number of Integrated Counseling and Testing
38.6
Centres (ICTC formerly VCTC)
Number of Anti Retroviral Therapy (ART) Centres
6.0
73.3
57.18
31.3
4.0
95
65.1
40.8
59.4
14.8
34.5
38.7
67.2
15
63
415
0.25
-
2
-
| 151

16.6 Page 156

▲back to top


d i str i c t
BIKANER
Showing CD Blocks
152 |

16.7 Page 157

▲back to top


DISTRICT BIKANER
General information
Area (Sq. Kms.)
Percent to total state’s area
C D Blocks
Towns
No. of Villages
Demographic particulars (Census, 2001)
Population
Persons
Males
Females
Rural (%)
Urban (%)
Scheduled Castes (%)
Scheduled Tribes (%)
Elderly population (60+ years) (%)
Young people (10-24 years) (%)
Adolescents (10-19 years)(%)
Decadal Growth Rate, 1991-2001 (%)
Population density (per sq. km)
Sex Ratio (females per 1000 males)
1991
2001
Child Sex Ratio (0-6 years) (girls per 1000 boys)
1991
2001
Literacy rate (7+)
Persons
Males
Females
Total work participation rate
Female work participation rate
Household amenities, (%), Census 2001
27284
Households with kutchha houses
8.0
Households with safe drinking water
7
Households with electricity connection
3 Vital rates
711
Crude Birth Rate, 2001
Total Fertility Rate, 2001
Infant Mortality Rate, 2001
Key RCH indicators from District Level
Household Survey, 2007-08 (%)
1674271
Girls marrying below 18 years
886075
Birth order 3 and above
788196
Current use of any FP Method
64.5
Total unmet need
35.5
19.96
0.36
Mothers who had at least 3 ANC visits during
the last pregnancy
5.8
32.6
Institutional delivery
23.4
38.18
Children with full immunization
61
Medical/Health Infrastructures/
Institutions
885
890
CHCs
PHCs
914
Sub-Centres
916
Information on HIV/AIDS
56.91
70.05
HIV+ among ANC clinics (%)
42.03
HIV+ among STD clinics (%)
39.5 Number of Integrated Counseling and Testing
27.5
Centres (ICTC formerly VCTC)
Number of Anti Retroviral Therapy (ART) Centres
36.5
62.8
51.00
32.8
4.4
56
40.1
37.1
60.9
18.3
25.1
30.2
41.1
9
39
312
-
0.40
2
1
| 153

16.8 Page 158

▲back to top


d i str i c t
BUNDI
Showing
CD Blocks
154 |

16.9 Page 159

▲back to top


DISTRICT BUNDI
General information
Area (Sq. Kms.)
Percent to total state’s area
C D Blocks
Towns
No. of Villages
Demographic particulars (Census, 2001)
Population
Persons
Males
Females
Rural (%)
Urban (%)
Scheduled Castes (%)
Scheduled Tribes (%)
Elderly population (60+ years) (%)
Young people (10-24 years) (%)
Adolescents (10-19 years)(%)
Decadal Growth Rate, 1991-2001 (%)
Population density (per sq. km)
Sex Ratio (females per 1000 males)
1991
2001
Child Sex Ratio (0-6 years) (girls per 1000 boys)
1991
2001
Literacy rate (7+)
Persons
Males
Females
Total work participation rate
Female work participation rate
Household amenities, (%), Census 2001
5550
Households with kutchha houses
1.6
Households with safe drinking water
5
Households with electricity connection
7 Vital rates
839
Crude Birth Rate, 2001
Total Fertility Rate, 2001
Infant Mortality Rate, 2001
Key RCH indicators from District Level
Household Survey, 2007-08 (%)
962620
Girls marrying below 18 years
504818
Birth order 3 and above
457802
Current use of any FP Method
81.3
Total unmet need
18.7
18.11
20.24
Mothers who had at least 3 ANC visits during
the last pregnancy
6.7
31.0
Institutional delivery
22.7
24.80
Children with full immunization
173
Medical/Health Infrastructures/
Institutions
889
907
CHCs
PHCs
915
Sub-Centres
911
Information on HIV/AIDS
55.57
71.68
HIV+ among ANC clinics (%)
37.79
HIV+ among STD clinics (%)
47.5 Number of Integrated Counseling and Testing
40.5
Centres (ICTC formerly VCTC)
Number of Anti Retroviral Therapy (ART) Centres
4.3
86.4
55.06
30.9
4.0
81
66.6
28.0
50.0
21.7
32.5
53.4
48.3
6
25
177
0
-
2
-
| 155

16.10 Page 160

▲back to top


d i str i c t
CHITTAURGARH
Showing CD Blocks
156 |

17 Pages 161-170

▲back to top


17.1 Page 161

▲back to top


DISTRICT CHITTAURGARH
General information
Area (Sq. Kms.)
Percent to total state’s area
C D Blocks
Towns
No. of Villages
Demographic particulars (Census, 2001)
Population
Persons
Males
Females
Rural (%)
Urban (%)
Scheduled Castes (%)
Scheduled Tribes (%)
Elderly population (60+ years) (%)
Young people (10-24 years) (%)
Adolescents (10-19 years)(%)
Decadal Growth Rate, 1991-2001 (%)
Population density (per sq. km)
Sex Ratio (females per 1000 males)
1991
2001
Child Sex Ratio (0-6 years) (girls per 1000 boys)
1991
2001
Literacy rate (7+)
Persons
Males
Females
Total work participation rate
Female work participation rate
Household amenities, (%), Census 2001
10856
Households with kutchha houses
3.2
Households with safe drinking water
13
Households with electricity connection
8 Vital rates
2201
Crude Birth Rate, 2001
Total Fertility Rate, 2001
Infant Mortality Rate, 2001
Key RCH indicators from District Level
Household Survey, 2007-08 (%)
1803524
Girls marrying below 18 years
918063
Birth order 3 and above
885461
Current use of any FP Method
84.0
Total unmet need
16.0
13.90
21.53
Mothers who had at least 3 ANC visits during
the last pregnancy
7.6
28.8
Institutional delivery
20.2
21.46
Children with full immunization
166
Medical/Health Infrastructures/
Institutions
950
964
CHCs
PHCs
951
Sub-Centres
929
Information on HIV/AIDS
54.09
71.30
HIV+ among ANC clinics (%)
36.39
HIV+ among STD clinics (%)
51.6 Number of Integrated Counseling and Testing
46.2
Centres (ICTC formerly VCTC)
Number of Anti Retroviral Therapy (ART) Centres
2.5
86.9
58.75
30.0
3.8
99
63.5
28.7
63.7
10.0
34.5
45.1
69.0
11
39
300
0.25
1.60
2
-
| 157

17.2 Page 162

▲back to top


d i str i c t
CHURU
Showing
CD Blocks
158 |

17.3 Page 163

▲back to top


DISTRICT CHURU
General information
Area (Sq. Kms.)
Percent to total state’s area
C D Blocks
Towns
No. of Villages
Demographic particulars (Census, 2001)
Population
Persons
Males
Females
Rural (%)
Urban (%)
Scheduled Castes (%)
Scheduled Tribes (%)
Elderly population (60+ years) (%)
Young people (10-24 years) (%)
Adolescents (10-19 years)(%)
Decadal Growth Rate, 1991-2001 (%)
Population density (per sq. km)
Sex Ratio (females per 1000 males)
1991
2001
Child Sex Ratio (0-6 years) (girls per 1000 boys)
1991
2001
Literacy rate (7+)
Persons
Males
Females
Total work participation rate
Female work participation rate
Household amenities, (%), Census 2001
16830
Households with kutchha houses
4.9
Households with safe drinking water
7
Households with electricity connection
13 Vital rates
945
Crude Birth Rate, 2001
Total Fertility Rate, 2001
Infant Mortality Rate, 2001
Key RCH indicators from District Level
Household Survey, 2007-08 (%)
1923878
Girls marrying below 18 years
987781
Birth order 3 and above
936097
Current use of any FP Method
72.1
Total unmet need
27.9
21.17
0.52
Mothers who had at least 3 ANC visits during
the last pregnancy
6.5
32.3
Institutional delivery
23.8
24.60
Children with full immunization
114
Medical/Health Infrastructures/
Institutions
937
948
CHCs
PHCs
904
Sub-Centres
911
Information on HIV/AIDS
66.81
79.69
HIV+ among ANC clinics (%)
53.35
HIV+ among STD clinics (%)
44.4 Number of Integrated Counseling and Testing
38.4
Centres (ICTC formerly VCTC)
Number of Anti Retroviral Therapy (ART) Centres
15.9
62.2
49.44
32.4
4.2
63
36.9
39.0
62.6
18.5
22.2
30.5
36.6
10
57
359
0
-
2
-
| 159

17.4 Page 164

▲back to top


d i str i c t
DAUSA
Showing
CD Blocks
160 |

17.5 Page 165

▲back to top


DISTRICT DAUSA
General information
Area (Sq. Kms.)
Percent to total state’s area
C D Blocks
Towns
No. of Villages
Demographic particulars (Census, 2001)
Population
Persons
Males
Females
Rural (%)
Urban (%)
Scheduled Castes (%)
Scheduled Tribes (%)
Elderly population (60+ years) (%)
Young people (10-24 years) (%)
Adolescents (10-19 years)(%)
Decadal Growth Rate, 1991-2001 (%)
Population density (per sq. km)
Sex Ratio (females per 1000 males)
1991
2001
Child Sex Ratio (0-6 years) (girls per 1000 boys)
1991
2001
Literacy rate (7+)
Persons
Males
Females
Total work participation rate
Female work participation rate
Household amenities, (%), Census 2001
3432
Households with kutchha houses
1.0
Households with safe drinking water
5
Households with electricity connection
5 Vital rates
1025
Crude Birth Rate, 2001
Total Fertility Rate, 2001
Infant Mortality Rate, 2001
Key RCH indicators from District Level
Household Survey, 2007-08 (%)
1317063
Girls marrying below 18 years
693438
Birth order 3 and above
623625
Current use of any FP Method
89.7
Total unmet need
10.3
21.21
26.82
Mothers who had at least 3 ANC visits during
the last pregnancy
6.6
31.2
Institutional delivery
22.9
32.42
Children with full immunization
384
Medical/Health Infrastructures/
Institutions
884
899
CHCs
PHCs
919
Sub-Centres
905
Information on HIV/AIDS
61.84
79.35
HIV+ among ANC clinics (%)
42.32
HIV+ among STD clinics (%)
41.2 Number of Integrated Counseling and Testing
36.1
Centres (ICTC formerly VCTC)
Number of Anti Retroviral Therapy (ART) Centres
12.8
56.7
44.50
34.4
4.6
83
50.7
37.7
57.8
19.5
22.1
60.3
48.0
7
29
237
0
-
1
-
| 161

17.6 Page 166

▲back to top


d i str i c t
DHAULPUR
Showing CD Blocks
162 |

17.7 Page 167

▲back to top


DISTRICT DHAULPUR
General information
Area (Sq. Kms.)
Percent to total state’s area
C D Blocks
Towns
No. of Villages
Demographic particulars (Census, 2001)
Population
Persons
Males
Females
Rural (%)
Urban (%)
Scheduled Castes (%)
Scheduled Tribes (%)
Elderly population (60+ years) (%)
Young people (10-24 years) (%)
Adolescents (10-19 years)(%)
Decadal Growth Rate, 1991-2001 (%)
Population density (per sq. km)
Sex Ratio (females per 1000 males)
1991
2001
Child Sex Ratio (0-6 years) (girls per 1000 boys)
1991
2001
Literacy rate (7+)
Persons
Males
Females
Total work participation rate
Female work participation rate
Household amenities, (%), Census 2001
3033
Households with kutchha houses
0.9
Households with safe drinking water
5
Households with electricity connection
4 Vital rates
786
Crude Birth Rate, 2001
Total Fertility Rate, 2001
Infant Mortality Rate, 2001
Key RCH indicators from District Level
Household Survey, 2007-08 (%)
983258
Girls marrying below 18 years
538103
Birth order 3 and above
445155
Current use of any FP Method
82.0
Total unmet need
18.0
20.13
4.84
Mothers who had at least 3 ANC visits during
the last pregnancy
5.7
31.2
Institutional delivery
23.2
31.13
Children with full immunization
324
Medical/Health Infrastructures/
Institutions
795
827
CHCs
PHCs
875
Sub-Centres
859
Information on HIV/AIDS
60.13
75.09
HIV+ among ANC clinics (%)
41.84
HIV+ among STD clinics (%)
43.7 Number of Integrated Counseling and Testing
34.0
Centres (ICTC formerly VCTC)
Number of Anti Retroviral Therapy (ART) Centres
17.6
55.5
34.71
39.6
5.7
85
37.4
53.0
45.7
31.5
7.5
48.5
25.4
6
21
167
-
-
2
-
| 163

17.8 Page 168

▲back to top


d i str i c t
DUNGARPUR
Showing CD Blocks
164 |

17.9 Page 169

▲back to top


DISTRICT DUNGARPUR
General information
Area (Sq. Kms.)
Percent to total state’s area
C D Blocks
Towns
No. of Villages
Demographic particulars (Census, 2001)
Population
Persons
Males
Females
Rural (%)
Urban (%)
Scheduled Castes (%)
Scheduled Tribes (%)
Elderly population (60+ years) (%)
Young people (10-24 years) (%)
Adolescents (10-19 years)(%)
Decadal Growth Rate, 1991-2001 (%)
Population density (per sq. km)
Sex Ratio (females per 1000 males)
1991
2001
Child Sex Ratio (0-6 years) (girls per 1000 boys)
1991
2001
Literacy rate (7+)
Persons
Males
Females
Total work participation rate
Female work participation rate
Household amenities, (%), Census 2001
3770
Households with kutchha houses
1.1
Households with safe drinking water
4
Households with electricity connection
3 Vital rates
854
Crude Birth Rate, 2001
Total Fertility Rate, 2001
Infant Mortality Rate, 2001
Key RCH indicators from District Level
Household Survey, 2007-08 (%)
1107643
Girls marrying below 18 years
547791
Birth order 3 and above
559852
Current use of any FP Method
92.7
Total unmet need
7.3
4.15
65.14
Mothers who had at least 3 ANC visits during
the last pregnancy
6.8
29.0
Institutional delivery
21.0
26.58
Children with full immunization
294
Medical/Health Infrastructures/
Institutions
995
1022
CHCs
PHCs
974
Sub-Centres
954
Information on HIV/AIDS
48.57
66.04
HIV+ among ANC clinics (%)
31.77
HIV+ among STD clinics (%)
48.0 Number of Integrated Counseling and Testing
44.7
Centres (ICTC formerly VCTC)
Number of Anti Retroviral Therapy (ART) Centres
3.9
73.5
34.88
37.3
4.5
97
31.3
43.4
64.8
10.2
30.0
46.3
87.2
7
38
306
0
-
2
-
| 165

17.10 Page 170

▲back to top


d i str i c t
GANGANAGAR
Showing CD Blocks
166 |

18 Pages 171-180

▲back to top


18.1 Page 171

▲back to top


DISTRICT GANGANAGAR
General information
Area (Sq. Kms.)
Percent to total state’s area
C D Blocks
Towns
No. of Villages
Demographic particulars (Census, 2001)
Population
Persons
Males
Females
Rural (%)
Urban (%)
Scheduled Castes (%)
Scheduled Tribes (%)
Elderly population (60+ years) (%)
Young people (10-24 years) (%)
Adolescents (10-19 years)(%)
Decadal Growth Rate, 1991-2001 (%)
Population density (per sq. km)
Sex Ratio (females per 1000 males)
1991
2001
Child Sex Ratio (0-6 years) (girls per 1000 boys)
1991
2001
Literacy rate (7+)
Persons
Males
Females
Total work participation rate
Female work participation rate
Household amenities, (%), Census 2001
7984
Households with kutchha houses
2.3
Households with safe drinking water
9
Households with electricity connection
13 Vital rates
2830
Crude Birth Rate, 2001
Total Fertility Rate, 2001
Infant Mortality Rate, 2001
Key RCH indicators from District Level
Household Survey, 2007-08 (%)
1789423
Girls marrying below 18 years
955378
Birth order 3 and above
834045
Current use of any FP Method
74.7
Total unmet need
25.3
33.72
0.82
Mothers who had at least 3 ANC visits during
the last pregnancy
6.4
32.4
Institutional delivery
23
27.53
Children with full immunization
224
Medical/Health Infrastructures/
Institutions
865
873
CHCs
PHCs
894
Sub-Centres
849
Information on HIV/AIDS
64.74
75.53
HIV+ among ANC clinics (%)
52.44
HIV+ among STD clinics (%)
40.2 Number of Integrated Counseling and Testing
25.0
Centres (ICTC formerly VCTC)
Number of Anti Retroviral Therapy (ART) Centres
52.7
75.6
63.28
27.1
3.4
53
15.4
29.1
73.0
9.3
38.7
40.7
62.7
11
40
350
3.0
1.20
4
-
| 167

18.2 Page 172

▲back to top


d i str i c t
HANUMANGARH
Showing CD Blocks
168 |

18.3 Page 173

▲back to top


DISTRICT HANUMANGARH
General information
Area (Sq. Kms.)
Percent to total state’s area
C D Blocks
Towns
No. of Villages
Demographic particulars (Census, 2001)
Population
Persons
Males
Females
Rural (%)
Urban (%)
Scheduled Castes (%)
Scheduled Tribes (%)
Elderly population (60+ years) (%)
Young people (10-24 years) (%)
Adolescents (10-19 years)(%)
Decadal Growth Rate, 1991-2001 (%)
Population density (per sq. km)
Sex Ratio (females per 1000 males)
1991
2001
Child Sex Ratio (0-6 years) (girls per 1000 boys)
1991
2001
Literacy rate (7+)
Persons
Males
Females
Total work participation rate
Female work participation rate
Household amenities, (%), Census 2001
12650
Households with kutchha houses
3.7
Households with safe drinking water
7
Households with electricity connection
6 Vital rates
1773
Crude Birth Rate, 2001
Total Fertility Rate, 2001
Infant Mortality Rate, 2001
Key RCH indicators from District Level
Household Survey, 2007-08 (%)
1518005
Girls marrying below 18 years
801486
Birth order 3 and above
716519
Current use of any FP Method
80
Total unmet need
20
26.13
0.66
Mothers who had at least 3 ANC visits during
the last pregnancy
6.3
32.6
Institutional delivery
23.4
24.34
Children with full immunization
120
Medical/Health Infrastructures/
Institutions
891
894
CHCs
PHCs
898
Sub-Centres
871
Information on HIV/AIDS
63.05
75.18
HIV+ among ANC clinics (%)
49.56
HIV+ among STD clinics (%)
41.4 Number of Integrated Counseling and Testing
29.9
Centres (ICTC formerly VCTC)
Number of Anti Retroviral Therapy (ART) Centres
50.3
72.4
59.46
27.2
3.4
61
29.1
23.5
74.5
9.9
34.5
33.8
61.8
8
39
279
-
0.40
2
-
| 169

18.4 Page 174

▲back to top


d i str i c t
JAIPUR
Showing
CD Blocks
170 |

18.5 Page 175

▲back to top


DISTRICT JAIPUR
General information
Area (Sq. Kms.)
Percent to total state’s area
C D Blocks
Towns
No. of Villages
Demographic particulars (Census, 2001)
Population
Persons
Males
Females
Rural (%)
Urban (%)
Scheduled Castes (%)
Scheduled Tribes (%)
Elderly population (60+ years) (%)
Young people (10-24 years) (%)
Adolescents (10-19 years)(%)
Decadal Growth Rate, 1991-2001 (%)
Population density (per sq. km)
Sex Ratio (females per 1000 males)
1991
2001
Child Sex Ratio (0-6 years) (girls per 1000 boys)
1991
2001
Literacy rate (7+)
Persons
Males
Females
Total work participation rate
Female work participation rate
Household amenities, (%), Census 2001
11143
Households with kutchha houses
3.3
Households with safe drinking water
13
Households with electricity connection
13 Vital rates
2077
Crude Birth Rate, 2001
Total Fertility Rate, 2001
Infant Mortality Rate, 2001
Key RCH indicators from District Level
Household Survey, 2007-08 (%)
5251071
Girls marrying below 18 years
2768203
Birth order 3 and above
2482868
Current use of any FP Method
50.6
Total unmet need
49.4
14.81
7.86
Mothers who had at least 3 ANC visits during
the last pregnancy
6.1
32.4
Institutional delivery
23.1
35.10
Children with full immunization
471
Medical/Health Infrastructures/
Institutions
892
897
CHCs
PHCs
925
Sub-Centres
898
Information on HIV/AIDS
69.90
82.80
HIV+ among ANC clinics (%)
55.52
HIV+ among STD clinics (%)
35.5 Number of Integrated Counseling and Testing
22.3
Centres (ICTC formerly VCTC)
Number of Anti Retroviral Therapy (ART) Centres
11.0
77.9
75.34
29.6
3.8
68
43.4
33.7
63.2
16.5
26.6
62.4
53.8
18
88
515
0.25
3.60
3
1
| 171

18.6 Page 176

▲back to top


d i str i c t
JAISALMER
Showing CD Blocks
172 |

18.7 Page 177

▲back to top


DISTRICT JAISALMER
General information
Area (Sq. Kms.)
Percent to total state’s area
C D Blocks
Towns
No. of Villages
Demographic particulars (Census, 2001)
Population
Persons
Males
Females
Rural (%)
Urban (%)
Scheduled Castes (%)
Scheduled Tribes (%)
Elderly population (60+ years) (%)
Young people (10-24 years) (%)
Adolescents (10-19 years)(%)
Decadal Growth Rate, 1991-2001 (%)
Population density (per sq. km)
Sex Ratio (females per 1000 males)
1991
2001
Child Sex Ratio (0-6 years) (girls per 1000 boys)
1991
2001
Literacy rate (7+)
Persons
Males
Females
Total work participation rate
Female work participation rate
Household amenities, (%), Census 2001
38428
Households with kutchha houses
11.2
Households with safe drinking water
3
Households with electricity connection
2 Vital rates
600
Crude Birth Rate, 2001
Total Fertility Rate, 2001
Infant Mortality Rate, 2001
Key RCH indicators from District Level
Household Survey, 2007-08 (%)
508247
Girls marrying below 18 years
279101
Birth order 3 and above
229146
Current use of any FP Method
85.0
Total unmet need
15.0
14.58
5.48
Mothers who had at least 3 ANC visits during
the last pregnancy
6.0
30.1
Institutional delivery
21.5
47.45
Children with full immunization
13
Medical/Health Infrastructures/
Institutions
807
821
CHCs
PHCs
851
Sub-Centres
868
Information on HIV/AIDS
50.97
66.26
HIV+ among ANC clinics (%)
32.05
HIV+ among STD clinics (%)
41.7 Number of Integrated Counseling and Testing
29.4
Centres (ICTC formerly VCTC)
Number of Anti Retroviral Therapy (ART) Centres
47.1
52.4
28.91
39.7
5.8
70
41.1
41.3
51.1
20.9
18.5
26.3
41.3
5
15
136
0.25
-
2
-
| 173

18.8 Page 178

▲back to top


d i str i c t
JALOR
Showing
CD Blocks
174 |

18.9 Page 179

▲back to top


DISTRICT JALOR
General information
Area (Sq. Kms.)
Percent to total state’s area
C D Blocks
Towns
No. of Villages
Demographic particulars (Census, 2001)
Population
Persons
Males
Females
Rural (%)
Urban (%)
Scheduled Castes (%)
Scheduled Tribes (%)
Elderly population (60+ years) (%)
Young people (10-24 years) (%)
Adolescents (10-19 years)(%)
Decadal Growth Rate, 1991-2001 (%)
Population density (per sq. km)
Sex Ratio (females per 1000 males)
1991
2001
Child Sex Ratio (0-6 years) (girls per 1000 boys)
1991
2001
Literacy rate (7+)
Persons
Males
Females
Total work participation rate
Female work participation rate
Household amenities, (%), Census 2001
10640
Households with kutchha houses
3.1
Households with safe drinking water
7
Households with electricity connection
3 Vital rates
697
Crude Birth Rate, 2001
Total Fertility Rate, 2001
Infant Mortality Rate, 2001
Key RCH indicators from District Level
Household Survey, 2007-08 (%)
1448940
Girls marrying below 18 years
737880
Birth order 3 and above
711060
Current use of any FP Method
92.4
Total unmet need
7.6
18.03
8.75
Mothers who had at least 3 ANC visits during
the last pregnancy
6.7
29.9
Institutional delivery
22.4
26.78
Children with full immunization
136
Medical/Health Infrastructures/
Institutions
942
964
CHCs
PHCs
909
Sub-Centres
921
Information o n HIV/AIDS
46.49
64.72
HIV+ among ANC clinics (%)
27.80
HIV+ among STD clinics (%)
50.2 Number of Integrated Counseling and Testing
46.1
Centres (ICTC formerly VCTC)
Number of Anti Retroviral Therapy (ART) Centres
15.3
51.6
38.36
37.3
5.2
88
30.2
41.9
56.9
17.2
30.2
35.1
51.0
8
50
366
0.25
-
2
-
| 175

18.10 Page 180

▲back to top


d i str i c t
JHALAWAR
Showing CD Blocks
176 |

19 Pages 181-190

▲back to top


19.1 Page 181

▲back to top


DISTRICT JHALAWAR
General information
Area (Sq. Kms.)
Percent to total state’s area
C D Blocks
Towns
No. of Villages
Demographic particulars (Census, 2001)
Population
Persons
Males
Females
Rural (%)
Urban (%)
Scheduled Castes (%)
Scheduled Tribes (%)
Elderly population (60+ years) (%)
Young people (10-24 years) (%)
Adolescents (10-19 years)(%)
Decadal Growth Rate, 1991-2001 (%)
Population density (per sq. km)
Sex Ratio (females per 1000 males)
1991
2001
Child Sex Ratio (0-6 years) (girls per 1000 boys)
1991
2001
Literacy rate (7+)
Persons
Males
Females
Total work participation rate
Female work participation rate
Household amenities, (%), Census 2001
6219
Households with kutchha houses
1.8
Households with safe drinking water
7
Households with electricity connection
8 Vital rates
1477
Crude Birth Rate, 2001
Total Fertility Rate, 2001
Infant Mortality Rate, 2001
Key RCH indicators from District Level
Household Survey, 2007-08 (%)
1180323
Girls marrying below 18 years
612804
Birth order 3 and above
567519
Current use of any FP Method
85.7
Total unmet need
14.3
15.64
12.02
Mothers who had at least 3 ANC visits during
the last pregnancy
7.9
29.5
Institutional delivery
21.3
23.34
Children with full immunization
190
Medical/Health Infrastructures/
Institutions
918
926
CHCs
PHCs
944
Sub-Centres
934
Information on HIV/AIDS
57.32
73.31
HIV+ among ANC clinics (%)
40.02
HIV+ among STD clinics (%)
47.0 Number of Integrated Counseling and Testing
39.6
Centres (ICTC formerly VCTC)
Number of Anti Retroviral Therapy (ART) Centres
2.6
67.8
55.83
30.5
4.0
81
55.4
24.2
61.2
15.2
22.1
44.8
36.9
14
28
236
0
-
3
-
| 177

19.2 Page 182

▲back to top


d i str i c t
JHUNJHUNUN
Showing CD Blocks
178 |

19.3 Page 183

▲back to top


DISTRICT JHUNJHUNUN
General information
Area (Sq. Kms.)
Percent to total state’s area
C D Blocks
Towns
No. of Villages
Demographic particulars (Census, 2001)
Population
Persons
Males
Females
Rural (%)
Urban (%)
Scheduled Castes (%)
Scheduled Tribes (%)
Elderly population (60+ years) (%)
Young people (10-24 years) (%)
Adolescents (10-19 years)(%)
Decadal Growth Rate, 1991-2001 (%)
Population density (per sq. km)
Sex Ratio (females per 1000 males)
1991
2001
Child Sex Ratio (0-6 years) (girls per 1000 boys)
1991
2001
Literacy rate (7+)
Persons
Males
Females
Total work participation rate
Female work participation rate
Household amenities, (%), Census 2001
5928
Households with kutchha houses
1.7
Households with safe drinking water
6
Households with electricity connection
13 Vital rates
855
Crude Birth Rate, 2001
Total Fertility Rate, 2001
Infant Mortality Rate, 2001
Key RCH indicators from District Level
Household Survey, 2007-08 (%)
1913689
Girls marrying below 18 years
983526
Birth order 3 and above
930163
Current use of any FP Method
79.4
Total unmet need
20.6
16.16
1.92
Mothers who had at least 3 ANC visits during
the last pregnancy
7.4
33.4
Institutional delivery
25.0
20.90
Children with full immunization
323
Medical/Health Infrastructures/
Institutions
931
946
CHCs
PHCs
900
Sub-Centres
862
Information on HIV/AIDS
73.04
86.09
HIV+ among ANC clinics (%)
59.51
HIV+ among STD clinics (%)
39.8 Number of Integrated Counseling and Testing
32.6
Centres (ICTC formerly VCTC)
Number of Anti Retroviral Therapy (ART) Centres
5.2
75.8
62.80
28.2
3.8
55
30.4
25.7
68.3
13.7
30.2
59.1
57.2
13
70
429
0
1.60
2
-
| 179

19.4 Page 184

▲back to top


d i str i c t
JODHPUR
Showing CD Blocks
180 |

19.5 Page 185

▲back to top


DISTRICT JODHPUR
General information
Area (Sq. Kms.)
Percent to total state’s area
C D Blocks
Towns
No. of Villages
Demographic particulars (Census, 2001)
Population
Persons
Males
Females
Rural (%)
Urban (%)
Scheduled Castes (%)
Scheduled Tribes (%)
Elderly population (60+ years) (%)
Young people (10-24 years) (%)
Adolescents (10-19 years)(%)
Decadal Growth Rate, 1991-2001 (%)
Population density (per sq. km)
Sex Ratio (females per 1000 males)
1991
2001
Child Sex Ratio (0-6 years) (girls per 1000 boys)
1991
2001
Literacy rate (7+)
Persons
Males
Females
Total work participation rate
Female work participation rate
Household amenities, (%), Census 2001
22783
Households with kutchha houses
6.7
Households with safe drinking water
7
Households with electricity connection
6 Vital rates
1058
Crude Birth Rate, 2001
Total Fertility Rate, 2001
Infant Mortality Rate, 2001
Key RCH indicators from District Level
Household Survey, 2007-08 (%)
2886505
Girls marrying below 18 years
1513890
Birth order 3 and above
1372615
Current use of any FP Method
66.1
Total unmet need
33.9
15.81
2.76
Mothers who had at least 3 ANC visits during
the last pregnancy
6.4
31.5
Institutional delivery
22.9
33.77
Children with full immunization
126
Medical/Health Infrastructures/
Institutions
891
907
CHCs
PHCs
913
Sub-Centres
919
Information on HIV/AIDS
56.67
72.96
HIV+ among ANC clinics (%)
38.64
HIV+ among STD clinics (%)
38.3 Number of Integrated Counseling and Testing
27.1
Centres (ICTC formerly VCTC)
Number of Anti Retroviral Therapy (ART) Centres
17.2
75.8
56.63
32.9
4.4
70
38.3
37.5
51.7
25.0
31.9
38.2
41.1
14
66
505
0
-
2
1
| 181

19.6 Page 186

▲back to top


d i str i c t
KARAULI
Showing CD Blocks
182 |

19.7 Page 187

▲back to top


DISTRICT KARAULI
General information
Area (Sq. Kms.)
Percent to total state’s area
C D Blocks
Towns
No. of Villages
Demographic particulars (Census, 2001)
Population
Persons
Males
Females
Rural (%)
Urban (%)
Scheduled Castes (%)
Scheduled Tribes (%)
Elderly population (60+ years) (%)
Young people (10-24 years) (%)
Adolescents (10-19 years)(%)
Decadal Growth Rate, 1991-2001 (%)
Population density (per sq. km)
Sex Ratio (females per 1000 males)
1991
2001
Child Sex Ratio (0-6 years) (girls per 1000 boys)
1991
2001
Literacy rate (7+)
Persons
Males
Females
Total work participation rate
Female work participation rate
Household amenities, (%), Census 2001
5524
Households with kutchha houses
1.6
Households with safe drinking water
6
Households with electricity connection
3 Vital rates
755
Crude Birth Rate, 2001
Total Fertility Rate, 2001
Infant Mortality Rate, 2001
Key RCH indicators from District Level
Household Survey, 2007-08 (%)
1209665
Girls marrying below 18 years
651998
Birth order 3 and above
557667
Current use of any FP Method
85.8
Total unmet need
14.2
23.16
22.37
Mothers who had at least 3 ANC visits during
the last pregnancy
6.8
31.2
Institutional delivery
23.3
29.96
Children with full immunization
218
Medical/Health Infrastructures/
Institutions
840
855
CHCs
PHCs
873
Sub-Centres
873
Information on HIV/AIDS
63.38
79.54
HIV+ among ANC clinics (%)
44.39
HIV+ among STD clinics (%)
39.9 Number of Integrated Counseling and Testing
34.2
Centres (ICTC formerly VCTC)
Number of Anti Retroviral Therapy (ART) Centres
2.5
45.3
35.18
35.9
4.9
85
51.3
43.0
48.3
24.3
13.2
51.7
29.8
5
27
227
0
2.00
2
-
| 183

19.8 Page 188

▲back to top


d istr ic t
Kota
Showing
CD Blocks
184 |

19.9 Page 189

▲back to top


DISTRICT KOTA
General information
Area (Sq. Kms.)
Percent to total state’s area
C D Blocks
Towns
No. of Villages
Demographic particulars (Census, 2001)
Population
Persons
Males
Females
Rural (%)
Urban (%)
Scheduled Castes (%)
Scheduled Tribes (%)
Elderly population (60+ years) (%)
Young people (10-24 years) (%)
Adolescents (10-19 years)(%)
Decadal Growth Rate, 1991-2001 (%)
Population density (per sq. km)
Sex Ratio (females per 1000 males)
1991
2001
Child Sex Ratio (0-6 years) (girls per 1000 boys)
1991
2001
Literacy rate (7+)
Persons
Males
Females
Total work participation rate
Female work participation rate
Household amenities, (%), Census 2001
5443
Households with kutchha houses
1.6
Households with safe drinking water
5
Households with electricity connection
11 Vital rates
812
Crude Birth Rate, 2001
Total Fertility Rate, 2001
Infant Mortality Rate, 2001
Key RCH indicators from District Level
Household Survey, 2007-08 (%)
1568525
Girls marrying below 18 years
827128
Birth order 3 and above
741397
Current use of any FP Method
46.5
Total unmet need
53.5
19.16
9.69
Mothers who had at least 3 ANC visits during
the last pregnancy
6.1
32.6
Institutional delivery
23.3
28.52
Children with full immunization
288
Medical/Health Infrastructures/
Institutions
881
896
CHCs
PHCs
914
Sub-Centres
911
Information on HIV/AIDS
73.53
85.23
HIV+ among ANC clinics (%)
60.43
HIV+ among STD clinics (%)
34.5 Number of Integrated Counseling and Testing
19.4
Centres (ICTC formerly VCTC)
Number of Anti Retroviral Therapy (ART) Centres
3.7
94.1
82.27
27.1
3.5
71
26.4
23.7
63.9
11.0
45.1
65.0
72.3
9
27
161
0.00
0.00
2
-
| 185

19.10 Page 190

▲back to top


d i str i c t
NAGAUR
Showing CD Blocks
186 |

20 Pages 191-200

▲back to top


20.1 Page 191

▲back to top


DISTRICT NAGAUR
General information
Area (Sq. Kms.)
Percent to total state’s area
C D Blocks
Towns
No. of Villages
Demographic particulars (Census, 2001)
Population
Persons
Males
Females
Rural (%)
Urban (%)
Scheduled Castes (%)
Scheduled Tribes (%)
Elderly population (60+ years) (%)
Young people (10-24 years) (%)
Adolescents (10-19 years)(%)
Decadal Growth Rate, 1991-2001 (%)
Population density (per sq. km)
Sex Ratio (females per 1000 males)
1991
2001
Child Sex Ratio (0-6 years) (girls per 1000 boys)
1991
2001
Literacy rate (7+)
Persons
Males
Females
Total work participation rate
Female work participation rate
Household amenities, (%), Census 2001
17718
Households with kutchha houses
5.2
Households with safe drinking water
10
Households with electricity connection
14 Vital rates
1480
Crude Birth Rate, 2001
Total Fertility Rate, 2001
Infant Mortality Rate, 2001
Key RCH indicators from District Level
Household Survey, 2007-08 (%)
2775058
Girls marrying below 18 years
1424967
Birth order 3 and above
1350091
Current use of any FP Method
82.8
Total unmet need
17.2
19.65
0.23
Mothers who had at least 3 ANC visits during
the last pregnancy
7.1
31.6
Institutional delivery
23.4
29.33
Children with full immunization
157
Medical/Health Infrastructures/
Institutions
942
947
CHCs
PHCs
918
Sub-Centres
915
Information on HIV/AIDS
57.28
74.10
HIV+ among ANC clinics (%)
39.67
HIV+ among STD clinics (%)
40.7 Number of Integrated Counseling and Testing
32.9
Centres (ICTC formerly VCTC)
Number of Anti Retroviral Therapy (ART) Centres
11
53.7
53.94
32.3
4.2
72
50.0
34.9
52.7
22.5
27.5
39.3
46.0
17
87
611
0.75
-
2
-
| 187

20.2 Page 192

▲back to top


district
PALI
Showing
CD Blocks
188 |

20.3 Page 193

▲back to top


DISTRICT PALI
General information
Area (Sq. Kms.)
Percent to total state’s area
C D Blocks
Towns
No. of Villages
Demographic particulars (Census, 2001)
Population
Persons
Males
Females
Rural (%)
Urban (%)
Scheduled Castes (%)
Scheduled Tribes (%)
Elderly population (60+ years) (%)
Young people (10-24 years) (%)
Adolescents (10-19 years)(%)
Decadal Growth Rate, 1991-2001 (%)
Population density (per sq. km)
Sex Ratio (females per 1000 males)
1991
2001
Child Sex Ratio (0-6 years) (girls per 1000 boys)
1991
2001
Literacy rate (7+)
Persons
Males
Females
Total work participation rate
Female work participation rate
Household amenities, (%), Census 2001
12387
Households with kutchha houses
3.6
Households with safe drinking water
9
Households with electricity connection
11 Vital rates
936
Crude Birth Rate, 2001
Total Fertility Rate, 2001
Infant Mortality Rate, 2001
Key RCH indicators from District Level
Household Survey, 2007-08 (%)
1820251
Girls marrying below 18 years
918856
Birth order 3 and above
901395
Current use of any FP Method
78.5
Total unmet need
21.5
17.77
5.81
Mothers who had at least 3 ANC visits during
the last pregnancy
8.1
29.5
Institutional delivery
22.3
22.39
Children with full immunization
147
Medical/Health Infrastructures/
Institutions
956
981
CHCs
PHCs
896
Sub-Centres
924
Information on HIV/AIDS
54.39
72.20
HIV+ among ANC clinics (%)
36.48
HIV+ among STD clinics (%)
39.8 Number of Integrated Counseling and Testing
30.9
Centres (ICTC formerly VCTC)
Number of Anti Retroviral Therapy (ART) Centres
5.6
60.4
66.37
32.2
4.4
102
29.6
45.0
50.4
21.2
45.4
38.4
53.5
15
65
426
0.50
-
2
-
| 189

20.4 Page 194

▲back to top


d i str i c t
RAJSAMAND
Showing CD Blocks
190 |

20.5 Page 195

▲back to top


DISTRICT RAJSAMAND
General information
Area (Sq. Kms.)
Percent to total state’s area
C D Blocks
Towns
No. of Villages
Demographic particulars (Census, 2001)
Population
Persons
Males
Females
Rural (%)
Urban (%)
Scheduled Castes (%)
Scheduled Tribes (%)
Elderly population (60+ years) (%)
Young people (10-24 years) (%)
Adolescents (10-19 years)(%)
Decadal Growth Rate, 1991-2001 (%)
Population density (per sq. km)
Sex Ratio (females per 1000 males)
1991
2001
Child Sex Ratio (0-6 years) (girls per 1000 boys)
1991
2001
Literacy rate (7+)
Persons
Males
Females
Total work participation rate
Female work participation rate
Household amenities, (%), Census 2001
3860
Households with kutchha houses
1.1
Households with safe drinking water
7
Households with electricity connection
5 Vital rates
973
Crude Birth Rate, 2001
Total Fertility Rate, 2001
Infant Mortality Rate, 2001
Key RCH indicators from District Level
Household Survey, 2007-08 (%)
987024
Girls marrying below 18 years
493459
Birth order 3 and above
493565
Current use of any FP Method
87.0
Total unmet need
13.0
12.41
13.09
Mothers who had at least 3 ANC visits during
the last pregnancy
8.4
28.0
Institutional delivery
20.3
19.88
Children with full immunization
256
Medical/Health Infrastructures/
Institutions
991
1,000
CHCs
PHCs
943
Sub-Centres
936
Information on HIV/AIDS
55.65
73.99
HIV+ among ANC clinics (%)
37.59
HIV+ among STD clinics (%)
40.7 Number of Integrated Counseling and Testing
30.0
Centres (ICTC formerly VCTC)
Number of Anti Retroviral Therapy (ART) Centres
1.7
71.9
58.75
31.3
3.9
101
43.0
38.0
62.4
12.6
32.0
41.1
64.2
7
35
219
0.50
1.60
2
-
| 191

20.6 Page 196

▲back to top


d i str i c t
SAWAI MADHOPUR
Showing CD Blocks
192 |

20.7 Page 197

▲back to top


DISTRICT SAWAI MADHOPUR
General information
Area (Sq. Kms.)
Percent to total state’s area
C D Blocks
Towns
No. of Villages
Demographic particulars (Census, 2001)
Population
Persons
Males
Females
Rural (%)
Urban (%)
Scheduled Castes (%)
Scheduled Tribes (%)
Elderly population (60+ years) (%)
Young people (10-24 years) (%)
Adolescents (10-19 years)(%)
Decadal Growth Rate, 1991-2001 (%)
Population density (per sq. km)
Sex Ratio (females per 1000 males)
1991
2001
Child Sex Ratio (0-6 years) (girls per 1000 boys)
1991
2001
Literacy rate (7+)
Persons
Males
Females
Total work participation rate
Female work participation rate
Household amenities, (%), Census 2001
4498
Households with kutchha houses
1.3
Households with safe drinking water
7
Households with electricity connection
5 Vital rates
719
Crude Birth Rate, 2001
Total Fertility Rate, 2001
Infant Mortality Rate, 2001
Key RCH indicators from District Level
Household Survey, 2007-08 (%)
1117057
Girls marrying below 18 years
591307
Birth order 3 and above
525750
Current use of any FP Method
81.0
Total unmet need
19.0
19.98
21.58
Mothers who had at least 3 ANC visits during
the last pregnancy
6.8
31.7
Institutional delivery
23.4
27.44
Children with full immunization
248
Medical/Health Infrastructures/
Institutions
870
889
CHCs
PHCs
894
Sub-Centres
901
Information on HIV/AIDS
56.67
75.74
HIV+ among ANC clinics (%)
35.17
HIV+ among STD clinics (%)
42.0 Number of Integrated Counseling and Testing
35.6
Centres (ICTC formerly VCTC)
Number of Anti Retroviral Therapy (ART) Centres
6.2
58.7
40.44
31.7
4.4
82
55.1
30.0
53.1
19.0
18.1
48.6
26.4
4
22
202
0.40
2
-
| 193

20.8 Page 198

▲back to top


d i str i c t
SIKAR
Showing
CD Blocks
194 |

20.9 Page 199

▲back to top


DISTRICT SIKAR
General information
Area (Sq. Kms.)
Percent to total state’s area
C D Blocks
Towns
No. of Villages
Demographic particulars (Census, 2001)
Population
Persons
Males
Females
Rural (%)
Urban (%)
Scheduled Castes (%)
Scheduled Tribes (%)
Elderly population (60+ years) (%)
Young people (10-24 years) (%)
Adolescents (10-19 years)(%)
Decadal Growth Rate, 1991-2001 (%)
Population density (per sq. km)
Sex Ratio (females per 1000 males)
1991
2001
Child Sex Ratio (0-6 years) (girls per 1000 boys)
1991
2001
Literacy rate (7+)
Persons
Males
Females
Total work participation rate
Female work participation rate
Household amenities, (%), Census 2001
7732
Households with kutchha houses
2.3
Households with safe drinking water
6
Households with electricity connection
11 Vital rates
986
Crude Birth Rate, 2001
Total Fertility Rate, 2001
Infant Mortality Rate, 2001
Key RCH indicators from District Level
Household Survey, 2007-08 (%)
2287788
Girls marrying below 18 years
1172753
Birth order 3 and above
1115035
Current use of any FP Method
79.3
Total unmet need
20.7
14.85
2.73
Mothers who had at least 3 ANC visits during
the last pregnancy
7.0
33.2
Institutional delivery
24.9
24.11
Children with full immunization
296
Medical/Health Infrastructures/
Institutions
946
951
CHCs
PHCs
904
Sub-Centres
885
Information on HIV/AIDS
70.47
84.34
HIV+ among ANC clinics (%)
56.11
HIV+ among STD clinics (%)
38.8 Number of Integrated Counseling and Testing
31.5
Centres (ICTC formerly VCTC)
Number of Anti Retroviral Therapy (ART) Centres
8.2
71.1
67.17
29.5
3.9
58
29.0
29.7
57.8
20.2
33.4
59.7
46.5
16
67
496
0.25
1.20
2
-
| 195

20.10 Page 200

▲back to top


d i str i c t
SIROHI
Showing
CD Blocks
196 |

21 Pages 201-210

▲back to top


21.1 Page 201

▲back to top


DISTRICT SIROHI
General information
Area (Sq. Kms.)
Percent to total state’s area
C D Blocks
Towns
No. of Villages
Demographic particulars (Census, 2001)
Population
Persons
Males
Females
Rural (%)
Urban (%)
Scheduled Castes (%)
Scheduled Tribes (%)
Elderly population (60+ years) (%)
Young people (10-24 years) (%)
Adolescents (10-19 years)(%)
Decadal Growth Rate, 1991-2001 (%)
Population density (per sq. km)
Sex Ratio (females per 1000 males)
1991
2001
Child Sex Ratio (0-6 years) (girls per 1000 boys)
1991
2001
Literacy rate (7+)
Persons
Males
Females
Total work participation rate
Female work participation rate
Household amenities, (%), Census 2001
5136
Households with kutchha houses
1.5
Households with safe drinking water
5
Households with electricity connection
6 Vital rates
455
Crude Birth Rate, 2001
Total Fertility Rate, 2001
Infant Mortality Rate, 2001
Key RCH indicators from District Level
Household Survey, 2007-08 (%)
851107
Girls marrying below 18 years
437949
Birth order 3 and above
413158
Current use of any FP Method
82.3
Total unmet need
17.7
19.15
24.76
Mothers who had at least 3 ANC visits during
the last pregnancy
6.6
29.2
Institutional delivery
21.3
30.08
Children with full immunization
166
Medical/Health Infrastructures/
Institutions
949
943
CHCs
PHCs
918
Sub-Centres
918
Information on HIV/AIDS
53.94
69.89
HIV+ among ANC clinics (%)
37.15
HIV+ among STD clinics (%)
40.4 Number of Integrated Counseling and Testing
30.1
Centres (ICTC formerly VCTC)
Number of Anti Retroviral Therapy (ART) Centres
4.2
78.3
61.46
35.3
4.7
87
29.4
42.9
55.3
18.3
36.1
46.5
61.9
6
22
187
0.50
-
2
-
| 197

21.2 Page 202

▲back to top


d istr ic t
TONK
Showing
CD Blocks
198 |

21.3 Page 203

▲back to top


DISTRICT TONK
General information
Area (Sq. Kms.)
Percent to total state’s area
C D Blocks
Towns
No. of Villages
Demographic particulars (Census, 2001)
Population
Persons
Males
Females
Rural (%)
Urban (%)
Scheduled Castes (%)
Scheduled Tribes (%)
Elderly population (60+ years) (%)
Young people (10-24 years) (%)
Adolescents (10-19 years)(%)
Decadal Growth Rate, 1991-2001 (%)
Population density (per sq. km)
Sex Ratio (females per 1000 males)
1991
2001
Child Sex Ratio (0-6 years) (girls per 1000 boys)
1991
2001
Literacy rate (7+)
Persons
Males
Females
Total work participation rate
Female work participation rate
Household amenities, (%), Census 2001
7194
Households with kutchha houses
2.1
Households with safe drinking water
7
Households with electricity connection
8 Vital rates
1032
Crude Birth Rate, 2001
Total Fertility Rate, 2001
Infant Mortality Rate, 2001
Key RCH indicators from District Level
Household Survey, 2007-08 (%)
1211671
Girls marrying below 18 years
626436
Birth order 3 and above
585235
Current use of any FP Method
79.1
Total unmet need
20.9
19.24
12.04
Mothers who had at least 3 ANC visits during
the last pregnancy
7.3
30.8
Institutional delivery
22.4
24.24
Children with full immunization
168
Medical/Health Infrastructures/
Institutions
923
934
CHCs
PHCs
931
Sub-Centres
927
Information on HIV/AIDS
51.97
70.52
HIV+ among ANC clinics (%)
32.15
HIV+ among STD clinics (%)
44.0 Number of Integrated Counseling and Testing
38.3
Centres (ICTC formerly VCTC)
Number of Anti Retroviral Therapy (ART) Centres
19.8
62
48.20
32.1
4.2
94
61.4
34.5
52.3
18.6
38.6
47.4
46.7
7
45
250
-
-
2
-
| 199

21.4 Page 204

▲back to top


d i str i c t
UDAIPUR
Showing CD Blocks
200 |

21.5 Page 205

▲back to top


DISTRICT UDAIPUR
General information
Area (Sq. Kms.)
Percent to total state’s area
C D Blocks
Towns
No. of Villages
Demographic particulars (Census, 2001)
Population
Persons
Males
Females
Rural (%)
Urban (%)
Scheduled Castes (%)
Scheduled Tribes (%)
Elderly population (60+ years) (%)
Young people (10-24 years) (%)
Adolescents (10-19 years)(%)
Decadal Growth Rate, 1991-2001 (%)
Population density (per sq. km)
Sex Ratio (females per 1000 males)
1991
2001
Child Sex Ratio (0-6 years) (girls per 1000 boys)
1991
2001
Literacy rate (7+)
Persons
Males
Females
Total work participation rate
Female work participation rate
Household amenities, (%), Census 2001
13419
Households with kutchha houses
3.9
Households with safe drinking water
10
Households with electricity connection
10 Vital rates
2339
Crude Birth Rate, 2001
Total Fertility Rate, 2001
Infant Mortality Rate, 2001
Key RCH indicators from District Level
Household Survey, 2007-08 (%)
2633312
Girls marrying below 18 years
1336004
Birth order 3 and above
1297308
Current use of any FP Method
81.4
Total unmet need
18.6
6.01
47.86
Mothers who had at least 3 ANC visits during
the last pregnancy
6.9
29.1
Institutional delivery
20.8
27.37
Children with full immunization
196
Medical/Health Infrastructures/
Institutions
956
971
CHCs
PHCs
958
Sub-Centres
948
Information on HIV/AIDS
58.62
73.62
HIV+ among ANC clinics (%)
43.26
HIV+ among STD clinics (%)
41.8 Number of Integrated Counseling and Testing
31.8
Centres (ICTC formerly VCTC)
Number of Anti Retroviral Therapy (ART) Centres
5.5
70.9
45.95
32.7
4.1
96
37.5
42.4
66.6
11.7
26.9
39.4
77.0
18
68
531
-
6.00
2
1
| 201

21.6 Page 206

▲back to top


References
1 Bulletin on Rural Health Statistics in India, (2006), Ministry of Health and Family Welfare Government of
India
2 Central Bureau of Health Intelligence, (2006), Health Information of India, 2005, Ministry of Health & Family
Welfare, Government of India
3 Council for Social Development (2006), India Social Development Report, OXFORD
4 Christophe Z Guilmoto, S Irudaya Rajan, District Level Estimates of Fertility from India’s 2001 Census, Economic
and Political Weekly February 16, 2002
5 Directorate of Census Operations, (2001), Gujarat, Primary Census Abstract, Census of India, 2001
6 Directorate of Census Operations, (2001), Maharashtra, Primary Census Abstract, Census of India, 2001
7 Directorate of Census Operations, (2001), Rajasthan, Primary Census Abstract, Census of India, 2001
9 Directorate of Census Operations, Gujarat, (2001), Provisional Population Totals,Paper-1 of 2001,Census of
India,2001
10 Directorate of Census Operations, Maharashtra, (2001) Provisional Population Totals,Paper-1 of 2001,Census
of India,2001
11 Directorate of Census Operations, Rajasthan, (2001), Provisional Population Totals,Paper-1 of 2001,Census of
India,2001
12 International Institute for Population Sciences (IIPS), Mumbai and ORC Macro, (2006) National Family Health
Survey (NFHS-III)-Fact Sheets, Gujarat, Maharashtra, Rajasthan, 2005-06
13 International Institute for Population Sciences (IIPS), Mumbai, (2006), Reproductive and Child Health-District
Level Household Survey (RCH-DLHS), 2006-2008
14 International Institute for Population Sciences (IIPS), Mumbai, (2006), National Family Health Survey, 2005-2006
15 Ministry of Finance, Economic Division, (2010), Economic Survey, 2009-10, Government of India
16 National Institute of Health & Family Welfare (NIHFW) and National AIDS Control Organization (NACO), New
Delhi (2008), Annual Sentinel Surveillance for HIV Infection in India: Country Report ,2007.
17 Poverty Estimates for 2004-05. Press Information Bureau, Planning Commission, Govt. of India, New
Delhi, March 2007
18 Registrar General and Census Commissioner India, (2001), Report and Tables on Age,C-14,2001, Census of
India, 2001
19 Registrar General of India, (2006), SRS based Abridged Life Tables, 1999-2003.
20 Registrar General of India, (2001), Housing Atlas of India, Census of India, 2004.
21 Registrar General of India, (2001), Tables on Housing and Household Amenities, Census of India, 2001
22 Registrar General of India, (2004), Primary Census Abstract, Total Population: Table A-5, Series-I, New Delhi,
Census of India, 2001
23 Registrar General of India, (2006), Sample Registration System, SRS Bulletin, October, 2009
24 Registrar General of India, (2004), Sample Registration System, Statistical Report No.1 of 2008
25 Sample Registration System, Special Bulletin on Maternal Mortality in India 2004-06, Office of the
RGI,2009
26 UNDP, (2002), Human Development Indices in India: Trends and Analysis
202 |

21.7 Page 207

▲back to top


glossary
1. Anaemia
Severe: Anaemia-haemoglobin level <11.0 grams/deciliter (g/dl) for children and pregnant women and
<12.0 g/dl for non pregnant women.
Stunted: Stunting assessed is by height-for-age,
Wasted: wasting is assessed by weight-for-height
Underweight: is assessed by weight-for-age.
2. Child Sex Ratio (0-6 years): Number of girls in the age-group 0-6 years per 1000 boys in the same age-
group.
3. Crude Birth Rate (CBR): Total number of births in a given year and in a given geographical area per
thousand mid-year (average) population in the same year and geographical area.
4. Crude Death Rate (CDR): Total number of deaths in a given year and in a given geographical area per
thousand mid-year (average) population in the same year and geographical area.
5. Electrified Households: Households having electricity as source of lighting.
6. Human Development Index (HDI): The Human Development Index (HDI) is a summary measure of human
development. It measures the average achievement of the country in three basic dimensions of human
development i.e., health, education and income.
7. Infant Mortality Rate (IMR): The number of deaths of infants under age 1 per 1,000 live births in a given
year.
8. Life Expectancy at Birth: Average number of years a new born child is expected to live under current
mortality conditions.
9. Literacy Rate: Percentage of literates to the total population age 7 years and above.
10. Maternal Mortality Ratio (MMR): Number of deaths of women during pregnancy or within 42 days of
termination of pregnancy from any cause related to pregnancy/childbearing and childbirth per 100,000 live
births in a given year.
11. Safe Drinking Water: Drinking water from the safe sources such as Tap, Hand Pump and Tube Well are
classified as safe drinking water.
12. Social Development Index (SDI): The social development index captures six major dimensions of social
development namely demographic parameters, health situation, educational attainments, availability of basic
amenities, incidence of unemployment, poverty and extent of social deprivation.
13. Sex Ratio: Number of females per 1000 males in the population.
14. Temporary Houses (Kutchha Houses): Houses in which both walls and roof are made of materials,
which have to be replaced frequently. Walls may be made from any one of the following temporary materials,
namely, grass, thatch, bamboo, plastic, polythene, mud, unburnt bricks or wood. Roof may be made from any
one of the following temporary materials, namely, grass, thatch, bamboo, wood, mud, plastic or polythene.
15. Total Fertility Rate (TFR): The average number of children that would be born alive to a woman during her
life time if she were to pass through her child bearing years conforming to the age specific fertility rates of a
given year.
16. Work Participation Rate: Percentage of total workers (main and marginal) to total population.
| 203

21.8 Page 208

▲back to top