JRD Tata Award 2018

JRD Tata Award 2018


1 Pages 1-10

▲back to top


1.1 Page 1

▲back to top


The 6th JRD Tata Memorial Awards & Oration I 1

1.2 Page 2

▲back to top


1.3 Page 3

▲back to top


Contents
JRD Tata – The Man and His Vision
3
Population Foundation of India5
The 14th JRD Tata Memorial Oration
6
The Award7
The 6th JRD Tata Memorial Awards, 2018
9
The Technical Advisory Committee
9
Categories9
Indicators10
Data Sources12
State Level Winners12
Union Territory Level Winner
14
District Level Winners15
Annexure 1: Methodology Followed for Selection of Winners
18
Annexure 2: Descriptions of Indicators
21

1.4 Page 4

▲back to top


“So far, the general targets of family planning
communication have been married couples
and sometimes, their parents! But what about
the youth? There is urgent need to undertake a
systematic education of adolescents to prepare
them for the tasks of tomorrow”
- JRD Tata
2 I The 6th JRD Tata Memorial Awards & Oration

1.5 Page 5

▲back to top


JRD Tata – The Man and His Vision
The late Mr JRD Tata was a stalwart among Indians of the 20th century.
His influence and the stamp of his personality on the country’s affairs
were significant, both before and after independence. Mr Tata promoted
and fostered several causes in the service of science and the nation. His
holistic view of the population issue turned him into a strong humanist,
deeply concerned with the problems of poverty and the environment. He
was one of the first to bring to notice the issue of family planning, during
a speech in 1951, where he highlighted the continuous and fast growth
of India’s population and its consequences on the country’s economy and
progress. He promoted the need for slowing India’s rapidly increasing
population and envisioned healthy and happy families which would take
an active part in a growing economy.
Realizing the need for non-governmental action, he founded the Family
Planning Foundation in 1970 and served as its Founder Chairman. Family
Planning Foundation was rechristened the Population Foundation of India
(PFI) in 1993 to reflect the wider dimensions of the population issue in a
changing world.
Mr Tata’s unique services to the cause of population were recognised by
the United Nations and he was conferred with the prestigious Population
Award in 1992. In the same year, for his many achievements and service
to the nation, he was awarded the Bharat Ratna, India’s highest civilian
award.
The 6th JRD Tata Memorial Awards & Oration I 3

1.6 Page 6

▲back to top


JRD Tata lights the lamp to inaugurate the PFI office building in New Delhi
Photo: PFI
4 I The 6th JRD Tata Memorial Awards & Oration

1.7 Page 7

▲back to top


Population Foundation of India
The Population Foundation of India, formerly known as Family Planning
Foundation, was established in 1970 by a dedicated group of industrialists
and population activists led by Bharat Ratna the late Mr JRD Tata. He guided
it as the Founder Chairman until his death in 1993, when Dr. Bharat Ram,
noted industrialist and a founding member, became the Chairman of the
Governing Board. After Dr. Bharat Ram’s demise in 2007, Mr Hari Shankar
Singhania took over as the Chairman. Currently the Governing Board is
chaired by Mr. Keshav Desiraju, former Secretary, Ministry of Health and
Family Welfare.
Today, PFI is a national NGO, which promotes and advocates for the
effective formulation and implementation of gender sensitive population,
health and development strategies, policies and programmes. It addresses
population issues within the larger discourse of empowering women and
men, so that they can take informed decisions related to their fertility, health
and well-being. PFI works with the government, both at the national and
state levels, and with NGOs, in the areas of community action for health,
urban health, scaling up of successful pilots and social and behaviour
change communication. Besides implementing projects, PFI has played
a significant role in giving grants to Indian non-government organizations
implementing and scaling up innovative projects.
PFI is guided by an eminent governing board and advisory council
comprising distinguished persons from civil society, the government
and the private sector.
The 6th JRD Tata Memorial Awards & Oration I 5

1.8 Page 8

▲back to top


The 14th JRD Tata Memorial Oration
In 1990, PFI instituted an annual lecture series `Encounter with
Population Crisis’ and invited notable international and national
guest speakers to deliver a lecture focusing on critical issues related
to population and development. In 1995 (PFI’s Silver Jubilee year),
the series was rechristened as the `JRD Tata Memorial Oration’, in the
memory of the late Mr. JRD Tata, the founder chairman of PFI.
The JRD Tata Memorial Oration is an important event for PFI. It is an
occasion for PFI to pay tributes to one of its founders and to bring
to the fore for discussion and advocacy key issues on population
relevant to the times. The oration is followed by distinguished guests
and experts raising pertinent issues, which the speaker responds to,
creating a lively discussion and a diffusion of ideas.
Listed below are the topics and the speakers who delivered the
Oration over the years:
1. Democratic Decentralisation and Population Stabilisation Strategies
by Mr. Ramakrishna Hegde (September 19, 1995)
2. Population and Development Crisis in India
by Mr .Chandra Shekhar (October 26, 1996)
3. Role of Empowerment of Women in Population Stabilisation.
by Dr. Najma Heptulla (November 29, 1997)
4. Thrust Areas for Population Stabilisation
by Mr. I K Gujral (January 15, 1999)
5. A ‘New Woman’ for India- A New India for Women
by Dr Nafis Sadik (December 13, 1999)
6. National Population Policy 2000 - Role of the National
Commission on Population
by Mr K C Pant (November 3, 2000)
7. Role and Responsibilities of Panchayats in Population Health and
Development
by Mr Digvijay Singh (December 4, 2001)
8. Population, Poverty and Sustainable Development
by Dr Manmohan Singh (February 3, 2003)
9. Towards Population Stabilization: Role of Good Governance
by Mr Somnath Chatterjee (March 30, 2005)
6 I The 6th JRD Tata Memorial Awards & Oration

1.9 Page 9

▲back to top


10. Corporate Social Responsibility and Issues of Population
Stabilisation in India
by Dr. Jamshed J Irani (July 22, 2008)
11. Demographic Dividend or Debt?
by Dr. Nitin Desai (March 26, 2010)
12. Women and Other People
by Prof Amartya Sen (July 31, 2012)
13. Dignity and Choice for girls and women in the post-2015
framework
by Dr. Babatunde Osotimehin (April 24, 2015)
The 14th JRD Tata Memorial Oration in 2018 will be delivered
by Dr Rajiv Kumar, Vice-Chairman, NITI Aayog.
The Award
Mr JRD Tata through his life’s work built a strong base for a social movement
for stabilizing the growth of India’s population towards the goal of securing
a better quality of life for its people. PFI, as a tribute to its visionary leader,
decided to institute a national award in his name that furthered the cause
for which he was acknowledged as a champion across the world. In February
1996, the Governing Board formally instituted the JRD Tata Memorial Awards,
a national level award for best state and best districts achieving outstanding
performance in population, reproductive health,
and family planning.
The selection of winners for the awards is dependent not just on current levels
of performance on select key indicators but the emphasis has been on the
change factor, signifying the pace of progress achieved over a period. It is well
known that while there is slow progress in some states, there are states, which
have made significant strides. This demonstrates that, given the leadership, will
and conditions, such successes can be scaled up to other regions. The awards
are a recognition of this sustained effort with the hope that this will generate
the much-needed impetus and confidence among others to achieve the same
standards. The criteria adopted for the selection covers various aspects of
human development and reproductive health.
The 6th JRD Tata Memorial Awards & Oration I 7

1.10 Page 10

▲back to top


The Award Presenters
The awards have found staunch support from the government and civil
society as is evident in the list of eminent persons who have presented
these awards:
1997 - Prime Minister of India, Mr. I. K. Gujral
2001 - Union Minister of Health and Family Welfare, Dr. C. P. Thakur
2003 - Vice-President of India, Mr. Bhairon Singh Shekhawat
2009 - Vice-President of India, Mr. M. Hamid Ansari
2012 - Professor Amartya Sen
Table 1: An Overview of Award Winners 1997-2012
Year
1997
Best Performing
State
Kerala
District
Palakkad, Kerala
Thoothukudi, Tamil Nadu
Kurukshetra, Haryana
Best Performing Districts
Category
Large population size
Medium population size
Small population size
2000
Tamil Nadu
Chennai, Tamil Nadu
Alappuzha, Kerala
Jorhat, Assam
Large population size
Medium population size
Small population size
Dehradun, UP(now in Uttarakhand)
Purbi Singhbhum, Bihar
Cuttack, Odisha
Best performing district in not-so-good
performing states
2003
Himachal Pradesh
West Godavari, Andhra Pradesh
Churu, Rajasthan
Lahaul and Spiti, Himachal Pradesh
Large population size
Medium population size
Small population size
Ri-Bhoi, Meghalaya
Ranchi, Jharkhand
Bhagalpur, Bihar
Best performing district in not-so-good
performing states
2009
Chhattisgarh
-
Sikkim
-
Large states
Small states
2012
Mizoram
(High Focus)
Varanasi, Uttar Pradesh
Jajpur, Odisha
Thoubal, Manipur
Large population size
Medium population size
Small population size
Goa
(Non-High Focus)
Ahmednagar, Maharashtra
Firozpur, Punjab
North Goa, Goa
Large population size
Medium population size
Small population size
8 I The 6th JRD Tata Memorial Awards & Oration

2 Pages 11-20

▲back to top


2.1 Page 11

▲back to top


The 6th JRD Tata Memorial Awards, 2018
The Technical Advisory Committee
A Technical Advisory Committee (TAC) comprising of experts from
diverse sectoral affiliations guided PFI in identifying the appropriate
indicators and methodology for the selection of the states and districts
for the awards.
Prof. P.M. Kulkarni, Retired Professor, Centre for Study in
Regional Development, Jawaharlal Nehru University, New
Delhi: Chair of TAC
Mr Keshav Desiraju, Former Secretary, Ministry of Health and
Family Welfare, Government of India and Chairman, PFI’s
Governing Board
Dr Arvind Pandey, Former Director, National Institute of Medical
Statistics, Indian Council for Medical Research
Dr Shireen Jejeebhoy, Demographer and Social Scientist, and
Member of PFI’s Governing Board
Dr Rajani R. Ved, Executive Director, National Health Systems
Resource Centre
Prof. Amitabh Kundu, Retired Professor, Centre for the Study of
Regional Development, School of Social Sciences, Jawaharlal
Nehru University, New Delhi
Dr S. K. Sikdar, Deputy Commissioner, Family Planning,
Ministry of Health and Family Welfare, Government of India
Ms Poonam Muttreja, Executive Director, Population Foundation
of India
Categories
The states eligible for the award were categorized according to the
classification under the National Health Mission (NHM) guidelines,
with few modifications e.g. Assam has been included in ‘High Focus
Large States’ and Delhi has been included in ‘Non-High Focus Large
States. Further, districts were chosen based on wealth index in each
state category.
The 6th JRD Tata Memorial Awards & Oration I 9

2.2 Page 12

▲back to top


Table 2: Classification of States and Union Territories
State Category
State Name
High Focus
Large States
(11 states)
Assam; Bihar; Chhattisgarh; Himachal Pradesh;
Jammu & Kashmir; Jharkhand, Madhya
Pradesh; Odisha; Rajasthan; Uttar Pradesh;
Uttarakhand
District Category
Wealth index1
Low wealth level (113 districts)
Moderate wealth level (117 districts)
High wealth level (108 districts)
Non-High Focus
Large States
(12 states)
High Focus
North East States
(7 states)
Union Territories
(UTs)
(6 UTs)
Andhra Pradesh; Delhi; Goa; Gujarat; Haryana;
Karnataka; Kerala; Maharashtra; Punjab; Tamil
Nadu; Telangana; West Bengal
Arunachal Pradesh; Manipur; Meghalaya;
Mizoram; Nagaland; Sikkim; Tripura
Andaman & Nicobar Islands; Chandigarh;
Dadra & Nagar Haveli; Daman & Diu;
Lakshadweep; Puducherry
Wealth index
Low wealth level (72 districts)
Moderate wealth level (74 districts)
High wealth level (85 districts)
Wealth index
Low wealth level (21 districts)
Moderate wealth level (16 districts)
High wealth level (22 districts)
TOTAL TO BE SELECTED FOR THE AWARD – 3 STATES, 1 UT AND 9 DISTRICTS
Indicators
The indicators selected have a bearing on water, sanitation and hygiene,
women’s education and empowerment, gender-based violence, marriage
and fertility, family planning, maternal health, child health and nutrition,
anaemia, sex ratio, neonatal, infant and child mortality rates. This range
is clearly indicative of PFI’s commitment to looking at family planning
and population concerns holistically. The complete list of indicators is
provided in the table below and a detailed description of indicators is
given in Annexure 2.
1Three classes were formed on the basis of percentage of households in the district in the lower two quintiles of wealth index. In the
absence of data on income or consumption, percentage of households in a district in the lowest two quintiles of the wealth index was used
as an indicator of the level of poverty and districts classified as those with High wealth level, Moderate wealth level, and Low wealth level.
10 I The 6th JRD Tata Memorial Awards & Oration

2.3 Page 13

▲back to top


Table 3: List of indicators at State/Union Territory and District level
Broad Category
State and UT level
District Level
Water, Sanitation and 1. Improved drinking water source
Hygiene (WASH)
2. Improved sanitation facility
3. Menstrual protection*#
1. Improved drinking water source
2. Improved sanitation facility
Women’s Education 4. Women with 10 or more years of schooling*# 3. Women with 10 or more years of schooling*#
Marriage and Fertility 5. Child marriage
6. Teenage childbearing*#
7. Birth order 3 and above
4. Child marriage
5. Teenage childbearing*#
Family Planning
8. Method mix (proportion of spacing methods)
9. Total unmet need for family planning
10. Modern contraceptive prevalence rate (mCPR)*
6. Method mix (proportion of spacing methods)
7. Total unmet need for family planning
8. Modern contraceptive prevalence rate (mCPR)*
Maternal Health
11. Full antenatal care (ANC)
12. Postnatal care within 42 days of delivery*
13. Out-of-pocket expenditure (OOPE) on delivery
in public hospitals*#
14. Safe delivery
15. Institutional births in public facilities*#
9. Full antenatal care (ANC)
10. Postnatal Care within 42 days of delivery
11. Out-of-pocket expenditure (OOPE) on delivery
in public hospitals*#
12. Safe delivery
13. Institutional births in public facilities*#
Child Health and
Nutrition
16. Full immunization
17. Gender parity in full immunization *#
18. Children under 5 years who are stunted*#
19. Gender disparity in children under 5 years who
are stunted*#
20. Percentage of children under age 6 months
exclusively breastfed*#
14. Children under 5 years who are stunted*#
Anaemia
21. Anaemia among women*#
15. Anaemia among women *#
Sex Ratio
22. Sex ratio at birth*#
Neonatal, Infant and
Child Mortality Rates
23. Infant Mortality Rate (IMR)*
24. Gender disparity in Infant Mortality Rate (IMR)*
25. Under-Five Mortality Rate (U5MR)*
26. Gender disparity in Under-Five Mortality Rate
(U5MR)*
27. Neonatal Mortality Rate (NNMR)*#
28. Gender disparity in Neonatal Mortality Rate
(NNMR)*#
Women’s
Empowerment
29. Women’s employment*
30. Women’s access to mobile for their own use*#
31. Women’s freedom of movement*#
32. Women’s participation in decision making*#
Gender-based
Violence
33. Men’s attitudes towards wife-beating*#
34. Spousal violence*#
35. Help seeking in case of experiencing physical
and sexual violence*#
Note:
* New indicators compared to the 5th JRD Tata Memorial Award
# Never used for any of the JRD Tata Memorial Award series
The 6th JRD Tata Memorial Awards & Oration I 11

2.4 Page 14

▲back to top


Data Sources
At state level, NFHS-3 (2005-06) estimates were used as base and
NFHS-4 (2015-16) estimates as final. At UT and district level, as
estimates are not available for the base year (2005-06) and DLHS-3 is
not comparable with NFHS-4, it was decided to assess only the recent
performance for them, based on NFHS-4 (2015-16).
State Level Winners
Three winners were selected, one each from ‘High Focus Large States’,
‘Non-High Focus Large States’, ‘High Focus North-East States’. The
methodology used for selecting winners and arriving at a composite
score is detailed in Annexure 1.
Table 4: Composite Scores of States
State
Chhattisgarh
Rajasthan
Jammu & Kashmir
Himachal Pradesh
Odisha
Uttarakhand
Bihar
Assam
Uttar Pradesh
Madhya Pradesh
Jharkhand
Composite Score
High Focus Large State
111.8
110.63
106.15
103.13
98.74
96.41
96.37
94.09
90.58
89.63
87.74
Non - High Focus Large State
Punjab
Goa
West Bengal
Maharashtra
Haryana
Kerala
Karnataka
Tamil Nadu
Gujarat
Andhra Pradesh
Telangana
Delhi
United Andhra (Andhra Pradesh + Telangana)
119.66
107.60
100.73
100.44
98.85
94.68
91.71
90.74
86.67
85.91
84.40
70.40
85.45
Rank
1
2
3
4
5
6
7
8
9
10
11
1
2
3
4
5
6
7
8
9
10
11
12
13
Note: Assam is included in ‘High-Focus Large States’ and Delhi is included in ‘Non-High Focus Large States’
12 I The 6th JRD Tata Memorial Awards & Oration

2.5 Page 15

▲back to top


Table 4: Composite Scores of States (contd.)
State
Composite Score
High Focus North-East State
Sikkim
Meghalaya
Tripura
Mizoram
Nagaland
Arunachal Pradesh
Manipur
115.69
108.93
106.82
99.58
94.56
84.27
80.52
Rank
1
2
3
4
5
6
7
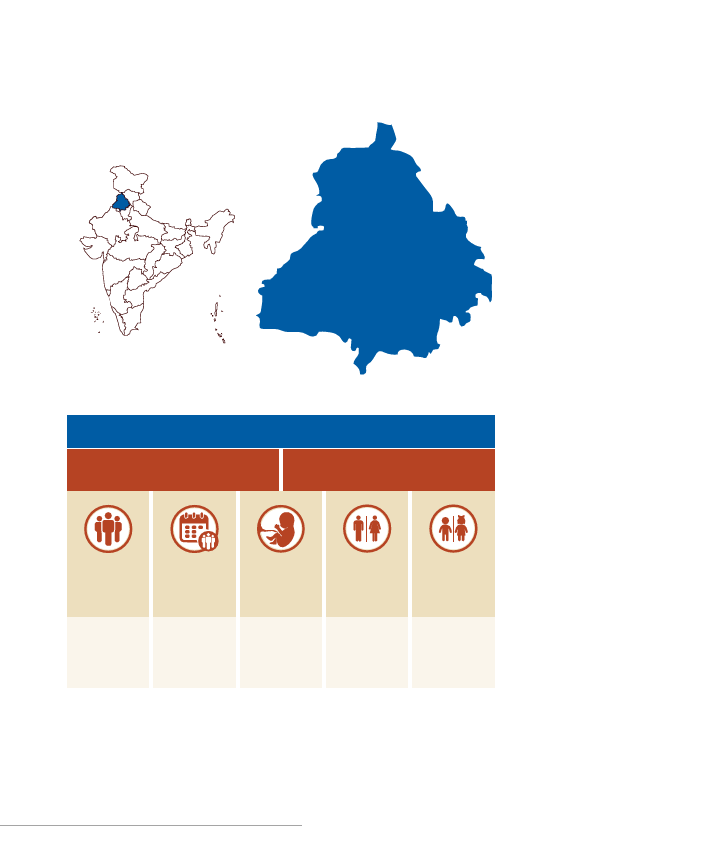
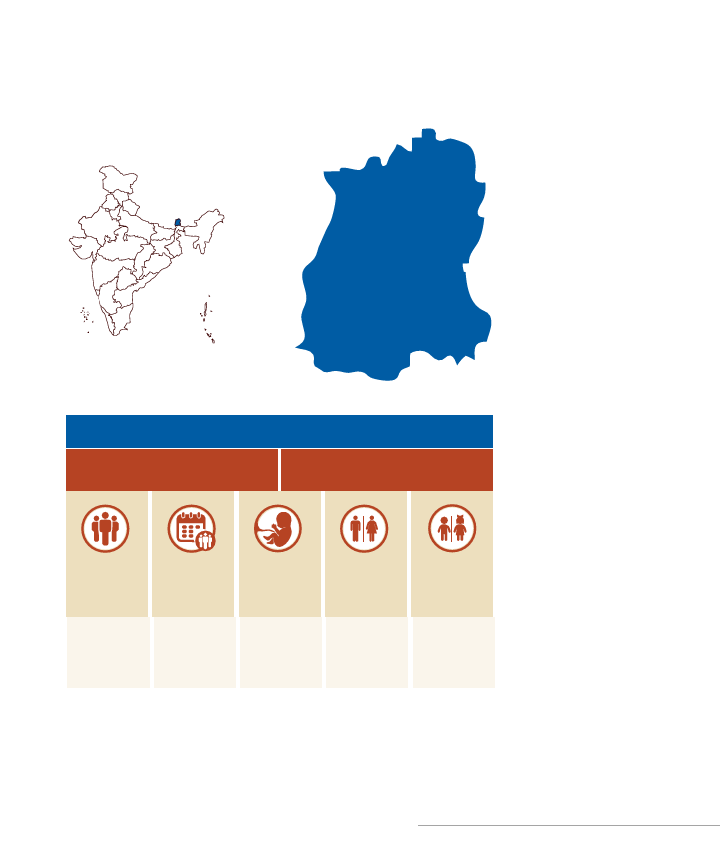
A snapshot of the three award winning states for the 6th JRD Tata
Memorial Award is presented below:
Figure 1: Snapshot of Chhattisgarh, Winner: High Focus Large States
CHHATTISGARH
CHHATTISGARH
Best Performing State
Category - High Focus Large States
Composite Score - 111.8
Total
Population
Decadal
Population
Growth Rate
Total Fertility
Rate
Sex Ratio
Child
Sex Ratio
25,545,198
Increased from
18.27 (2001)
to 22.61 (2011)
Declined from
2.6 (2005-06)
to 2.2(2015-16)
Increased from Decreased from
989 (Census 2001) 975 (2001) to
to
969 (2011)
991(Census 2011)
The 6th JRD Tata Memorial Awards & Oration I 13

2.6 Page 16

▲back to top


Figure 2: Snapshot of Punjab, Winner: Non-High Focus Large States
PUNJAB
PUNJAB
Best Performing State
Category - Non-High Focus Large States
Composite Score - 119.66
Total
Population
Decadal
Population
Growth Rate
Total Fertility
Rate
Sex Ratio
Child
Sex Ratio
27,743,338
Declined from
20.10 (2001)
to 13.89 (2011)
Declined from
2 (2005-06)
to 1.6 (2015-16)
Increased from
876 (Census 2001)
to
895 (Census 2011)
Increased from
798 (2001) to
846 (2011)
14 I The 6th JRD Tata Memorial Awards & Oration

2.7 Page 17

▲back to top


Figure 3: Snapshot of Sikkim, Winner: High Focus North-East States
SIKKIM
SIKKIM
Best Performing State
Category - High Focus North-East States
Composite Score - 115.69
Total
Population
Decadal
Population
Growth Rate
Total Fertility
Rate
Sex Ratio
Child
Sex Ratio
6,10,577
Declined from
33.06 (2001)
to 12.89 (2011)
Declined from
2 (2005-06)
to 1.2 (2015-16)
Increased from Decreased from
875 (Census 2001) 963 (2001) to
to
957 (2011)
890 (Census 2011)
The 6th JRD Tata Memorial Awards & Oration I 15

2.8 Page 18

▲back to top


Union Territory Level Winner
One winner was selected under this category.
Table 5: Composite Scores of Union Territories
State
Composite Score
Chandigarh
Lakshadweep
Puducherry
Daman & Diu
Andaman & Nicobar Islands
Dadra & Nagar Haveli
72.73
70.46
68.11
64.72
63.59
62.38
Rank
1
2
3
4
5
6
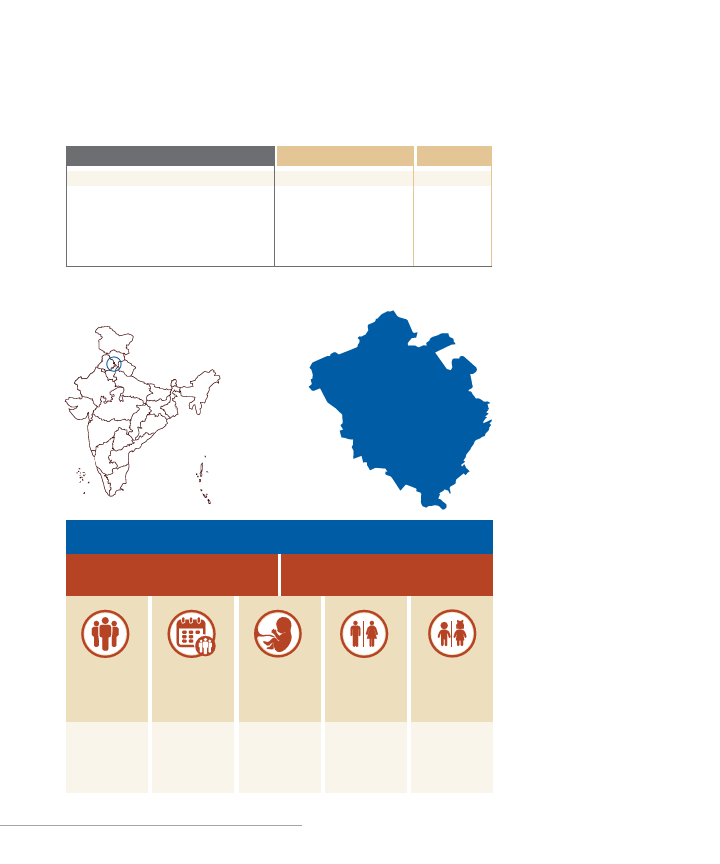
Figure 4: Snapshot of Chandigarh, Winner: Union Territories
CHANDIGARH
CHANDIGARH
Best Performing
Union Territory
Composite Score - 72.73
Total
Population
Decadal
Population
Growth Rate
Total Fertility
Rate
Sex Ratio
Child
Sex Ratio
1,055,450
Declined from
40.28 (2001)
to 17.19 (2011)
Low at
1.6 (2015-16)
Increased from Decreased from
777 (Census 2001) 845 (2001) to
to
880 (2011)
818 (Census 2011)
16 I The 6th JRD Tata Memorial Awards & Oration

2.9 Page 19

▲back to top


District Level Winners
Originally, nine awards were planned for the district level – three each
from ‘High Focus Large States’, ‘Non-High Focus Large States’ and
‘High Focus North-East States’ category. Each category was further
divided into three more categories based on wealth index i.e. high
wealth level, moderate wealth level and low wealth level. However,
in the Low Wealth Level category under Non-High Focus Large States
the award is being given to two districts as there was no difference
in composite index for both the districts. Information on the 10 best
performing districts under the different categories is provided below:
HIGH FOCUS LARGE STATES
Hamirpur, Himachal Pradesh (High Wealth Level): The district has
a composite score of 71.9. The district’s population is 454,768. The
overall sex ratio and child sex ratio are 1095 and 887 respectively.
The male literacy rate is 94.4% and female literacy is 82.6% (Census
2011). As per NFHS-4, only 3% of women aged 20-24 years were
married before attaining the legal age of marriage (18 years) and
teenage childbearing2 is 1.6%.
Jagatsinghpur, Odisha (Moderate Wealth Level): The district has a
composite score of 66.3. The total population is 1,136,971, and the
overall sex ratio and child sex ratio of this district is 968 and 929
respectively. The male and female literacy rate is 92.4% and 80.6%
respectively (Census 2011). According to NFHS-4, 9.7% of women
aged 20-24 years were married before attaining the legal age of
marriage and teenage childbearing is 1.2%.
Baksa, Assam (Low Wealth Level): The district has a composite score
of 59.5. The district’s population is 950,075. The overall sex ratio is
974 and child sex ratio is 966. The male and female literacy rate is
77.0% and 61.3% respectively (Census 2011). As per NFHS-4, about
27.4% of women aged 20-24 years were married before 18 years,
which is the legal age of marriage and teenage childbearing is 11.1%.
2Women aged 15-19 years who were already mothers or pregnant at the time of the survey
The 6th JRD Tata Memorial Awards & Oration I 17

2.10 Page 20

▲back to top


NON-HIGH FOCUS LARGE STATES
Ernakulam, Kerala (High Wealth Level): It has a composite score
of 79.5. The total population of the district is 3,282,388, sex ratio is
1027 and child sex ratio is 961. The district has high male and female
literacy rate at 97.4% and 94.5% respectively (Census 2011). As per
NFHS-4, the occurrence of teenage childbearing was 2.4 % and it is
the only district which reports zero incidence of child age marriage.
The Nilgiris, Tamil Nadu (Moderate Wealth Level): The district has
a composite score of 68.2. The district’s population is 735,394, sex
ratio is 1042 and child sex ratio is 985. Male and female literacy rate
in the district are 91.7% and 79.0% respectively (Census 2011). As
per NFHS-4, about 18.7% of women aged 20-24 years were married
before 18 years, and teenage childbearing was 1.7%.
Nagapattinam, Tamil Nadu (Low Wealth Level): The district has a
composite score of 64.0. Its total population is 1,616,450, sex ratio
is 1025 and child sex ratio is 959. Male and female literacy rates in
the district are 89.8% and 77.6% respectively (Census 2011). As per
NFHS-4, about 7.1% of women aged 20-24 years were married before
18 years and teenage childbearing is 5.4%.
Akola, Maharashtra (Low Wealth Level): The district got the same
composite score as Nagapattinam (64.0), therefore a joint award is
given to both districts. Its total population is 1,813,906, sex ratio is 946
and child sex ratio is 912. Male and female literacy rates in the district
are 92.3% and 83.5% respectively (Census 2011). As per NFHS-4,
Akola has almost double the occurrence of child marriage and higher
teenage childbearing rate than Nagapattinam which are 13.2% and
6.5% respectively. But Akola has better access to improved drinking
water source (97.4 %) and mCPR (65.65%) than Nagapattinam, which
are 91.4% and 56.39% respectively.
18 I The 6th JRD Tata Memorial Awards & Oration

3 Pages 21-30

▲back to top


3.1 Page 21

▲back to top


HIGH FOCUS NORTH-EAST STATES
Aizawl, Mizoram (High Wealth Level): The district has a composite
score of 73.69. The total population of the district is 400,309. Its sex
ratio is 1009 and child sex ratio is 979. Male and female literacy rate
in the district are 98.1 and 97.7 respectively (Census 2011). As per
NFHS-4, about 5.7% of women aged 20-24 years were married before
18 years and teenage childbearing was 6.9%.
Upper Siang, Arunachal Pradesh (Moderate Wealth Level): The district
has a composite score of 66.14. Its total population is 35,320, sex ratio
is 889, child sex ratio is 946, male literacy rate is 66.5 and female
literacy rate is 52.6 (Census 2011). According to NFHS-4, about
18.8% of women aged 20-24 years were married before 18 years and
teenage childbearing was 2.3%.
Phek, Nagaland (Low Wealth Level): The district has a composite
score of 62.45. Its population is 163,418, sex ratio 951 and child sex
ratio 913. Male and female literacy rates in the district are 83.7 and
72.2 respectively (Census 2011). According to NFHS-4, about 9% of
women aged 20-24 years were married before 18 years and teenage
childbearing was 5.5%.
The 6th JRD Tata Memorial Awards & Oration I 19

3.2 Page 22

▲back to top


Annexure 1: Methodology Followed for Selection of Winners
Method followed at State level:
1. At the state level, year 2005-06 was considered as the base year
(Source: NFHS-3) and 2015-16 as the final year (Source: NFHS-4)
based on data availability.
2. For each selected indicator, the index was computed based on
the nature of the indicator for both the base and the final years:
CALCULATION FOR POSITIVE INDICATOR
where the higher the value, the better the performance:
Index =
State Value - Minimum Value
x 100
Maximum Value - Minimum Value
CALCULATION FOR NEGATIVE INDICATOR
where the lower the value, the better the performance:
Index =
Maximum Value - State Value
x 100
Maximum Value - Minimum Value
3. Further, a score was obtained for each broad category as the
simple average of all the selected indicators within the broad
category for both the base and the final years.
4. A composite index was obtained for the final year (2015-16) as
the simple average of the scores for the broad categories.
5. Change from the base year to the final year was computed in
the score for each broad category and a simple average of the
change was computed as the composite index of progress. If
data was not available for any indicator for the base year, that
indicator was not considered for calculating the change between
the base and final year.
6. For ranking the states in each category, a final composite index
was obtained by combining the composite index at the final
year recent levels (2015-16) and the composite index of progress
during the past ten years (2005-06 to 2015-16) in the ratio of 1:4.
20 I The 6th JRD Tata Memorial Awards & Oration

3.3 Page 23

▲back to top


Method followed at UT and District level:
1. At the UT and district level, due to a lack of data availability only
the recent performance was assessed from NFHS-4 data (2015-
16).
2. For each selected indicator, the index was computed based on
the nature of the indicator, positive or negative, as shown above
for the indicators at the state level.
3. Further, a score was obtained for each broad category as the
simple average of all the selected indicators within the broad
category.
4. A composite index was computed for the final year (2015-16)
as the simple average of the scores for the broad categories for
ranking of UTs and districts.
5. UTs were ranked according to composite index.
6. The ranking of districts was computed within each state category
(High Focus Large State, Non-High Focus State and High Focus
North-East State), within three classes of wealth index.
Minimum and maximum values for indicators:
1. Most of the indicators are in the form of percentages, thus,
the scaling for maximum and minimum values were taken as
100 and 0 respectively. For the indicators in proportions (e.g.
proportion of spacing methods and gender disparities) 0 to 1
scale was used.
2. To have common scaling system, the uniform minimum and
maximum values were used for all States/UTs/District categories
in selected NFHS-4 and NFHS-3 indicators.
3. Indicators for which maximum and minimum value was not
predefined, such as sex ratio at birth, infant mortality rate, under-
five mortality rate, neo-natal mortality rate, and out-of-pocket
expenditure on delivery, these have been fixed by analysing the
minimum and maximum values across two rounds as shown
below.
The 6th JRD Tata Memorial Awards & Oration I 21

3.4 Page 24

▲back to top


Table 6: Minimum and maximum values for indicators
Indicators
Actual*
Minimum Maximum
Sex Ratio at Birth (SRB)
Infant Mortality Rate (IMR)
Under-Five Mortality Rate (U5MR)
Neo-natal Mortality Rate (NNMR)
Out-of-Pocket Expenditure (OOPE) on delivery
(to be transformed using natural logarithm)
ln (OOP expenditure)
742
6.0
7.0
4.4
INR 295
5.69
1045
83
112.4
57.5
INR 31,457
10.36
Used in Calculation
Minimum3 Maximum4
740
9755
0
1006
0
1507
0
808
5
119
Note: *Based on States/UTs NFHS-3 and NFHS-4 and Districts for OOP Expenditure
Further, for assessing gender equity, the ratios of rates for males to
females (or vice-versa) were used. For these the range would be 0 to 1.
Table 7: Minimum and maximum values for equity indicators
Indicators10
Index of gender equity
Minimum Maximum11
Infant Mortality Rate (IMR)
Male IMR / Female IMR
0
1
Under-Five Mortality Rate (U5MR)
Male U5MR / Female U5M)
0
1
Neo-natal Mortality Rate (NNMR)
Male NNMR / Female NNMR
0
1
% children stunted
% Male children stunted /
0
1
% Female children stunted
% of living children aged 12-23 months fully
% Female children fully immunized 0
1
immunized
/ % Male children fully immunized
3Any value above 100 was truncated to 100 and any value below 0 was truncated to 0
4Ibid
5Natural Sex Ratio at Birth is less than 975 in almost all populations. This is equivalent to SRB of 102.6
males per 100 males. A lower rounded value (740) was taken, since the range is based on states and
districts can show greater variation
6The actual range is based on states. Higher rounded upper values were taken since for some smaller
populations (say districts) the rates can be higher
7Ibid
8Ibid
9This is equivalent to Rs. 59874. A higher than actual value is proposed as amounts can rise in the future.
Besides, since logarithm is taken, further increases do not show proportional rise in the index
10Note that the first four indexes use male to female ratios since these are negative indicators; a lower
value for females implies a higher index value and gender equity. The last index has female to male
ratio since this is a positive indicator; a higher value for females implies higher index and gender equity
11Any value above 1 was truncated to 1
22 I The 6th JRD Tata Memorial Awards & Oration

3.5 Page 25

▲back to top


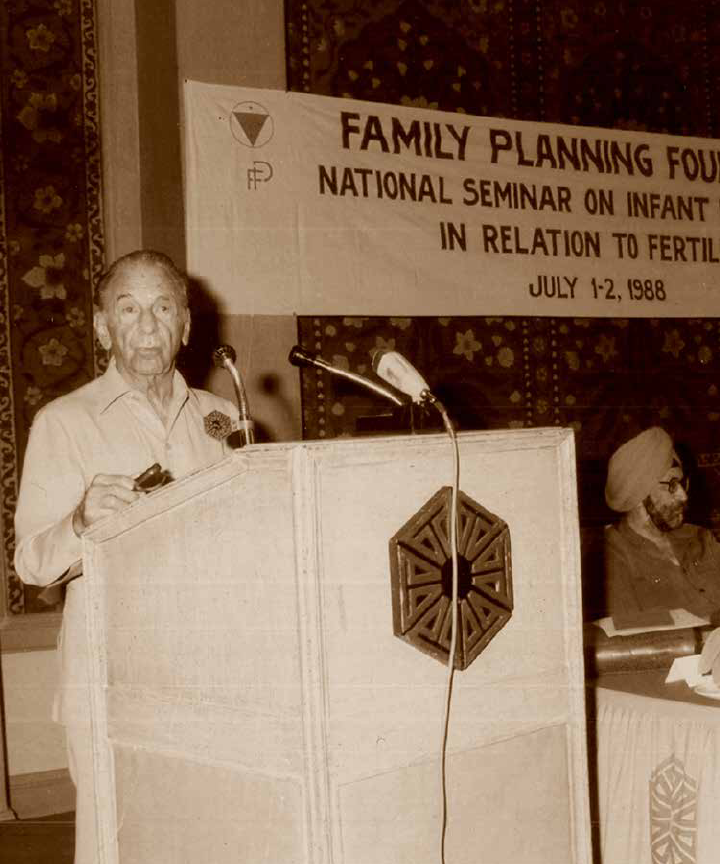
JRD Tata at a seminar on the findings of the International Development
Research Centre (IDRC) project ‘Infant Mortality in Relation to Fertility’
Photo: PFI
The 6th JRD Tata Memorial Awards & Oration I 23

3.6 Page 26

▲back to top


Annexure 2: Descriptions of Indicators
Table 8: Detailed description of indicators
Broad
Category
Indicator
Description
Type of
indicator
Measurement
Values Source(s)
Water,
Sanitation
and Hygiene
(WASH)
Households (HHs)
with an improved
drinking water source
Percentage of households having access to
improved sources of drinking water (water
facility from piped, public tap, stand pipes,
tube wells, boreholes, protected dug wells
and springs, rainwater, and community
reverse osmosis (RO) plants)
Positive
HHs using improved
sanitation facility
Percentage of households using improved
sanitation facilities (include any non-shared
toilet of the following types: flush/pour flush
toilets to piped sewer systems, septic tanks,
and pit latrines; ventilated improved pit
(VIP)/biogas latrines; pit latrines with slabs;
and twin pit/composting toilets)
Positive
Menstrual protection
Percentage of women aged 15-24 years
who use locally prepared napkins,
sanitary napkins, or tampons during their
menstruation or period
Positive
(Households with improved Max. = 100
sources of drinking water / Total Min. = 0
number of households) x100
NFHS-4 &
NFHS-3
(Households using improved
sanitation facilities / Total
number of households) x100
Max. = 100
Min. = 0
NFHS-4 &
NFHS-3
(Women aged 15-24 years
Max. = 100
using locally prepared napkins, Min. = 0
sanitary napkins, or tampons
during their menstruation or
period/ Total number of women
aged 15-24 years) x100
NFHS-4
Women’s
Education
Women with 10
or more years of
schooling
Marriage and
Fertility
Child marriage
Percentage of women aged 15-29 years
who have completed 10 or more years of
schooling
Percentage of women aged 20-24 years,
who were married before the age of 18
Positive
(Women aged 15-29 years
who have completed 10 or
more years of schooling / Total
number of women aged 15-29
years) x100
Max. = 100
Min. = 0
NFHS-4 &
NFHS-3
Negative
(Women aged 20-24 years
married before the age of 18 /
Total women aged 20-24 years)
x100
Max. = 100
Min. = 0
NFHS-4 &
NFHS-3
24 I The 6th JRD Tata Memorial Awards & Oration

3.7 Page 27

▲back to top


Table 8: Detailed description of indicators (contd.)
Broad
Category
Indicator
Description
Type of
indicator
Measurement
Values Source(s)
Marriage and Teenage childbearing Percentage of women aged 15-19 years
Fertility (contd.)
who were already mothers or pregnant at
the time of the survey
Negative
Birth order 3 and
above
Percentage of all births of women in the age
group of 15-49 years, in preceding three
years of the survey by birth order 3 and
above
Negative
(Women aged 15-19 years
who were already mothers or
pregnant at the time of survey
/ Total number of women aged
15-19 years) x100
Max. = 100
Min. = 0
(Number of births to women
aged 15-49 years during the
last three years by birth order 3
and above / Total births taken
place of women aged 15-49
during the last three years)x100
Max. = 100
Min. = 0
NFHS-4 &
NFHS-3
NFHS-4 &
NFHS-3
Family
Planning
Method mix
(proportion of
spacing methods)
The proportion of current users of non-
terminal (spacing) modern family planning
methods out of the total modern family
planning methods
Total unmet need for
family planning
Percentage of currently married women
having an unmet need (both for spacing
and limiting methods) for contraception
Modern
contraceptive
prevalence rate
(mCPR)
Percentage of currently married women
age 15-49 using any modern methods of
contraception
Positive
Negative
Positive
Number of women currently
using non-terminal modern
family planning methods /
Number of women currently
using any modern family
planning methods.
Max. = 1
Min. = 0
(Number of currently married Max. = 100
women in the age group of 15- Min. = 0
49 years having an unmet need
(both spacing and limiting) for
contraception / Total number of
currently married women in the
age group of 15-49 years) x100
(Number of currently married
women in the age group of 15-
49 using any modern methods
of contraception / Total number
of currently married women in
the age group of 15-49 years)
x100
Max. = 100
Min. = 0
NFHS-4 &
NFHS-3
NFHS-4 &
NFHS-3
NFHS-4 &
NFHS-3
25 I The 6th JRD Tata Memorial Awards & Oration

3.8 Page 28

▲back to top


Table 8: Detailed description of indicators (contd.)
Broad
Category
Indicator
Description
Type of
indicator
Measurement
Values Source(s)
Maternal Health Full antenatal care
(ANC)
Percentage of women aged 15-49 years
who had a live birth in the five years before
the survey and had at least four antenatal
check-ups and one TT injection along
with an intake of iron folic acid tablets or
syrup for 100 or more days during their
pregnancy for the last birth
Positive
Postnatal care within
42 days of delivery
Percentage of women aged 15-49 years
who gave birth in the five years before the
survey, and who had received any check up
by a skilled health professional within 42
days of delivery
Positive
Out-of-pocket
expenditure (OOPE)
on delivery in public
hospitals
Average out-of-pocket cost paid for the
delivery of the most recent live birth among
women aged 15-49 years who had a live
birth in a public health facility in the five
years preceding the survey
(to be transformed using natural logarithm)
Negative
(Number of women aged 15-49 Max. = 100
years who had a live birth in Min. = 0
the five years before the survey,
and had at least four antenatal
check-ups and one TT injection
along with an intake of iron
folic acid tablets or syrup for
100 or more days during their
pregnancy for the last birth /
Total number of women aged
15-49 years who had a live
birth in the five years before the
survey) x100
NFHS-4 &
NFHS-3
(Number of women aged 15-49 Max. = 100
years giving birth in the five Min. = 0
years before the survey, who
had received any check up by
a skilled health professional
within 42 days of delivery /
Total number of women aged
15-49 years giving birth in the
five years before the survey)
x100
NFHS-4 &
NFHS-3
Total out-of-pocket cost paid for Max. = 11
the delivery of the most recent Min. = 5
live birth among women aged (values are in
15-49 years who had a live
natural
birth in a public health facility logarithm)
in the five years preceding
the survey / Total number of
women aged 15-49 years who
had a live birth in a public
health facility in the five years
preceding the survey
NFHS-4
26 I The 6th JRD Tata Memorial Awards & Oration

3.9 Page 29

▲back to top


Table 8: Detailed description of indicators (contd.)
Broad
Category
Indicator
Description
Type of
indicator
Measurement
Values Source(s)
Maternal Health Safe delivery
(contd.)
Percentage of live births in the five years
before the survey, assisted by doctors,
auxiliary nurse midwives, nurses, midwives
or lady health visitors
Positive
Institutional births in
public facilities
Percentage of live births in the five years
before the survey, delivered in public health
facilities
Positive
(Number of live births in the Max. = 100
five years before the survey, Min. = 0
assisted by doctors, auxiliary
nurse midwives, nurses,
midwives or lady health visitors
/ Total number of live births in
the five years before the survey)
x100
NFHS-4 &
NFHS-3
(Number of live births in the
five years before the survey,
delivered in public health
facilities / Total number of live
births in the five years before
the survey) x100
Max. = 100
Min. = 0
NFHS-4 &
NFHS-3
Child Health
and Nutrition
Full immunization
Percentage of living children aged 12-23
months fully immunized (BCG, measles,
and 3 doses each of polio and DPT) at any
time before the survey
Positive
Gender parity in full
immunization
Ratio of female living children aged 12-23
months fully immunized (BCG, measles,
and 3 doses each of polio and DPT) at any
time before the survey vis-à-vis male living
children
Positive
Children under 5
years who are stunted
Percentage of children under age five years
classified as stunted whose height-for-
age Z-score is below minus two standard
deviations (-2 SD) from the median of the
reference population
Negative
(Number of living children
aged 12-23 months fully
immunized at any time before
the survey / Total number of
living children aged 12-23
months at the time of survey)
x100
Max. = 100
Min. = 0
Female living children aged
12-23 months fully immunized
at any time before the survey /
Male living children aged 12-
23 months fully immunized at
any time before the survey
Max. = 1
Min. = 0
(Number of children under
age five years stunted / Total
number of children under age
five years) x100
Max. = 100
Min. = 0
NFHS-4 &
NFHS-3
NFHS-4 &
NFHS-3
NFHS-4 &
NFHS-3
27 I The 6th JRD Tata Memorial Awards & Oration

3.10 Page 30

▲back to top


Table 8: Detailed description of indicators (contd.)
Broad
Category
Indicator
Description
Type of
indicator
Measurement
Values Source(s)
Child Health
and Nutrition
(contd.)
Gender disparity
in children under 5
years who are stunted
Ratio of male children under age five years
stunted (height for age Z-score is below -2
SD) vis-à-vis female children age five years
stunted
Positive
Children under age
6 months exclusively
breastfed
Percentage of children under age 6 months
exclusive breastfed
Positive
Male children under age five
years stunted (height for age
Z-score is below -2 SD) /
Female children under age five
years stunted (height for age
Z-score is below -2 SD)
Max. = 1
Min. = 0
(Number of children under two
years who were exclusively
breastfed for first six months of
age / Total number of children
under two years) x100
Max. = 100
Min. = 0
NFHS-4 &
NFHS-3
NFHS-4 &
NFHS-3
Anaemia
Sex Ratio
Anaemia among
women
Sex ratio at birth
Percentage of women aged 15-49 years
(including currently pregnant and non-
pregnant) who are anaemic (Haemoglobin
level below which women are considered
anaemic:
for pregnant women: less than 12
grams/decilitre
for non-pregnant women: less than 11
grams/decilitre)
Negative
(Number of women aged 15-
49 years, including currently
pregnant and non-pregnant,
who are anaemic / Total
number of women aged 15-49
years) x100
Max. = 100
Min. = 0
NFHS-4 &
NFHS-3
Sex ratio at birth for children born in the
last five years at the time of the survey
(females per 1,000 males)
Positive
(Females born in the last five Max. = 975
years at the time of the survey / Min. = 740
Males born in the last five years
at the time of the survey) x1000
NFHS-4 &
NFHS-3
Neonatal, Infant Infant Mortality Rate
and Child
(IMR)
Mortality Rates
Infant mortality (dying between birth and
first birthday) per 1000 live births in the
five-year period before the survey
Negative
(Infant deaths in the last five
years at the time of survey /
Total number of live births in
the last five years at the time of
survey) x1000
Max. = 100
Min. = 0
NFHS-4 &
NFHS-3
28 I The 6th JRD Tata Memorial Awards & Oration

4 Pages 31-40

▲back to top


4.1 Page 31

▲back to top


Table 8: Detailed description of indicators (contd.)
Broad
Category
Indicator
Description
Type of
indicator
Measurement
Values Source(s)
Neonatal, Infant
and Child
Mortality Rates
(contd.)
Gender disparity in
Infant Mortality Rate
(IMR)
Ratio of male infant mortality (dying
between birth and first birthday) per 1000
female live births in the five-year period
before the survey vis-à-vis female infant
mortality per 1000 male live births in the
five-year period before the survey
Under-Five Mortality
Rate (U5MR)
Under-five mortality (dying between birth
and the fifth birthday) per 1000 live births
in the five-year period before the survey
Gender disparity in
Under-Five Mortality
Rate (U5MR)
Ratio of male under-five mortality (dying
between birth and the fifth birthday) per
1000 female live births in the five-year
period before the survey vis-à-vis female
under-five mortality per 1000 male live
births in the five-year period before the
survey
Neonatal Mortality
Rate (NNMR)
Neonatal mortality (dying within the first
month of life) per 1000 live births in the
five-year period before the survey
Gender disparity in
Neonatal Mortality
Rate (NNMR)
Ratio of male neonatal mortality (dying
within the first month of life) per 1000
female live births in the five-year period
before the survey vis-à-vis female neonatal
mortality per 1000 male live births in the
five-year period before the survey
Positive
Negative
Positive
Negative
Positive
Male infant mortality per 1000
female live births in the five-
year period before the survey
/ Female infant mortality per
1000 male live births in the
five-year period before the
survey
Max. = 1
Min. = 0
(Under-five mortality in the last
five years at the time of survey
/ Total number of live births in
the last five years at the time of
survey) x1000
Max. = 150
Min. = 0
Male under-five mortality per
1000 female live births in the
five-year period before the
survey / Female under-five
mortality per 1000 male live
births in the five-year period
before the survey
Max. = 1
Min. = 0
(Neonatal deaths in the last
five years at the time of survey
/ Total number of live births in
the last five years at the time of
survey) x1000
Max. = 80
Min. = 0
Male neonatal mortality per
1000 female live births in
the five-year period before
the survey / Female neonatal
mortality per 1000 male live
births in the five-year period
before the survey
Max. = 1
Min. = 0
NFHS-4 &
NFHS-3
NFHS-4 &
NFHS-3
NFHS-4 &
NFHS-3
NFHS-4 &
NFHS-3
NFHS-4 &
NFHS-3
29 I The 6th JRD Tata Memorial Awards & Oration

4.2 Page 32

▲back to top


Table 8: Detailed description of indicators (contd.)
Broad
Category
Indicator
Description
Type of
indicator
Measurement
Values Source(s)
Women’s
Women’s
Empowerment employment
Women having
mobile phone for
their own use
Percentage of currently married women
aged 15-49 years employed in the 12
months before the survey (Respondents are
considered to be employed if they have
done any work other than their housework
in the 12 months before the survey)
Positive
Percentage of women aged 15-49 years
Positive
having a mobile phone that they themselves
use
Women’s freedom of
movement
Percentage of women aged 15-49 years
allowed to go alone to all three of the
following places: to the market, to the
health facility, and to places outside the
village or community
Positive
Women’s
participation in
decision making
Percentage of currently married women
aged 15-49 years making decision alone or
jointly with their husband in all three of the
following areas: woman’s own health care,
major household purchases, and visits to
the woman’s family or relatives
Positive
(Currently married women
aged 15-49 years employed
in the 12 months before the
survey / Total number of
currently married women aged
15-49 years) x100
Max. = 100
Min. = 0
NFHS-4 &
NFHS-3
(Number of women aged 15-49 Max. = 100
years having a mobile phone Min. = 0
that they themselves use / Total
number of women aged 15-49
years) x100
NFHS-4
(Number of women aged 15-49 Max. = 100
years allowed to go alone to all Min. = 0
three of the following places:
to the market, to the health
facility, and to places outside
the village or community / Total
number of women aged 15-49
years) x100
NFHS-4 &
NFHS-3
(Number of currently married Max. = 100
women aged 15-49 years
Min. = 0
making decision alone or
jointly with their husband in
all three of the following areas:
woman’s own health care,
major household purchases,
and visits to the woman’s family
or relatives / Total number of
currently married women aged
15-49 years) x100
NFHS-4 &
NFHS-3
30 I The 6th JRD Tata Memorial Awards & Oration

4.3 Page 33

▲back to top


Table 8: Detailed description of indicators (contd.)
Broad
Category
Indicator
Description
Type of
indicator
Measurement
Values Source(s)
Gender-based
violence
Men’s attitudes
towards wife-beating
Percentage of men aged 15-49 years who
agree that a husband is justified in hitting
or beating his wife under at least one of
following seven circumstances: she goes
out without telling him, she neglects the
house or the children, she argues with
him, she refuses to have sex with him, she
doesn’t cook food properly, he suspects
her of being unfaithful, and she shows
disrespect for her in-laws
Spousal violence
Percentage of ever-married women aged
15-49 years who have experienced any
of the specified acts of physical, sexual,
or emotional violence committed by their
current husband (if currently married) or
their most recent husband (if formerly
married), in the 12 months preceding the
survey
Negative
Negative
Help seeking in
case of experiencing
physical and sexual
violence
Percentage of women aged 15-49 years
who have ever experienced physical and
sexual violence, have ever sought help from
any source to stop the violence
Positive
(Number of men aged 15-
Max. = 100
49 years who agree that a
Min. = 0
husband is justified in hitting or
beating his wife under at least
one of the mentioned seven
circumstances / Total number of
men aged 15-49 years) x100
(Number of ever-married
Max. = 100
women aged 15-49 years
Min. = 0
who have experienced any of
the specified acts of physical,
sexual, or emotional violence
committed by their current
husband (if currently married)
or their most recent husband
(if formerly married), in the 12
months preceding the survey /
Total number of ever-married
women aged 15-49 years) x100
(Number of women aged
15-49 years who have ever
experienced physical and
sexual violence, have ever
sought help from any source
to stop the violence / Total
number of women aged
15-49 years who have ever
experienced physical and
sexual violence) x100
Max. = 100
Min. = 0
NFHS-4 &
NFHS-3
NFHS-4 &
NFHS-3
NFHS-4 &
NFHS-3
31 I The 6th JRD Tata Memorial Awards & Oration

4.4 Page 34

▲back to top


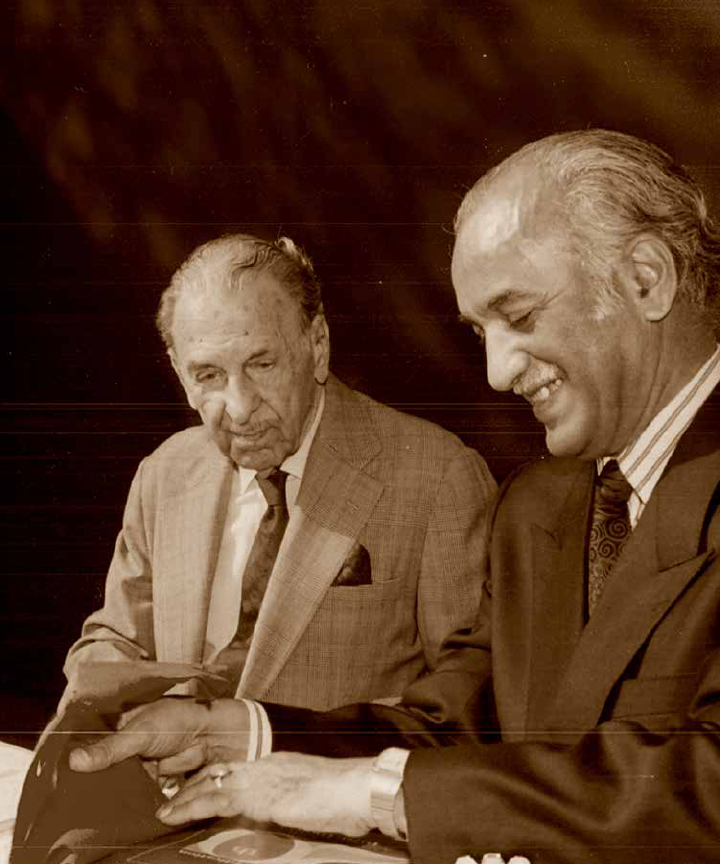
JRD Tata with Harish Khanna, Executive Director of PFI (1986 - 1995)
Photo: PFI
32 I The 6th JRD Tata Memorial Awards & Oration

4.5 Page 35

▲back to top


4.6 Page 36

▲back to top


Population Foundation of India
Head Office: B-28, Outab Institutional Area, New Delhi - 110016
T: +91 11 43894 100, F: +91 11 43894 199
Regional Office, Bihar: 123A Patliputra Colony, 1st Floor, Patna - 800013
T: +91- 612- 2270634
Regional Office, Uttar Pradesh: C-3, Nirala Nagar, Opp. Thandi Park, Lucknow - 226020
T: +91-522-4005091
Website: www.populationfoundation.in
Facebook: @PopFoundlndia
Twitter: @PFl3
lnstagram: @popfoundind
34 I The 6th JRD Tata Memorial Awards & Oration