MCH-STAR A Concurrent Evaluation

MCH-STAR A Concurrent Evaluation


1 Pages 1-10

▲back to top


1.1 Page 1

▲back to top


POPULATION FOUNDATION OF INDIA
A Concurrent Evaluation
of Phase II of the NRHM
BCC Campaign

1.2 Page 2

▲back to top


1.3 Page 3

▲back to top


POPULATION FOUNDATION OF INDIA
A Concurrent Evaluation
of Phase II of the NRHM
BCC Campaign

1.4 Page 4

▲back to top


STUDY TEAM
Population Foundation of India
Dr. Lalitendu Jagatdeb – Chief of Evaluation Team, Joint Director (Monitoring & Evaluation)
Ms. Sona Sharma – Core Team Member, Joint Director (Advocacy & Communication)
Mr. Nihar Ranjan Mishra – Core Team Member, Programme Officer (Monitoring &
Evaluation)
MCH STAR
Dr. Marta-Levitt-Dayal, Chief of Party
Dr. Sanjay Kumar, Senior Technical Advisor(M&E)
Ms. Kachina Chawla, Capacity Building Coordinator
Ms. Anju Dadhwal, Senior Technical Advisor, Policy Analysis and Advocacy
USAID
Dr. Rajiv Tandon, Chief of Maternal and Child Health, Nutrition & Urban Health Division
Ms. Sheena Chhabra, Chief of Health Systems Division
Dr. Sanjeev Upadhyaya, Senior Advisor, Urban Health and Infectious Diseases
Dr. S. Kaushik, Senior Policy & Research Advisor
Ms. Moni. S. Sagar, BCC & Marketing Advisor
ORG Centre for Social Research
(A Division of ACNielsen ORG-MARG Pvt.Ltd.)
Mr. Pramod Kumar Padhy, Director and his team
Design and Print:
New Concept Information Systems Pvt. Ltd
E-mail: communication@newconceptinfosys.com
Website: www.newconceptinfosys.com

1.5 Page 5

▲back to top


Naresh Dayal
Health & FW Secretary
Tel.: 23061863 Fax.: 23061252
e-mail: secyfw@nb.nic.in
ndayal@nic.in
Hkkjr ljdkj
LokLF; ,oa ifjokj dY;k.k ea=ky;
fuekZ.k Hkou] ubZ fnYyh - 110108
Government of India
Ministry of Health & Family Welfare
Nirman Bhavan, New Delhi - 110108
Dated 23rd September, 2009
FOREWORD
The National Rural Health Mission (2005-12) is a major flagship programme
of the Ministry of Health & Family Welfare, Government of India. It is a mega
effort providing integrated comprehensive primary health care to the rural
population. Over the last four years of implementation, it has brought about
comprehensive rejuvenation of the Public Health System in the country.
The Ministry launched the second phase of Behaviour Change Communication
(BCC) Campaign during 27 December, 2008 to January 27, 2009 to increase
awareness about various programmes. To find out the reach and effectiveness
of the campaign, it commissioned the Population Foundation of India to
conduct an external concurrent evaluation. The findings of the study provided
us a wealth of information on a number of parameters such as the reach of
various media in the country; the viewing pattern, listening or reading habits of
our target audience.
I am sure, these findings provide timely and reliable data and it will be
incorporated into the Information, Education and Communication (IEC)
strategy of the Ministry to improve on our campaigns.
The Ministry lauds the efforts of the Population Foundation of India for
executing this task in a timely and efficient manner.
(NARESH DAYAL)
National Rural Health Mission
iii

1.6 Page 6

▲back to top


Erin Soto
Mission Director
FOREWORD
The U.S. Agency for International Development (USAID)/India is pleased to have provided
technical assistance to the Ministry of Health and Family Welfare (MoHFW ) to conduct a
concurrent evaluation of the second phase of the Behavior Change Communication (BCC)
campaign of the National Rural Health Mission (NRHM). We applaud the Ministry for requesting
an independent third-party evaluation that will allow it to track the progress and document the
effectiveness of these national campaigns.
USAID is committed to supporting efforts that contribute to evidence-based program design
and implementation. The USAID-funded Maternal and Child Health Sustainable Technical
Assistance and Research (MCH-STAR) Initiative aims to promote such evidence-based health
policies and programs through specialized Indian institutes that are able to respond to the
research, policy analysis, advocacy, and technical assistance needs of state and national
governments.
The Population Foundation of India (PFI), one of the MCH-STAR Initiative-supported
institutions, was commissioned to undertake this evaluation of the BCC Campaign. USAID
commends PFI for its responsiveness in executing this concurrent evaluation, and for its role
as a technical leader in the area of maternal and child health. We hope that the Ministry finds
the data that emerged from the concurrent evaluation to be useful in strengthening NRHM
Behavior Change Communication strategies and activities. USAID/India encourages similar
concurrent evaluations as effective tools to measure the effectiveness of other NRHM programs
and schemes aimed at improving the health of India’s mothers and children.
U.S. Agency for International Development
American Embassy
Chanakyapuri
New Delhi 110 021
Tel: 91-11-24198000
Fax: 91-11-24198612/8454
www.usaid.gov/in
Erin Soto
Mission Director

1.7 Page 7

▲back to top


Population Foundation of India
PREFACE
A.R. Nanda
Executive Director
The policy framework on Reproductive and Child Health in India marks the global recognition of
the importance of adopting a holistic approach in meeting people’s health needs instead of merely
fulfilling demographic targets. Mainstreaming the role of communication in this policy framework
is crucial as it catalyses demand generation. Under the Behaviour Change Communication (BCC)
component of National Rural Health Mission (NRHM), there is a strong emphasis on evidence-
based media planning.
With the above policy and programme formulation in view, as well as the communication needs of
RCH approach under NRHM, the Ministry of Health and Family Welfare (MoHFW ), Government
of India initiated an integrated BCC campaign using television, radio and the print media. The
campaign aimed at improving attitudes and knowledge of key target audience and promoting
key programme areas and schemes under NRHM viz; age at marriage, family planning and birth
spacing, ANC, immunization, newborn care, Janani Suraksha Yojana, role of ASHA etc.
In order to gauge the effectiveness of the second phase of the NRHM BCC Campaign, the
MoHFW in collaboration with USAID/MCH-STAR commissioned this study through Population
Foundation of India. PFI provided overall management and technical oversight to the study. The
scope of work included finalization of study’s terms of reference, selection of an agency to conduct
the research, technical support in study design, research tools and analysis, field monitoring and
ensuring high quality and timely report and it’s dissemination. The co-ordination with multiple
stakeholders i.e the research agency, MCH-STAR, USAID and MoHFW, was a challenge to PFI.
This was very successfully addressed by a well managed consultative process. The study is being
recognized as a model for other partner organizations. The core team for the evaluation from PFI
led by Dr. Lalitendu Jagatdeb, Joint Director (Monitoring & Evaluation) included Ms. Sona Sharma,
Joint Director (Advocacy & Communication) and Mr. Nihar Ranjan Mishra, Programme Officer,
(Monitoring & Evaluation).
The study has been a mammoth task and has involved many people at different levels. For PFI,
it was a challenging task given the time span and geographic spread of the study area. At the
same time, it was an enriching experience for the organization. The participation of various
stakeholders at the national, state and district levels was tremendous. We take this opportunity
to extend our appreciation to all those who have contributed towards the successful completion
of this study. We feel it appropriate to mention names of organizations and individuals who were
very actively involved in the evaluation process.
First and foremost, PFI would like to thank The Ministry of Health and Family Welfare for
entrusting the responsibility to carry out the evaluation. We are grateful to Mr. Naresh Dayal,
B-28, QUTAB INSTITUTIONAL AREA, TARA CRESCENT, NEW DELHI - 110 016
PHONE : 26856805, 25668181, 42899771, 428899770 FAX : 91-11-42899795 GRAMS : FOUNDATION
E-Mail : popfound@sify.com Website : popfound.org
v

1.8 Page 8

▲back to top


Health Secretary for writing the foreword for this publication. We would like to thank
Ms. Aradhana Johri, the former Joint Secretary, who requested this concurrent evaluation. We
also acknowledge the support provided by various officials from MoHFW both at centre and
state levels. Our special thanks to Mr. P.K. Pradhan, Additional Secretary and Mission Director,
NRHM, Mr. Amit Mohan Prasad, Joint Secretary and Mr. Sanjay Prasad, Director (DC) for
encouragement and guidance.
We are thankful to USAID for providing technical and financial support to carry out the
evaluation. A number of key professionals from USAID were involved in the study and
wholeheartedly supported the endeavour. To cite a few names—Dr. Rajiv Tandon, Chief,
MCHNUH, Ms. Sheena Chhabra, Chief of Health Systems Division, Dr. Sanjeev Upadhyaya,
Senior Advisor, Urban Health and Infectious Diseases, Dr. S. Kaushik, Senior Policy & Research
Advisor and Ms. Moni S. Sagar, BCC & Marketing Advisor.
PFI wishes to express thanks for the technical support and extensive collaboration of the
MCH-STAR team led by Dr. Marta-Levitt-Dayal, Chief of Party. Dr. Marta’s leadership qualities
both at the level of providing management as well as technical support have been invaluable for
us to make this study successful. Other members of MCH STAR team, we would specially like
to acknowledge for their contribution are Dr. Sanjay Kumar, Senior Technical Advisor (M&E),
Ms. Kachina Chawla, Capacity Building Coordinator and Ms. Anju Dadhwal, Senior Technical
Advisor, Policy Analysis and Advocacy.
The study was designed and evolved in a process of extended and intensive consultation
with experts from various organizations. Appreciation and acknowledgement are due to
Dr. K.M. Sathyanarayana, Technical Director, VISTAAR, Mr. Anand Verdhan Sinha, Country
Director, Abt Associates Inc, and Mr. V.S. Chandrashekar, Country Programme Director, PSI.
Our sincere acknowledgement and thanks to ORG Centre for Social Research (a division of
ACNielsen ORG - MARG Pvt Ltd) which executed the study in the field in close collaboration
with PFI. The overall guidance and support provided by Dr. Ashish Panigrahi, Executive Director
of the organization is highly appreciable. The efforts of the professional team led by
Mr. Pramod Kumar Padhy, Director in completing the survey of such large magnitude and
delivering the results in time is commendable.
The report is a product of extensive collaborative effort of USAID, MCH-STAR and PFI. The
report provides a wealth of information which may facilitate further discourse, research and
intervention in this important but, as yet, nascent field of work. The contents of the report have
policy relevance and offer concrete suggestions concerning what appropriate programmatic
actions and change may be needed in future. We take great pleasure in disseminating the
findings and recommendations which emerged out of this study. We hope the findings of
the evaluation would be useful to Government towards development of their upcoming
communication strategy.
A.R. Nanda
Executive Director
Population Foundation of India
New Delhi
vi

1.9 Page 9

▲back to top


Contents
Chapter 1
Introduction
Chapter 2
Household Characteristics & Profile of the Respondents
Chapter 3
Exposure to Media
Chapter 4
Exposure of Target Groups to NRHM Television and Radio Campaign Spots
Chapter 5
Recall, Comprehension, Appeal and Impact of TV Spots
Chapter 6
Recall, Comprehension, Appeal and Impact of Radio Spots
Chapter 7
Conclusions and Recommendations
Annexures
Annexure 1
Sampling Design for the Survey among Target Audiences at the Household Level
Annexure 2
Recruitment, Training, Fieldwork and Data Processing
Annexure 3
TV Viewing Habits
Annexure 4
Radio Listening Habits
Annexure 5
Details on Exposure
Annexure 6
TV Spot: Crystal Ball - Antenatal Care
Annexure 7
TV Spot: Sachin and Supriya - Antenatal Care
Annexure 8
TV Spot: Juhi Chawla - Antenatal Care
1
7
10
15
23
30
34
39
41
43
49
53
56
60
63
vii

1.10 Page 10

▲back to top


A Concurrent Evaluation of Phase II of the NRHM BCC Campaign
Annexure 9
TV Spot: Jagmag Animated Spot - Antenatal Care
66
Annexure 10
TV Spot: Radheyshyam ki Motorcycle - Newborn Care
69
Annexure 11
TV Spot: Mehendi - Family Planning
73
Annexure 12
TV Spot: Holi - Family Planning
76
Annexure 13
TV Spot: Train - Family Planning
80
Annexure 14
TV Spot: Sachin Supriya - Family Planning
83
Annexure 15
TV Spot: Juhi Chawla - Family Planning
86
Annexure 16
TV Spot: Pragati on Medical Tour - NRHM/Health Services
89
Annexure 17
TV Spot: Ek Savera Ek Akash - NRHM/Health Services
92
Annexure 18
TV Spot: Juhi Chawla - Immunization
95
Annexure 19
TV Spot: Mona Singh - Immunization
99
Annexure 20
TV Spot: Badhte Shishu ki Badhti Zaroorat - Nutrition and Breastfeeding
103
Annexure 21
TV Spot: Age at Marriage
107
Annexure 22
Radio Spot: Pragati Talking to Papa - Antenatal Care
110
Annexure 23
Radio Spot: Conversation with ASHA - Antenatal Care
113
Annexure 24
Radio Spot: Journalist Khushi - Institutional Delivery & JSY
116
Annexure 25
Radio Spot: Jingle Jagmag - Institutional Delivery
119
Annexure 26
Radio Spot: Holi Song - Family Planning
122
Annexure 27
Radio Spot: Mehendi Song - Family Planning
125
Annexure 28
Radio Spot: Pragati Talking to Friends - Health Services
127
viii

2 Pages 11-20

▲back to top


2.1 Page 11

▲back to top


Acronyms and Abbreviations
ANM
ANC
ASHA
AWW
BCC
BP
CDPO
CMM
CMW
CS
Cu-T
DAVP
DD
FE
FM
FP
Hb
HH
IEC
IFA
IPC
ITAP
IUCD
JSY
LHV
MCH-STAR
MNCH
MoHFW
NRHM
OBC
OCP
OPD
Auxilliary Nurse Mid-wife
Antenatal Care
Accredited Social Health Activist
Anganwadi Worker
Behavior Change Communication
Blood Pressure
Child Development Project Officer
Currently Married Men
Currently Married Women
Civil Surgeon
Copper-T
Directorate of Advertising and Visual Publicity
Doordarshan
Field Executives
Frequency Modulation
Family Planning
Hemoglobin
Household
Information, Education & Communication
Iron & Folic Acid
Interpersonal Communication
IFPS-II Technical Assistance Project
Intrauterine Contraceptive Device
Janani Suraksha Yojana
Lady Health Visitor
Maternal & Child Health Sustainable Technical
Assistance & Research
Maternal & Newborn Child Health
Ministry of Health & Family Welfare
National Rural Health Mission
Other Backward Classes
Oral Contraceptive Pill
Out Patient Department
ix

2.2 Page 12

▲back to top


A Concurrent Evaluation of Phase II of the NRHM BCC Campaign
PFI
PPS
PRI
RCH
RKS
SC
SPSS
ST
ToT
TT
TV
USAID
VHND
VHSC
Population Foundation of India
Probability Proportional to Size
Panchayati Raj Institution
Reproductive & Child Health
Rogi Kalyan Samiti
Scheduled Caste
Statistical Package for Social Sciences
Scheduled Tribe
Training of the Trainers
Tetanus Toxide
Television
United States Agency for International Development
Village Health and Nutrition Day
Village Health and Sanitation Committee
x

2.3 Page 13

▲back to top


Executive Summary
The second phase of the National Rural
The TV spots used in the campaign
Health Mission’s (NRHM) Behavior Change
appealed to most of the respondents
Communication (BCC) campaign was
(70-95%) who were exposed to them.
implemented nationwide by the Ministry
The radio spots used in the campaign
of Health and Family Welfare (MoHFW ),
appealed to most of the respondents
Government of India from 27th December,
(73-90%) who were exposed to them.
2008 to 26th January, 2009.
Creative and entertaining TV spots,
without celebrities, can have as much
The focus of this campaign was to promote
recall, comprehension and appeal as
existing programs and schemes, improve
spots featuring famous celebrities.
attitudes towards and increase knowledge
Overall, language was not a major barrier
on key maternal, newborn, child health and
to comprehension and appeal of the
nutrition interventions and behaviors. The
spots, though the campaign was done
campaign aired sixteen television spots and
only in Hindi. The few who reported
seven radio spots in Hindi and released print
difficulties with the language in the spots
ads in major newspapers nationwide.
were from other states, where Hindi is not
the major language spoken.
The evaluation determined the extent of the A significant proportion of respondents
campaign’s reach, visibility and exposure
exposed to the TV spots, 32 to 72 percent
among the target audiences as also the recall,
of men and 40 to 55 percent of women,
comprehension and appeal of specific spots
intend to take action as a result of the
of the campaign. Further, the evaluation
campaign including discussing the topic
aimed to provide relevant recommendations
with their spouse, family members and
to MoHFW to enhance the effectiveness
friends; seeking services promoted in the
of future large scale behavior change
spots; and following specific practices
campaigns.
based on messages in the spots. Mothers-
in-law discussed the contents of the spots
The evaluation represented urban and rural
with daughters-in-law.
areas of 11 high focused states and other
Other major sources of information on
states across the country and surveyed 3575
the themes of the campaign among both
currently married women (15-29 years of
men and women were ANMs, ASHAs,
age), 1784 husbands of women (15-29 years
AWWs and relatives.
of age) and 350 fathers and mothers-in-law.
Policy makers and program managers
In-depth discussions were held with state
recommended that messages in print
level policymakers and program managers,
media should avoid ‘information
and with 30 state, 54 district and 120 block
overload’, difficult words, jargon,
level officials and health service providers
and photographs of politicians; it
at grassroots level to elicit their perceptions
should have a regional flavor for
of and recommendations for improving the
maximum effectiveness; and include
campaign.
complementary interpersonal
communication efforts.
The key findings of this concurrent evaluation
included:
The following recommendations emerged
Television has a much greater reach than from the evaluation:
radio in all locations.
National level mass media campaigns
xi

2.4 Page 14

▲back to top


A Concurrent Evaluation of Phase II of the NRHM BCC Campaign
should link with state level
complementary BCC approaches led by
local change agents such as ASHAs, ANMs
and AWWs.
Spots should be creative and
entertaining.
To avoid message dilution, it may be
beneficial to broadcast fewer themes
with more intensity rather than having
so many different messages.
The Ministry should consider tracking
the frequency and timing of spots aired
on TV and radio through a tracking
agency.
The Ministry should continue to conduct
periodic concurrent evaluations to
improve the impact of subsequent
campaigns.
Media Preferences for Men and Women
Preferred TV timings
Preferred TV channels
Favorite types of TV programs
Preferred radio timings
Preferred radio stations
Favorite types of radio
programs
Women
6pm-9pm (45%)
DD National (50%),
Star plus (20%)
Serials (80%), Films (70%),
News (28%)
No fixed slot (41%)
FM General (49%),
All India Radio (34%)
Radio Mirchi (15%)
Songs (93%), News (33%)
Men
6pm-9pm (40%)
DD National (59%),
DD News (17%)
Films (72%), News (65%),
Serials (50%)
No fixed slot (56%)
All India Radio (52%),
FM General (38%)
Radio Mirchi (23%)
Songs (91%), News (58%)
TV spot with the highest
appeal
Radio spot with the highest
appeal
Mona Singh (Immunization)
(91%)
Conversation with ASHA
(85%)
Ek Savera Ek Akash (95%)
Jingle/Song (90%)
xii

2.5 Page 15

▲back to top


Chapter 1
Introduction
1.1 BACKGROUND
and evaluation, policy analysis, and advocacy.
In response to the need for a concurrent
The Ministry of Health and Family
evaluation, MCH-STAR through its partner,
Welfare (MoHFW), Government of India,
the Population Foundation of India (PFI)
implemented the second phase of the
led the concurrent evaluation. As this was a
Behavior Change Communication (BCC)
nationwide assessment with an aggressive
Campaign of the National Rural Health
timeline of three months, PFI commissioned
Mission (NRHM) from 27th December, 2008
ORG Center for Social Research (a division
to 26th January, 2009. The campaign aimed
of ACNielsen) to conduct the concurrent
to promote existing programs and schemes,
evaluation.
improve attitudes towards and increase
knowledge of key maternal, newborn,
1.2 OBJECTIVES OF THE
child health and nutrition behavior change
CONCURRENT EVALUATION
messages. In particular, the campaign focused
on NRHM, the Janani Suraksha Yojana
The objectives of the concurrent evaluation
(JSY), Antenatal Care (ANC), institutional
were to:
deliveries, the role of the Accredited Social
1. Evaluate the extent of reach/visibility and
Health Activist (ASHA), age at marriage, birth
exposure of the target audiences to the
spacing, Village Health and Nutrition Day
campaign.
(VHND), immunization, Village Health and
2. Evaluate target audience recall,
Sanitation Committee (VHSC) and newborn
comprehension and appeal of the theme/
care. The second phase of the NRHM BCC
specific spots.
campaign was implemented through 16
3. Assess the effects of the campaign on
television spots, seven radio spots and 11
the perceptions of policymakers and
print advertisements.
program managers.
4. Provide feedback to MoHFW for improving
The United States Agency for International
future communication strategy.
Development (USAID), through its partner
agencies, ITAP, Vistaar and PSP-One,
1.3 METHODOLOGY
supported the Ministry’s campaign by
developing several new spots for the
Both quantitative and qualitative research
campaign. In order to gauge the effectiveness methodology were used in the concurrent
of the second phase of the BCC campaign,
evaluation for eliciting the required
MoHFW requested USAID to facilitate a
information. The evaluation focused on
concurrent evaluation, through Maternal &
structured interviews with currently married
Child Health Sustainable Technical Assistance women (15-29 years of age), husbands of
& Research (MCH-STAR).
currently married women (15-29 years of age),
and mothers and fathers-in-law of the target
USAID’s MCH-STAR initiative aims to
audiences; in-depth interviews with state
improve maternal, newborn, child health
and district level policy makers and program
and nutrition (MNCHN) policies, program
managers; and semi-structured interviews
approaches and resource allocations through with district, block and village level health
specialized Indian institutions that provide
and nutrition workers, who are considered
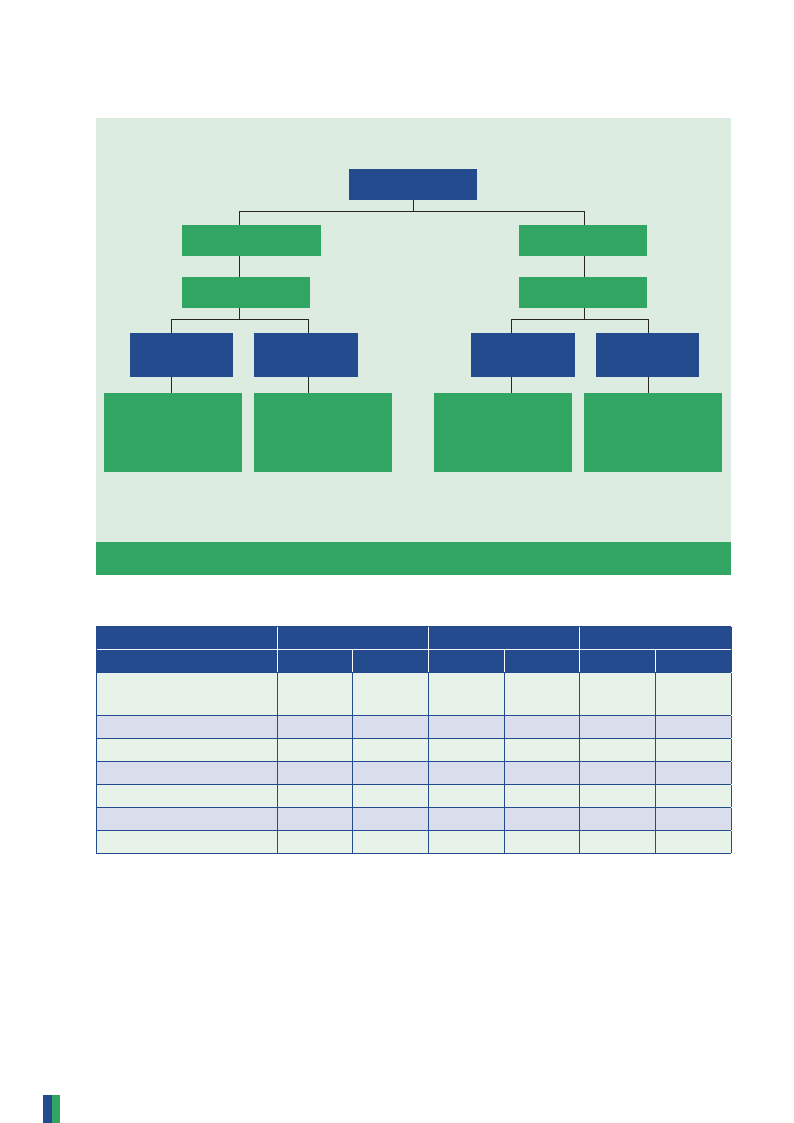
technical leadership and assistance, research local change agents (Figure 1.1).
1

2.6 Page 16

▲back to top


A Concurrent Evaluation of Phase II of the NRHM BCC Campaign
Figure 1.1: Methodology & Proposed Sample
Currently married
women: 15-29 years of
age-3600
Husbands of currently
married women:
15-29 years of age-1800
Mothers and
fathers-in-law of
women: 15-29 years of
age-360
d level
Semi structured interview
Methodology
depth discussion with policy makers and program manage
State level-30; District level-40; Block level-120; Village level-660
1.3.1 Geographical Coverage
group of 15-29 years and influencers such
A representative nation-wide sample of the
as mothers-in-law and fathers-in-law of
target audiences was drawn from the two
the women in the 15-29 year age group)
categories of states. The study covered 18
having exposure to either TV or radio
districts across 6 high focus states1 and 5
Policy makers (State Health Secretaries,
other remaining states2 (excluding Goa) in the
NRHM Directors and Panchayati Raj
country. (Figure 1.2)
Institutions (PRIs) in selected districts)
Program managers (State RCH Officers,
1.3.2 Target Respondents
Officers at Directorate that look after
The respondents for the survey comprised
MNCHN programs, Chief Medical
the following target audience of the BCC
Officers in selected districts and Medical
campaign:
Officers)
Target audience at the HH (household)
Community influentials (ASHAs/
level (currently married women within
teachers)
the age group of 15-29 years, currently
Health service providers at the grassroots
married men whose wives were in the age
level (AWWs/ANMs)
1 The 18 high focus states includes eight EAG states (Bihar, Chhattisgarh, Rajasthan, Madhya Pradesh, Orissa, Jharkhand, Uttar
Pradesh and Uttrakhand), Jammu and Kashmir and Himachal Pradesh, eight North- Eastern states (Assam, Arunachal Pradesh,
Nagaland, Manipur, Meghalaya, Mizoram, Sikkim and Tripura)
2 The other states includes: Andhra Pradesh, Karnataka, Tamil Nadu, Kerala, Punjab, Haryana, Gujarat, Maharashtra and West Bengal
2

2.7 Page 17

▲back to top


Figure 1.2: Map of the geographic coverage of the concurrent evaluation
Introduction
Other
States
(5)
Jammu & Kashmir
Himachal
Pradesh
Spread of 11 selected States
Punjab
Haryana
Uttaranchal
Delhi
Arunachal Pradesh
Rajasthan
Uttar Pradesh
Bihar
Sikkim
Assam
Nagaland
Meghalaya
Manipur
Gujarat
Madhya Pradesh
Jharkhand
West
Bengal
Tripura Mizoram
Chhattis
garh
Orissa
Maharashtra
Andhra Pradesh
High Focus
States
(6)
Goa
Karnataka
Kerala
Tamil Nadu
1.3.3 Sampling Design
The sampling design for the survey among
the target audiences at the household level
is outlined in Figure 1.3. Every effort was
made to ensure representative sampling for
the national level, high focus states, other
states and urban and rural populations. For
details of the sample selection process refer
to Annexure 1.
randomly selected from this list and further
screened for their exposure to TV or radio
(including mobile phone radios) during the
campaign period from last Christmas i.e.
26th December, 2008 to January 27th, 2009.
The target and actual sample coverage of
eligible women, eligible men and fathers and
mothers-in-law is given in Table 1.1.
In each selected cluster, an exhaustive
house listing exercise was carried out to
identify Currently Married Women (CMW )
aged 15-29 years, Currently Married Men
(CMM) whose wives were aged 15-29 years,
and fathers and mothers-in-law of CMW
aged 15-29 years. Eligible individuals were
An array of policy makers and program
managers at the state, district and block level
as well as service providers and community
influencers at the village level were
contacted for the concurrent evaluation
study. The sample desig n is outlined in
Figure 1.3.
3

2.8 Page 18

▲back to top


A Concurrent Evaluation of Phase II of the NRHM BCC Campaign
Figure 1.3: The sample design for eliciting individual and HH level data
SAMPLING AT A GLANCE
National
High Focus States
9 Districts
Other States
9 Districts
10 Villages
(Rural)
10 Wards
(Urban)
10 Women
5 Husbands
1 Father/Mother-
in-Law
10 Women
5 Husbands
1 Father/Mother-
in-Law
10 Villages
(Rural)
10 Women
5 Husbands
1 Father/Mother
in Law
10 wards
(Urban)
10 Women
5 Husbands
1 Father/Mother
in Law
Women - 3600
Men - 1800
Mothers/Fathers-in-Law-360
Sample size determined based on 95% confidence level and 5% margin of error for women and 7% for men
Note: PPS systematic random sampling of villages and wards based on SC/ST Population
Table 1.1: Target and actual sample coverage of respondents at the household level
Respondents
Currently Married
Women
Urban
Rural
Currently Married Men
Urban
Rural
Father/mother-in-law
High focus states
Target Achieved
1800
1796
Other states
Target Achieved
1800
1779
Total
Target Achieved
3600
3575
900
898
900
883
1800
1781
900
898
900
896
1800
1794
900
900
900
884
1800
1784
450
450
450
437
900
887
450
450
450
447
900
897
180
179
180
171
360
350
1.4. RESEARCH INSTRUMENTS
For each category of respondents, a separate
questionnaire was prepared. The following
research tools were developed and used for
this survey:
A. Quantitative survey tools
i. Listing format
ii. Questionnaire for currently married
women of 15-29 years of age
iii. Questionnaire for husbands of currently
married women of 15-29 years of age
iv. Questionnaire for fathers/mothers-in-law
of women of 15-29 years of age
v. Semi-structured discussion guidelines for
village functionaries.
4

2.9 Page 19

▲back to top


Introduction
Figure 1.4: Sample coverage of Policy Makers, Program Managers, Service Providers and
Community Influencers
State level (30)
District level (40)
Block level (120)
Village level (660)
• Health Secretaries • NRHM Directors • RCH officers • Officials of IEC/BCC cell
• District Collector • Chief Medical Officer • NRHM Program Manager
• Medical Officers • CDPO • LHV
• ASHAs • ANMs • AWW s • PRIs • Teachers
B. Qualitative survey tools
i. In-depth discussion guidelines for policy
makers/program managers
All research tools were translated into
the regional languages of the states
selected for study. After finalization, all
the questionnaires were pre-tested in two
states, Uttar Pradesh and Haryana, in order
to check the language, flow of questions
and necessary skips and filters. The tools
were modified accordingly and finalized.
For the detailed data collection tools and
recruitment, training, fieldwork and data
processing, please see Annexure 2.
1.5 STIMULI PROVIDED TO THE
RESPONDENTS FOR AIDED RECALL
OF THE SPECIFIC TV AND RADIO
SPOTS
Visual and audio stimuli were used for
aided recall of the specific spots when
respondents were not able to recall the spots
spontaneously as listed below:
Hints about characters involved in the
spots, specific themes on which spots
were telecast/broadcast and initial
verbatim of the spots without giving out
the exact message.
Display of flip charts showing
photographs of each spot on the specific
themes for TV spots.
Use of tape recorders for playing a
portion of the radio spots.
1.6 FIELD CHALLENGES AND
LIMITATIONS
The following problems were faced during the
execution of the study:
A major limitation encountered was
the unavailability of information on
the number of times each TV or Radio
spot was aired during the campaign.
This would have generated a richer
analysis by correlating airing frequency
with level of recall and message
comprehension.
Since there were 16 TV spots in the
campaign, going through spots one by
one during interviews would have been
time consuming and tedious; therefore,
spots were slotted into various themes,
such as ANC, family planning, JSY and
ASHA, so as to improve ease in recall
by way of dealing with one theme at
one time.
For some themes such as family
planning, as many as five different TV
spots were aired during the campaign
period. This could have led to recall
issues. Colorful photographs of different
TV spots were used as stimuli to aide
prompted recall.
Celebrity Juhi Chawla starred in two
TV spots on different themes (ANC and
family planning) wearing the same outfit.
During the pre-testing exercise, this was
observed to be leading to confusion in
the minds of some respondents who
5

2.10 Page 20

▲back to top


A Concurrent Evaluation of Phase II of the NRHM BCC Campaign
reported seeing the spot only to realize
1.7 PRESENTATION OF THE
later on that it was a different spot. For
REPORT
this, investigators were instructed to
lay more emphasis on the theme right
The results of the study are presented
at the beginning of questions regarding
in seven chapters of this report. The
a particular TV spot (especially in case
first chapter outlines the objectives,
of these two spots), so as to ensure that
methodology, sampling framework and
questions were answered regarding that
sample coverage of the study. The second
particular TV spot only.
chapter provides the details of profile of
The time frame of the campaign was from all the respondents covered in the study.
December 26th, 2008 to January 27th, 2009. Chapter three presents the findings on
Referring to these dates again and again the exposure to TV and radio, and also the
was proving to be quite tedious for the
media habits of respondents. Chapter four
investigators. It was therefore decided,
outlines the exposure of target groups to the
that instead of citing the dates repeatedly, NRHM BCC campaign. In the fifth chapter,
the period would be referred to as ‘the
message recall, comprehension, appeal
period between Christmas and Republic and intent to take action based on the TV
Day’ after mentioning the dates once or
spots are discussed. Chapter six explores the
twice. This proved to be a much easier
recall comprehension, appeal and intent to
way for respondents to remember the
take action with respect to the radio spots
period in question and also helped in
under NRHM. Chapter seven highlights the
preventing tedious repetition.
conclusions and recommendations as an
outcome of this concurrent evaluation.
6

3 Pages 21-30

▲back to top


3.1 Page 21

▲back to top


Chapter 2
Household Characteristics and
Profile of the Respondents
Following the randomized sampling method,
the study interviewed 3,575 currently married
women, 1,784 currently married men, and
350 mothers or fathers-in-law of currently
married women. None of the respondents
were related by marriage. The study also
conducted semi-structured conversations
with village functionaries and in-depth
interviews with 30 state, 54 district, and 120
block level officials.
2.1 CURRENTLY MARRIED WOMEN
Among the 3,575 currently married women,
nine percent were aged 15-19 and 52
percent were aged 25-29. Thirty-one percent
were illiterate and 15 percent had gone to
secondary school. Twenty-three percent were
from Scheduled Castes (SCs), eight percent
were from Scheduled Tribes (STs)
and 36 percent were from the Other Backward
Classes (OBCs). Sixty-two percent lived in
homes with a working television and
thirty-one percent had a working radio.
Table 2.1 summarizes the characteristics of
the women respondents.
2.2 CURRENTLY MARRIED MEN
Among the 1,784 currently married men,
12 percent were under 20 years of age, and
three percent were over 40 years of age.
Fifteen percent were illiterate and 21 percent
had attended secondary school. Twenty-five
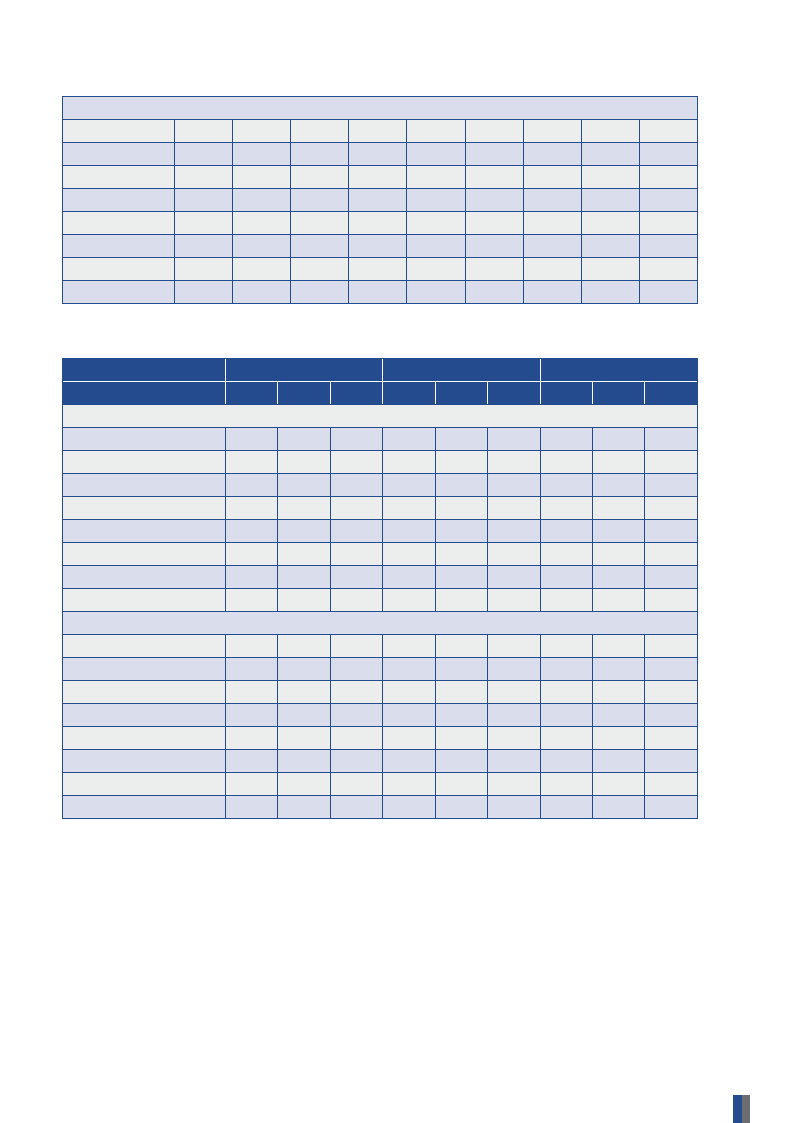
Table 2.1: Demographic and socio-economic characteristics of currently married women
High Focus States
Other States
Combined
Rural
Age
15-19
8.5
20-24
41.4
25-29
50.0
Educational Status
Illiterate
52.9
Literate w/o
3.1
schooling
Primary
11.2
Middle
15.6
Secondary
7.0
Higher secondary 7.6
Graduate & above 2.7
Other
Average no. of
2.4
living children
Urban
6.4
37.8
55.7
27.9
2.5
10.7
15.4
19.6
9.8
14.0
.2
2.2
Total
8.1
40.7
51.2
47.9
3.0
11.1
15.5
9.5
8.0
5.0
.0
2.3
Rural Urban Total
11.3 4.4 8.8
40.2 38.5 39.6
48.5 57.2 51.5
15.7 13.2 14.8
4.2 2.3 3.5
18.5 14.1 16.9
28.1 22.7 26.2
20.3 23.6 21.5
7.3 12.7 9.2
5.1 10.7 7.1
.8
.7
.8
1.9 1.8 1.8
Rural Urban Total
9.7 5.1 8.5
40.9 38.2 40.2
49.4 56.6 51.4
36.4 18.5 31.4
3.6 2.4 3.2
14.4 12.9 14.0
21.1 20.0 20.8
12.9 22.2 15.4
7.5 11.6 8.6
3.8 11.9 6.0
.4
.5
.4
2.1 2.1 1.9
7

3.2 Page 22

▲back to top


A Concurrent Evaluation of Phase II of the NRHM BCC Campaign
% having at least
one child aged
below 6 years
% of currently
pregnant women
% of currently
lactating women
Caste
SC
ST
General
OBC
Type of family
Nuclear
Joint/Extended
Asset Ownership
Radio/Transistor
Mobile Phone
with FM/Radio
Black and White
TV
Color TV
HHs having
working TV
HHs having
working Radio
Total N
87.7
11.1
46.0
22.5
10.9
15.8
50.8
50.7
49.3
34.4
13.4
30.2
26.4
47.3
34.6
1440
89.4 88.0 74.8
11.4 11.1 10.9
37.8 44.4 27.2
20.1 22.0 23.7
4.2 9.5 7.7
36.1 19.9 47.3
39.5 48.6 21.2
51.9 51.0 53.5
48.1 49.0 46.5
22.2 32.0 28.8
28.2 16.3 15.6
19.3 28.0 24.9
73.6 35.7 45.0
82.7 54.3 61.3
34.8 34.6 26.3
357 1797 1151
77.2 75.6 82.0
10.1 10.6 11.0
23.9 26.0 37.7
24.1 23.9 23.1
2.1 5.7 9.5
46.1 46.9 29.8
27.8 23.5 37.7
60.8 56.1 52.0
39.2 43.9 48.0
30.2 29.3 32.0
26.4 19.4 14.3
15.5 21.6 27.8
73.2 54.9 34.6
82.6 68.8 53.5
29.7 27.5 30.9
628 1779 2591
81.7 81.9
10.6 10.9
28.9 35.3
22.6 22.9
2.9 7.7
42.5 33.3
32.0 36.1
57.6 53.5
42.4 46.5
27.3 30.7
27.1 17.9
16.9 24.8
73.3 45.3
82.6 61.5
31.6 31.1
984 3575
percent were from SCs and nine percent were
from STs. Fifty-seven percent lived in a home
with a working television and 33 percent had
a working radio.
2.3 IN-LAWS OF CURRENTLY
MARRIED WOMEN
Among the 350 mothers and fathers-in-law of
currently married women, three percent were
aged 30-39 while 38 percent were over
60 years of age. Almost half (46%) were illiterate,
and seven percent had attended secondary
school. Eighty-one percent were Hindus and 11
percent were Muslims. Nineteen percent were
from SCs, 16 percent were from the STs and 34
percent were from the OBCs.
2.4 VILLAGE FUNCTIONARIES
Sixty-one percent of the 661 village
functionaries surveyed had been in their
positions fewer than six years, while
22 percent had more than 12 years of tenure.
2.5 PROFILE OF POLICY MAKERS
AND PROGRAM MANAGERS
2.5.1 State level program officials
As mentioned in the earlier chapter,
discussions were held with about 30 state
level officials. These included state level
Health Secretaries, State NRHM Mission
Directors, Information, Education &
Communication (IEC) Directors, State RCH
8

3.3 Page 23

▲back to top


Household Characteristics & Profile of the Respondents
Officers and Officers at the Directorate who
look after MNCHN. Most of these officials
had been working in their respective posts
for 1-4 years.
2.5.2 District level officials
Discussions were held with 54 district level
officials in all. These officials included District
Collectors, Chief Medical Officers (CMOs) and
District Social Welfare Officers. Most of these
officials had been working at their present
posts for 1-3 years.
2.5.3 Block level officials
About 120 block level officials were contacted.
These included Medical Officers, Child
Development Project Officers (CDPOs) and
Lady Health Visitors (LHVs). Most of these
officials had been working in their respective
posts for 4 years or more.
9

3.4 Page 24

▲back to top


Chapter 3
Exposure to Media
This chapter explores the frequency of
exposure to TV and radio, the most frequently
watched and listened to channels and
programs, and preferred timings among
women, men and fathers and mothers-in-law
who had any exposure to these during the
campaign period.
3.1 EXPOSURE TO TV OR RADIO
From among all those contacted, only those
who were exposed to either TV or radio during
the campaign period were interviewed and
included as respondents in this evaluation.
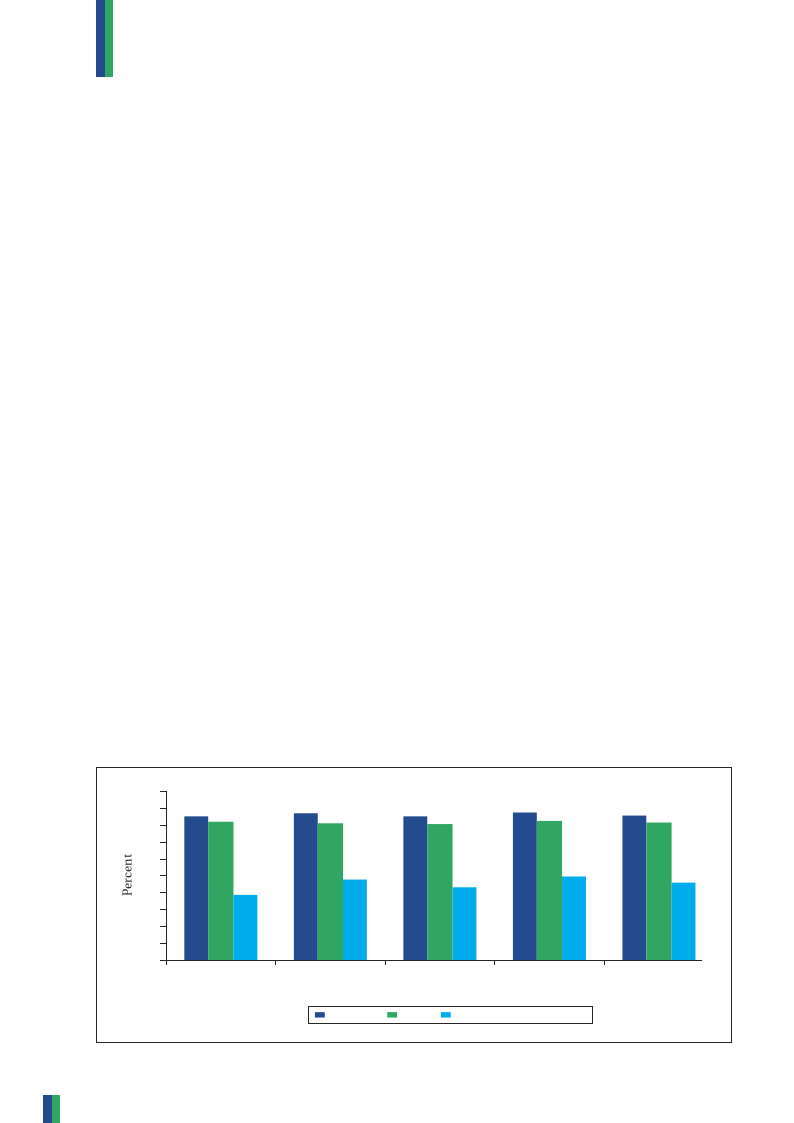
Figure 3.1 outlines the proportion of those
interviewed who were exposed to TV or radio
during the NRHM Phase II BCC campaign
period. For both women and men, these
findings are similar across high focus and other
states as well as rural and urban areas, re-
asserting the assumption that a combination
of both TV and radio has significant reach for
currently married women and their husbands
in the age group of 15-29 years throughout the
country.
3.2 TV VIEWING HABITS, FAVORITE
CHANNELS, PROGRAMS AND
PREFERRED TIMINGS
Of those currently married women and their
husbands, who were exposed to TV within the
campaign period, their viewing habits, such
as frequency of viewing or favorite channels,
were explored in depth. Tables 3.1 and 3.2
highlight these findings for women and men
respectively. For more detailed information
on TV viewing habits of men and women refer
to Annexure 3.
3.2.1 Frequency of Television Viewing
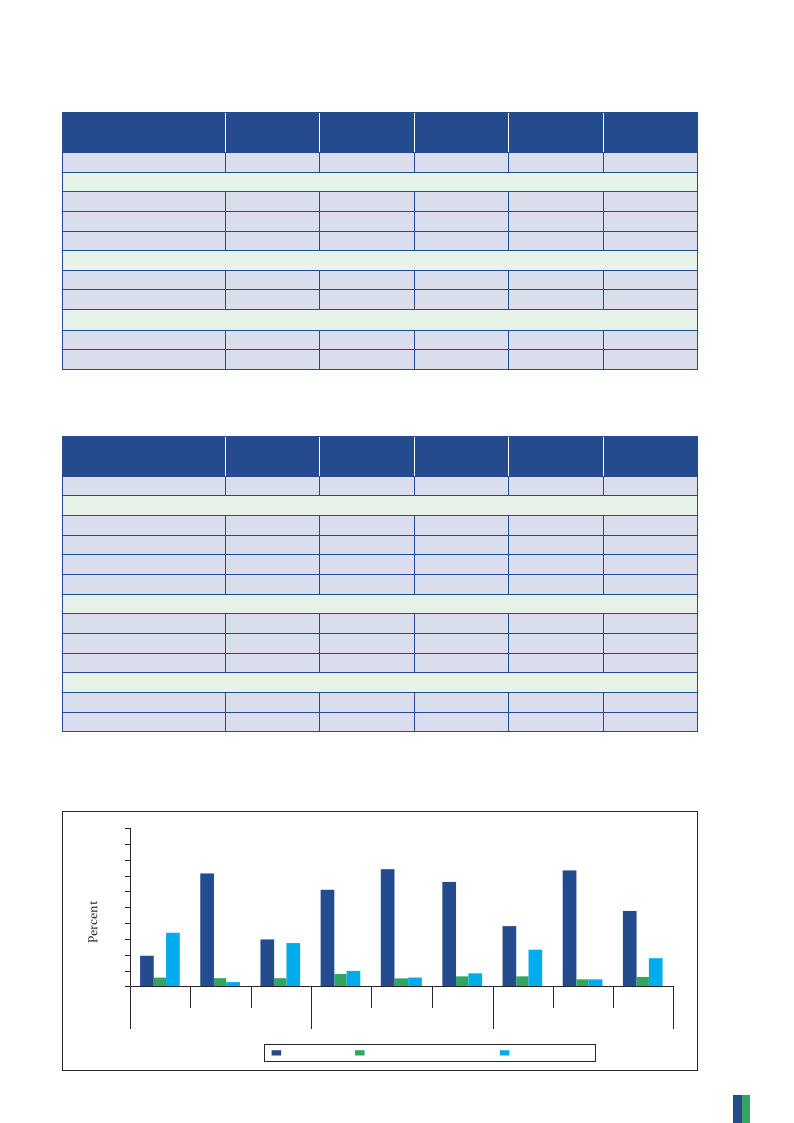
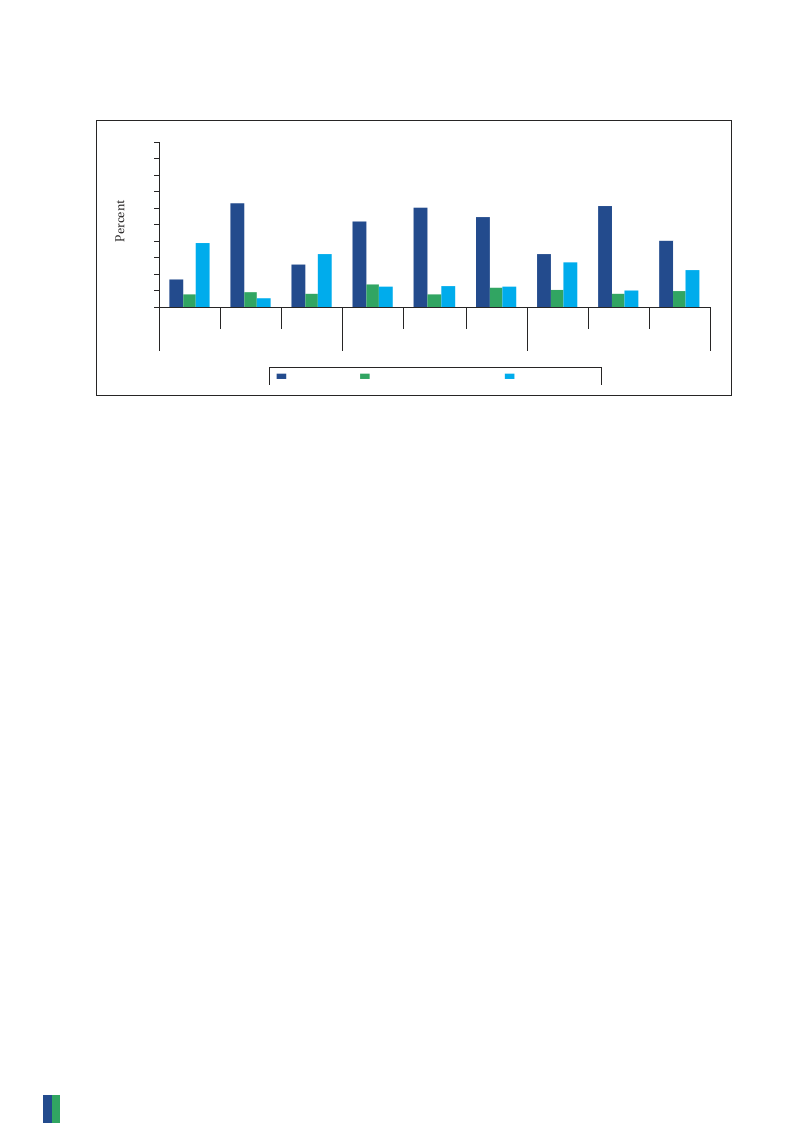
Figures 3.2 and 3.3 depict the frequency
of television viewing among women and
men respectively. A majority of women and
men watch TV daily across the country, the
exceptions being in rural areas of high focus
states.
Figure 3.1: Exposure to radio/TV during the campaign period by place of residence,
type of state and gender, among those with access to radio/TV
100
90
85.5 82.2
80
70
60
50
40
38.8
30
20
10
0
High focus
states
87.4
81.3
85.3 80.9
87.7 82.7
48.1
43.2
49.6
Other states
Rural
Urban
Women Men Fathers/Mothers-in-law
86 81.8
46.1
Total
10

3.5 Page 25

▲back to top


Exposure to Media
Table 3.1: Viewing habits among women exposed to TV
High focus
states
Watched TV everyday
30%
Most watched Channels
DD National
77%
Star Plus
20%
Zee TV
19%
Most watched programs
Serials
79%
Films
70%
Timings
Other states
66%
28%
20%
17%
82%
70%
Rural
38%
62%
10%
10%
78%
73%
Between 6-9pm
After 9 pm
25%
61%
39%
20%
19%
14%
Base: For ‘watched TV everyday’ – All respondents
All other questions: Female respondents exposed to TV
Table 3.2: Viewing habits among men exposed to TV
High focus
states
Watched TV everyday
26%
Most watched Channels
DD National
88%
DD News
23%
Zee Cinema
11%
Star Plus
12%
Most watched programs
Films
71%
News
62%
Serials
59%
Timings
Between 6-9pm
25%
After 9 pm
28%
Other states
55%
36%
12%
12%
11%
72%
68%
42%
52%
36%
Base: For ‘watched TV everyday’ – All respondants
Remaining: Male respondents exposed to TV
Rural
32%
67%
18%
8%
5%
71%
65%
48%
39%
30%
Urban
74%
24%
39%
34%
86%
63%
57%
29%
Urban
61%
41%
14%
18%
25%
73%
67%
54%
43%
37%
Total
48%
50%
20%
18%
80%
70%
45%
19%
Total
40%
59%
17%
11%
11%
72%
65%
50%
40%
32%
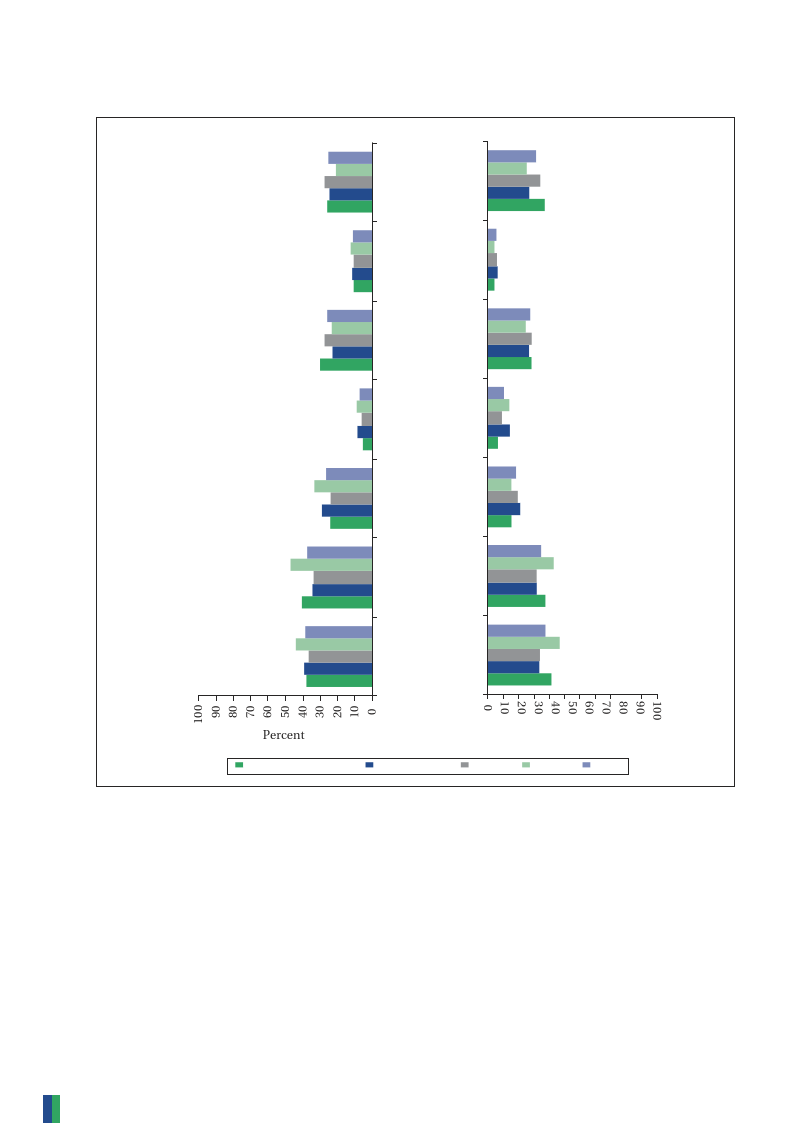
Figure 3.2: Frequency of TV viewing among women
100
90
80
70
60
50
40
30
20
10
0
Rural
Urban
Total
High focus states
Rural Urban
Total
Other states
Rural Urban Total
Combined
Everyday
At least 3 times/week No exposure
11

3.6 Page 26

▲back to top


A Concurrent Evaluation of Phase II of the NRHM BCC Campaign
Figure 3.3: Frequency of TV viewing among men
100
90
80
70
60
50
40
30
20
10
0
Rural
Urban Total
High focus states
Rural Urban Total
Other states
Rural
Urban Total
Combined
Everyday
At least 3 times/week No exposure
3.2.2 Favorite Channels
Overall, DD National was the most watched
channel. While this was the most watched
channel by rural women and men as well as
by urban men, Star Plus emerged as the most
frequently watched channel among urban
women. In other states, regional channels
like Sun TV, Udaya TV, KTV, ETV Bangla were
mentioned by a sizeable proportion of women
and men respondents (shown in Annexure 3),
indicating the potential of regional media in
state level campaigns.
areas (57%) as compared to rural areas (39%).
For men, 40 percent and 32 percent preferred
to watch TV between 6 and 9 pm and after
9 pm respectively. About one-third (33%)
of the men reported that they did not have
a preferred fixed time for watching TV. This
proportion was much higher in high focus
states (51%) than in other states (19%).
3.3 RADIO HABITS, FAVORITE
CHANNELS, PROGRAMS AND
PREFERRED TIMINGS
3.2.3 Favorite Programs
The top three preferred programs for women
and men were films, serials and news in
differing orders. Women respondents preferred
serials (80%), films (70%) and then the news
(28%). Men, however, preferred films (72%)
followed by news (65%) and serials (50%).
3.2.4 Preferred Viewership Timings
The most preferred timing for watching TV
among women and men was the slot between
6 and 9 pm (45% for women and 40% for
men). However, nearly 30 percent of both
women and men respondents had no fixed
time slot for watching TV (Tables 3.1 and 3.2)
The proportion of women preferring the 6-9
pm time slot for watching TV was significantly
higher in other states (61%) in comparison to
those in high focus states (25%), and in urban
The viewing habits, such as frequency of
viewing, favourite channels and preferred
timings of those currently married women
& their husbands who were exposed to radio
within the campaign period, were explored
in depth. Tables 3.3 and 3.4 highlight these
findings for women and men respectively.
For more detailed information on radio
listening habits of men and women refer to
Annexure 4.
3.3.1 Frequency of Radio Listening
Just over one-fourth (34%) of women and
men (26%) had exposure to the radio during
the campaign period indicating a lower reach
of radio as compared to TV. The proportion
of women and men respondents with no
exposure to radio was significantly higher in
other states as compared to high focus states.
12

3.7 Page 27

▲back to top


Exposure to Media
Table 3.3: Listening habits among women exposed to radio
High focus
states
Listened to the radio
11%
everyday
Most popular Channels
FM General
61%
All India Radio
45%
Radio Mirchi
7%
Most popular programs
Songs
93%
News
33%
Timings
Between 6-9pm
17%
No fixed slot
50%
Other states
11%
38%
22%
32%
94%
42%
32%
29%
Rural
12%
53%
41%
14%
93%
36%
21%
45%
Base: ‘Listening everyday’ – All respondents
All other questions: Female respondents exposed to radio
Urban
10%
58%
21%
19%
96%
33%
27%
36%
Total
11%
54%
37%
15%
94%
36%
22%
43%
Table 3.4: Overview of listening habits among men exposed to radio
Listened to the radio
everyday
Most popular Channels
All India Radio
FM General
Radio Mirchi
Most popular programs
Songs
News
Timings
Between 6-9pm
No fixed slot
High focus
states
12%
70%
46%
7%
91%
59%
7%
80%
Other states
13%
37%
20%
36%
93%
61%
33%
35%
Rural
13%
59%
37%
18%
92%
60%
18%
60%
Urban
13%
32%
25%
27%
91%
60%
20%
52%
Base: ‘Listening to radio everyday – All respondents
All other questions: Male respondents exposed to radio
Total
13%
55%
35%
20%
92%
60%
19%
58%
The exposure to radio was higher among
both women and men in rural areas than in
urban areas particularly in high focus states.
Moreover, among those exposed to radio, daily
radio listening for women was 11 percent and
for men 13 percent. These findings indicate
that compared to TV, radio listening is less
prevalent among both women and men,
especially in urban areas and in other states.
3.3.2 Favorite Channels and Programs
Respondents were asked about their
preference from a list of nine channels.
FM General emerged as the most popular
channel in terms of frequency of listening
for women (54%) followed by All India Radio
(37%) and Radio Mirchi (15%). For men, the
radio channel most listened to was All India
Radio (55%) followed by FM General (35%)
13

3.8 Page 28

▲back to top


A Concurrent Evaluation of Phase II of the NRHM BCC Campaign
and Radio Mirchi (20%) as shown in
Annexure 4. Both women and men listened
to songs followed by the news.
For women respondents (Table 3.3), FM
General was more frequently listened to in
high focus states in comparison to other
states. All India Radio had the highest reach
for rural women in high focus states. Radio
Mirchi was the third most popular radio
channel among women with the proportion
of listening relatively higher in other states as
compared to high focus states.
3.4 MEDIA EXPOSURE AMONG
FATHERS AND MOTHERS-IN-LAW
Overall, daily TV viewing was fairly common
among fathers and mothers-in-law who had
exposure to TV or radio during the NRHM
Phase II BCC Campaign period with an overall
daily viewing rate of 47 percent, 31 percent
in high focus states and 64 percent in other
states; 57 percent in urban areas and 39
percent in rural areas. Nearly one-fourth of
the fathers and mothers-in-law reportedly
watched TV occasionally.
In case of male respondents (Table 3.4), All
India Radio, the most popular radio channel,
was observed to be significantly more
popular in high focus states as compared to
other states. A higher proportion of males in
rural areas listened to All India Radio than
those in urban areas. FM General emerged
as the second most popular channel among
men with little rural-urban variation;
however, twice as many men in high
focus states (46%) listened to the channel
compared to their counterparts in other
states (20%). Radio Mirchi was the third most
popular channel among men
as well.
Radio listenership was quite low among the
fathers and mothers-in-law in both categories
of states as well as rural and urban areas.
Overall, 57 percent of fathers and
mothers-in-law had no exposure to radio
and another 24 percent listened to radio only
occasionally.
3.5 MEDIA EXPOSURE AMONG
VILLAGE FUNCTIONARIES
Table 3.5 shows exposure of village level
functionaries to TV, radio and print media.
The overall percentage of those watching TV
is only marginally higher than all respondents
at the household level.
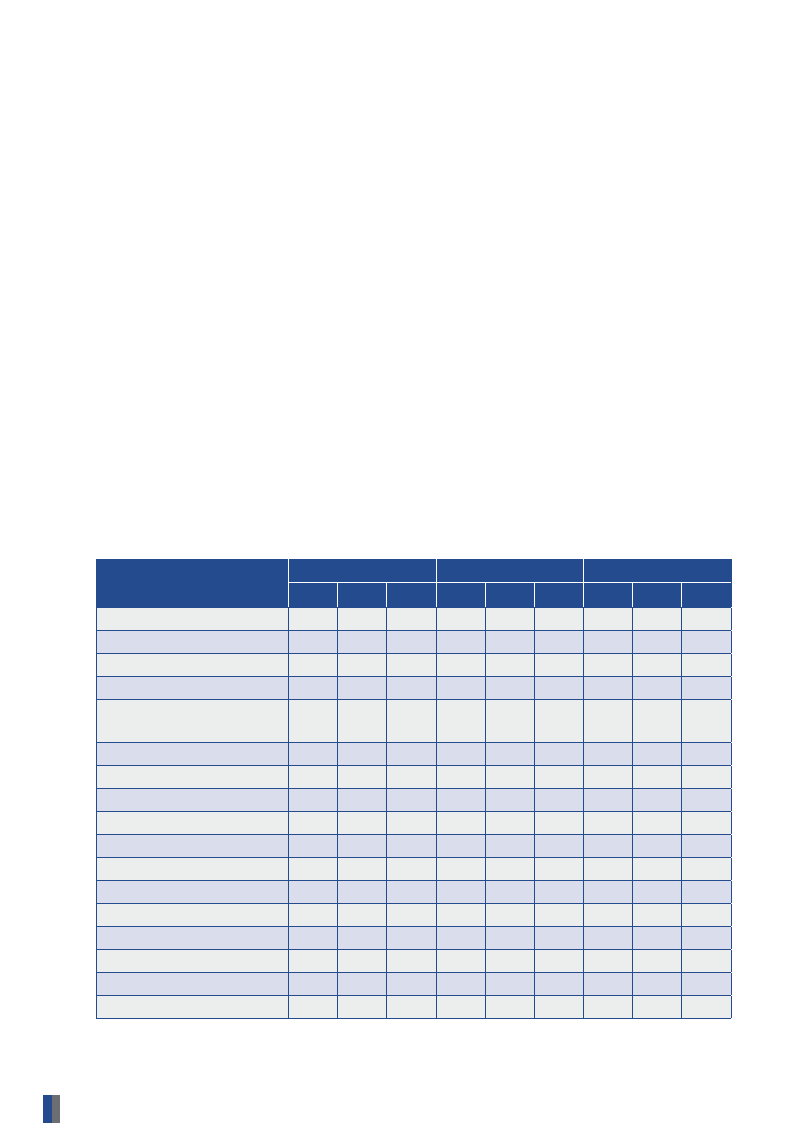
Table 3.5: Percent distribution of village functionaries by their media exposure
% watching TV
% listening to radio
% reading news
papers regularly
Total N
High focus states
Rural Urban Total
74.7 91.6 82.9
47.2 29.3 38.6
33.1 52.7 42.6
178 167 345
Other states
Rural Urban Total
93.6 95.9 94.6
36.3 39.3 37.7
53.2 66.9 59.5
171 145 316
Combined
Rural Urban Total
84 93.6 88.5
41.8
34 38.1
43 59.3 50.7
349 312 661
14

3.9 Page 29

▲back to top


Chapter 4
Exposure of Target Groups to NRHM
Television and Radio Campaign Spots
In the second phase of the campaign, a total
of 16 TV and 7 radio spots were broadcasted
to communicate messages on issues relating
to antenatal care, institutional delivery, birth
spacing, family planning, immunization,
newborn care, nutrition, breastfeeding, age
of marriage and NRHM/health services at
Government health facilities. This chapter
presents the exposure of target groups to the
campaign. For the purpose of this evaluation,
exposure is defined as spontaneous or
prompted recognition of any given TV or
radio spot listed in Tables 4.1 and 4.2.
Table 4.1: Television spots aired in the NRHM BCC campaign
Theme
Antenatal Care/Institutional Delivery
Birth Spacing/Family Planning
Immunization
NRHM and Health Services
Newborn Care
Nutrition/Breastfeeding
Age of Marriage
TV spots
Crystal Ball
Sachin and Supriya (ANC)
Jagmag
Juhi Chawla (ANC)
Mehendi
Holi
Train
Sachin and Supriya (FP)
Juhi Chawla (FP)
Juhi Chawla (Immunization)
Mona Singh (Immunization)
Pragati on Medical Tour
Ek Savera Ek Akash
Radheyshyam ki Motorcycle
Badhte Shishu ki Badhti Zaroorat
Age of Marriage
Table 4.2: New and old TV spots aired in the NRHM BCC campaign
New spots
Crystal Ball
Jagmag
Radheyshyam ki Motorcycle
Mehendi
Holi
Pragati on Medical Tour
Ek Savera Ek Akash
Old spots
Juhi Chawla (ANC)
Sachin and Supriya (ANC)
Train
Sachin and Supriya (FP)
Juhi Chawla (FP)
Juhi Chawla (Immunization)
Mona Singh (Immunization)
Badhte Shishu ki Badhti Zaroorat
Age of Marriage
15

3.10 Page 30

▲back to top


A Concurrent Evaluation of Phase II of the NRHM BCC Campaign
Table 4.3: Radio spots aired in the NRHM BCC campaign
Theme
Antenatal Care
Institutional Delivery and JSY
Family Planning
NRHM and Health Services
Radio spots
Pragati talking to Papa
Conversation with ASHA
Journalist Khushi
Holi (Song)
Mehendi (Song)
Pragati talking to Friends
Mona Singh (Immunization)
4.1 THE REACH OF NRHM TV SPOTS
AMONG WOMEN AND MEN
Figure 4.1. depicts the reach of any of the
16 TV spots among all women and men
contacted for the study and who were
exposed to TV during the NRHM phase II
campaign period. The figures show that the
campaign had significant exposure among
those who watched TV. At the national level,
72 percent of women and 77 percent of men
who were exposed to TV during the campaign
period had seen at least one campaign spot.
Though exposure to the campaign was
greatest in urban areas and other states,
exposure in all locations was fairly high.
4.1.1 Number of TV Spots Viewed
An analysis of the extent of viewership of
TV spots shows that approximately half of
the women and men had seen more than
one spot and approximately one-third had
seen at least three or more NRHM TV spots
during the NRHM Phase II campaign period
(Figure 4.2). Figures 4.3 and 4.4 show that
the proportion of women and men viewing
three or more TV spots in high focus and
other states was comparable. However,
considerable differences existed between
the rural and urban areas. Compared to 38
percent of the women in urban areas, only
28 percent of those in rural areas had seen
three or more TV spots. Similarly, three
or more TV spots were seen by 33 percent
men in urban areas, against 24 percent in
rural areas. The greatest exposure to the
campaign through TV spots was among
women and men living in urban areas of
high focus states.
Figure 4.1: Exposure to any NRHM TV spot among women & men who watched TV during the
campaign period
100
80
72 77
60
95
80
66
63
74 82
68 67
40
20
0
National
High Focus
Other States
Women
Men
Rural
Urban
16

4 Pages 31-40

▲back to top


4.1 Page 31

▲back to top


Exposure of Target Groups to NRHM Television and Radio Campaign Spots
Figure 4.2: Number of TV spots seen on TV
100
90
80
70
60
50
40
30
20
10
0
Not Seen
1 Spot
2 Spot
Women
Men
3 Spot
4 or more
spots
Figure 4.3: Exposure to TV spots among women
100
90
80
70
60
50
40
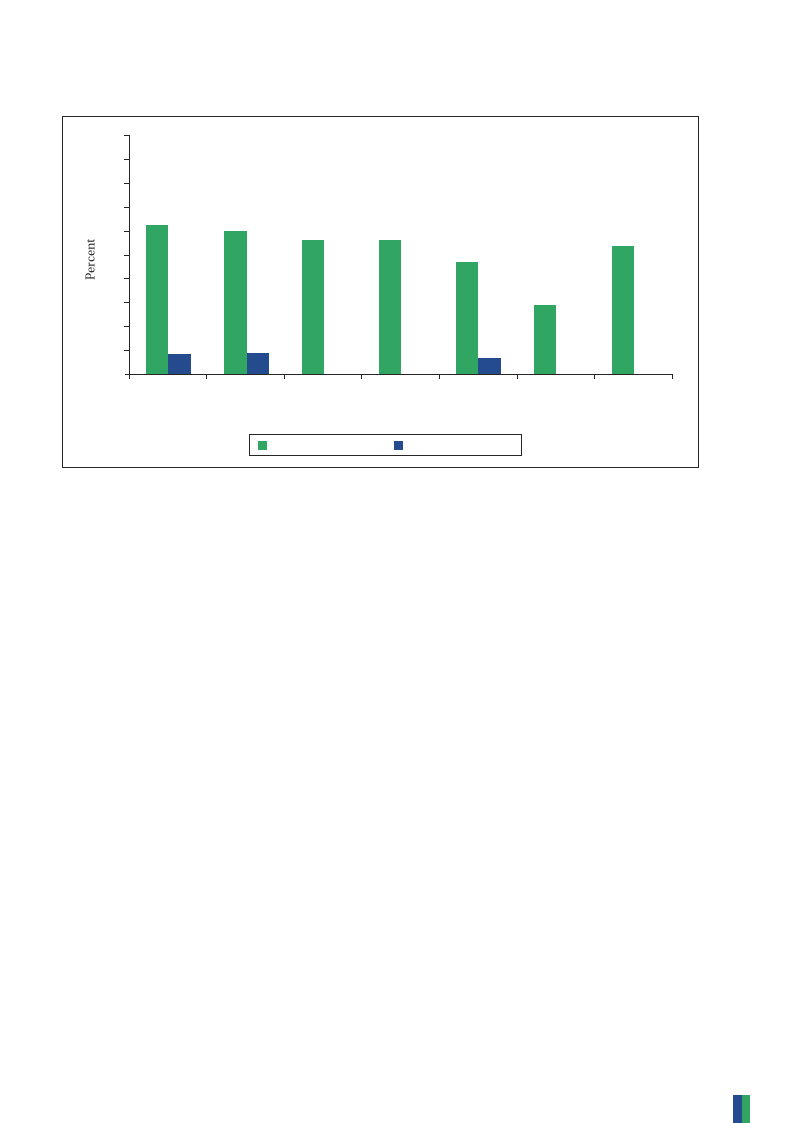
30
20
10
0
High focus
states
Other states
None
3 or more
Figure 4.4: Exposure to TV spots among men
100
90
80
70
60
50
40
30
20
10
0
High focus
states
Other states
None
3 or more
Combined
Combined
4.1.2 Exposure to Theme Specific
TV Spots
The findings on reach of theme specific
TV spots among the women exposed to TV
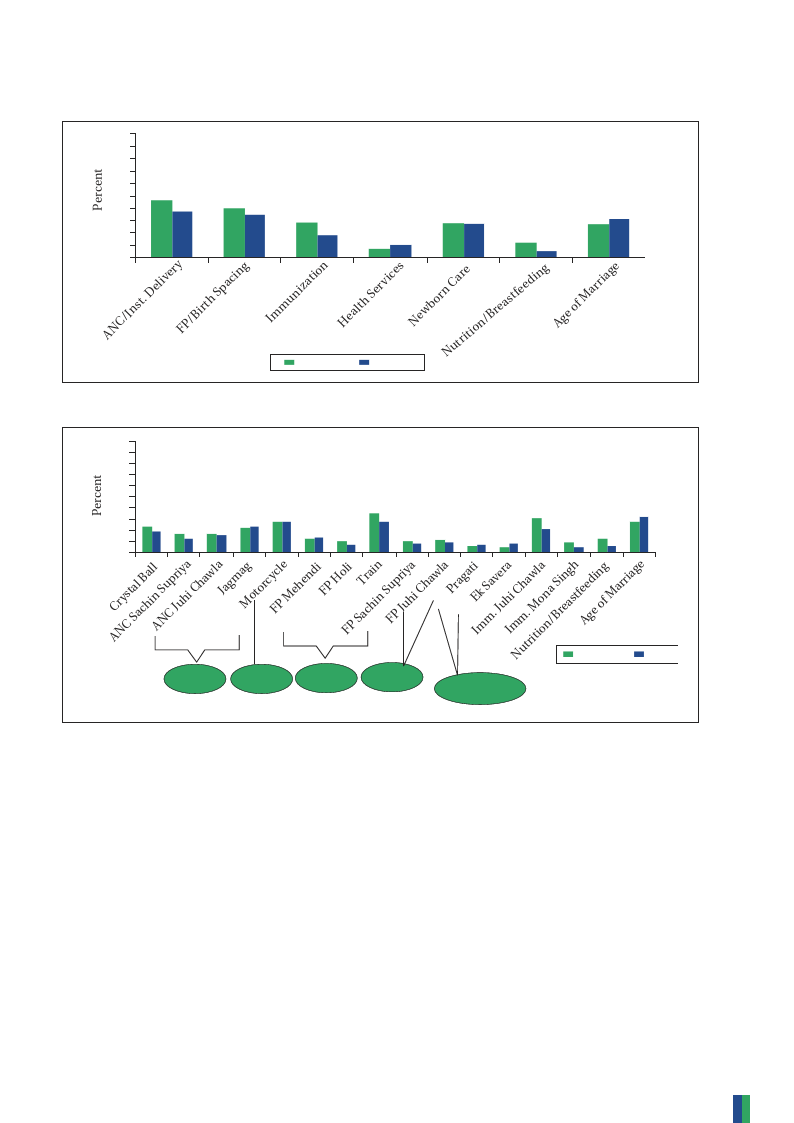
are presented in Figure 4.5. Overall, the
TV spots on antenatal care/institutional
delivery and birth spacing/family planning
had the greatest reach, whereas, the
spots on NRHM/health services and on
nutrition/breastfeeding had the lowest
reach among both women and men. In
terms of urban-rural exposure, barring
17

4.2 Page 32

▲back to top


A Concurrent Evaluation of Phase II of the NRHM BCC Campaign
Figure 4.5: Women’s & Men exposure to theme specific TV spots
Age of Marriage
Nutrition/
Breastfeeding
Newborn Care
Women
Health Services
Men
Immunization
FP/Birth Spacing
ANC/Inst. Delivery
Percent
High Focus States
Other States Rural
Percent
Urban Total
the ‘age of Marriage’ and ‘Newborn care’
TV spots, the other TV spots had greater
reach among the urban population. The
detailed information on thematic exposure
is provided in Table 4.1.
4.1.3 Exposure to Specific TV Spots
Figure 4.7 presents the reach of each of the
16 TV spots used in the NRHM BCC campaign
among women and men.
Among all the advertisements, ‘The Train’
which gave messages on oral contraceptive
pills had the maximum reach among
women with 32 percent exposure during the
campaign period. The spot recalled most
frequently by men (29%) was ‘Age of Marriage’.
The other advertisements that had a sizeable
reach among women and men were:
‘Radheyshyam ki Motorcycle’ on newborn
care, ‘Jagmag’ and ‘Crystal Ball’, both on ANC/
18

4.3 Page 33

▲back to top


Exposure of Target Groups to NRHM Television and Radio Campaign Spots
Figure 4.6: Exposure to the NRHM TV campaign by gender
100
90
80
70
60
50
40
30
20
10
0
ANC/Inst.
DeliveryFP/Birth
Spacing
Immunization
Health Services
Women
Men
NewbornNCuatrrietion/Breastfeeding
Age of Marriage
Figure 4.7: Exposure to specific TV spots
100
90
80
70
60
50
40
30
20
10
0
ACNryCstSaal BchailnlASNuCpJruiyhai
ChawlaJagmaMg otorcyFcPleMehendi
FP
Holi
FP
Train
Sachin
SFuPprJiuyhai
Chawla
PragatEiImk Sma.vJeurhaIimNCmuhta.rwMitlioaonna/BSrineagshtWfeAegodeimnogfeMnarriage
Men
ANC
NBC
FP
NRHM
Immunization
Base: Respondents exposed to TV
institutional delivery, and ‘ Juhi Chawla on
Immunization’. Several of the more frequently
recalled advertisements were relatively old
and have been telecasted longer than the
campaign period, which may have had an
effect on recall.
spacing), ‘Holi/Colorful Moments’ (on IUCD),
‘Pragati on Medical Tour’ (NRHM/health
services) and ‘Ek Savera Ek Akash’ (NRHM/
health services). For more detailed breakdown
of exposure according to geographical area
and gender, please refer to Annexure 5.
Among the seven new spots used in the
NRHM phase II campaign, the creative
advertisement with ‘Radheyshyam ki
Motorcycle’ (on newborn care) had the
maximum reach among both women and
men. Recall was lower for the other new
spots—‘Mehendi occasion’ (on FP/birth
4.2 EXPOSURE TO NRHM RADIO
SPOTS AMONG WOMEN AND MEN
Figure 4.8 depicts the reach of radio spots
among all women contacted for the study as
well as women who were exposed to radio
during the NRHM Phase II campaign period.
19

4.4 Page 34

▲back to top


A Concurrent Evaluation of Phase II of the NRHM BCC Campaign
not manage to reach urban areas and other
states as effectively.
Of the women who had been exposed to radio
during the campaign, 62 percent had heard
at least one of the radio spots. Although radio
has significant reach in high focus states and
in rural areas, we see that the campaign did
The exposure to any NRHM radio spot among
men exposed to radio during the campaign
period is presented in Figure 4.9. Among
all the men contacted in the study, reach of
radio spots was only 23 percent. Of those
men who had been exposed to radio during
the campaign, 60 percent had heard at least
one radio spot during the NRHM campaign
period. As observed for women, in case of
men also, respondents listening to any radio
spot were also from high focus states and
rural areas.
Figure 4.8: Exposure to any NRHM radio spot among women who listened to radio during the
campaign period
100
80
60
40
20
0
National
High Focus
Other States
Rural
Urban
Figure 4.9: Exposure to any NRHM radio spot among men who listened to radio during the
campaign period
100
80
60
40
20
0
National
High Focus
Other States
Rural
Urban
All Respondents
Exposed to TV
20

4.5 Page 35

▲back to top


Exposure of Target Groups to NRHM Television and Radio Campaign Spots
Perceptions of
Policymakers on
Print Media
The print media campaign was
designed to create a positive image
of the program (NRHM) among
the general public as well as the
policymakers. The respondents for
the print campaign were mainly
policymakers and program managers
in the health sector, including State
level Health Secretaries, State RCH
Officers, NRHM Directors, District
Collector, CMO, Medical Officers,
CDPO and LHVs.
The NRHM print campaign
comprised about 11 print ads on
various issues namely JSY, Rogi
Kalyan Samiti (RKS), VHSC, VHND,
age of marriage, pregnancy and
ASHAs. Four of these ads were
published in the leading local
newspapers during the NRHM media
campaign.
Most of the officials had not seen the ads. Exposure was found to be the lowest among block
level officials as compared to those at the district as well as state level.
In order to achieve the maximum impact, policymakers and program managers who did see the
ads have given following suggestions for future campaigns:
• Region specific photographs should be used in the ads for maximum attention.
• Photographs of politicians should be avoided as it is not very effective in grabbing the
attention of the target group and often get confused with political campaigns.
• Difficult terminology should be discouraged as these words will not be comprehended by the
general public.
• Involve state specific people in translating ads into local languages and choosing appropriate
newspaper for advertisement will be more useful.
• Contributions of local health facilities should be highlighted.
21

4.6 Page 36

▲back to top


A Concurrent Evaluation of Phase II of the NRHM BCC Campaign
4.2.1 Exposure to Specific Radio Spots
Among all the radio spots used in the
campaign, the spot ‘Conversation of a Village
Woman with ASHA’ (on issues relating
to ANC/institutional delivery) had the
maximum reach among women (36%). The
spot with a ‘Jingle Jagmag’ (on institutional
delivery) was recalled by 19 percent of the
women, while a similar proportion (18%)
was exposed to the spot ‘Pragati talking to
Papa’ (on VHNDs). The radio spots ‘Holi
song’ (on Copper-T), ‘Mehendi song’ (on
birth spacing) and ‘Journalist Khushi’ (on
institutional delivery/JSY) were heard by
11 percent to 13 percent women. The spot
‘Pragati talking to Friends’ (on NRHM/health
services) had negligible reach (5%) among
the women.
The spots ‘Conversation of a Village Woman
with ASHA’, ‘Jingle Jagmag’ and ‘Mehendi
song’ were mostly listened by women in high
focus states and in rural areas whereas the
spot ‘Pragati talking to Papa’ was
mostly reported by women in other states.
Among men also, the spot ‘Conversation of a
Village Woman with ASHA’ had the maximum
reach (25%). This was followed by the spots
‘Pragati talking to Papa’ (16%), ‘Journalist
Khushi’ (16%) and ‘Jingle Jagmag’ (15%).
The radio spots ‘Holi song’, ‘Mehendi song’
and ‘Pragati talking to Friends’ was listened
by 10 percent, eight percent and six percent
of the men respectively. As in the case of
women, the exposure among women to the
spots ‘Conversation of a Village Woman with
ASHA’, ‘Jingle Jagmag’ and ‘Mehendi song’
was significantly higher in high focus than in
other states.
4.3 EXPOSURE TO TV AND RADIO
SPOTS AMONG FATHERS/MOTHERS-
IN-LAW AND VILLAGE LEVEL
FUNCTIONARIES
Over half of the fathers and mothers-in-law of
women aged 15-29 years who had exposure to
TV had seen any TV spot during the campaign
period. The spot with maximum reach among
fathers and mothers-in-law was ‘Age of
Marriage’ (23%), followed by ‘Radheyshyam ki
Motorcycle’ (18%) and ‘Train’ (16%). The spots
– ‘Crystal Ball’, ‘Juhi Chawla on Immunization’,
‘Nutrition/Breastfeeding’, ‘Sachin & Supriya
(ANC)’ and ‘Juhi Chawla on ANC’ were
viewed by 10 to 13 percent of the fathers and
mothers-in-law. Few in-laws recalled seeing
‘Holi/Colorful Moments’, ‘Sachin & Supriya
on Family Planning’, ‘Pragati on Medical Tour’,
‘Ek Savera Ek Akash’ and ‘Mona Singh on
Immunization.’
Most of the village functionaries (85%)
contacted for the study had seen one or more
TV spot during the campaign period. The
most frequently watched TV spots among
the village functionaries were ‘The Train’ on
OCP (35%), ‘Age of Marriage’ (34%), ‘Crystal
Ball’ (32%), ‘Juhi Chawla on Immunization’
(30%), ‘Radheyshyam ki Motorcycle’ (26%)
and ‘Jagmag’ (25%). The spot ‘Ek Savera Ek
Akash’ had the lowest reach among the village
functionaries (7%).
The exposure of fathers and mothers-in-law
and village functionaries to radio spots was
quite limited. Only 13 percent of the fathers
and mothers-in-law and 15 percent of the
village functionaries heard any radio spot
broadcast during this BCC campaign period.
22

4.7 Page 37

▲back to top


Chapter 5
Recall, Comprehension,
Appeal and Impact of Television Spots
The present chapter aims to gain an insight
into the recall, comprehension, appeal
and impact, as indicated by intent to act,
of specific TV spots, which respondents
have been exposed to during the NRHM
Phase II campaign period. For each TV
spot, respondents were asked about the
messages, first spontaneously, and then by
prompting. Prompting was done by showing
story boards and narrating key elements of
the TV spot. Thereafter, aspects of the TV
spot that appealed to the respondents and
difficulties encountered in understanding
them were discussed. Each TV spot was
explored in this manner one after another.
Annexures 6-22 have detailed responses
for each advertisement in terms of recall,
comprehension, appeal and intent to act.
5.1 RECALL OF THE TV SPOTS’
MESSAGES
Recall is defined as the ability to remember
one or more key messages from any of the
TV spots. For men, the highest spontaneous
recall for any message was for the ‘Age of
Marriage’ spot where 83.5 percent of those
who saw the ad recalled the message ‘get
your daughter married only after the age of
18 years.’ The lowest spontaneously recalled
message was in the spot ‘Pragati on Medical
Tour’ where five percent men recalled the
message ‘due to increased funds, people
themselves take decisions to fulfill local needs
by forming RKS and VHSCs.
Of the seven new advertisements launched in
this campaign, ‘Radheyshyam ki Motorcycle’
was the TV spot that resulted in the most
recall. The message on keeping a newborn
with their mother was recalled by 43.8
percent women and 48.4 percent men and the
message on initiating breastfeeding soon after
birth was recalled by 38.9 percent of women
and 47 percent of men.
Respondents were also asked if they had
ever received these messages before
from other sources. Interestingly, the
ASHA, ANM and AWW are the primary
alternative sources of such messaging.
This evidence highlights the importance
of ASHA, ANM, and AWW in disseminating
NRHM guided messages. For more effective
subsequent NRHM BCC campaigns, it
would be important to explore how these
frontline workers can be integrated into the
campaign strategy by reinforcing messages
individuals are seeing on TV or hearing
through the radio.
5.2 COMPREHENSION OF THE
TV SPOTS
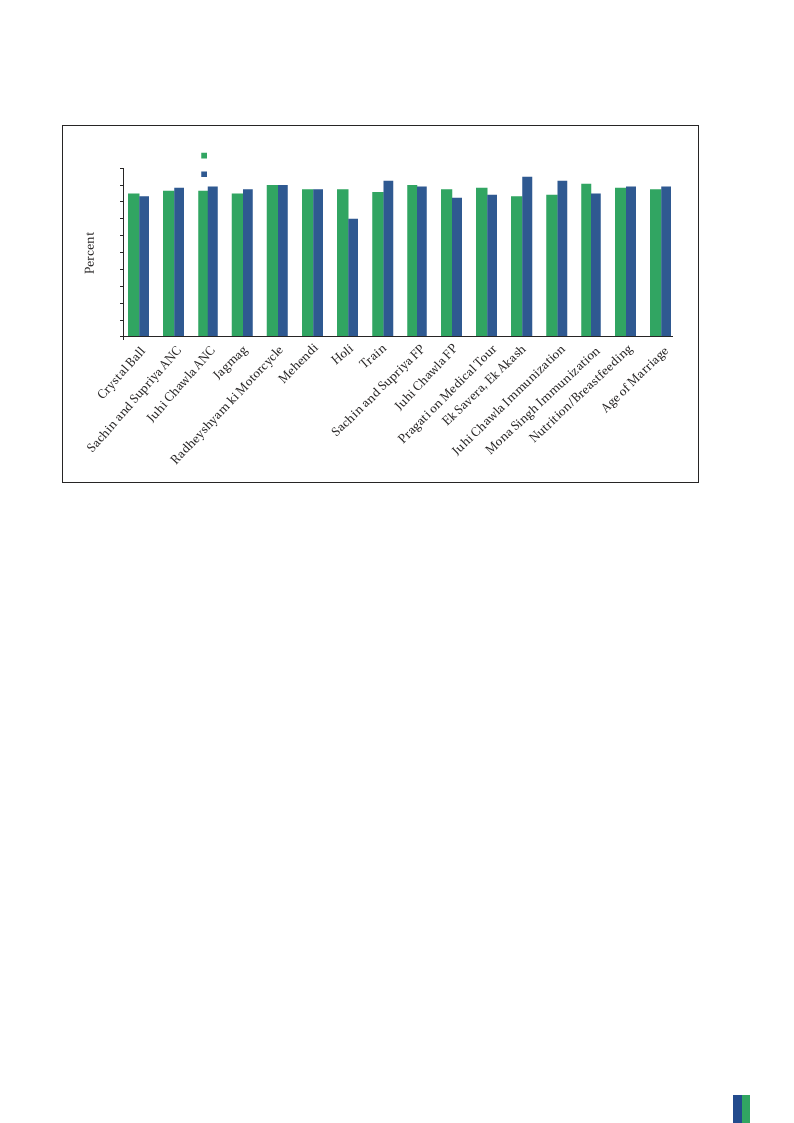
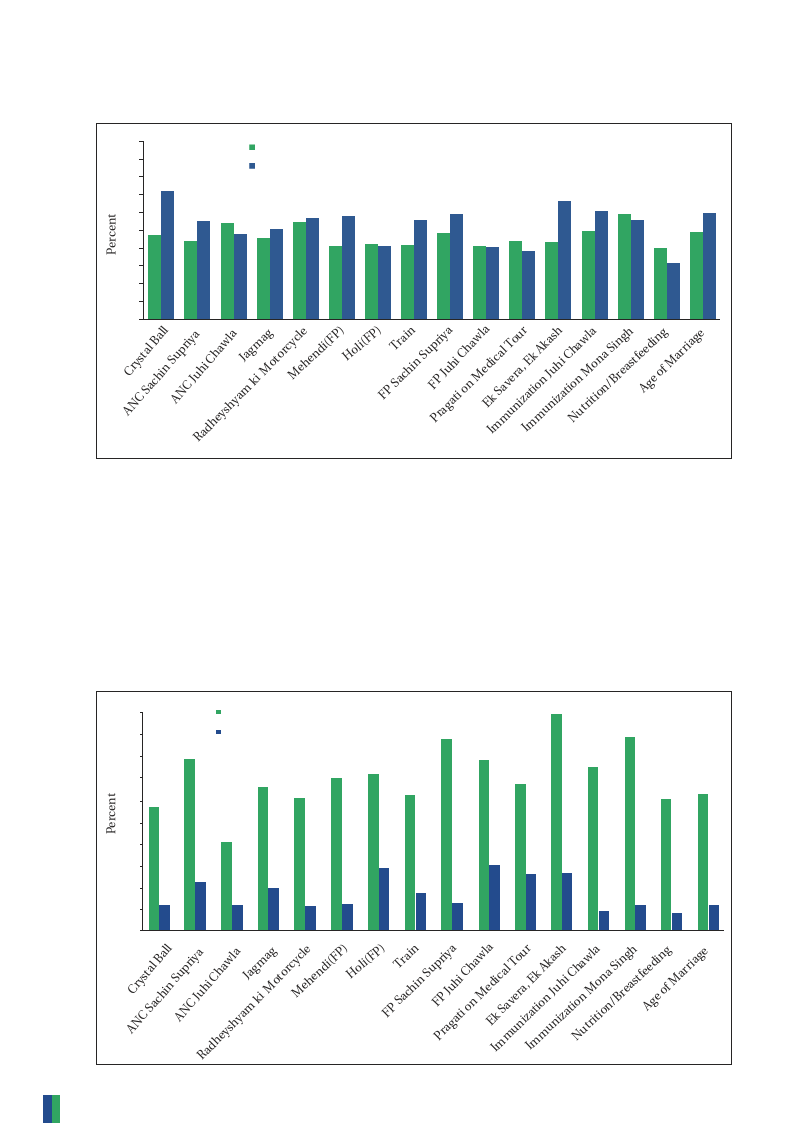
Overall, the most understood advertisements
were ‘The Train’ and the nutrition and
breastfeeding ad, ‘Badhte Shishu.’ The spot
that appeared to have the most gender
differential in understanding was the family
planning spot titled ‘Holi’, where the women
who were exposed to the ad seemed to
understand it far better than the men who
saw the spot.
Several of the spots were found to be
difficult to understand by a minority of
respondents. Overall, 4.3-15.3 percent of
respondents faced some difficulties in
understanding the spots. Fifteen percent of
women struggled the most in understanding
the ‘Ek savera, Ek Akash’ TV spot on NRHM
primarily because of ‘language’ (85.2%) and
23

4.8 Page 38

▲back to top


A Concurrent Evaluation of Phase II of the NRHM BCC Campaign
the ‘message being too fast’ (14.1%). Men
had the most difficulty in understanding
the ‘Holi’ spot on family planning. One
in ten men found these ads difficult to
understand: Sachin Supriya (ANC), Juhi
Chawla (ANC), ‘Radheyshyam ki Motorcycle’
(NBC), Crystal Ball (ANC), Mehendi (FP),
Ek Savera Ek Akash (NRHM), Juhi Chawla
(FP) and Juhi Chawla (Immunization).
Of the few who had difficulties, the main
problems identified were: language; messages
too fast; and difficult wordings. A vast
majority of those reporting these difficulties
were from other states, where Hindi may
not be the local language, signaling the
importance of regional campaigns, if regional
impact is desired.
Interestingly, there was only a few
percentage of people who reported having
difficulty in understanding the campaign
spots and thus, we can also conclude that
Hindi is an appropriate language choice for
any national campaign.
5.3 APPEAL OF THE TV SPOTS
The evaluation asked both men and women
about whether they liked the TV spots.
Most of the respondents (70-95%) liked the
spots they were exposed to. The favorite TV
spot among men was ‘Ek Savera, Ek Akash’
with 95.2 percent of men liking the ad
followed by the ad on immunization by Juhi
Chawla which 93 percent of male viewers
liked. Women respondents’ favorite spots
were ‘Mona Singh’ (Immunization) and
‘Radheyshyam ki Motorcycle’ and Sachin
Supriya (Family Planning).
‘Message conveyed’ was the primary reason
for liking the spot the respondent saw.
Other aspects that were appreciated were
clarity of message, characters, storyline and
presentation style.
Interestingly, new creative spots like
‘Radheyshyam ki Motorcycle’ (NBC), were
often as appealing as some of the older
celebrity endorsed advertisements like Juhi
Chawla (ANC).
Figure 5.1: Understanding of TV spots
100
Women Men
90
80
70
60
50
40
30
20
10
0
Mehendi(FP)Holi(FP)
FP
Train
Sachin
Supriya
EkISmamveuran,iIEzmaktimAoknuansJuhizhaitiCNohnuatMwriltoainona/SBinregahstfeAegdeinogf Marriage
24

4.9 Page 39

▲back to top


Recall, Comprehension, Appeal and Impact of Television Spots
Figure 5.2: Appeal of TV spots
Women
100
Men
90
80
70
60
50
40
30
20
10
0
Jagmag
HSaoclhi inTarnadinSupriya FP
EkJSuahvieCrah,aEMwkloaAnIkamaSsmihnugnhNizuImatrtmiiotinuonni/zBarteiaosntfeAegdeinofgMarriage
5.4 IMPACT OF THE TV SPOTS:
INTENT TO TAKE ACTION
Keeping in view the short duration of the
campaign as well as the large number of issues
covered under the campaign, immediate
change in behavior was not expected as a
result of the campaign. However, an attempt
has been made to assess the impact in terms
of intended actions of the target groups as
indicators of movement towards behavior
change following their exposure to various TV
spots. This section presents the overall findings
on the actions that the women and men intend
to take after watching specific TV spots.
There was some intent to take action after
reviewing the TV spots. Of all respondents,
32-72 percent of men and 40-60 percent of
women intend to take action. The types of
actions that respondents plan to take are:
Discuss with spouses, other family
members, friends and relatives
Seek services
Follow the practices based on messages
in the spots.
Some spots were clearly more effective in
increasing intent to take action among both
women and men. For example, the ‘Crystal
Ball’ spot on ANC resulted in a significant
percentage of women intending to obtain
‘2 TT injections during pregnancy’ (48%)
and or ‘consume 100 IFA tablets during
pregnancy’ (38%) followed by ‘discussion
with friends/relatives’ (38%). Men stated
that they would ‘encourage their spouse to
go for 2 TT injections during pregnancy’
(65%) and ‘encourage spouse for 100 IFA
tablets during pregnancy’ (61%). The
‘Radheyshyam ki Motorcycle’ on newborn
care was also a spot that was successful in
stimulating an intent for women to ‘discuss
with family/relatives (43%)’ or ‘discuss with
spouse (36%)’.
25

4.10 Page 40

▲back to top


A Concurrent Evaluation of Phase II of the NRHM BCC Campaign
Figure 5.3: Intent to take action after watching TV spots
100
Women
90
Men
80
70
60
50
40
30
20
10
0
Jagmag
Mehendi(FP)
Holi(FP)
FP
Train
Sachin
Supriya
Pragati
on
MedIimcaml TuonuizrIamtiomnuJnuihzai tCiNohnauwtMrliatoinona/SBinregahstfeAegdeinogf
Marriage
5.5 MESSAGE RECALL, APPEAL,
COMPREHENSION AND IMPACT
AMONG FATHERS/MOTHERS-IN-LAW
A majority of the fathers and mothers-in-
law exposed to different TV spots could
only recall the messages on various spots
after prompting. Impressive gains in new
knowledge were reported by fathers and
mothers-in-law from the following spots:
‘Ek Savera, Ek Akash’ (100%); ‘Mona Singh’
(immunization) (88%); ‘Sachin and
Supriya’ (FP) (87%); ‘Sachin and Supriya’
(ANC) (77%); ’Juhi Chawla’ (FP) (77%) and
Figure 5.4: New things learnt and difficulties encountered by fathers/mothers-in-law in
various TV spots
100
90
18000
790
6800 56
70
50
60
4500
340
2300
1200 12
10
00
77
23
% learnt new things
% faced difficulties
100
87
88
Women 70 71
6M5 en 60
62
77
67
74
61 62
41
29
31 27 27
20
13
12 13
18
13
10 13
9
12
Jagmag
Mehendi(FP)
Holi(FP)
FP
Train
Sachin
Supriya
Pragati
on
MedIimcaml TuonuizrIamtiomnuJnuihzai tCiNohnauwtMrliatoinona/SBinregahstfeAegdeinogf
Marriage
26

5 Pages 41-50

▲back to top


5.1 Page 41

▲back to top


Recall, Comprehension, Appeal and Impact of Television Spots
FEEDBACK ON THE NEW TV SPOTS
The campaign introduced seven new TV spots: Crystal Ball, Jagmag, Radheyshyam ki
Motorcycle, Mehendi, Holi, Pragati on Medical Tour and Ek Savera, Ek Akash. The following
tables provide an overview of the three most popular new TV spots for men and women.
The Motorcycle on Newborn Care, Crystal Ball for ANC, and Jagmag for ANC were the most
liked spots.
Table 5.1: Popularity of new TV spots: Top three among women
Radheyshyam
ki Motorcycle-
newborn care
Crystal Ball-
ANC
Jagmag- ANC
Most recalled
messages
Keep newborn
with mother: 44%
Initiate
breastfeeding
soon after birth:
39%
Take iron tablet
for 100 days: 48%
Administer 2
doses of TT
injection: 46%
Delivering at
hospital is a right
decision: 42%
Give TT & tablets
at right time:
37.8%
Top three aspects liked Top three intended
actions
Message conveyed:
Discuss with friends/
91%
relatives: 43%
Clarity of message:
Discuss with spouse/
88%
family members: 36%
Presentation style: 85% Keep newborn child
with mother: 35%
Message conveyed:
Administer 2 TT shots
91%
during pregnancy: 48%
Clarity of message:
Consume 100 IFA
85%
during pregnancy: 38%
Storyline, presentation Discuss with friends/
& characters: 83% each relatives: 38%
Message conveyed:
Administer TT during
87%
pregnancy: 40%
Music: 82%
Discuss with friends/
Storyline & clarity of
relatives: 40%
message: 81% each
Consult with ASHA/
ANM: 30%
Table 5.2: Popularity of new TV spots: Top three among men
Most recalled
messages
Top three aspects Top three intended actions
liked
Radheyshyam Keep newborn Message
Encourage others to keep new
ki Motorcycle- with mother: 48% conveyed: 92% born child with mother: 44%
newborn care Initiate
breastfeeding
Presentation Consult ASHA: 46%
style: 88%
Discuss with spouse/family
immediately after Storyline: 87%
birth: 47%
members: 40%
Jagmag- ANC
Delivering at
hospital is a right
decision: 47%
Keep in mind to
Message
Encourage spouse for getting TT
conveyed: 91% during pregnancy: 51%
Presentation Deliver the child in hospital:
style & Music: 43%
take tablets at
right time: 47%
88% each
Consult with ASHA/ANM: 40%
Crystal Ball-
ANC
Iron tablet should Message
Encourage spouse for 2 TT shots
be taken for 100
conveyed: 87% during pregnancy: 65%
days: 53%
Clarity of
Encourage spouse for taking 100
Check-up should
message: 82%
IFA tablets during pregnancy:
be done in health Characters:
centre: 45%
81%
61%
Consult health center during
pregnancy of spouse: 41%
27

5.2 Page 42

▲back to top


A Concurrent Evaluation of Phase II of the NRHM BCC Campaign
‘Juhi Chawla’ (immunization) (74%); ‘Holi/
Colorful Moments’ (71%); and ‘Mehendi’
(70%). As compared to men and women, the
proportion of fathers and mothers-in-law
reporting difficulties in understanding the
messages was much higher.
The impact of spots on fathers and mothers-
in-law was assessed by asking them whether
the ads had triggered any discussions with
others and whether they tried/intended to
gather more information after watching the
spot. The findings are presented in Figure 5.5
Over two-thirds of the fathers and mothers-
in-law exposed to the Sachin and Supriya
ANC spot and three-fifths of those exposed
to the Sachin and Supriya family planning
spot discussed the contents of the spot
with someone. Over half of the fathers and
mothers-in-law seeing the Crystal Ball spot
discussed the messages with someone. For
other spots, with the exception of Mehendi
and Pragati on Medical Tour , the proportion
of respondents reporting discussing the spot
with someone after viewing varied between
38 percent and 47 percent.
Among the fathers and mothers-in-law who
had seen the ‘Radheyshyam ki Motorcycle’
spot, 72 percent reported that they tried/
intended to gather more information and 70
percent of those seeing the ‘Age of Marriage’
spot did so. Over half (58 to 63%) of the
fathers and mothers-in-law seeing the
Sachin and Supriya ANC spot, the Sachin
and Supriya family planning spot, the Mona
Singh Immunization spot and the Nutrition/
Breastfeeding spot tried/intended to gather
more information about the topic.
5.6 MESSAGE RECALL, APPEAL AND
COMPREHENSION AMONG VILLAGE
FUNCTIONARIES
Among all the respondent categories,
spontaneous message recall of various
TV spots was the best among the
village functionaries. Most of the village
functionaries (81 to 94%) liked the TV spots
watched by them. Message comprehension
was reportedly high, with only a marginal
proportion of village functionaries citing
difficulties in comprehension. (Table 5.3)
Figure 5.5: Percentage distribution of fathers/mothers-in-law by actions taken/intended after
viewing TV spots
110000
9900
8800
7700
6600
5500
4400
3300
2200
1100
00
Women
Men
% discussed the messages with anyone
% tried/intend to gather more information
Jagmag
Mehendi(FP)
Holi(FP)
FP
Train
Sachin
Supriya
Pragati
on
MedIimcaml TuonuizrIamtiomnuJnuihzai tCiNohnauwtMrliatoinona/SBinregahstfeAegdeinogf
Marriage
28

5.3 Page 43

▲back to top


Recall, Comprehension, Appeal and Impact of Television Spots
Table 5.3: Messages liked and difficulties encountered by village functionaries in various
TV spots
TV spots
Crystal Ball
ANC Sachin and Supriya
ANC Juhi Chawla
Jagmag
Radheyshyam ki Motorcycle
FP Mehendi
FP Holi/Colorful Moments
FP Train
FP Sachin and Supriya
FP Juhi Chawla
Pragati on Medical Tour
Ek Savera Ek Akash
Imm. Juhi Chawla
Imm. Mona Singh
Nutrition/Breastfeeding
Age of Marriage
% liked the TV spots
91
82.4
85.5
83.7
86.8
88.8
93.5
91.2
81.4
89.2
82.7
90.9
92.6
92.6
85.8
91.2
% faced difficulties
7.9
5.9
3.6
8.8
6.5
9.5
2.6
5.8
8.6
5.9
5.3
6.8
3.4
1.5
-
6.1
5.7 POLICYMAKERS AND PROGRAM
MANAGERS’ VIEWS ON THE TV AND
RADIO CAMPAIGN
Though the main thrust of the discussions
with policymakers and program managers
remained on the NRHM print media
campaign, their opinions regarding the TV
and radio campaign were also solicited in
these discussions.
to office… usually news… “- District
level official
Those officials who were exposed to TV
or radio were unable to recall the exact
messages of these spots. Their reasoning for
this was that since they work on the same
issues, it becomes difficult to remember
what they saw where as described by the
following quote aptly:
The interaction with these officials regarding
the TV and radio campaign presented an
abysmal picture about exposure. This was
largely attributed by these officials to the
lack of time to watch TV and or listen to the
radio due to their busy schedule. Officials
commonly stated:
“Where is the time madam? Yesterday we
went home at 10 in the night from here (his
office), work keeps us so busy that we have
no time for family… and you are talking
about TV? I listen to radio only while coming
“We are working in this area (NRHM) day
in, day out… we ourselves develop these
IEC materials… so we can’t tell you which
messages we came across in which spot… these
messages are for the common man… those
who hear these messages on radio or watch on
TV or read in a newspaper once or twice a day
will remember…”- District level IEC official
Officials who reported exposure to social
messages on TV or radio largely recall spots
on HIV/AIDS and polio which are more
frequently aired.
29

5.4 Page 44

▲back to top


Chapter 6
Recall, Comprehension
Appeal and Impact of Radio Spots
The present chapter aims to gain an insight
into the recall, comprehension, appeal and
impact, measured by intent to act, of specific
radio spots among women and men. In order
to analyze the recall of messages, respondents
who heard the campaign radio spots were
probed to recall the specific messages they
had heard during the period of the campaign.
For each radio spot, respondents were asked
about the messages, first spontaneously,
and then if needed, by prompting (playing
a portion of the spot on a tape recorder).
Respondents were then asked about the
appeal of the spot along with any difficulties
encountered in understanding the radio spot.
The following sections highlight message recall,
comprehension, appeal and impact of the radio
spots. For more details on each of the spots,
refer to Annexures 22-28.
6.1 RECALL OF RADIO SPOTS
Spontaneous recall of messages among those
exposed to radio spots varied between one
percent and 61 percent. After prompting, the
recall increased from 69 to 100 percent for
the various spots. Overall recall was relatively
better in high focus states rather than in
other states.
For women, the message with the highest
spontaneous recall (61%) was ‘the birth of
every child should take place in a hospital’
from the ‘Journalist Khushi’ radio spot.
For men, the highest (56.4%) spontaneous
recalled message was ‘Deliver the child only
at the hospital’, also from the ‘Journalist
Khushi’ spot.
The key message spontaneously recalled
least was the same for both women and men
but from different radio spots. The message
“NRHM – because a healthy nation starts with
a healthy family – with you” was least recalled
by women in the ‘Pragati talking to Friends’
spot (1%) and by men in the ‘conversation
with ASHA’ (2%).
6.2 COMPREHENSION OF THE
RADIO SPOT
Comprehension is measured by ease or
difficulty in understanding of the radio
spot. Overall, difficulty in understanding
radio spots ranged between 4 percent and
22 percent. Language and speed of message
delivery were some of difficulties encountered
by listeners. The spot most difficult (22%)
to understand for both women and men
was ‘Pragati talking to Papa.’ Language and
pace of message were cited as the biggest
impediments to understanding. However, this
was noticed predominantly in other states.
6.3 APPEAL OF THE RADIO SPOT
Overall, 73 to 90 percent of respondents found
the radio spots appealing. The favorite spot
among women was ‘Conversation with ASHA’,
where 85 percent of those who heard the spot
enjoyed it. The most appealing spot for male
respondents was ‘Jingle/Song’ (90%). The
aspect most appreciated in the ads was ‘the
message conveyed.’ This finding reiterates the
importance of ASHA and incorporating her
role as an interpersonal communicator in any
campaign strategy by getting her to reinforce
radio messages.
The spots with the least appeal were
‘Pragati talking to Papa’(73%) for women
and the ‘Holi song’(74%) spot for men.
30

5.5 Page 45

▲back to top


Recall, Comprehension Appeal and Impact of Radio Spots
Figure 6.1: Men/Women who did not have any difficulties in understanding radio spots
100
80
60
40
20
0
Pragati talking Conversation
to Papa
with ASHA
Khushi
Jingle/Song Holi Song
Mehendi Pragati talking
Song
to friends
Men Women
Note: Base: Respondents watched the Radio Spots
This shows that although spots target both
genders equally, some have greater appeal to
one gender.
6.4 INTENT TO TAKE ACTION AFTER
LISTENING TO RADIO SPOTS
As was the case with TV spots, the short
duration of the campaign means that it
is highly unlikely that there will be any
immediate behavior change as a direct result
of this campaign. An attempt has been made
to assess the impact in terms of intended
actions of the target groups as markers of
movement towards behavior change following
their exposure to various TV spots. The intent
to act for those who heard a radio spot ranged
from 23 to 74 percent.
For men, the spot ‘Holi Song’ resulted in
the largest (74%) intent to take action. For
women, the spot ‘Conversation with ASHA’
resulted in the largest (58%) intent to take
action. For women, the spot ‘Holi Song’
spurred the least (23%) intent to take action.
For men, the spot ‘Jingle/Songs’ was least
Figure 6.2: Radio spots liked by respondents
100
90
80
70
60
50
40
30
20
10
0
Pragati Coversation
talking to
Papa
with ASHA
Khushi Jingle/Song Holi Song
Women Men
Mehendi
Song
Pragati
talking to
Friends
31

5.6 Page 46

▲back to top


A Concurrent Evaluation of Phase II of the NRHM BCC Campaign
Figure 6.3: Intends to take action after listening to radio spots
100
90
80
70
60
50
40
30
20
10
0
Pragati talking
to Papa
Coversation
with ASHA
Khushi
Jingle/Song Holi Song Mehendi Pragati talking
Song
to Friends
Women Men
(37%) likely to result in any intent to take
action. Both women and men had expressed
their intention to interact with ASHA and
also with their friends and relatives. They
have also expressed more desire to access
the services like institutional delivery and
family planning.
Compared to other states, a significantly
higher proportion of women in high focus
states reportedly acquired knowledge about
JSY (high focus 42%, other states 16%), ASHA
(high focus 33%, other states 23%), and
immunization of mothers (high focus 27%,
other states 13%).
6.5 IMPACT OF THE RADIO
CAMPAIGN IN PROMOTING
KNOWLEDGE ON NRHM/HEALTH
SERVICES
All women and men who had listened to
any radio spot were asked, “Has the NRHM
radio campaign, in any way, increased your
knowledge about various NRHM/health
services offered at Government health
facilities?” The respondents, who affirmed
that the radio campaign had increased their
knowledge about various NRHM/health
services, were further asked to mention the
type of services on which they acquired more
knowledge. Over two-fifths of the women
exposed to any radio spot reported that they
had acquired knowledge on NRHM/health
services as a result of the radio campaign.
Respondents reported that they acquired
information on JSY (38%), antenatal care
(34%), ASHA (31%), child immunization
(31%), family planning/birth spacing (28%)
and immunization of mothers (25%) as a
result of listening to the radio campaign.
Overall, 39 percent of men exposed to any
radio spot reported that they acquired
knowledge on NRHM/health services
due to the radio campaign. Many gained
knowledge on child immunization (42%),
antenatal care (39%), institutional delivery
(33%), JSY (32%) and family planning/birth
spacing (24%). Acquiring knowledge on
antenatal care, institutional delivery and JSY
was mentioned mostly by the respondents
in high focus states.
6.6 MESSAGE RECALL,
COMPREHENSION AND APPEAL OF
RADIO SPOTS AMONG FATHERS AND
MOTHERS-IN-LAW
The majority of fathers and mothers-in-law
who listened to different radio spots could
only recall the messages after prompting.
Between 70 percent and 78 percent of the
fathers and mothers-in-law who heard
the radio spots, ‘Pragati talking to Papa’,
‘Conversation with ASHA’, ‘Journalist Khushi’
and ‘Jingle Jagmag’, reported that they learned
32

5.7 Page 47

▲back to top


Recall, Comprehension Appeal and Impact of Radio Spots
Figure 6.4: Mothers/Fathers-in-law appeal and comprehension
100
90
80
70
60
50
40
30
20
10
0
Pragati Conversation Journalist Jingle Jagmag Holi song Mehendi
talking to with ASHA
Khushi
song
papa
Pragati talking
to friends
% learnt new things % faced difficulties
something new from these radio spots.
Fathers and mothers-in-law reported having
learned the most from the ‘Pragati talking to
Papa’(78%) and learned the least from the
spot, ‘Mehendi’(36%).
‘Pragati talking to Papa’, ‘Journalist Khushi’
and ‘Conversation with ASHA’ discussed
the content of the spots with someone. This
was lower for ‘Holi song’ (17%) and ‘Pragati
talking to Friends’ (22%).
None of the fathers/mothers-in-law who
listened to the radio spots, ‘Journalist
Khushi’, ‘Jingle Jagmag’, ‘Mehendi song’
and ‘Pragati talking to Friends’, faced any
difficulty in understanding the messages
given in the spots. A few encountered
problems in understanding the messages
given in the spots, ‘Pragati talking to Papa’
(11%), ‘Conversation with ASHA’ (11%) and
‘Holi song (8%).’
6.7 IMPACT OF THE RADIO
CAMPAIGN ON FATHERS/
MOTHERS-IN-LAW
Among the fathers and mothers-in-law
who had heard ‘Jingle Jagmag’, 82 percent
reported that they tried to/intended
to gather more information about the
spot as did 73 percent of those hearing
‘Mehendi song.’ The corresponding
proportion varied between 33 and 82
percent for other spots.
6.8 MESSAGE RECALL,
COMPREHENSION AND APPEAL
OF RADIO SPOTS AMONG VILLAGE
FUNCTIONARIES
The impact of the radio spots on fathers
and mothers-in-law was assessed by asking
them whether the spots had triggered any
discussions with others and whether they
tried/intended to gather more information
after hearing the spot. Thirty-five to
forty-seven percent of the fathers and
mothers-in-law exposed to ‘Jingle Jagmag’,
Most of the messages given in various
radio spots were recalled by the village
functionaries, although the majority of them
could be recalled only after prompting.
Almost all the village functionaries liked
the radio spots heard. In general, the village
functionaries did not face any difficulty
in understanding the messages given in
various radio spots.
33

5.8 Page 48

▲back to top


Chapter 7
Conclusions and Recommendations
The conclusions and recommendations
drawn from the findings of this evaluation are
presented in this chapter.
7.1 REACH/VISIBILITY AND
EXPOSURE TO THE CAMPAIGN
Reach of combined TV and radio is extensive
with 86 percent of the women, 82 percent of
the men and 46 percent of the fathers and
mothers-in-law having watched television or
listened to radio during the campaign period.
TV had the greatest reach among all target
audiences even in rural areas. The overall
findings indicate that the campaign had
reached the intended audience to a
large extent.
Among those exposed to TV, the vast
majority of women and men had seen at
least one NRHM TV spot during Phase II of
the campaign period. More than one fifth of
women and 15 percent men had seen four or
more of the total 16 TV spots, indicating good
visibility of the spots broadcast.
The exposure of TV spots among mothers-
in-law and fathers-in-law was much higher
(56%) than that of radio spots (13%).
Though overall radio listenership is lower
than TV viewership, radio is still a significant
medium of health messaging, especially in
rural areas.
and five spots on ANC/institutional delivery
as against one to two spots covering the other
themes. This suggests that a greater number
of spots on a single theme will result in greater
recall. This, however, needs to be confirmed
against data on the airing frequency of each
particular spot and each theme.
Among the 16 TV spots, the ‘Train’ spot
(contraceptive pills) had the highest recall
followed by ‘Age of Marriage’, ‘Juhi Chawla
on Immunization’ and ‘Radheyshyam ki
Motorcycle’ (newborn care). Of the seven
radio spots aired, ‘Conversation of a Village
Woman with ASHA’ on issues relating to
ANC/institutional delivery had the maximum
recall among both women and men.
Respondents appreciated the characters,
storyline and creative nature of the spots.
Spontaneous recall of TV spot messages
ranged between 20 and 45 percent and
between 25 and 50 percent for the radio
spots. With the inclusion of prompting,
the recall was as high as 70 to 100 percent
for both TV and radio spots. This indicates
that the frequency of airing the spots and,
hence, the opportunity to see (OTS) or hear
was adequate to get the messages across.
However, an in-depth analysis on the
exposure versus the channels and programs
mostly viewed/heard by the respondents
would reveal whether the media plan was
cost-effective.
7.2 RECALL, COMPREHENSION AND
APPEAL OF THEME/SPECIFIC SPOTS
Overall, the recall of ANC/institutional
delivery and birth spacing/family planning
spots was higher than other themes among
both women and men. This may be a result of
more spots on these themes – there were four
Most respondents found the spots they were
exposed to appealing. Only a few reported
some difficulties in understanding the
spots, with language being the main barrier.
A majority of those who reported difficulties
in language were from other states (where
Hindi is not the major language spoken).
However, the positive aspect is that, in spite
34

5.9 Page 49

▲back to top


Conclusions and Recommendations
of the language in the spots being Hindi,
the spots were understood and liked by a
majority of the respondents even from
other states.
A significant proportion of respondents
reported that they intend to take some
action as a result of the campaign. These
intentions are indicative of a movement
towards behavior change and signify that
the spots are having their desired effects
of moving the audience forward in the
behavior change continuum.
The fact that 40-60 percent of mothers-in-
law discussed the content of the spots with
their daughters-in-law, and between 35 and
55 percent tried to gather more information
on the messages in the spots, are remarkable
immediate outcomes of the spots.
Among all the respondent categories,
message recall of various TV spots was the
best among the village functionaries and
health workers. While there could be a
certain amount of knowledge bias here, the
fact that they do remember the messages
provides a tremendous potential to be
tapped.
7.3 PERCEPTIONS OF POLICY
MAKERS AND PROGRAM MANAGERS
Policy makers and program managers were
able to recall the print advertisements after
aiding with showing hard copies of the
ads. Common perceptions, opinions and
suggestions expressed were as follows:
Messages in the print media should
be clear at a glance and should avoid
‘information overload’ and difficult
words/jargon.
Photographs used in the ads should have
regional flavour for maximum attention.
Involvement of states in such campaigns
was strongly recommended as it can not
only help in proper translation as well as
reach of these messages through popular
local papers, but also their penetration at
district level and below.
7.4 KEY RECOMMENDATIONS FOR
THE COMMUNICATION STRATEGY
AND NEXT STEPS
The following recommendations emerged
from the study:
The study provides details on the viewing
habits, preferred timings, channels and
programs for both TV and radio. These
can form the basis for the selection
of channels and programs for future
campaigns.
The mass media strategy could also take
into account the rural-urban and other
differentials in reach of media as also the
preference of channels etc., for strategic
placement of spots relevant to particular
audience segments.
Media plans to DAVP usually specify
the frequency of release everyday on a
particular channel and a list of channels
and spots for the broadcast. A specific
media plan with instructions on the
frequency of each particular spot will
help in tracking the actual release and
impact of the spot.
As suggested by the policymakers and
program managers at the state level, the
national mass media campaign could
be aligned to state level campaigns,
which would include local adaptations
on mass media and interpersonal
communication through ASHA/ANM/
AWW to enhance impact.
In such synchronized campaigns, it
is recommended that an overarching
theme is developed that has a common
string running through and binding all
campaign components together. The
development or identification of such a
theme must be based on research.
Further analysis of the media preferences
against the level of exposure/message
recall and the frequency of release
would provide useful insights for media
35

5.10 Page 50

▲back to top


A Concurrent Evaluation of Phase II of the NRHM BCC Campaign
planning. Similarly, an analysis of the
creative content of spots with the appeal
and intention to act could be useful in
developing spots with creative treatment
that is effective.
A qualitative study to build on the results
of this evaluation is recommended for
understanding the reasons for better/
poor recall/comprehension of certain
spots over others.
Periodic evaluations of campaigns
implemented in future are recommended
to keep a track of the impact and to
ensure value for money spent.
36

6 Pages 51-60

▲back to top


6.1 Page 51

▲back to top


Annexures

6.2 Page 52

▲back to top


6.3 Page 53

▲back to top


Annexure 1
Annexure 1
Sampling Design for the Survey among
Target Audiences at the Household Level
The sampling design proposed for the
concurrent evaluation study aimed to provide
estimates on post-campaign assessment of
TV and radio spots immediately following the
completion of Phase II of the BCC campaign
at the national level as well as separately
for the two strata of states i.e. 18 high focus
states and all other remaining states. It was
essential that the sample was sufficient to
provide rural-urban differentials within each
stratum of states. Thus, the sample size of
target audiences was fixed in such a manner
that statistically robust estimates could be
provided at the following levels:
Rural areas of 18 high focus states
Rural areas of other specified states
Urban areas of 18 high focus states
Urban areas of other specified states
National rural estimates
National urban estimates
National estimates
As the sample size was fixed at the sub-
national level i.e for the first four strata,
the national level estimates were based on
much larger sample size and hence, these
estimates were more precise with minimum
possible margin of error.
The sample size for the survey among eligible
women (currently married women within
the age group of 15-29 years and exposed to
either TV or radio) and the eligible men (men
married to women in the age group of 15-29
years and exposed to either TV or radio) was
estimated based on the standard formula for
one point sample estimation. The following
formula was used for estimating the required
sample size of eligible women:
(i) The Formula
n = Z21- /2 * P * (1- P)
*D
d2
Where:
n = Required sample size
Z1- /2 = Standard normal value at (1-a) %
level of confidence i.e. the Z - score
corresponding to ‘ /2’ level of
confidence
P = Anticipated proportion of the
indicator
d = Standard error
D = Design effect
The sample size for survey among the eligible
women was calculated on the basis of
following factors:
Expected value of the indicator (assumed
as 50percent)1 at the completion of
second phase of the campaign (eg. the
proportion of eligible women who were
exposed to the spots through TV/radio
during the campaign period)
Confidence level (95%)
Margin of error (5% for eligible women
and 7% for eligible men)
Design effect2 (2)
1 P value of 50 percent is conventionally assumed to work out maximum sample size in such situations where no prior estimates of P
are available from any secondary sources.
2 A multi-stage sampling procedure was adopted with districts, villages, clusters and households as the different stages for selection
of the target audiences at the household level. The standard error of an estimated indicator due to the suggested sampling design
was much higher than that of the estimated indicator based on the simple random sampling design. Keeping in view the several
stages involved in sampling of target audiences at the household level, while working out the sample sizes, the design effect of 2
was applied for the current study.
39

6.4 Page 54

▲back to top


A Concurrent Evaluation of Phase II of the NRHM BCC Campaign
SAMPLE WEIGHTS
For each group of states, the weights were
developed taking into account the sampling
procedure followed and the conditional
probabilities attached to the units selected at
different stages of sampling.
The sample sizes were worked out to be able
to provide estimates separately for the four
sub-strata [rural areas of high focus and
other states and urban areas of high focus
and other states]. For obtaining national
estimates, necessary correction factors were
also worked out to take care of rural-urban
disproportionate sampling and the two state
(high focus and other state) groups’ level.
SELECTION OF RURAL VILLAGES
AND CLUSTERS AND URBAN
SAMPLES
Within each village selected for the
concurrent evaluation, two clusters/segments
were selected following modified cluster
sampling techniques3. This approach involved
the following steps:
Preparation of sketch map of sample
clusters (with the help of Pradhan and
other knowledgeable and elders residents
of the village and transact walk by field
personnel).
Formation of sub-clusters/segments of
approximately equal size, say about 30
households, covering all communities
in the village, starting from the north-
eastern direction of the village and then
moving clock-wise.
Randomly selecting two clusters/
segments using random number table (to
eliminate bias in selection of clusters).
Contacting all the households in the
selected cluster one by one to identify the
households having at least one eligible
woman and assigning serial numbers to
the households having the eligible women.
The selection of the urban sample was made
as mentioned in the following steps:
The total sample of urban public sector
units (PSUs) was distributed across the
selected districts (as followed for survey
in rural areas) in each state group equally.
Thus, in each selected district, 10 urban
PSUs were covered for the study.
In each selected district, the required
number of urban PSUs/wards was
selected following PPS systematic
random sampling procedure after
arranging all the urban wards in the
district in descending order of SC/ST
population as per 2001 Census.
All the selected urban PSUs/wards were
segmented to a number of clusters/
segments (each segment having around
30 households) and two clusters/
segments were selected randomly for the
study. The formation of clusters was the
same as proposed for rural areas.
The selection of the different household
level target audiences from the selected
clusters/segments of the urban PSUs
was made following the same procedure
described for selection of different
categories of target audiences in rural
areas.
3 As described by Anthony G Turner, Robert J Magnani and Muhammad Shuaib in their article on “ A not quite as quick but much
cleaner alternative to the Expanded Programme on Immunization (EPI) cluster survey design” published in International Journal
of Epidemiology, 1996;25:198-203
40

6.5 Page 55

▲back to top


Annexure 2
Annexure 2
Recruitment, Training, Fieldwork
and Data Processing
2.1 RECRUITMENT, TRAINING AND
FIELDWORK
2.1.1 Recruitment of Field Staff
While selecting the field staff, it was ensured
that skilled male and female candidates
with prior experience of social research are
recruited. Further, efforts were also made to
recruit field workers with previous experience
of conducting health/RCH studies. Keeping
in mind the dropout rate, 20 percent extra
candidates were recruited and trained. A
total of 35 field teams were recruited across
the country to complete the entire field
work within the stipulated time period of
two weeks. Each field team recruited for
the survey had one supervisor, three female
interviewers and two male interviewers.
2.1.2 Training of Field Staff
A two-day training of the trainers (ToT) was
organized in Delhi for all the team members
and field executives. During the ToT, all the
questionnaires developed for the study and
the research methodology were discussed
in detail. The professionals and the field
executives participating in the ToT imparted
training to field staff in 11 states. Training
was organised in 11 locations namely Bhopal
(Madhya Pradesh and Chhattisgarh states),
Lucknow (UP), Patna (Bihar), Bhubaneswar
(Orissa), Aizawl (Mizoram), Delhi (Haryana),
Kolkata (West Bengal), Kolhapur and Pune
(Maharashtra), Bangalore (Karnataka) and
Madurai (Tamil Nadu).
The training of field teams comprised both
classroom training as well as field practice.
In the classroom training sessions, apart
from background and objectives of the study,
instructions in interviewing techniques, field
procedures for the survey, guest lectures on
RCH, and the contents of the questionnaire
were discussed in great detail. Mock calls were
also conducted in the classroom before taking
the investigators to the field for trial calls. Trial
calls by supervisors and interviewers were
made in order to ensure a clear understanding
of each item in the tools. Separate training
sessions were conducted for investigators
involved in the quantitative survey and
research assistants involved in qualitative
discussions.
2.1.3 Fieldwork and Monitoring
The fieldwork was carried out simultaneously
in all the states covered in the study. It was
initiated on 10th February, 2009 and completed
on 26th February, 2009. A total of 35 teams,
each team consisting of 1 supervisor, 2 male
and 3 female investigators, were deployed to
complete the field work in all the 11 states
within the stipulated time.
The field work for survey of target audiences
at the block and village level was undertaken
by separate teams of research assistants
and senior male investigators. While the
interviews at the block level were undertaken
by the research assistants, the interviews
at the village level were carried out by
the senior male investigators. A total of
12 teams, each team consisting of one
research assistant and one senior male
investigator, were deployed across all the
regions for completing the field work for this
component within a period of two weeks.
The in-depth discussions among the policy
makers and program managers were
undertaken by the professionals and the field
executives involved in the study.
41

6.6 Page 56

▲back to top


A Concurrent Evaluation of Phase II of the NRHM BCC Campaign
For proper monitoring of fieldwork and
initiated within one week of receiving the first
ensuring the quality of data collected,
set of completed questionnaires. Computer
emphasis was given on the following aspects: based checks were used to clean the data and
Scrutiny of questionnaires by the
the inconsistencies were resolved on the basis
supervisors on a daily basis
of responses recorded in the questionnaires.
Re-visit to the respondents in case of
The system analyst for the study as well as the
discrepancies
core study team members closely monitored
Observation of some interviews carried
the data entry operations.
out by the field staff
Spot checks to verify the accuracy of
The core team members and the system
information collected
analyst, under the guidance of the team
Maintainence of log sheets by field
leader, prepared the analysis/tabulation
executives indicating team performance plan. The tabulation plan was finalized in
Field visits by the concerned research
consultation with PFI and the BCC campaign
professionals for monitoring fieldwork
technical team. The required tables were
and providing technical guidance to the generated using the latest version of SPSS.
field staff
Involvement of research professionals
The BCC campaign related information was
in qualitative calls, especially with high
analyzed separately for each theme and
state level officials like health secretaries, specific TV/radio spots within each theme.
Directors (NRHM), Directors and Joint
The information regarding TV spots was
Directors (IEC and RCH).
elicited first, followed by radio spots clubbed
theme-wise (for example, age at marriage,
2.2 DATA PROCESSING AND ANALYSIS antenatal care, natal care…..). Care was taken
to put spots with the same theme together in
In view of the time constraints of the study,
the questionnaire.
data were handled at four centers namely
Delhi, Lucknow, Baroda and Hyderabad
While the extent of exposure to media (radio,
where in-house facilities to handle large
including radio with mobile phone and TV)
volumes of data are available. A senior system was estimated among all the women and
analyst, with the support of a programmer,
men based on the household listing exercise,
monitored the data entry at the four centers. the indicators relating to reach/exposure
of the campaign were analyzed for all the
Before data entry, each and every
respondents who were exposed to TV or radio
questionnaire was scrutinized with respect
(including radio with mobile phone) since last
to completeness and consistency of the
Christmas/27th December, 2008.
questionnaires and coding of open-ended
questions. The scrutiny and coding of the
The issues relating to recall of messages,
questionnaires was initiated one week after
comprehension of intended meaning of
the launch of field work. All office editors
messages, appeal of the spots, and likes and
and supervisors were briefed about scrutiny
dislikes of the spots were analyzed for the
and coding procedures. The core study team respondents who were exposed to specific
members also supervised the entire scrutiny spots on different themes.
operation for monitoring the quality output.
Attempts were also made to analyze the
The data entry operation was carried out
impact of the campaign in terms of the extent
using data entry and editing software CS Pro of practice and intent to practice specific
and was finalized after getting approval from behaviors among the exposed respondents.
PFI/MCH-STAR. The data entry operation was
42

6.7 Page 57

▲back to top


Annexure 3
Annexure 3
TV Viewing Habits
3.1 FREQUENCY OF WATCHING TV
In order to understand the frequency of
exposure to TV, all the respondents were
probed separately for frequency of watching
the medium. Table 3.1 presents the findings on
this. Nearly half of women (among those who
had exposure to TV/radio) watched TV everyday
(48%). This proportion was much higher in
other states (66%) in comparison to high focus
states (30%). Women watching TV occasionally
was much higher in high focus states (29%) as
compared to other states (8%). While almost
three-fourths of the women in urban areas
watched TV everyday, less than two-fifths of
their counterparts in rural areas watched it
everyday. About 23 percent of the women in
rural areas had no exposure to TV as compared
to a meager five percent in urban areas.
When the same information was elicited
from men, similar patterns emerged as
existed with women (Table 3.1). Overall,
two-fifths of men reported watching TV
everyday. This was significantly higher in
other states (high focus 26%, others 55%)
and urban areas (rural 32%, urban 61%).
About 23 percent of the total men reported
no exposure to TV whatsoever. This
percentage was higher in high focus states
(32%) compared to other states (13%) and
also higher in rural areas (27%) than in
urban areas (10%).
The above findings indicate that TV
viewing is less prevalent in high focus
states in comparison to other states.
Similarly, it is more popular in urban areas
than in rural areas.
Table 3.1: Percentage are distribution of women and men by frequency of watching TV
Women
At least 3 times/week
Once or twice/week
Once a fortnight
Once a month
Occasionally
No response
No exposure
Total N
Men
Everyday
At least three times a week
Once or twice in a week
Once a fortnight
Once a month
Occasionally
CS/No response
No exposure
Total N
High focus states
Other states
Rural Urban Total Rural Urban Total
5.6 5.2 5.5 7.9
4.6 5.5 4.8 9.7
1.7 1.2 1.6 1.9
.2 1.0
.3 1.6
32.6 13.1 28.8 7.5
1.6
.2 1.3 .1
34.0 2.3 27.7 9.8
1440 357 1797 1151
4.4 6.6
4.5 7.9
.9 1.5
.7 1.3
8.4 7.8
.5 .3
5.8 8.4
628 1779
16.6 63.0 25.9 51.8
7.7 8.9 8.0 13.8
6.1 2.0 5.3 9.7
.3
.0
.2 3.8
.1
.2
.1 1.4
29.6 19.7 27.6 6.6
.7
.6
.7 .4
39.0 5.5 32.3 12.5
720 180 900 580
60.3 54.7
7.8 11.8
5.3 8.2
1.2 2.9
.2 1.0
12.1 8.5
.5 .4
12.6 12.5
304 884
Combined
Rural Urban Total
6.6
6.9
1.8
.8
21.5
.9
23.3
2591
4.7 6.1
4.8 6.3
1.0 1.6
.8 .8
10.1 18.3
.4 .8
4.6 18.1
984 3575
32.3
10.4
7.7
1.9
.7
19.3
.5
27.1
1300
61.3 40.2
8.2 9.8
4.1 6.7
.7 1.6
.2 .5
14.9 18.1
.6 .5
10.0 22.5
484 1784
43

6.8 Page 58

▲back to top


A Concurrent Evaluation of Phase II of the NRHM BCC Campaign
3.2 FREQUENTLY WATCHED
CHANNELS
The respondents were asked about their
preference from a comprehensive list of 84
different channels which included regional
channels as well. As expected, DD National
emerged as the most frequently watched
channel among both women (50%) as well as
men (59%). While this was the most watched
channel by rural women and men as well as
by urban men, Star Plus emerged as the most
frequently watched channel among urban
women (Table 3.2).
Table 3.2: Percentage distribution of women and men by frequently watched channels
Women
DD National
Star Plus
Zee TV
Sun TV
Colors
Zee Cinema
Udaya TV
DD Regional
DD News
KTV
ETV Bangla
Star Gold
Star Ustav
Sony
Set Max
Sahara One
ETV Marathi
Star One
Zee Bangla
Zee Smile
Aaj Tak
Total N
Men
DD National
DD News
Zee Cinema
Star Plus
Sun TV
Zee TV
DD Regional
KTV
Star Gold
Aaj Tak
High focus states
Other states
Combined
Rural Urban Total Rural Urban Total Rural Urban Total
89.1 43.0 76.7 36.9 13.5 28.4 61.8 24.4 49.8
6.9 54.2 19.6 13.7 30.2 19.7 10.4 39.1 19.6
9.1 44.4 18.6 11.0 27.9 17.1 10.1 34.0 17.8
.1
.1
.1 10.5 38.4 20.6 5.5 24.2 11.5
1.8 36.5 11.1 6.1 13.2 8.7 4.0 21.9 9.8
5.8 9.0 6.6 6.3 12.8 8.6 6.0 11.4 7.8
0.0 0.0 0.0 15.0 9.3 12.9 7.8 5.8 7.2
2.9
.2 2.1 14.0 6.3 11.2 8.7 4.0 7.2
12.5 5.3 10.5 3.9 1.6 3.1 8.0 2.9 6.4
0.0
.4
.1 5.3 21.9 11.3 2.8 13.9 6.3
0.0
.0
.0 7.9 11.2 9.1 4.1 7.1 5.1
4.5 8.4 5.6 2.7 8.1 4.7 3.6 8.2 5.1
7.7 3.3 6.5 5.0 1.1 3.6 6.3 2.0 4.9
2.5 8.7 4.2 2.9 6.6 4.3 2.7 7.4 4.2
2.1 4.1 2.7 5.8 3.3 4.9 4.1 3.6 3.9
1.5 12.2 4.3 3.5 3.0 3.3 2.5 6.4 3.8
0.0 0.0 0.0 9.3 1.1 6.3 4.9
.7 3.5
1.7 10.6 4.1 1.9 4.1 2.7 1.8 6.5 3.3
.1
.7
.3 3.3 9.5 5.6 1.8 6.2 3.2
3.8 2.5 3.5 2.9 1.2 2.3 3.3 1.7 2.8
1.0 5.9 2.3 2.7 3.8 3.1 1.8 4.6 2.7
950 348 1298 1038 591 1629 1988 939 2927
95.0 69.4 87.9 42.3 23.1 35.7 66.8 41.2 58.7
23.2 22.8 23.1 13.6 8.5 11.9 18.1 14.1 16.8
5.2 25.6 10.9 11.1 12.7 11.6 8.4 17.7 11.3
3.8 31.2 11.5 6.0 21.0 11.1 5.0 25.0 11.3
0.0 0.0 0.0 10.4 36.2 19.2 5.5 22.1 10.8
4.3 14.3 7.1 8.6 18.7 12.1 6.6 17.0 9.9
11.5 17.9 13.3 9.6 2.5 7.2 10.5 8.5 9.8
0.0 0.0 0.0 6.9 27.3 13.9 3.7 16.7 7.8
4.2 20.9 8.9 3.6 13.2 6.9 3.9 16.2 7.8
4.3 15.3 7.4 6.2 7.0 6.5 5.3 10.3 6.9
44

6.9 Page 59

▲back to top


Annexure 3
Udaya TV
Star News
Sony
Set Max
Star One
Sun News
EV Bangla
Star Ustav
Star Sports
Sun Music
ETV Marathi
ETV Kannada
Zee News
Zee Bangla
Total N
0.0
.8
1.7 12.3
4.5 8.8
3.0 8.2
1.0 15.8
0.0
.6
0.0 0.0
8.3 2.8
.6 3.9
0.0 1.5
0.0 0.0
0.0 0.0
0.0 9.0
0.0 0.0
440 170
.2 13.6 9.1 12.1
4.7 5.5 13.9 8.4
5.7 1.7 16.4 6.8
4.5 1.1 16.2 6.3
5.1 4.3 4.9 4.5
.2 4.0 14.3 7.5
0.0 6.3 10.1 7.6
6.8 2.8
.4 2.0
1.5 2.3 10.3 5.0
.4 2.3 12.4 5.8
0.0 8.3 1.6 6.0
0.0 5.3 4.9 5.1
2.5 1.4 5.3 2.8
0.0 2.6 8.2 4.5
610 508 266 773
7.3 5.9 6.9
3.7 13.2 6.7
3.0 13.4 6.3
2.0 13.1 5.5
2.8 9.1 4.8
2.1 9.0 4.3
3.4 6.2 4.2
5.4 1.4 4.1
1.5 7.8 3.5
1.3 8.2 3.4
4.5 1.0 3.4
2.8 3.0 2.9
.8 6.8 2.7
1.4 5.0 2.5
947 436 1383
For women respondents, DD National was
watched much more frequently in high
focus states (77%) in comparison to other
states (28%). Similarly, the channel was
more frequently watched in rural areas
(62%) in comparison to urban areas (24%).
Overall, Star Plus channel emerged as a
distant second in terms of popularity after
DD National among women (Table 3.2).
The third most popular channel for women
respondents was Zee TV (18%). This was
also similar across type of states and this
channel was also more popular among
urban women (34%).
(23%) watched DD News somewhat
more frequently in comparison to their
counterparts in other states (12%). Overall,
Zee Cinema and Star Plus were the third
most popular channels among men. This was
similar across high focus and other states,
though the channel was watched relatively
more by men in urban areas (18%) as
compared to those in rural areas (8%).
The regional channels like Sun TV, Udaya
TV, KTV, ETV Bangla were mentioned by
a sizeable proportion of women and men
respondents (10 to 20%) in other states.
For male respondents, while DD National was
a clear winner in terms of overall popularity,
respondents in high focus states emerged
to be watching the channel relatively more
frequently (88%) as compared to their
counterparts in other states (36%). Across
places of residence, rural men (67%) watched
the channel relatively more frequently than
men in urban areas (51%).
DD News (17%) emerged as a distant
second most popular channel among
men after DD National (Table 3.2). While
no major variation emerged across rural
and urban areas, men in high focus states
3.3 PREFERRED TIMINGS
The most preferred timing of watching TV
across women and men was the slot between
6-9 pm (45%). However, nearly 30 percent of
both women and men respondents had no
fixed slots (30%) for watching TV (Table 3.3).
The proportion of women preferring the time
slot of 6-9 pm for watching TV was significantly
higher in other states (61%) in comparison
to those in high focus states (25%). Also, the
proportion of women preferring this slot was
higher in urban areas (57%) as compared to
rural areas (39%) (Table 3.3).
45

6.10 Page 60

▲back to top


A Concurrent Evaluation of Phase II of the NRHM BCC Campaign
Table 3.3: Percentage distribution of women and men by preferred timings of watching TV
Women
Before 9 am
9 – 12 pm
12 – 3 pm
3 – 6 pm
6 – 9 pm
After 9 pm
No fixed slot
Total N
Men
Before 9 am
9 – 12 pm
12 – 3 pm
3 – 6 pm
6 – 9 pm
After 9 pm
No fixed slot
Total N
High focus states
Other states
Combined
Rural Urban Total Rural Urban Total Rural Urban Total
1.0
.8
.9
1.5
4.4
2.6
1.2
3.1
1.8
1.2
4.2
2.0
5.9
7.4
6.5
3.7
6.2
4.5
20.9 28.0 22.8 17.6 18.8 18.0 19.2 22.2 20.1
10.1 10.7 10.3 23.6 16.1 20.9 17.2 14.1 16.2
17.7 46.0 25.3 59.2 63.1 60.6 39.4 56.8 44.9
10.9 44.0 19.8 17.3 20.9 18.6 14.2 29.4 19.1
57.6 22.3 48.2 13.6 17.4 14.9 34.6 19.2 29.7
950 348 1299 1038 591 1629 1988 939 2927
3.8
4.9
4.1 10.0
1.7
7.2
7.1
3.0
5.8
.3
6.4
2.0
6.5
4.4
5.8
3.6
5.2
4.1
2.8
.8
2.3
2.4
8.7
4.6
2.6
5.6
3.6
2.7
3.5
2.9
6.5
5.5
6.2
4.8
4.7
4.8
18.1 43.8 25.3 57.2 42.0 52.0 39.0 42.7 40.2
23.9 36.8 27.5 36.1 36.6 36.3 30.4 36.7 32.4
60.2 28.6 51.4 15.2 25.7 18.8 36.1 26.8 33.2
440 170 610 508 266 773 947 436 1383
In case of men, 40 percent and 32 percent
preferred to watch TV between 6-9 pm and
after 9 pm respectively. The corresponding
proportions were relatively higher for other
states and urban areas. About one-third (33%)
of the men reported that there was no fixed
slot for watching TV. This proportion was
much higher in high focus states (51%) than
in other states (19%).
3.4 PREFERRED PROGRAMS
For women respondents who preferred
watching serials and films, the proportion
was similar across type of states as well as
places of residence (Table 3.4). However,
in high focus states, urban women clearly
prefer watching serials whereas in rural areas
women prefer films and serials
Table 3.4: Percentage distribution of women and men by preferred programs on TV
Women
Films
News
Reality shows
Serials
Educational
programs
High focus states
Other states
Combined
Rural Urban Total Rural Urban Total Rural Urban Total
73.3 60.3 69.8 72.4 64.8 69.6 72.8 63.2 69.7
15.9 23.4 17.9 33.5 38.9 35.4 25.1 33.2 27.7
3.0
3.3
3.1
4.3
5.4
4.7
3.7
4.6
4.0
73.5 92.5 78.6 81.6 81.7 81.6 77.7 85.7 80.3
1.9
1.3
1.7
1.4
1.6
1.4
1.6
1.4
1.6
46

7 Pages 61-70

▲back to top


7.1 Page 61

▲back to top


Annexure 3
Songs
19.7 21.4 20.2 22.8 45.9 31.2 21.3 36.8 26.3
Talk shows
.6
.9
.7
.9
2.5
1.5
.8
1.9
1.1
Live shows
.4
.4
.4
.7
1.7
1.1
.6
1.2
.8
Sports
.5
1.1
.7
3.3
2.3
2.9
1.9
1.9
1.9
Choupal (prog.
.6
.1
.5
.0
for farmers)
.0
.3
.0
.2
Other
.2
2.0
.7
1.4
1.4
1.4
.8
1.6
1.1
Total N
950 348 1299 1038 591 1629 1988 939 2927
Men
Films
73.5 65.8 71.3 69.4 76.8 71.9 71.3 72.5 71.7
News
57.5 74.3 62.2 70.8 62.3 67.9 64.6 67.0 65.4
Reality shows
2.9
2.0
2.6
4.5
9.0
6.1
3.7
6.3
4.5
Serials
59.1 59.8 59.3 38.2 49.5 42.1 47.9 53.5 49.7
Educational
programs
1.4
6.1
2.7
.5
1.7
.9
.9
3.4
1.7
Songs
36.4 27.2 33.8 27.0 54.9 36.6 31.3 44.1 35.3
Talk shows
1.4
1.1
1.3
.7
5.2
2.3
1.0
3.6
1.8
Live shows
.1
3.6
1.1
1.1
3.6
2.0
.7
3.6
1.6
Sports
31.9 27.9 30.8 18.5 25.6 20.9 24.7 26.5 25.3
Choupal (prog. 4.6
.7
3.5
.0
.0
.0
2.1
.3
1.6
for farmers)
Other
.5
.2
.4
.5
.1
.4
.5
.1
.4
Total N
440 170 610 508 266 773 947 436 1383
equally. For those women preferring
news, while similarities were observed
across place of residence, proportion of
women in other states who preferred news
was relatively higher (35%) than those in
high focus states (18%).
In case of male respondents who
preferred news to other programs on
TV, the proportion was similar across
type (Table 3.4). For men preferring
serials over other programs on TV, the
proportion in high focus states was
relatively higher (59%) in comparison
with other states (42%).
3.5 TOP TEN MOST WATCHED CHANNELS
The TV programs watched by women on the top
10 most watched channels are presented in Table
3.5. Films were watched by 72 to 89 percent of
women on the top 10 most watched channels
and serials were watched by 54 to 76 percent of
women on these channels. The proportion of
women watching serials was higher in case of
Colors (78%), Udaya TV (64%) and Zee TV (63%)
compared to other most watched channels.
The proportion of women watching songs was
highest for Sun TV (69%) and KTV (68%). The
corresponding proportion varied between 24
and 44 percent for other most watched channels.
47

7.2 Page 62

▲back to top


A Concurrent Evaluation of Phase II of the NRHM BCC Campaign
Table 3.5: Percentage distribution of women by programs watched on top 10 most watched
channels
Top 10
channels
DD National
Star Plus
Zee TV
Sun TV
Colors
Zee Cinema
Udaya TV
DD Regional
DD News
KTV
Films News Reality Serials Educational Songs Talk Live Sports
shows shows
72.4 64.1 3.5 55.2
2.0
34.4 1.5 1.4 29.3
75.0 67.0 4.5 73.1
5.8
41.0 0.1 4.2 27.8
78.5 68.5 6.1 63.4
5.3
43.6 1.3 2.3 35.9
81.4 70.4 8.2 23.4
-
68.8 8.8 4.2 18.9
74.4 53.8 8.1 77.9
5.2
40.5 5.5 7.3 31.4
89.1 70.1 5.4 43.4
4.1
35.0
4.9 26.4
75.6 74.6 1.9 64.4
1.5
33.5 1.1 1.4 13.3
81.2 73.2 2.1 47.9
4.1
41.6 1.2 1.3 21.0
79.3 76.3 6.8 43.7
2.1
24.1 0.8 0.9 36.3
82..5 61.1 2.6 27.6
-
68.2 5.5 5.3 20.9
48

7.3 Page 63

▲back to top


Annexure 4
Annexure 4
Radio Listening Habits
4.1 FREQUENCY OF RADIO
LISTENING
4.2 MOST POPULAR RADIO
CHANNELS
As Table 4.1 shows, almost two-thirds (66%)
of currently married women and 63 percent
of the men had no exposure to the radio.
The proportion of women as well as men
respondents having no exposure to radio was
significantly higher in other states as compared
to high focus states. The exposure to radio was
higher among both women and men in rural
areas than in urban areas. However, frequent
radio listening was marginal with only
11 percent of the women and 13 percent of
men reportedly listening to the radio everyday.
These findings indicate that radio listening is
less prevalent among both women and men,
especially in urban areas and in other states.
The respondents were asked about their
preference from a list of nine different
channels. FM General emerged as the most
popular channel in terms of frequency of
listening for women (54%) followed by All
India Radio (37%) and Radio Mirchi (15%). In
case of men, the radio channel most listened
to was All India Radio (55%) followed by FM
General (35%) and Radio Mirchi (20%) as
shown in Table 4.2.
For women respondents, FM General was
more frequently listened to in high focus
states (61%) in comparison to other states
(38%). The channel was also more popular
Table 4.1: Percentage distribution of women and men by frequency of listening to radio
Women
Everyday
At least 3 times/week
Once or twice/week
Once a fortnight
Once a month
Occasionally
No exposure
Total N
Men
Everyday
At least 3 times/week
Once or twice/week
Once a fortnight
Once/month
Occasionally
No exposure
Total N
High focus states
Other states
Combined
Rural Urban Total Rural Urban Total Rural Urban Total
12.0
5.7
4.5
1.9
7.3
19.5
49.1
1440
7.2 11.1 11.1
1.5 4.8 2.7
2.6 4.1 3.8
.5 1.6
.6
1.1 6.1 1.3
8.2 17.3 3.6
78.9 55.0 76.9
357 1797 1151
11.2 11.2 11.6
1.6 2.3 4.3
1.3 2.9 4.2
.8
.7 1.4
.5 1.0 4.6
5.0 4.1 12.5
79.6 77.8 61.4
628 1779 2591
9.8 11.1
1.6 3.6
1.7 3.5
.7 1.2
.7 3.6
6.2 10.7
79.3 66.3
984 3575
13.0 9.2 12.3 11.8 14.7 12.8 12.5 12.6 12.5
2.2 2.0 2.1 9.4 1.8 6.8 5.4 1.9 4.5
2.5
.4 2.1 4.8
.7 3.4 3.5
.6 2.7
.8
.0
.7 3.4
.4 2.4 2.0
.3 1.5
1.0
.2
.8
.6
.2
.5
.8
.2
.6
28.2 2.6 23.1 7.4 8.7 7.9 18.9 6.4 15.5
52.3 85.4 58.9 62.5 73.5 66.3 56.9 77.9 62.6
720 180 900 580 304 884 1300 484 1784
49

7.4 Page 64

▲back to top


A Concurrent Evaluation of Phase II of the NRHM BCC Campaign
Table 4.2: Percentage distribution of women and men by channels frequently listened to on radio
Women
All India Radio
FM General
FM Gold (106.4)
Radio Mirchi
Radio City
Total N
Men
All India Radio
FM General
FM Gold (106.4)
Radio Mirchi
Radio City
Total N
High focus states
Other states
Combined
Rural Urban Total Rural Urban Total Rural Urban Total
47.3 18.1 44.6 22.0 22.5 22.1 40.6 20.9 37.2
59.9 75.6 61.3 32.7 47.8 37.6 52.6 58.1 53.5
4.2 5.8 4.3 12.8 9.1 11.6 6.5 7.9 6.7
5.6 20.2 6.9 38.7 17.8 31.9 14.4 18.7 15.1
10.3 6.1 9.9 2.2 7.9 4.0 8.2 7.2 8.0
733
75 809 266 128 394 1000 203 1203
72.5 30.2 69.5 38.5 32.0 36.7 59.4 31.6 55.0
46.2 45.8 46.1 21.4 17.7 20.4 36.7 24.6 34.7
4.3 20.5 5.4 15.9 29.4 19.5 8.7 27.2 11.7
4.5 33.7 6.6 40.6 24.9 36.3 18.4 27.1 19.8
3.0 34.3 5.2 7.1 5.2 6.6 4.6 12.3 5.8
348
26 374 217
81 298 565 107 672
in rural areas (41%) in comparison to urban
areas (21%). The popularity of All India Radio
was relatively higher among women in high
focus states (45%) as compared to other states
(22%). Rural women (41%) were twice as likely
to listen to All India Radio as compared to
their urban counterparts (21%). For Radio
Mirchi, which was the third most popular
radio channel among women, the proportion
was relatively higher in other states (32%) as
compared to high focus states (7%).
In case of male respondents, All India Radio,
the most popular radio channel, was observed
to be significantly more popular in high focus
states (70%) as compared to other states (37%).
Also, respondents in rural areas emerged to be
listening to the channel twice as often (59%)
as compared to their counterparts in urban
areas (32%). As mentioned before, FM General
emerged as the second most popular channel
among men (Table 4.2). While no major
variation emerged across rural and urban
Table 4.3: Percentage distribution of women and men by preferred timings of listening to
the radio
Women
Before 9 am
9 – 12 pm
12 – 3 pm
3 – 6 pm
6 – 9 pm
After 9 pm
No fixed slot
Total N
High focus states
Other states
Combined
Rural Urban Total Rural Urban Total Rural Urban Total
4.1 12.1
4.8 11.3 16.7 13.1
6.0 15.0
7.5
8.8 23.8 10.2 10.1 22.4 14.1
9.2 22.9 11.5
23.1 10.4 21.9 17.5 11.3 15.5 21.6 11.0 19.8
17.7
4.8 16.5 12.3 17.6 14.0 16.3 12.9 15.7
18.1
9.1 17.3 29.7 37.5 32.2 21.2 27.0 22.2
4.4 11.9
5.1 11.5 13.5 12.1
6.3 12.9
7.4
49.4 57.5 50.1 31.4 22.5 28.5 44.6 35.5 43.1
733
75 809 266 128 394 1000 203 1203
50

7.5 Page 65

▲back to top


Annexure 4
Men
Before 9 am
9 – 12 pm
12 – 3 pm
3 – 6 pm
6 – 9 pm
After 9 pm
No fixed slot
Total N
3.7 27.4
5.4 13.9 10.0 12.8
7.6 14.3
8.7
3.9 18.2
4.9
8.2 10.9
8.9
5.6 12.7
6.7
4.0 14.3
4.7 15.0 12.2 14.2
8.2 12.7
8.9
3.7
1.1
3.5
4.6 13.2
7.0
4.1 10.3
5.1
5.8 20.1
6.8 38.1 19.8 33.1 18.2 19.8 18.5
10.2 21.2 11.0 19.3 15.0 18.1 13.7 16.5 14.1
80.3 31.9 76.9 26.4 58.9 35.2 59.6 52.3 58.4
348
26 374 217
81 298 565 107 672
Table 4.4: Percentage distribution of women and men by programs preferred on radio
Women
News
Educational programs
Songs
Talk shows
Celebrity shows
Sports
Other
Total N
Men
News
Educational programs
Songs
Talk shows
Celebrity shows
Sports
Other
Total N
High focus states
Rural Urban Total
33.7 23.7 32.8
8.9 3.6 8.4
92.9 98.6 93.4
6.4 3.6 6.2
1.5
.1 1.3
.2
.1
.2
1.3
.3 1.2
733 75 809
58.1 68.9 58.8
5.5 3.9 5.4
90.5 91.0 90.5
1.7 5.6 2.0
2.0 3.5 2.1
14.6 11.4 14.4
2.3
2.2
348 26 374
Other states
Rural Urban Total
43.9 37.8 41.9
1.9 3.6 2.5
94.0 93.6 93.9
10.2 8.6 9.7
3.9 8.6 5.4
.4
.7
.5
4.3 2.9 3.8
266 128 394
62.5 57.1 61.0
1.3 8.1 3.1
93.2 91.2 92.7
2.2 19.9 7.0
2.4 9.4 4.3
3.5 4.9 3.8
1.2
.9
217 81 298
Combined
Rural Urban Total
36.4
7.0
93.2
7.4
2.1
.3
2.1
1000
32.6 35.8
3.6 6.5
95.5 93.6
6.8 7.3
5.5 2.7
.5
.3
2.0 2.1
203 1203
59.8 60.0 59.8
3.9 7.0 4.4
91.6 91.1 91.5
1.9 16.4 4.2
2.2 8.0 3.1
10.3 6.5 9.7
1.9
1.6
565 107 672
areas, men in high focus states (46%) listened
to the channel relatively more frequently in
comparison to their counterparts in other
states (20%). Radio Mirchi was the third most
popular channel among men as well
(Table 4.2). This proportion was similar across
rural and urban areas at an aggregated level,
though the channel was listened to much more
frequently by men in other states (36%) as
compared to those in high focus states (7%).
4.3 PREFERRED TIMINGS OF
LISTENING TO RADIO
For 43 percent of women and 58 percent of
men, there was no fixed slot in which they
preferred to listen to the radio (Table 4.3). The
proportion of respondents reporting no fixed
slots for listening to radio were mostly from
high focus states (women 50%, men 77%). In
other states, around 30 percent of women and
51

7.6 Page 66

▲back to top


A Concurrent Evaluation of Phase II of the NRHM BCC Campaign
men reported listening to radio between 6
and 9 pm.
4.4 PREFERRED TYPES OF RADIO
PROGRAMS
As Table 4.4 shows, the majority of women
(94%) and men (92%) prefer to listen
to songs on the radio. The findings are
similar across high focus and other states
as well as rural and urban areas. Men
were significantly more likely to listen to
the news on radio (60%) in comparison
to women (36%). The proportion of men
reportedly listening to news was similar
across high focus and other states. However,
among women, the corresponding
proportion was considerably higher in other
states (42%) compared to the high focus
states (33%).
52

7.7 Page 67

▲back to top


Annexure 5
Annexure 5
Details on Exposure
5.1 EXPOSURE TO THEME-SPECIFIC
TV SPOTS
The 16 TV spots used during the campaign
covered seven specific themes/issues. These
were antenatal care/institutional delivery,
birth spacing/family planning, immunization,
newborn care, nutrition/breastfeeding,
NRHM/health services and age of marriage.
There were four spots on ANC/institutional
delivery, five spots on birth spacing/family
planning, two spots each on immunization
and NRHM/health services, and one
spot each on newborn care, nutrition/
breastfeeding and age of marriage. The
findings on reach of theme-specific TV spots
among the women exposed to TV have been
presented in Table 5.1.
Exposure to TV spots on ANC/institutional
delivery: Overall, two-fifths of women and
one-third of men had seen at least one of the
four TV spots focusing on ANC/institutional
delivery. Overall, the proportion of women who
reported viewing any spot on ANC/institutional
delivery was comparable in the two types
of states as well as in rural and urban areas.
A higher proportion of men in urban areas
(43%) compared to rural areas (31%) reported
exposure to any TV spot on ANC/institutional
delivery. Women in urban areas of high focus
states (53%) were significantly more likely to
have viewed TV spots around this thematic
area as compared to their rural counterparts, or
women in urban and rural areas of other states.
Similar exposure levels were observed among
urban men of high focus states.
Table 5.1: Percentage distribution of women and men by exposure to theme specific TV spots
Themes
Women
ANC/Inst. delivery
FP/Birth spacing
Immunization
Health services
Newborn care
Nutrition/Breastfeeding
Age of marriage
Total N
Men
ANC/Inst. delivery
FP/Birth spacing
Immunization
Health services
Newborn care
Nutrition/Breastfeeding
Age of marriage
Total N
High focus states
Other states
Combined
Rural Urban Total Rural Urban Total Rural Urban Total
32.9
32.9
18.2
3.8
30.3
7.9
27.2
1439
52.8 36.9 38.8
65.9 39.5 32.8
44.7 23.5 29.7
8.7 4.8 7.9
26.3 29.2 23.3
17.3 10.4 12.4
20.3 25.3 26.0
357 1796 1151
36.9 38.1 35.5
34.5 33.4 32.9
25.3 28.2 23.3
8.6 8.2 5.6
20.4 22.3 26.6
9.1 11.2 10.3
20.4 24.0 26.6
628 1779 2591
42.7 37.5
45.8 36.4
32.4 25.8
8.7 6.5
22.6 25.3
12.1 10.9
20.4 24.6
984 3575
33.3 55.1 37.6 28.1 35.1 30.5 30.9 42.5 34.1
29.7 52.2 34.2 27.6 31.3 28.9 28.7 39.1 31.5
13.1 17.8 14.0 23.1 11.5 19.1 17.5 13.8 16.5
4.9 9.4 5.8 12.4 14.3 13.0 8.2 12.5 9.4
26.6 23.3 25.7 25.5 22.0 24.3 26.0 22.5 24.9
3.4 4.4 3.7 6.8 3.2 5.6 5.2 3.7 4.7
34.9 30.7 33.7 27.8 17.8 24.4 31.1 22.8 28.5
720 180 900 583 304 887 1303 484 1787
53

7.8 Page 68

▲back to top


A Concurrent Evaluation of Phase II of the NRHM BCC Campaign
Exposure to TV spots on birth spacing/family
planning: A total of five TV spots were beamed
in the campaign to communicate messages
on issues relating to birth spacing/family
planning. Overall, 36 percent of the women
and 32 percent of men reported viewing any
TV spot on birth spacing/family planning.
As in the case of ANC/institutional delivery,
urban women and men living in high focus
states reported highest exposure to TV spots on
this theme. Among all the TV spots broadcast
during the BCC campaign, the greatest
exposure (66%) was reported by urban women
in high focus states to the TV spots on birth
spacing/family planning (Table 5.1).
Exposure to TV spots on immunization:
One-fourth of the women and 17 percent of
men had exposure to either of the two TV
spots on immunization. For both women and
men, in contrast to the findings observed
for the spots on birth spacing/family
planning and ANC/institutional delivery,
the proportion reporting exposure to any TV
spot on immunization was marginally higher
in other states compared to the high focus
states. Overall, women, living in urban areas
of high focus states, and men residing in rural
areas of other states were most likely to have
viewed the immunization spots on television.
Exposure to TV spots on NRHM/health
services: The two TV spots used on NRHM/
health services at Government facilities could
reach only seven percent of the women and
nine percent of the men. Television spots on
this theme were reported to be viewed by the
least number of women in either urban or
rural areas of high focus or other states. Among
men, the proportion watching any TV spot on
NRHM/health services was only slightly higher
in other states (14%) and in urban areas (13%).
Table 5.2: Percentage distribution of women by exposure to specific TV spots
TV spots
Crystal Ball
ANC Sachin and Supriya
ANC Juhi Chawla
Jagmag
Radheyshyam ki
Motorcycle
FP Mehendi
FP Holi
FP Train
FP Sachin Supriya
FP Juhi Chawla
Pragati on Medical Tour
Ek Savera, Ek Akash
Imm. Juhi Chawla
Imm. Mona Singh
Nutrition/Breastfeeding
Age of Marriage
Total N
High focus states
Other states
Combined
Rural Urban Total Rural Urban Total Rural Urban Total
31.3 18.9 28.0 13.2 17.0 14.6 21.9 17.7 20.5
8 19 11 19 19 19 13 19 15
8.9 23.1 12.7 16.1 20.2 17.6 12.7 21.3 15.4
27.6 18.7 25.2 16.2 15.1 15.8 21.6 16.4 20.0
30.3 26.3 29.2 23.3 20.4 22.3 26.6 22.6 25.3
7.2 12.2 8.5 14.1 10.4 12.8 10.8 11.1 10.9
10.7 11.6 10.9 6.1 8.6 7.0 8.3 9.7 8.8
41.0 54.3 44.6 25.1 16.3 21.9 32.7 30.4 32.0
5.0 11.7 6.8 8.1 14.0 10.2 6.6 13.1 8.7
5.0 11.4 6.7 10.2 17.7 12.9 7.7 15.4 10.2
3.4 6.3 4.2 6.4 5.6 6.1 5.0 5.8 5.2
3.1 4.2 3.4 4.5 5.2 4.8 3.9 4.8 4.2
24.6 42.6 29.4 28.0 22.4 26.0 26.4 29.9 27.5
3.8 8.0 4.9 10.4 10.4 10.4 7.3 9.5 8.0
7.9 17.3 10.4 12.4 9.1 11.2 10.3 12.1 10.9
27.2 20.3 25.3 26.0 20.4 24.0 26.6 20.4 24.6
950 348 1298 1038 591 1629 1988 939 2927
54

7.9 Page 69

▲back to top


Annexure 5
Table 5.3: Percentage distribution of men by exposure to specific TV spots
TV spots
Crystal Ball
ANC Sachin and Supriya
ANC Juhi Chawla
Jagmag
Radheyshyam ki
Motorcycle
FP Mehendi
FP Holi
FP Train
FP Sachin and Supriya
FP Juhi Chawla
Pragati on Medical Care
Ek Savera, Ek Akash
Imm. Juhi Chawla
Imm. Mona Singh
Nutrition/Breastfeeding
Age of Marriage
Total N
High focus states
Other states
Combined
Rural Urban Total Rural Urban Total Rural Urban Total
19.7 35.3 24.1 7.9 15.7 10.6 13.4 23.4 16.5
3.6 18.2 7.7 10.1 21.8 14.1 7.1 20.4 11.3
10.7 20.0 13.3 10.4 24.5 15.2 10.6 22.7 14.4
30.6 22.1 28.2 11.3 22.6 15.2 20.2 22.4 20.9
26.6 23.3 25.7 25.5 22.0 24.3 26.0 22.5 24.9
8.5 15.3 10.4 12.6 15.7 13.7 10.7 15.6 12.2
6.8 9.4 7.5 5.7 3.2 4.9 6.2 5.6 6.0
32.4 32.8 32.5 15.2 25.2 18.6 23.2 28.1 24.8
5.0 10.1 6.5 6.4 8.6 7.1 5.8 9.2 6.8
7.7 8.2 7.8 6.3 13.7 8.8 6.9 11.5 8.4
6.4 8.2 6.9 6.1 4.7 5.6 6.3 6.1 6.2
1.8 5.0 2.7 9.0 13.9 10.7 5.6 10.5 7.2
19.1 17.7 18.7 22.5 10.3 18.3 20.9 13.2 18.5
2.5 1.7 2.3 6.2 5.6 6.0 4.5 4.1 4.4
3.4 4.4 3.7 6.8 3.2 5.6 5.2 3.7 4.7
34.9 30.7 33.7 27.8 17.8 24.4 31.1 22.8 28.5
440 170 610 508 266 773 947 436 1383
Exposure to TV spots on newborn care:
Although only one TV spot was used on
newborn care, one-fourth of the women as
well as men exposed to TV reported that they
had seen any TV spot on newborn care. For
both women and men, the reach of the spot
on newborn care was better in high focus
states and in rural areas.
Exposure to TV spots on nutrition/
breastfeeding: Exposure to the TV spot on
nutrition/breastfeeding was reported by 11
percent and five percent of women and men
respectively. The findings are similar across type
of state and rural and urban areas. Television
spots on this theme were reported to be viewed
by the least number of men in either urban or
rural areas of high focus or other states.
Exposure to TV spots on age of marriage:
One-fourth of the women and 29 percent of
men reported viewing a TV spot on age of
marriage. The women in high focus and other
states had same level of exposure in this regard.
A higher proportion of rural women (26%) than
their urban counterparts (20%) had exposure
to the TV spots on age of marriage. Among
men, a higher proportion of respondents in
high focus states and those in rural areas had
seen the TV spot on age of marriage (Table 5.1).
55

7.10 Page 70

▲back to top


Annexure 6
Crystal Ball (Antenatal Care)
TV Spot
“Mein Hoon
Gaon ki
ASHA” – I am
the ASHA of
the village
ASHA sharing
information
on ANC with
a couple
Table 6.1: Messages recalled, aspects liked and difficulties encountered by women in TV spot:
Crystal Ball - ANC
Particulars
Messages
Safety of both mother and child is
S
in hands of both husband and wife
P
Check-up in health centre
S
P
Iron tablet for 100 days
S
P
Prepare Jachcha Bachcha card
S
P
Administer 2 doses of TT injection
S
P
Deliver child at hospital only
S
P
Feed additional diet/food
S
P
Everybody remember that ASHA
S
knows everything
P
Visit health center, register in
S
JSY & get both safe family and
P
financial benefits
56
High Other Rural Urban Total
focus states
14.4 29.5 19.0 23.9 20.4
82.8 59.5 73.9 72.8 73.6
46.5 30.5 38.2 45.5 40.2
51.4 61.4 56.5 52.3 55.4
59.5 31.4 42.4 64.1 48.4
37.7 54.9 51.0 27.7 44.5
25.0 19.1 19.1 32.0 22.6
72.1 69.2 75.0 60.4 71.0
53.2 34.8 45.7 46.6 46.0
45.1 54.1 48.0 50.3 48.7
30.6 19.5 27.0 24.2 26.2
64.7 69.6 65.3 70.0 66.6
8.3 18.8 10.9 16.5 12.5
83.0 60.7 75.8 70.1 74.2
6.0 14.9
8.0 13.4
9.5
81.3 58.7 72.4 72.2 72.3
8.9
9.1
8.5 10.5
9.0
81.0 61.6 73.7 72.4 73.4

8 Pages 71-80

▲back to top


8.1 Page 71

▲back to top


Annexure 6
Particulars
% learnt new things from the TV spot
Total N
Aspects liked in the TV spot
The message conveyed
Clarity of message
Storyline
Presentation style
Characters
Music
Overall
Total N
% encountered difficulties in understanding
Language
Wordings
Message too fast
Too many messages
Other
Total N
High
focus
63.4
363
Other
states
61.2
238
Rural Urban
61.8 64.6
435 166
Total
62.5
601
95.4 89.7 94.1 90.5 93.1
91.4 77.1 85.9 85.1 85.7
89.9 77.7 85.7 83.6 85.1
87.1 77.2 82.7 84.4 83.2
84.8 81.7 84.3 81.6 83.6
74.5 77.0 76.6 72.5 75.5
84.9 84.9 84.3 86.4 84.9
363 238 435 166 601
5.0 20.4
9.1 16.1 11.0
12.3 58.4 30.2 69.0 45.9
2.8 15.2
5.8 20.7 11.8
74.2 28.6 46.9 32.2 41.0
15.4 10.0 19.0
.4 11.5
1.0
7.9
9.7
.6
6.0
18
48
39
27
66
Table 6.2: Messages recalled, aspects liked and difficulties encountered by men in TV spot:
Crystal Ball - ANC
Particulars
(S= Spontaneous response P= Prompt response)
Messages
Safety of both mother and child is in
S
hands of both husband and wife
P
Check-up in health center
S
P
Iron tablet for 100 days
S
P
Prepare Jachcha Bachcha card
S
P
Administer 2 doses of TT injection
S
P
Deliver child at hospital only
S
P
Feed additional diet/food
S
P
Everybody remember that ASHA knows
S
everything
P
High Other Rural Urban Total
focus states
20.7 40.6 25.1 31.1 27.8
71.3 52.3 67.1 61.3 64.5
45.7 44.8 37.5 55.1 45.4
52.6 52.9 60.1 43.5 52.7
61.3 38.5 47.4 60.1 53.1
34.7 54.4 47.6 34.4 41.7
49.8 39.1 42.2 50.6 46.0
44.2 44.7 46.3 42.1 44.4
28.9 34.7 26.4 36.7 31.0
66.8 59.7 71.5 55.3 64.3
37.0 37.0 34.7 39.9 37.0
61.3 60.5 63.9 57.4 61.0
11.2 29.5 18.2 17.2 17.8
74.6 65.2 72.7 69.4 71.3
5.2 23.1 8.0 16.1 11.6
69.3 61.8 74.8 56.5 66.6
57

8.2 Page 72

▲back to top


A Concurrent Evaluation of Phase II of the NRHM BCC Campaign
Particulars
(S= Spontaneous response P= Prompt response)
Visit health center, register in JSY & get
S
both safe family and financial benefits
P
% learnt new things from the TV spot
Total N
Aspects liked in the TV spot
The message conveyed
Clarity of message
Storyline
Presentation style
Characters
Music
Overall
Total N
% encountered difficulties in understanding
Language
Wordings
Message too fast
Too many messages
Other
Total N
High
focus
11.6
72.4
68.0
147
Other
states
23.3
60.1
82.5
82
Rural
10.8
75.0
66.0
127
Urban
22.0
59.3
82.2
102
Total
15.8
68.0
73.2
229
82.2 94.6 90.8 81.5 86.6
76.6 89.4 87.3 73.6 81.2
72.0 88.6 85.4 68.7 78.0
75.7 88.9 85.3 74.4 80.4
73.9 93.5 85.3 75.4 80.9
74.2 92.1 88.4 71.0 80.7
77.5 94.3 88.1 77.8 83.5
147
82 127 102 229
7.6 15.3 9.5 11.4 10.4
24.5 48.6 43.6 30.6 37.3
65.2 34.0 40.8 56.8 48.6
39.2 1.4 1.5 37.4 19.1
33.8 14.8 10.4 37.6 23.7
3.3 18.4 21.7
.5 11.3
11
13
12
12
24
58

8.3 Page 73

▲back to top


Annexure 6
Table 6.3: Percentage distribution of women and men by intended action after watching TV
spot: Crystal Ball - ANC
Intended actions
Women
% who intend to take action after watching TV spot
Total N
Administer 2 TT shots during pregnancy
Consume 100 IFA during pregnancy
Consult a health center during pregnancy
Take help of husband during pregnancy
Ensure rest during pregnancy
Consume additional food during pregnancy
Prefer institutional deliveries
Prepare Jachcha Bachcha card
Consult ASHA
Take benefits of JSY
Acquire more information
Discuss with spouse/family members
Discuss with friends/relatives
Encourage others for availing services
Total N
Men
% who intend to take action after watching TV spot
Total N
Encourage spouse for taking 2 TT shots during
pregnancy
Encourage spouse for taking 100 IFA tablets during
pregnancy
Consult a health center during pregnancy of spouse
Help spouse during pregnancy
Ensure rest during pregnancy
Consume additional food during pregnancy
Prefer institutional deliveries
Prepare Jachcha Bachcha card
Consult ASHA
Take benefits of JSY
Acquire more information
Discuss with spouse/family members
Discuss with friends/relatives
Encourage others for availing services
Total N
High
focus
45.9
364
42.9
37.5
20.2
14.5
13.1
9.4
14.6
20.7
25.8
21.1
12.6
24.7
43.6
25.0
167
75.1
147
67.7
65.0
37.6
35.7
21.0
28.1
28.3
35.8
31.2
26.8
6.7
16.0
9.7
11.9
110
Other
states
48.8
238
55.4
38.7
30.9
20.8
20.3
19.2
24.6
28.4
28.3
27.1
8.5
16.6
30.5
9.0
116
66.3
82
60.5
53.9
46.7
30.1
33.7
16.3
43.9
39.2
29.7
27.0
26.3
24.1
41.7
17.1
54
Rural Urban
41.5 61.7
435 166
43.1 56.5
30.5 51.1
22.5 28.2
14.6 21.3
13.2 21.0
12.4 15.3
16.2 23.0
23.2 25.0
27.6 25.4
22.6 25.2
12.9 7.4
22.6 19.2
36.5 41.4
15.8 23.0
180 103
69.5 75.0
127 102
58.1 73.5
56.9 66.5
38.3 43.2
33.6 34.2
22.4 28.4
23.7 24.9
26.2 41.8
32.2 42.4
24.7 37.6
20.9 33.7
6.4 21.0
11.1 27.4
13.1 28.5
6.0 22.3
88
76
Total
47.1
601
48.0
38.0
24.6
17.1
16.0
13.4
18.7
23.8
26.8
23.6
10.9
21.4
38.3
18.4
283
71.9
229
65.3
61.3
40.6
33.9
25.2
24.2
33.4
37.0
30.7
26.8
13.2
18.7
20.2
13.6
164
59

8.4 Page 74

▲back to top


Annexure 7
Sachin and Supriya (Antenatal Care)
TV Spot
Sachin and Supriya
– Reel life actors
and real life couple
talk on the
importance of
male participation
in ANC
Table 7.1: Messages recalled, aspects liked and difficulties encountered by women in TV spot:
Sachin and Supriya - ANC
Particulars
High Other Rural Urban Total
(S= Spontaneous response P= Prompt response) focus states
Messages
Pregnant women should take rest
S 34.5 40.3 36.0 42.2 38.5
P 63.3 50.0 54.1 54.4 54.2
Pregnant women should take iron tablets
S 35.6 20.2 15.7 39.2 25.1
P 61.7 72.7 77.0 57.5 69.2
Pregnant women should be administered TT S 47.1 23.7 18.9 49.5 31.1
injection
P 50.9 67.1 72.3 46.3 61.9
Pregnant women should have check-up done S 20.8 29.3 21.3 34.7 26.6
by doctor
P 73.5 61.9 68.6 60.9 65.5
If every husband takes care of his wife by
S 15.6
6.8 9.5 9.7 9.6
taking her to right doctor for check-up and
provides all love to her wife before delivery,
P 74.8 75.4 72.3 79.7 75.2
then every mother and her child will be
healthy
Healthy nation/Bharat begins with healthy
S
9.5
5.6 5.8 8.4 6.8
family …from you
P 80.0 77.3 77.2 79.6 78.2
% learnt new things from the TV spot
66.6 62.2 65.1 61.4 63.6
Total N
141 305 268 178 446
Aspects liked in the TV spot
The message conveyed
89.7 94.5 92.8 93.2 92.9
60

8.5 Page 75

▲back to top


Annexure 7
Particulars
(S= Spontaneous response P= Prompt response)
Clarity of the message
Celebrity
Storyline
Presentation style
Characters
Music
Overall
Total N
% encountered difficulties in understanding
Language
Wordings
Message too fast
Too many messages
Other
Total N
High
focus
81.1
91.1
77.8
82.2
77.0
66.9
81.9
141
11.9
47.9
13.5
40.3
2.1
17
Other
states
86.3
88.9
83.8
85.8
87.7
85.3
89.0
305
11.2
66.8
17.7
31.0
1.1
1.2
34
Rural Urban
84.4 85.0
91.0 87.6
82.8 80.5
85.0 84.1
84.8 83.4
81.3 76.7
86.6 87.0
268 178
13.3 8.7
59.6 62.6
17.0 14.8
32.8 37.1
1.0 2.3
1.2
36 15
Total
84.6
89.6
81.9
84.7
84.3
79.5
86.7
446
11.5
60.5
16.3
34.1
1.4
.8
51
Table 7.2: Messages recalled, aspects liked and difficulties encountered by men in TV spot:
Sachin and Supriya - ANC
Particulars
(S= Spontaneous response P= Prompt response)
High Other Rural Urban Total
focus states
Messages
Pregnant women should take rest
S 49.8 57.0 44.0 63.0 54.8
P 46.8 41.1 55.4 33.2 42.8
Pregnant women should take iron tablets
S 65.9 41.4 26.6 65.5 48.7
P 33.7 47.7 58.2 32.4 43.5
Pregnant women should be administered TT
injection
S 42.5 41.2 35.6 46.1 41.6
P 56.1 46.8 49.3 49.8 49.5
Pregnant women should be checked up by
doctor
S 56.3 33.7 27.6 50.3 40.5
P 41.8 56.7 60.4 46.0 52.2
If every husband takes care of his wife by taking S 17.8 27.9 10.7 35.5 24.9
her to right doctor for check-up and provides
all love to her wife before delivery, then every
P 67.1 61.7 69.4 58.7 63.3
mother and her child will be healthy
Healthy nation/Bharat begins with healthy
family …from you
S 18.5 28.7 5.7 40.7 25.6
P 65.6 57.4 72.8 50.0 59.8
% learnt new things from the TV spot
62.1 76.8 78.1 68.1 72.4
Total N
47 109 67
89 156
Aspects liked in the TV spot
The message conveyed
80.2 96.0 93.4 89.6 91.3
Clarity of the message
80.2 86.3 87.7 82.0 84.5
Celebrity
75.9 85.2 86.8 79.1 82.4
Storyline
86.7 81.3 83.5 82.4 82.9
61

8.6 Page 76

▲back to top


A Concurrent Evaluation of Phase II of the NRHM BCC Campaign
Particulars
(S= Spontaneous response P= Prompt response)
Presentation style
Characters
Music
Overall
Total N
% encountered difficulties in understanding
Language
Wordings
Message too fast
Too many messages
Total N
High
focus
85.0
76.2
75.5
79.1
47
17.7
18.6
41.0
41.1
61.6
8
Other
states
78.3
89.3
82.7
92.1
109
23.8
61.1
33.5
26.1
7.1
26
Rural Urban
92.3 71.2
87.0 84.2
84.2 77.8
91.5 85.7
67
89
20.1 23.3
49.3 51.8
34.9 35.6
37.1 25.0
19.5 20.7
13
21
Total
80.3
85.4
80.6
88.2
156
21.9
50.8
35.3
29.7
20.3
34
Table 7.3: Percentage distribution of women and men by intended action after watching
TV spot Sachin and Supriya - ANC
Intended actions
High Other Rural Urban Total
focus states
Women
% who intend to take action after watching TV spot 42.2 45.0 37.4 54.1 44.1
Total N
141 305 268 178 446
Administer TT during pregnancy
62.5 52.9 47.1 64.9 55.8
Consume IFA during pregnancy
51.8 22.5 26.7 36.3 31.4
Consult a doctor during pregnancy
22.1 31.0 13.7 43.5 28.3
Take help of husband during pregnancy
8.9 17.3 9.3 20.4 14.8
Ensure rest during pregnancy
12.2 35.1 22.7 33.9 28.2
Acquire more information
18.4 17.2 16.1 19.0 17.6
Discuss with spouse/family members
45.5 37.9 36.1 44.6 40.2
Discuss with relatives/friends
44.3 45.1 46.0 43.6 44.8
Encourage others for availing services
16.3 15.0 16.7 14.0 15.4
Total N
60 137 101 96 197
Men
% who intend to take action after watching TV spot 64.4 51.1 47.1 61.2 55.1
Total N
47 109 67 89 156
Encourage spouse for taking TT during pregnancy
70.1 57.8 40.6 74.6 62.1
Encourage spouse for taking IFA during pregnancy
46.0 14.7 21.6 28.0 25.6
Consult a doctor during pregnancy of spouse
26.8 53.4 13.7 61.8 44.1
Help spouse during pregnancy
43.0 32.2 20.9 44.8 36.0
Ensure rest during pregnancy
32.3 38.2 17.5 47.0 36.1
Acquire more information
15.3 29.8 19.6 27.7 24.7
Discuss with spouse/family members
35.4 67.2 47.8 60.9 56.1
Discuss with friends/relatives
17.3 46.7 46.7 30.4 36.4
Encourage others for taking TT during pregnancy
20.3 22.2 12.0 27.1 21.5
Total N
30
56 32 54 86
62

8.7 Page 77

▲back to top


Annexure 8
Juhi Chawla (Antenatal Care)
TV Spot
Annexure 8
Actor Juhi Chawla
talking on
Antenatal Care
Table 8.1: Messages recalled, aspects liked and difficulties encountered by women in TV spot:
Juhi Chawla - ANC
Particulars
High Other Rural Urban Total
( S= Spontaneous response P= Prompt response) focus states
Messages
Take care of woman during pregnancy and S 21.1 30.2 23.6 31.0 26.8
keep her happy
P 74.7 63.3 70.7 63.4 67.5
Keep in mind that she should take proper
S 35.5 27.2 23.5 38.7 30.2
food and rest
P 60.7 67.2 71.8 56.0 64.8
Check-up from a doctor at least three times S 45.5 26.0 32.3 34.1 33.1
P 51.2 61.3 57.8 57.4 57.6
In every check-up the blood pressure
S 17.7 9.3 12.9 11.7 12.4
should measure normal/OK
P 72.6 81.3 79.1 76.9 78.1
In every check-up the weight should
S 28.2 21.6 24.4 23.6 24.0
measure normal/OK
P 62.5 66.0 64.3 65.4 64.8
In every check-up the iron measure in the S 11.5 10.7
7.9 14.9 11.0
blood should be OK
P 77.9 78.8 82.9 72.9 78.5
Delivery should take place in a hospital or S 12.3 12.4
9.3 16.2 12.4
under the supervision of a doctor
P 76.6 76.8 78.5 74.4 76.7
Health of mother is health of family
S 6.0 10.0
4.6 13.5
8.5
P 78.4 77.8 81.1 74.1 78.0
% learnt new things from the TV spot
64.6 70.7 69.8 66.8 68.4
Total N
164 287 251 200 451
Aspects liked in the TV spot
The message conveyed
91.6 93.5 94.9 90.0 92.8
Clarity of the message
87.0 87.1 89.2 84.4 87.1
63

8.8 Page 78

▲back to top


A Concurrent Evaluation of Phase II of the NRHM BCC Campaign
Particulars
( S= Spontaneous response P= Prompt response)
Celebrity
Storyline
Presentation style
Characters
Music
Overall
Total N
% encountered difficulties in understanding
Language
Wordings
Message too fast
Too many messages
Other
Total N
High
focus
83.3
80.5
79.4
86.4
78.3
84.9
164
13.7
36.0
22.7
48.9
6.3
.2
22
Other
states
90.2
80.0
84.8
86.9
81.7
87.1
287
10.7
67.5
7.3
28.7
11.6
31
Rural
90.8
82.7
85.7
90.3
86.4
90.8
252
10.4
49.9
5.8
55.2
11.2
26
Urban
83.7
77.0
79.3
82.2
72.9
80.6
200
13.4
58.3
21.8
19.8
7.5
.2
27
Total
87.7
80.2
82.9
86.7
80.4
86.3
451
11.8
54.1
13.9
37.3
9.4
.1
53
Table 8.2: Messages recalled, aspects liked and difficulties encountered by men in TV spot:
Juhi Chawla - ANC
Particulars
High Other Rural Urban Total
(S= Spontaneous response P= Prompt response) focus states
Messages
Take care of woman during pregnancy and S 43.8 49.7 40.9 53.7 47.2
keep her happy
P 51.5 47.0 55.3 42.3 48.8
Keep in mind that she should take proper
S 40.3 38.3 29.9 48.5 39.1
food and rest
P 53.7 59.9 66.9 47.8 57.4
Check-up from a doctor at least three times S 30.8 38.4 24.7 46.0 35.3
P 59.0 56.6 64.4 50.7 57.6
In every check-up the blood pressure
S 23.2 21.6 10.1 34.4 22.2
should measure normal/OK
P 61.3 68.1 74.9 55.7 65.3
In every check-up the weight should
S 27.8 20.9 14.1 33.4 23.7
measure normal/OK
P 58.6 67.7 76.7 51.1 64.0
In every check-up the iron measure in the
S 21.8 18.1
8.9 30.4 19.6
blood should be OK
P 68.1 68.9 77.3 59.7 68.6
Delivery should take place in a hospital or S 32.0 30.7 21.6 41.0 31.2
under the supervision of a doctor
P 62.3 59.6 70.1 51.3 60.7
Health of mother is health of family
S 26.8 22.1 19.8 28.4 24.1
P 67.0 67.6 73.6 61.1 67.4
% learnt new things from the TV spot
75.7 75.3 73.1 77.9 75.5
Total N
81 118 100
99 199
Aspects liked in the TV spot
The message conveyed
77.4 95.5 92.8 83.3 88.1
Clarity of the message
77.9 84.0 86.9 76.1 81.5
Celebrity
82.8 90.3 91.9 82.5 87.2
Storyline
64
78.3 82.5 87.7 73.8 80.8

8.9 Page 79

▲back to top


Annexure 8
Particulars
(S= Spontaneous response P= Prompt response)
Presentation style
Characters
Music
Overall
Total N
% encountered difficulties in understanding
Language
Wordings
Message too fast
Too many messages
Total N
High
focus
82.9
83.9
71.7
84.2
81
10.6
17.5
66.0
40.2
23.3
9
Other
states
92.2
85.6
86.7
91.9
118
14.3
85.0
27.9
8.6
5.1
17
Rural Urban
92.9 83.9
87.5 82.2
90.5 70.6
93.0 84.6
100
99
12.0 13.7
69.6 55.8
44.5 37.5
17.6 20.8
7.2 14.8
12
14
Total
88.4
84.9
80.6
88.8
199
12.8
62.3
40.8
19.3
11.2
26
Table 8.3: Percentage distribution of women and men by intended action after watching TV
spot Juhi Chawla - ANC
Intended actions
High Other Rural Urban Total
focus states
Women
% who intend to take action after watching TV spot 60.2 50.3 48.1 61.2 53.9
Total N
164 287 252 200 451
Avail ANC check-ups
48.1 33.1 28.9 49.4 39.2
Check-up BP/weights/Hb. level during ANC
23.6 23.7 17.3 29.9 23.7
Ensure good food during pregnancy
20.8 23.8 20.7 24.5 22.6
Ensure rest during pregnancy
14.6 19.5 11.1 23.8 17.5
Prefer institutional deliveries
12.2 13.4 8.5 17.2 12.9
Acquire more information
15.6 15.5 22.3 8.8 15.5
Discuss with spouse/family members
46.2 48.7 51.7 43.7 47.7
Discuss with friends/relatives
31.3 40.6 34.2 39.3 36.8
Encourage others for availing services
14.5 10.2 5.9 18.0 12.0
Total N
99 144 121 122 243
Men
% who intend to take action after watching TV spot 32.7 58.3 41.9 53.8 47.8
Total N
81 118 100
99 199
Encourage spouse to avail ANC check-ups
72.8 64.4 46.2 82.9 66.8
Encourage spouse for measuring BP/weights/Hb.
47.0 30.4 24.6 43.2 35.0
level during ANC
Encourage spouse for taking good food during
37.9 53.4 27.4 66.2 49.1
pregnancy
Encourage spouse for rest during pregnancy
22.3 14.9 6.7 25.1 17.0
Prefer institutional deliveries
36.7 57.4 34.8 64.8 51.6
Acquire more information
5.2 22.9 4.8 28.4 18.0
Discuss with spouse/family members
11.4 63.4 47.2 50.1 48.9
Discuss with friends/relatives
10.4 39.0 33.0 29.5 31.0
Encourage others for availing ANC services
23.5 41.1 15.7 52.3 36.2
Total N
27
68
42
53
95
65

8.10 Page 80

▲back to top


Annexure 9
Jagmag Animated Spot
(Antenatal Care)
TV Spot
Jagmag Jagmag
Table 9.1: Messages recalled, aspects liked and difficulties encountered by women in TV spot:
Jagmag - ANC
Particulars
(S= Spontaneous response P= Prompt response)
Messages
Keep in mind that all care is taken till the
S
time of delivery
P
It is necessary to give TT and iron tablets at S
right time
P
All listen to advice of ANM and ASHA
S
P
Delivering at hospital is the right decision
S
P
You also get attention of doctor, services and S
medicines at hospitals
P
Go go go and find out the hospital near to
S
your house
P
In order to reach there, keep the means of
S
transport ready day and night
P
Safety of mother and child is in the hands of S
family
P
% learnt new things from the TV spot
Total N
High
focus
20.1
76.0
46.5
52.3
4.7
89.4
57.7
37.0
7.8
84.7
13.5
80.3
9.7
79.5
9.8
80.6
60.3
327
Other
states
29.4
53.5
26.7
55.2
8.4
67.6
22.8
61.6
7.7
67.2
7.1
66.2
11.6
58.1
13.9
62.5
54.5
257
Rural
22.1
67.4
31.8
59.4
5.6
80.5
44.6
43.9
7.4
77.9
10.7
74.4
10.1
71.2
11.1
72.8
54.3
430
Urban
30.0
62.5
54.5
37.4
8.1
77.7
35.8
58.6
8.8
74.3
10.7
73.3
11.5
66.8
12.9
72.3
67.2
154
Total
24.2
66.1
37.8
53.6
6.3
79.8
42.3
47.8
7.7
77.0
10.7
74.1
10.5
70.1
11.6
72.6
57.7
584
66

9 Pages 81-90

▲back to top


9.1 Page 81

▲back to top


Annexure 9
Particulars
(S= Spontaneous response P= Prompt response)
Aspects liked in the TV spot
The message conveyed
Clarity of the message
Storyline
Presentation style
Characters
Music
Overall
Total N
% encountered difficulties in understanding
Language
Wordings
Message too fast
Too many messages
Other
Total N
High
focus
93.4
87.6
83.4
80.3
82.1
86.5
88.9
327
5.8
39.8
27.6
45.8
9.3
.8
19
Other
states
79.1
73.4
79.8
80.2
76.2
76.0
79.1
257
23.2
58.1
11.0
27.2
.5
13.2
60
Rural
86.8
80.5
80.8
77.9
77.4
82.0
83.3
430
13.1
51.3
9.7
29.9
1.9
14.0
57
Urban
87.9
83.9
84.4
86.8
85.1
81.5
88.0
154
14.5
59.7
28.1
36.4
4.6
.7
22
Total
87.1
81.4
81.8
80.3
79.5
81.9
84.6
584
13.5
53.7
15.0
31.7
2.7
10.2
79
Table 9.2: Messages recalled, aspects liked and difficulties encountered by men in TV spot:
Jagmag - ANC
Particulars
High Other Rural Urban Total
(S= Spontaneous response P= Prompt response) focus states
Messages
Keep in mind that all care is taken till the
S 41.7 55.4 42.1 57.4 47.3
time of delivery
P 55.7 44.1 55.7 41.8 51.0
It is necessary to give TT and iron tablets at S 55.3 33.5 44.7 50.0 46.5
right time
P 43.8 63.5 54.1 47.4 51.8
All listen to advice of ANM and ASHA
S 42.5 25.5 30.4 45.7 35.6
P 55.7 63.2 65.3 45.9 58.7
Delivering at hospital is the right decision
S 51.7 41.0 45.5 51.0 47.3
P 48.2 57.3 53.8 48.2 51.9
You also get attention of doctor, services and S 13.8 15.5 10.9 21.4 14.5
medicines at hospitals
P 81.1 79.3 83.7 73.7 80.3
Go go go and find out the hospital near to
S 16.9 14.9 12.5 23.1 16.1
your house
P 80.2 64.3 74.6 72.1 73.7
In order to reach there keep the means of
S 23.4 18.5 17.7 28.8 21.4
transport ready day and night
P 69.6 70.8 75.2 60.2 70.1
Safety of mother and child is in the hands of S 13.1 20.4 10.5 27.0 16.0
family
P 80.7 72.5 82.7 67.0 77.4
% learnt new things from the TV spot
71.7 77.1 70.0 81.6 73.9
Total N
173 117 192
98 290
Aspects liked in the TV spot
The message conveyed
91.8 91.5 92.5 90.0 91.7
Clarity of the message
85.4 78.9 80.8 86.6 82.8
67

9.2 Page 82

▲back to top


A Concurrent Evaluation of Phase II of the NRHM BCC Campaign
Particulars
(S= Spontaneous response P= Prompt response)
Storyline
Presentation style
Characters
Music
Overall
Total N
% encountered difficulties in understanding
Language
Wordings
Message too fast
Too many messages
Other
Total N
High
focus
85.9
89.7
84.2
88.5
88.1
173
4.3
1.3
17.6
68.9
31.1
1.3
7
Other
states
87.1
85.4
83.4
86.0
86.9
117
16.1
89.2
29.1
38.3
2.3
8.6
19
Rural Urban Total
86.6 85.9 86.4
87.1 89.6 87.9
83.1 85.4 83.8
88.8 84.8 87.5
88.7 85.4 87.6
192
98 290
9.6
8.0 9.1
71.8 46.8 64.4
29.3 17.6 25.8
49.9 39.8 46.9
0.0 35.2 10.4
0.0 22.0 6.5
18
8 26
Table 9.3: Percentage distribution of women and men by intended action after watching
TV spot: Jagmag - ANC
Intended actions
Women
% who intend to take action after watching TV spot
Total N
Administer TT during pregnancy
Consult with ASHA/ANM
Deliver the child in hospital
Arrange transport for delivery in advance
Acquire more information
Discuss with spouse/family members
Discuss with friends/relatives
Encourage others for availing services
Total N
Men
% who intend to take action after watching TV spot
Total N
Encourage spouse for TT during pregnancy
Consult with ASHA/ANM
Deliver the child in hospital
Arrange transport for delivery in advance
Acquire more information
Discuss with spouse/family members
Discuss with friends/relatives
Encourage others for availing services
Total N
High Other Rural Urban Total
focus states
44.8 47.1 43.1 53.3 45.8
327 257 430 154 585
43.1 35.7 33.7 53.4 39.8
30.0 28.9 25.7 38.0 29.5
21.9 22.8 24.4 17.6 22.3
6.1 14.5 4.5 22.1 9.9
12.4 23.1 18.2 15.1 17.3
26.3 31.2 28.5 28.7 28.5
35.2 45.1 39.7 39.7 39.7
17.7 4.1 9.9 15.2 11.6
147 121 186
82 268
44.8 58.6 42.6 65.8 50.4
173 117 192
98 290
42.1 61.4 37.5 68.7 51.2
50.3 28.5 41.2 38.6 40.0
34.5 52.7 30.5 59.1 43.1
28.5 36.9 22.4 45.3 32.5
28.0 26.6 21.2 35.2 27.4
27.2 25.6 40.3 8.8 26.4
27.3 24.0 36.5 12.1 25.7
10.1 0.0 6.1 4.4 5.4
77
69
82
64 146
68

9.3 Page 83

▲back to top


Annexure 10
Radheyshyam ki Motorcycle
(Newborn Care)
TV Spot
Annexure 10
Newborn care
A still from Radheyshyam ki Motorcycle
Table 10.1: Messages recalled, aspects liked and difficulties encountered by women in
TV spot: Radheyshyam ki Motorcycle - Newborn Care
Particulars
( S= Spontaneous response P= Prompt response)
Messages
S
Keep newborn with the mother
P
S
Initiate breastfeeding immediately after birth
P
S
Save the newborn from getting cold
P
S
Do not bathe the child till 24 hours of birth
P
Take special care if the baby’s weight is less
S
than 2 kg at the time of birth; such baby
P
should be given bath only after the umbilical
cord waves off
S
Listen to advices of ASHA and ANM
P
% learnt new things from the TV spot
Total N
High Other Rural Urban Total
focus states
49.7 37.7 40.9
50.1 50.0 52.9
46.1 31.3 37.7
52.1 61.1 57.5
19.2 20.6 16.3
75.9 64.8 74.2
17.2 11.4 12.6
75.0 64.7 72.3
10.6 5.6 9.3
80.1 73.2 76.5
51.1 43.8
43.1 50.1
41.8 38.9
53.8 56.5
28.8 19.9
61.4 70.5
18.9 14.4
64.1 70.0
5.1 8.1
77.2 76.7
11.2 6.7 10.4
78.5 57.7 66.6
74.4 64.6 68.6
379 363 530
5.5 9.0
72.7 68.3
72.1 69.6
212 742
69

9.4 Page 84

▲back to top


A Concurrent Evaluation of Phase II of the NRHM BCC Campaign
Particulars
( S= Spontaneous response P= Prompt response)
Aspects liked in the TV spot
The message conveyed
Clarity of the message
Storyline
Presentation style
Characters
Music
Overall
Total N
% encountered difficulties in understanding
Language
Wordings
Message too fast
Too many messages
Other
Total N
High Other Rural Urban Total
focus states
93.7 88.2 91.8
90.1 84.9 88.6
89.0 77.9 83.6
88.6 83.2 87.5
84.9 84.4 87.1
82.3 82.0 84.8
93.3 85.9 91.3
379 363 530
7.5 11.1 7.8
22.1 60.5 37.0
25.0 9.0 20.8
62.8 44.0 46.1
6.2 8.9 8.6
.2 1.5
28
41
41
89.0 91.0
85.0 87.5
83.6 83.6
82.1 86.0
78.6 84.6
75.6 82.2
85.6 89.7
212 742
13.0 9.3
56.0 44.7
7.9 15.6
60.2 51.8
6.5 7.8
2.3
.9
28 69
Table 10.2: Messages recalled, aspects liked and difficulties encountered by men in TV spot:
Radheyshyam ki Motorcycle - Newborn Care
Particulars
High
( S= Spontaneous response P= Prompt response) focus
Messages
Keep newborn with the mother
S 55.2
P 44.5
Initiate breastfeeding immediately after
S 52.9
birth
P 37.4
Save the newborn from getting cold
S 37.5
P 59.2
Do not bathe the child till 24 hours of birth
S 26.8
P 56.7
Take special care if the baby’s weight is less S 18.3
than 2 kg at the time of birth; such baby
P
should be given bath only after the umbilical
66.5
cord waves off
Listen to advices of ASHA and ANM
S 22.0
P 71.8
% learnt new things from the TV spot
73.0
Total N
156
Aspects liked in the TV spot
The message conveyed
90.4
Other
states
42.8
53.4
42.1
52.9
25.8
69.4
18.1
67.4
22.3
69.4
14.9
64.5
76.4
188
93.1
Rural Urban
44.8 57.7
53.2 39.7
46.9 47.2
45.3 47.2
28.4 37.9
67.1 58.9
17.8 32.6
65.1 56.2
17.0 29.2
69.7 64.1
17.1 20.7
68.4 66.3
75.2 74.0
246
98
96.2 80.9
Total
48.4
49.4
47.0
45.8
31.1
64.8
22.0
62.6
20.5
68.1
18.1
67.8
74.9
344
91.9
70

9.5 Page 85

▲back to top


Annexure 10
Particulars
High
( S= Spontaneous response P= Prompt response) focus
Clarity of the message
77.2
Storyline
81.5
Presentation style
84.3
Characters
78.1
Music
81.5
Overall
84.0
Total N
156
% encountered difficulties in understanding
7.9
Language
14.0
Wordings
47.9
Message too fast
53.9
Too many messages
19.2
Other
10.0
Total N
12
Other
states
87.3
92.2
90.4
87.9
90.3
94.8
188
11.7
73.9
13.8
21.3
2.8
0.0
22
Rural Urban
83.5
90.2
89.8
85.5
89.2
93.3
246
7.5
65.3
21.7
20.9
3.3
6.4
18
80.6
80.2
82.2
78.2
79.0
81.4
98
16.1
36.9
31.3
47.4
15.1
.3
16
Total
82.7
87.4
87.6
83.4
86.3
89.9
344
10.0
52.3
26.1
33.1
8.7
3.6
34
Table 10.3: Percentage distribution of women and men by intended action after watching TV
spot Radheyshyam ki Motorcycle - Newborn Care
Intended actions
Women
% who intend to take action after watching TV spot
Total N
Keep newborn child with the mother
Initiate breastfeeding immediately after birth
Protect the child from cold
Shall not bathe the baby till first 24 hours
Take birth weight of the child
Consult ASHA
Acquire more information
Discuss with spouse/family members
Discuss with friends/relatives
Encourage others for proper newborn care
Total N
Men
% who intend to take action after watching TV spot
Total N
Encourage for keeping newborn child with mother
Encourage for initiating breastfeeding immediately
after birth
High
focus
57.7
379
44.8
31.8
18.9
24.2
11.6
17.9
19.5
32.2
40.4
13.2
219
56.6
156
61.8
31.9
Other
states
51.4
362
22.9
20.5
19.5
34.9
12.9
27.0
13.6
41.3
45.5
12.9
186
57.0
188
29.0
29.2
Rural Urban
52.2 60.6
530 212
29.2 46.6
25.1 29.8
18.4 20.8
22.3 43.8
11.8 13.1
16.3 34.5
15.6 19.2
36.2 36.8
40.5 47.7
12.9 13.4
276 129
52.4 67.8
246 98
34.8 61.5
18.5 53.7
Total
54.6
742
34.7
26.6
19.2
29.1
12.2
22.1
16.8
36.4
42.8
13.1
405
56.8
344
43.9
30.4
71

9.6 Page 86

▲back to top


A Concurrent Evaluation of Phase II of the NRHM BCC Campaign
Intended actions
Encourage for protecting the child from cold
Encourage for not to bathe the baby till first 24 hours
Take birth weight of the child
Consult ASHA
Acquire more information
Discuss with spouse/family members
Discuss with friends/relatives
Encourage others for proper newborn care
Total N
High
focus
25.2
40.5
27.7
52.7
6.7
14.7
12.8
.4
89
Other
states
17.7
34.6
20.3
41.0
18.6
60.7
49.4
10.7
107
Rural Urban Total
18.2 26.7 21.1
21.5 68.0 37.3
13.7 43.0 23.7
36.5 65.3 46.3
12.3 14.9 13.2
45.1 29.8 39.9
40.2 18.6 32.9
.0 17.7 6.0
129
67 196
72

9.7 Page 87

▲back to top


Annexure 11
Mehendi (Family Planning)
TV Spot
Annexure 11
Sharing on family
planning and inter-
spousal communication
while applying Mehendi
Family planning- A
basket of choices by
NRHM
Table 11.1: Messages recalled, aspects liked and difficulties encountered by women in TV spot:
Mehendi - FP
Particulars
( S= Spontaneous response P= Prompt response)
Messages
We are happy as life’s every decision is taken S
jointly (by husband and wife) like when to
P
have child, spacing between children
Both of you meet ASHA in your village,
S
she will arrange to provide you complete
P
information on family planning methods
from nearby health center
Birth at right time and right interval give
S
mother and child good/complete health
P
High
focus
47.5
45.6
11.8
83.2
31.5
66.6
Other
states
52.2
39.4
7.4
79.6
15.5
68.8
Rural
50.0
41.0
5.1
84.0
15.7
70.8
Urban Total
51.7 50.6
42.7 41.5
16.7 8.9
74.4 80.8
32.1 21.0
62.3 68.0
Because, healthy nation/Bharat begins with S
9.5
9.1
5.9 16.1 9.2
healthy family …from you
P 86.0 66.5 75.5 68.5 73.2
% learnt new things from the TV spot
64.5 64.8 68.1 57.5 64.7
Total N
111 208 215 104 319
73

9.8 Page 88

▲back to top


A Concurrent Evaluation of Phase II of the NRHM BCC Campaign
Particulars
( S= Spontaneous response P= Prompt response)
Aspects liked in the TV spot
The message conveyed
Clarity of the message
Storyline
Presentation style
Characters
Music
Overall
Total N
% encountered difficulties in understanding
Language
Wordings
Message too fast
Too many messages
Total N
High
focus
94.4
80.8
83.2
89.1
80.6
76.0
87.2
111
8.3
61.9
21.1
37.3
.5
9
Other
states
90.3
82.9
87.5
85.5
87.7
81.7
87.2
208
14.0
84.9
9.2
28.4
.2
29
Rural
92.7
82.7
88.6
89.9
88.2
81.6
88.8
215
8.2
75.7
15.3
38.1
.3
17
Urban Total
89.6 91.7
81.0 82.2
80.7 86.0
80.2 86.7
79.0 85.2
75.8 79.7
83.8 87.2
104 319
20.1 12.0
82.6 79.5
9.3 12.0
24.2 30.5
.2 .2
21 38
Table 11.2: Messages recalled, aspects liked and difficulties encountered by men in TV spot:
Mehendi - FP
Particulars
( S= Spontaneous response P= Prompt
response)
Messages
We are happy as life’s every decision is
taken jointly (by husband and wife) like
when to have child, spacing between
children
Both of you meet ASHA in your village,
she will arrange to provide you complete
information on family planning methods
from nearby health centre
Birth at right time and right interval give
mother and the child good/complete
health
Because, healthy nation/Bharat begins
with healthy family …from you
% learnt new things from the TV spot
Total N
Aspects liked in the TV spot
The message conveyed
Clarity of the message
Storyline
High Other Rural Urban Total
focus states
S 39.5 40.2 34.3 48.3 39.9
P 54.0 53.1 56.8 48.3 53.4
S 17.9 13.1
7.9 25.3 14.9
P 73.5 74.6 76.7 70.4 74.2
S 26.0 24.1 11.9 44.2 24.8
P 66.6 59.7 70.1 50.6 62.3
S
8.4 15.1
6.8 21.3 12.6
P 81.4 71.0 79.2 68.3 74.9
60.4 69.4 67.0 64.4 66.0
64 105 101
68 169
94.4 90.3 91.4 92.6 91.9
86.7 82.5 83.9 84.3 84.1
86.8 83.7 85.1 84.4 84.8
74

9.9 Page 89

▲back to top


Annexure 11
Particulars
( S= Spontaneous response P= Prompt
response)
Presentation style
Characters
Music
Overall
Total N
% encountered difficulties in understanding
Language
Wordings
Message too fast
Too many messages
Other
Total N
High Other Rural Urban Total
focus states
88.0 80.1 81.3 85.6 83.1
84.9 79.4 82.4 80.1 81.5
88.4 81.5 87.6 78.8 84.1
93.8 83.2 87.1 87.2 87.2
64 105 101
68 169
5.8 14.1 13.0
7.9 11.0
0.0 56.1 42.5 50.9 44.9
42.4
2.2
6.9 18.2 10.2
63.9 62.8 62.0 65.7 63.0
17.5
5.8 11.4
0.0
8.1
2.6
0.0
0.0
1.8
.5
4
14
13
5
19
Table: 11.3: Percentage distribution of women and men by intended action after watching TV
spot Mehendi - FP
Intended actions
Women
% who intend to take action after watching TV spot
Total N
Interact with ASHA regarding family planning
Acquire more information
Discuss with spouse/family members
Discuss with friends/relatives
Encourage others for family planning/spacing
Encourage others for small family
Total N
Men
% who intend to take action after watching TV spot
Total N
Interact with ASHA regarding family planning
Acquire more information
Discuss with spouse/family members
Discuss with friends/relatives
Encourage others for family planning/spacing
Encourage others for small family
Total N
High
focus
47.6
110
41.7
33.6
27.8
29.6
38.9
48.9
53
68.5
64
30.7
12.7
32.5
40.1
47.7
29.1
43
Other
states
37.5
208
21.8
21.3
31.8
34.8
33.6
24.8
78
51.8
105
39.6
14.3
42.9
49.6
39.9
26.8
55
Rural Urban
39.1 45.1
215 104
25.9 36.7
25.7 27.2
33.5 24.4
33.8 30.8
35.0 37.0
26.3 49.3
84
47
56.6 60.2
101
68
26.2 49.0
7.3 22.6
26.5 54.9
30.7 65.9
48.3 36.3
20.2 38.5
57
41
Total
41.0
319
29.8
26.2
30.2
32.7
35.7
34.5
131
58.0
169
35.7
13.6
38.3
45.4
43.3
27.8
98
75

9.10 Page 90

▲back to top


Annexure 12
Holi (Family Planning)
TV Spot
Colorful
moments and
Copper T
Table 12.1: Messages recalled, aspects liked and difficulties encountered by women in TV spot:
Holi - FP
Particulars
( S= Spontaneous response P= Prompt
response)
Messages
There is no tension in the sweet moments S
of life because new Copper-T’s safety is
P
always with me
In case you want to become a mother for S
second time it can be easily removed also P
With this new Copper-T there is no
S
tension
P
Get more information from ANM of
S
nearby health center
P
Accept Copper-T from local trained health S
worker at the right time
P
S
This is the time of new and safe Copper-T
P
Because, healthy nation/Bharat begins
S
with healthy family …from you
P
% learnt new things from the TV spot
Total N
High Other Rural Urban Total
focus states
40.8 41.8 38.8 45.6 41.2
46.3 48.1 49.1 43.5 47.1
15.1 23.9 12.7 30.6 19.1
76.7 63.9 78.8 56.9 71.0
14.3 23.4 15.4 23.7 18.4
77.4 58.9 76.0 56.7 69.1
3.5 13.5
1.7 19.5
8.0
83.9 70.0 82.4 69.2 77.7
5.9
8.1
2.8 14.3
6.9
86.7 72.1 85.8 70.0 80.2
23.9 21.7 20.7 26.9 22.9
68.5 63.6 70.8 58.2 66.3
6.5 14.5
5.0 19.3 10.1
85.7 67.3 81.5 70.3 77.5
71.3 62.0 65.0 71.0 67.1
142 115 166
91 257
76

10 Pages 91-100

▲back to top


10.1 Page 91

▲back to top


Annexure 12
Particulars
( S= Spontaneous response P= Prompt
response)
Aspects liked in the TV spot
The message conveyed
Clarity of the message
Storyline
Presentation style
Characters
Music
Overall
Total N
% encountered difficulties in understanding
Language
Wordings
Message too fast
Too many messages
Other
Total N
High Other Rural Urban Total
focus states
91.8 94.5 98.0 83.9 93.0
84.7 84.6 86.6 81.2 84.7
87.9 82.7 88.0 81.1 85.6
91.1 81.7 89.3 82.6 86.9
82.7 89.8 91.4 75.8 85.9
76.3 85.1 87.2 67.6 80.2
87.0 88.9 94.2 76.4 87.8
142 115 166
91 257
7.2
7.6
6.0
9.9
7.4
54.9 63.2 54.6 63.2 58.7
27.7 32.8 42.5 16.5 30.1
18.9 25.9 22.3 22.1 22.2
10.8 28.9
40.0 19.1
3.2
2.8
1.5
10
9
10
9
19
Table 12.2: Messages recalled, aspects liked and difficulties encountered by men in TV spot:
Holi - FP
Particulars
( S= Spontaneous response P= Prompt response)
Messages
There is no tension in the sweet moments of S
life because new Copper-T’s safety is always P
with me
In case you want to become a mother for
S
second time it can be easily removed also
P
With this new Copper-T there is no tension S
P
Get more information from ANM of nearby S
health center
P
Accept Copper-T from local trained health S
worker at the right time
P
This is the time of new and safe Copper-T
S
P
Because, healthy nation/Bharat begins with S
healthy family …from you
P
% learnt new things from the TV spot
Total N
High
focus
41.5
47.9
42.4
57.1
24.8
63.0
5.0
93.2
12.3
85.6
33.7
59.3
9.4
77.9
73.8
46
Other
states
14.2
61.4
5.7
65.8
11.1
59.6
7.4
74.7
13.3
59.8
3.5
70.8
3.3
78.2
86.7
37
Rural
32.2
49.5
24.9
60.2
17.0
57.4
4.1
87.2
6.1
79.6
18.6
68.0
2.4
81.4
81.3
59
Urban Total
22.2 29.2
64.7 54.0
28.1 25.9
63.0 61.0
22.4 18.6
71.3 61.5
10.8 6.1
79.3 84.9
28.6 12.7
60.6 74.0
23.6 20.1
56.2 64.5
16.9 6.7
69.9 78.0
75.7 79.7
25 83
77

10.2 Page 92

▲back to top


A Concurrent Evaluation of Phase II of the NRHM BCC Campaign
Particulars
( S= Spontaneous response P= Prompt response)
Aspects liked in the TV spot
The message conveyed
Clarity of the message
Storyline
Presentation style
Characters
Music
Overall
Total N
% encountered difficulties in understanding
Language
Wordings
Message too fast
Too many messages
Total N
High
focus
76.7
69.2
67.5
66.6
69.2
74.0
66.5
46
5.2
5.5
32.5
24.4
88.8
2
Other
states
88.0
76.3
81.6
80.1
86.0
81.2
75.1
37
25.2
54.2
2.7
46.9
4.6
9
Rural Urban Total
88.1 66.8 81.8
76.7 62.2 72.4
78.3 63.2 73.9
78.0 60.2 72.7
80.1 69.0 76.8
86.1 56.2 77.3
74.7 60.1 70.4
59
25 83
12.8 17.6 14.2
48.0 38.2 44.4
.8 22.4 8.7
51.9 25.9 42.4
.6 57.8 21.5
7
4 12
Table: 12.3: Percentage distribution of women and men by intended action after watching TV
spot: Holi - FP
Intended actions
Women
% who intend to take action after watching TV
spot
Total N
Think of accepting Copper-T
Visit nearest health center for Copper-T
Consult ANM
Acquire more information
Discuss with spouse/family members
Discuss with friends/relatives
Encourage others for Copper-T
Total N
Men
% who intend to take action after watching
TV spot
Total N
High Other Rural Urban Total
focus states
37.8 48.3 37.0 52.3 42.5
142 115 166
91 257
28.9 43.0 21.2 55.1 36.1
9.1 33.1 15.5 28.8 21.3
14.4 18.9 15.0 18.8 16.7
38.4
7.6 31.0 12.2 22.8
30.1 45.9 30.3 48.1 38.1
38.5 43.6 41.0 41.1 41.1
28.5 26.0 13.5 44.8 27.2
54
55
61
48 109
38.5 44.2 36.0 53.3 41.1
46
38
59
25
84
78

10.3 Page 93

▲back to top


Annexure 12
Intended actions
Encourage spouse for accepting Copper-T
Visit nearest health center for Copper-T
Consult ANM
Acquire more information
Discuss with spouse/family members
Discuss with friends/relatives
Encourage others for Copper-T
Total N
High
focus
17
Other
states
17
Rural
10.8
27.5
40.3
21.3
25.6
78.8
.5
21
Urban
13
Total
21.3
32.5
33.9
19.1
36.1
70.4
.9
34
No tension after
Copper T
Copper T
79

10.4 Page 94

▲back to top


Annexure 13
Train (Family Planning)
TV Spot
In the train
Information on
OCPs, by a lady
doctor to another
co-passenger in
the train
Table 13.1: Messages recalled, aspects liked and difficulties encountered by women in TV spot:
Train - FP
Particulars
( S= Spontaneous response P= Prompt response)
Messages
This is new generation contraceptive pill
S
…Fully safe
P
Take one contraceptive pill daily; if you
S
forget, take 2 pills the next day
P
Around 8 crore women in the world use
S
contraceptive pills; you also use it
P
% learnt new things from the TV spot
Total N
Aspects liked in the TV spot
The message conveyed
Clarity of the message
Storyline
Presentation style
Characters
Music
Overall
Total N
High
focus
74.2
25.4
35.6
60.4
13.5
76.8
59.8
579
93.5
87.8
82.0
81.1
80.9
73.3
83.8
579
Other
states
57.9
35.2
22.8
68.0
8.0
78.4
64.1
357
96.5
87.0
83.8
86.4
85.7
79.2
88.2
357
Rural
65.3
31.3
29.6
64.4
11.1
77.7
63.1
651
96.6
88.7
83.9
85.3
83.8
77.6
87.2
651
Urban
74.2
24.3
33.1
60.7
12.3
76.7
57.5
285
90.3
84.8
79.9
78.1
80.2
70.9
81.5
285
Total
68.0
29.1
30.7
63.3
11.4
77.4
61.4
936
94.7
87.5
82.7
83.1
82.7
75.6
85.5
936
80

10.5 Page 95

▲back to top


Annexure 13
Particulars
( S= Spontaneous response P= Prompt response)
% encountered difficulties in understanding
Language
Wordings
Message too fast
Too many messages
Other
Total N
High
focus
5.1
40.9
17.4
60.4
.9
.4
30
Other
states
6.9
65.1
22.3
36.5
2.6
5.9
25
Rural
6.1
54.8
11.4
51.8
.4
3.7
40
Urban
5.1
44.2
42.1
43.1
5.0
.7
15
Total
5.8
51.9
19.6
49.5
1.7
2.9
55
Table 13.2: Messages recalled, aspects liked and difficulties encountered by men in TV spot:
Train - FP
Particulars
Messages
This is new generation contraceptive pill S
…Fully safe
P
Take one contraceptive pill daily; if you
S
forget, take 2 pills the next day
P
Around 8 crore women in the world use
S
contraceptive pills you also use it
P
% learnt new things from the TV spot
Total N
Aspects liked in the TV spot
The message conveyed
Clarity of the message
Storyline
Presentation style
Characters
Music
Overall
Total N
% encountered difficulties in understanding
Language
Wordings
Message too fast
Too many messages
Total N
High Other Rural Urban Total
focus states
73.4 59.1 64.8 71.9 67.4
24.9 37.9 32.4 26.9 30.4
27.2 45.1 24.0 53.9 34.7
69.3 51.2 72.2 42.9 61.7
27.1 19.8 23.3 25.3 24.0
64.5 69.5 68.0 64.2 66.6
56.4 76.0 67.3 59.8 64.6
198 145 220 123 343
92.6 96.4 94.3 94.1 94.2
85.1 87.8 86.1 86.4 86.2
85.5 88.9 84.6 91.0 86.9
89.4 83.5 86.9 86.9 86.9
88.8 86.0 91.1 81.4 87.6
84.1 85.9 88.0 79.3 84.9
92.4 91.7 92.5 91.3 92.1
198 145 220 123 343
2.4
8.4
4.6
5.4
4.9
34.6 59.7 49.8 57.1 52.7
18.7 35.6 34.9 24.8 30.9
65.1 39.4 49.6 42.1 46.6
14.3
0.0
0.0 10.1
4.0
5
12
10
7
17
81

10.6 Page 96

▲back to top


A Concurrent Evaluation of Phase II of the NRHM BCC Campaign
Table: 13.3: Percentage distribution of women and men by intended action after watching TV
spot: Train - FP
Intended actions
Women
% who intend to take action after watching
TV spot
Total N
Think of using oral pills
In case of forgetting pills on any day, shall take it
on next day
Acquire more information
Discuss with spouse/family members
Discuss with friends/relatives
Encourage others for oral pills
Total N
Men
% who intend to take action after watching
TV spot
Total N
Encourage spouse for use of oral pills
Acquire more information
Discuss with spouse/family members
Discuss with friends/relatives
Encourage others for oral pills
Total N
High Other Rural Urban Total
focus states
41.6 42.3 41.2 43.5 41.9
579 357 650 285 936
51.0 43.6 46.3 52.1 48.1
18.0 16.9 13.2 26.8 17.5
13.8
9.3 12.7 10.5 12.0
26.8 34.5 28.9 31.7 29.8
36.4 50.3 41.0 43.4 41.8
24.3 17.1 17.4 30.3 21.5
241 151 268 124 392
47.8 66.5 53.0 60.6 55.7
199 144 220 123 343
68.8 55.0 52.5 76.6 61.9
20.7 33.2 17.7 41.6 27.0
22.9 61.3 32.1 58.0 42.2
53.3 73.4 61.5 66.4 63.4
23.2 42.6 13.5 63.3 32.9
95
96 117
74 191
82

10.7 Page 97

▲back to top


Annexure 14
Annexure 14
Sachin Supriya (Family Planning)
TV Spot
Table 14.1: Messages recalled, aspects liked and difficulties encountered by women in TV spot:
Sachin and Supriya - FP
Particulars
(S= Spontaneous response P= Prompt response)
Messages
One should have a family where they can
S
give right education, better life and maintain P
health of children
If the family is small and there is spacing
S
between birth of children then both mother P
and children will remain healthy
Today there are also many choices like
S
condom, Copper-T, pill
P
Select any one of the methods on the basis S
of advice of doctor or health worker
P
Because, healthy nation/Bharat begins with S
healthy family …from you
P
% learnt new things from the TV spot
Total N
Aspects liked in the TV spot
The message conveyed
Clarity of the message
Celebrity
Storyline
Presentation style
Characters
Music
Overall
Total N
% encountered difficulties in understanding
Language
Wordings
Message too fast
Too many messages
Other
Total N
High
focus
35.8
62.0
41.8
53.1
28.2
69.9
13.2
72.4
20.8
74.3
71.7
87
90.2
71.5
74.2
82.7
87.2
86.9
77.5
90.2
87
10.3
9
Other
states
44.1
52.8
26.4
67.7
31.2
54.5
6.3
84.2
10.0
67.5
67.0
167
97.0
85.1
88.8
80.8
85.7
87.2
86.9
89.5
167
3.1
5
Rural
44.7
52.1
29.6
65.8
27.3
65.0
7.7
78.2
11.3
71.4
76.5
131
93.7
73.2
78.3
82.3
88.3
87.7
85.5
90.2
131
5.7
7
Urban
37.5
60.1
33.9
59.3
33.2
54.3
9.7
82.2
16.3
68.3
60.3
123
95.6
88.1
89.6
80.7
84.0
86.4
81.7
89.3
123
5.5
7
Total
41.2
56.0
31.7
62.7
30.2
59.8
8.7
80.1
13.7
69.9
68.6
254
94.6
80.4
83.8
81.5
86.2
87.1
83.7
89.8
254
5.6
14
83

10.8 Page 98

▲back to top


A Concurrent Evaluation of Phase II of the NRHM BCC Campaign
Table 14.2: Messages recalled, aspects liked and difficulties encountered by men in TV spot:
Sachin and Supriya - FP
Particulars
(S= Spontaneous response P= Prompt response)
Messages
One should have a family where they can
S
give right education, better life and maintain P
health of children
If the family is small and there is spacing
S
between birth of children then both mother P
and children will remain healthy
Today there are also many choices like
S
condom, Copper-T, pill
P
Select any one of the methods on the basis of S
advice of doctor or health worker
P
Because, healthy nation/Bharat begins with S
healthy family …from you
P
% learnt new things from the TV spot
Total N
Aspects liked in the TV spot
The message conveyed
Clarity of the message
Celebrity
Storyline
Presentation style
Characters
Music
Overall
Total N
% encountered difficulties in understanding
Language
Wordings
Message too fast
Too many messages
Other
Total N
High
focus
32.9
65.8
45.4
43.7
53.4
36.8
19.9
61.9
25.9
71.0
53.7
39
87.3
84.1
86.2
86.2
87.4
79.9
79.7
85.6
39
3.0
1
Other
states
33.9
62.1
20.2
78.8
32.8
58.3
5.6
80.9
8.7
77.5
77.2
56
93.1
90.3
90.8
90.4
87.8
89.2
87.3
91.2
56
6.6
4
Rural Urban
26.6 42.9
71.0 53.7
33.9 26.3
57.3 73.6
47.9 32.5
43.0 58.0
14.3
7.9
68.8 78.7
18.5 12.3
71.7 79.1
77.4 53.8
55
40
98.2 80.5
96.8 75.4
94.7 81.0
94.2 81.0
93.0 80.2
95.6 71.4
96.6 67.3
96.8 78.0
55
40
1.1 10.5
1
4
Total
33.5
63.7
30.7
64.2
41.4
49.4
11.6
73.0
15.9
74.8
67.4
95
90.7
87.7
88.9
88.6
87.6
85.4
84.2
88.8
95
5.1
5
84

10.9 Page 99

▲back to top


Annexure 14
Table: 14.3: Percentage distribution of women and men by intended action after watching TV
spot: Sachin and Supriya - FP
Intended actions
Women
% who intend to take action after watching
TV spot
Total N
Adopt small family
Ensure proper spacing between births
Accept some family planning method
Consult doctor/health center
Acquire more information
Discuss with spouse/family members
Discuss with friends/relatives
Encourage others for small family
Total N
Men
% who intend to take action after watching
TV spot
Total N
Adopt small family
Ensure proper spacing between births
Accept some family planning method
Consult doctor/health center
Acquire more information
Discuss with spouse/family members
Discuss with friends/relatives
Encourage others for small family
Encourage others for family planning/spacing
Total N
High Other Rural Urban Total
focus states
50.1 47.3 52.7 43.5 48.3
88 167 131 123 254
80.5 42.3 50.0 63.7 56.0
34.7 12.8 19.7 22.0 20.7
39.4 25.1 27.7 33.4 30.2
24.5 19.3 17.6 25.8 21.2
16.5 18.6 20.2 14.8 17.8
24.3 29.5 21.8 35.2 27.7
13.1 38.0 30.9 26.6 29.1
9.8 30.1 11.5 37.3 22.8
44
79
69
54 123
64.2 55.2 63.8 52.4 59.0
39
56
55
40
95
62.5 35.4 29.9 77.2 47.7
21.5 19.3 11.7 34.5 20.3
39.8 29.6 23.3 52.4 34.2
19.7
3.5
9.1 13.8 10.9
11.1 30.7
7.3 45.8 21.8
7.9 16.2 10.2 16.1 12.4
48.4 82.6 65.5 69.7 67.1
44.4 71.5 67.6 45.3 59.2
16.8 21.4 11.3 32.5 19.3
25
31
35
21
56
85

10.10 Page 100

▲back to top


Annexure 15
Juhi Chawla (Family Planning)
TV Spot
Juhi Chawla -
film actress
Juhi Chawla
sensitizing on
the basket of
options for
family planning
Table 15.1: Messages recalled, aspects liked and difficulties encountered by women in TV spot:
Juhi Chawla - Family Planning
Particulars
High Other Rural Urban Total
(S= Spontaneous response P= Prompt response) focus states
Messages
Daughter or son; good care of children is taken S 41.3 39.8 39.2 41.4 40.3
in a small family
P 53.2 58.1 57.1 56.3 56.7
By spacing the birth of children for two to three S 39.1 28.9 25.3 38.9 31.9
years mother’s health is maintained
P 54.4 64.3 68.7 53.6 61.4
Frequent births badly affect the health of the S 24.8 31.8 24.0 35.8 29.7
mother
P 63.9 64.7 71.6 56.9 64.5
If children are born at close birth intervals, they S 15.0 18.9 16.4 19.3 17.8
remain weak from the time of birth onwards
P 66.6 72.0 74.7 65.9 70.4
At your convenience and doctor’s advice select S 5.7 8.8 7.9 7.8 7.9
any one of the family planning methods
P 71.5 80.0 76.6 78.5 77.5
For permanent protection, operation is an easy S 7.0 17.7 10.0 19.4 14.6
and reliable method
P 69.4 66.4 72.6 61.6 67.3
Government has made available all the facilities S 4.4 7.8 7.2 6.4 6.8
at your nearyby health centre … now what is
the delay for
P 67.9 77.8 75.3 74.5 74.9
Healthy Nation/Bharat begins with a healthy S 11.8 14.1 11.5 15.6 13.5
family …from you
P 71.5 68.0 70.5 67.5 69.0
% learnt new things from the TV spot
70.8 69.9 74.5 65.5 70.1
Total N
87 211 153 145 298
Aspects liked in the TV spot
The message conveyed
86
88.4 95.3 96.7 89.6 93.3

11 Pages 101-110

▲back to top


11.1 Page 101

▲back to top


Annexure 15
Particulars
(S= Spontaneous response P= Prompt response)
Clarity of the message
Celebrity
Storyline
Presentation style
Characters
Music
Overall
Total N
% encountered difficulties in understanding
Language
Wordings
Message too fast
Too many messages
Other
Total N
High
focus
82.7
83.5
74.9
76.9
73.8
60.2
86.4
87
19.4
13.2
32.9
53.0
3.5
.3
17
Other
states
87.9
90.1
81.0
85.9
85.2
84.0
87.8
211
7.4
77.2
17.5
10.2
6.8
3.8
16
Rural Urban
89.1 83.5
88.7 87.6
81.9 76.3
83.8 82.7
80.9 82.8
80.4 73.5
89.1 85.5
153 145
12.8 8.8
45.8 40.8
34.7 11.4
28.8 38.2
12.9
5.1
20
13
Total
86.4
88.2
79.2
83.3
81.8
77.0
87.4
298
10.9
43.8
25.5
32.5
5.1
2.0
33
Table 15.2: Messages recalled, aspects liked and difficulties encountered by men in TV spot:
Juhi Chawla - Family Planning
Particulars
High Other Rural Urban Total
(S= Spontaneous response P= Prompt response) focus states
Messages
Daughter or son; good care of children is taken S 46.1 64.6 61.4 51.3 57.0
in a small family
P 52.2 32.9 36.2 46.8 40.8
By spacing the birth of children for two to three S 51.8 29.8 35.2 43.7 38.9
years mother’s health is maintained
P 43.3 57.7 57.4 44.4 51.8
Frequent births badly affect the health of the
mother
S 41.7 20.4 28.6 29.8 29.2
P 57.3 68.7 68.1 58.7 64.0
If children are born at close birth intervals, they S 19.8 15.1 14.4 20.5 17.0
remain weak from the time of birth onwards
P 75.2 73.4 78.5 68.3 74.1
At your convenience and doctor’s advice select S 15.9 10.8 14.1 11.3 12.9
any one of the family planning methods
P 65.9 72.0 71.0 67.5 69.5
For permanent protection, operation is an easy S 29.4 12.8 21.2 17.6 19.6
and reliable method
P 55.9 70.7 66.9 61.7 64.6
Government has made available all the facilities S 5.3 15.0 5.8 17.8 11.0
at your nearby health centre … now what is the P 62.9 76.5 75.5 65.0 70.9
delay for
Healthy Nation/Bharat begins with a healthy S 33.9 19.0 21.0 30.5 25.1
family …from you
P 43.4 65.3 62.1 48.8 56.3
% learnt new things from the TV spot
73.6 62.5 66.2 68.2 67.1
Total N
48
68
66
50 116
Aspects liked in the TV spot
The message conveyed
86.0 92.7 94.0 84.7 90.0
Clarity of the message
79.2 81.5 81.1 79.8 80.5
87

11.2 Page 102

▲back to top


A Concurrent Evaluation of Phase II of the NRHM BCC Campaign
Particulars
(S= Spontaneous response P= Prompt response)
Celebrity
Storyline
Presentation style
Characters
Music
Overall
Total N
% encountered difficulties in understanding
Language
Wordings
Message too fast
Too many messages
Total N
High
focus
84.5
80.8
87.2
76.1
77.6
80.9
48
6.2
77.2
24.3
.3
3
Other
states
90.9
79.6
73.7
80.9
71.0
83.8
68
15.3
59.9
38.3
14.6
9.0
10
Rural
90.2
81.3
78.9
79.4
77.1
85.2
66
15.9
70.4
30.7
17.9
10
Urban
85.7
78.5
79.6
78.2
69.4
79.1
50
5.9
40.0
26.8
12.6
32.0
3
Total
88.2
80.1
79.2
78.9
73.7
82.6
116
11.5
63.7
29.9
16.7
7.1
13
Table: 15.3: Percentage distribution of women and men by intended action after watching
TV spot: Juhi Chawla - Family Planning
Intended actions
Women
% who intend to take action after watching TV spot
Total N
Adopt small family
Ensure proper spacing between births
Accept some family planning method
Acquire more information
Discuss with spouse/family members
Discuss with friends/relatives
Encourage others for small family
Encourage others for family planning/spacing
Total N
Men
% who intend to take action after watching TV spot
Total N
Adopt small family
Ensure proper spacing between births
Accept some family planning method
Acquire more information
Discuss with spouse/family members
Discuss with friends/relatives
Encourage others for small family
Encourage others for family planning/spacing
Total N
High Other Rural Urban Total
focus states
47.0 38.8 32.9 49.9 41.2
53.7 50.2 28.7 67.2 51.3
38.8 7.3 21.5 15.3 17.8
34.6 33.6 20.4 43.5 34.0
21.2 23.7 15.6 28.0 22.9
21.4 45.1 40.4 34.8 37.1
36.7 58.4 50.3 51.7 51.2
39.6 26.6 19.3 39.1 31.0
22.9 23.0 23.9 22.2 22.9
41
82
50
73 123
42.6 39.2 30.7 53.5 40.6
48
68
66
50 116
37.0 71.9 32.9 74.7 56.8
14.4 25.2 6.4 31.0 20.5
14.3 42.1 5.5 48.5 30.1
6.4 45.3 20.7 34.4 28.5
20.9 50.1 26.4 45.7 37.5
39.0 50.9 35.6 53.3 45.8
37.4 30.4 30.5 35.5 33.4
6.0 44.9 8.9 42.6 28.2
20
27
20
27
47
88

11.3 Page 103

▲back to top


Annexure 16
Pragati on Medical Tour
(NRHM/Health Services)
TV Spot
Annexure16
Pragati proudly
sharing with
her father the
improvement of
health services
in the country
NRHM reaching
to all the corners
of the country
Table 16.1: Messages recalled, aspects liked and difficulties encountered by women in TV spot:
Pragati on Medical Tour - NRHM/Health Services
Particulars
High Other Rural Urban Total
(S= Spontaneous response P= Prompt response) focus states
Messages
Feel proud to see the improvement in health S 45.5 31.6 34.4 40.4 36.5
services in such small villages
P 48.6 60.4 58.5 52.2 56.2
Fast spreading health centers
S 38.1 15.4 19.5 30.3 23.4
P 54.9 69.1 67.6 57.8 64.1
Better services, instruments, doctors and
S 20.1 10.6 12.4 16.6 13.9
nurses
P 73.3 74.5 76.2 70.3 74.1
Care of new born
S 20.8 18.9
5.3 45.2 19.6
P 77.7 72.5 86.7 52.2 74.4
Increased utilization of hospitals for
S 13.9 10.9
7.2 20.4 11.9
delivery
P 83.1 76.4 85.8 66.3 78.8
Increasing OPD services
S
3.2
6.6
3.0
9.8
5.4
P 66.0 62.7 60.8 69.5 63.9
Due to increased funds, people themselves S
4.3
6.1
1.7 12.2
5.5
take decisions to fulfill the local needs by
forming RKSs and VHSCs
P 58.1 55.5 51.8 64.7 56.4
% learnt new things from the TV spot
64.2 63.0 58.6 72.2 63.4
Total N
54
99
98
55 153
Aspects liked in the TV spot
The message conveyed
92.7 91.7 92.9 90.5 92.1
89

11.4 Page 104

▲back to top


A Concurrent Evaluation of Phase II of the NRHM BCC Campaign
Particulars
(S= Spontaneous response P= Prompt response)
Clarity of the message
Storyline
Presentation style
Characters
Music
Overall
Total N
% encountered difficulties in understanding
Language
Wordings
Message too fast
Too many messages
Other
Total N
High
focus
75.4
74.9
86.8
88.1
72.6
87.1
54
5.8
3
Other
states
84.2
75.8
85.6
82.4
73.9
88.6
99
10.3
10
Rural Urban
81.0 81.3
73.1 79.8
85.8 86.4
86.6 80.4
76.2 68.5
88.0 88.1
98
55
10.2
6.0
10
3
Total
81.1
75.5
86.0
84.4
73.5
88.0
153
8.7
13
Table 16.2: Messages recalled, aspects liked and difficulties encountered by men in TV spot:
Pragati on Medical Tour - NRHM/Health Services
Particulars
(S= Spontaneous response P= Prompt response)
Messages
Feel proud to see the improvement in health S
services in such small villages
P
Fast spreading health centers
S
P
Better services, instruments, doctors, nurses S
P
Care of new born
S
P
Increased utilization of hospitals for delivery S
P
Increasing OPD services
S
P
Due to increased funds, people themselves
S
take decisions to fulfill the local needs by
P
forming RKSs and VHSCs
% learnt new things from the TV spot
Total N
Aspects liked in the TV spot
The message conveyed
Clarity of the message
Storyline
High
focus
47.8
48.7
45.1
50.0
43.6
53.9
11.2
87.3
13.3
84.4
13.1
75.6
0.3
84.5
59.3
42
78.3
76.6
86.7
Other
states
36.1
59.3
24.9
52.4
29.3
61.7
27.7
64.3
17.9
72.6
23.3
53.3
10.0
71.4
48.7
44
96.9
82.1
81.0
Rural Urban
41.6 42.6
53.3 55.8
31.7 41.8
52.5 48.2
38.1 32.4
55.5 63.1
21.1 16.1
73.9 79.7
10.0 28.3
83.4 67.2
18.7 17.3
66.5 59.2
1.4 13.8
86.1 59.5
59.2 42.1
59
27
97.0 66.8
92.2 50.5
92.9 63.5
Total
41.9
54.1
34.8
51.2
36.3
57.9
19.6
75.6
15.6
78.4
18.2
64.3
5.2
77.9
54.0
86
87.7
79.3
83.8
90

11.5 Page 105

▲back to top


Annexure16
Particulars
(S= Spontaneous response P= Prompt response)
Presentation style
Characters
Music
Overall
Total N
% encountered difficulties in understanding
Language
Wordings
Message too fast
Too many messages
Total N
High
focus
77.9
85.6
86.4
77.6
42
2.0
42.7
57.3
57.3
57.3
1
Other
states
88.7
90.0
86.8
91.2
44
6.5
44.9
12.6
44.4
0.0
3
Rural Urban
94.0 59.5
93.5 74.9
93.5 71.2
96.7 57.0
59
27
3.6
5.8
27.3 68.2
14.1 35.2
58.6 31.8
0.0 31.8
2
2
Total
83.4
87.8
86.6
84.5
86
4.3
44.4
22.9
47.4
13.2
4
Table 16.3: Percentage distribution of women and men by intended action after watching
TV spot: Pragati on Medical Tour - NRHM/Health Services
Intended actions
Women
% who intend to take action after watching TV spot
Total N
Acquire more knowledge about health services
Visit Government hospitals
Interact with RKSs
Interact with VHSCs
Acquire more information
Discuss with spouse/family members
Discuss with friends/relatives
Encourage others for using Government
health services
Total N
Men
% who intend to take action after watching TV spot
Total N
Acquire more knowledge about health services
Visit Government hospitals
Interact with RKSs
Interact with VHSCs
Acquire more information
Discuss with spouse/family members
Discuss with friends/relatives
Encourage others for using Government
health services
Total N
High Other Rural Urban Total
focus states
54.2 37.9 43.4 44.1 43.7
54
99
98
55 153
46.7 20.4 31.6 32.4 31.9
9.8 17.5 10.0 21.5 14.1
9.0 26.5
4.0 45.0 18.8
7.1 23.9
4.7 37.4 16.5
18.3 23.8 24.0 16.8 21.4
30.8 49.0 44.7 34.4 41.0
17.3 53.1 40.6 31.7 37.4
27.0 31.0 13.7 56.8 29.2
29
38
43
24 67
33.6 43.3 42.6 29.4 38.5
42
44
59
27 86
40.6
50.6
44.0
36.6
22.5
35.9
22.7
33.8
39.6
35.8
30.7
38.6
29.1
30.1
3.7
12.5
14
19
25
8 33
91

11.6 Page 106

▲back to top


Annexure 17
Ek Savera Ek Akash
(NRHM/Health Services)
TV Spot
A still from
‘Ek Savera Ek
Akash’
Table 17.1: Messages recalled, aspects liked and difficulties encountered by women in TV spot:
Ek Savera Ek Akash - NRHM/Health Services
Particulars
(S= Spontaneous response P= Prompt response)
Messages
Healthy Nation/Bharat begins with healthy S
family
P
Trained health worker is available in every
S
village
P
Every mother should get proper antenatal
S
care
P
See healthy child in lap of every mother
S
P
Every family should get better nutrition
S
P
Let us take the oath that better health
S
services reach every village
P
National Rural Health Mission
S
P
% learnt new things from the TV spot
Total N
High Other Rural Urban Total
focus states
25.4 25.8 23.7 28.9 25.7
71.2 60.5 66.8 60.3 64.4
12.6 12.9 12.1 14.0 12.8
86.8 72.5 75.9 80.6 77.7
53.6 15.3 28.4 30.6 29.2
46.1 75.5 64.9 64.9 64.9
9.9 18.4 2.3 37.4 15.3
75.0 67.0 78.4 55.6 69.9
8.6 9.9 7.6 12.6 9.5
74.2 76.1 72.0 81.2 75.4
22.4 8.1 11.3 16.8 13.3
60.6 68.2 60.2 74.3 65.4
6.8 6.4 4.5 10.0 6.5
92.3 58.8 75.3 63.6 71.0
87.7 65.5 77.2 67.5 73.6
44
78
77
45 122
92

11.7 Page 107

▲back to top


Annexure17
Particulars
(S= Spontaneous response P= Prompt response)
Aspects liked in the TV spot
The message conveyed
Clarity of the message
Storyline
Presentation style
Characters
Music
Overall
Total N
% encountered difficulties in understanding
Language
Wordings
Message too fast
Too many messages
Total N
High Other Rural Urban Total
focus states
99.1 75.3 83.2 85.2 84.0
61.4 79.3 73.1 72.3 72.8
74.3 79.0 76.7 78.4 77.3
87.2 83.6 89.2 77.6 84.9
62.6 77.6 73.1 70.5 72.1
72.7 76.4 83.0 61.7 75.1
80.7 85.3 87.6 76.8 83.6
44
78
77
45 122
15.3
85.2
11.7
14.1
2.3
2
17
15
4
19
Table 17.2: Messages recalled, aspects liked and difficulties encountered by men in TV spot:
Ek Savera Ek Akash - NRHM/Health Services
Particulars
(S= Spontaneous response P= Prompt response)
Messages
Healthy Nation/Bharat begins with healthy S
family
P
Trained health worker is available in every
S
village
P
Every mother should get proper antenatal
S
care
P
See healthy child in the lap of every mother S
P
Every family should get better nutrition
S
P
Let us take the oath that better health services S
reach every village
P
National Rural Health Mission
S
P
% learnt new things from the TV spot
Total N
Aspects liked in the TV spot
The message conveyed
High
focus
36.2
62.9
58.0
41.4
34.0
57.3
63.4
36.6
30.1
68.8
54.0
39.9
3.2
79.1
59.6
16
95.4
Other
states
25.0
55.8
25.1
48.3
31.6
62.9
19.7
61.4
17.7
62.6
24.1
52.4
32.1
63.7
85.4
83
92.0
Rural Urban
16.9 38.4
54.4 60.1
14.8 49.1
44.6 50.1
13.1 54.2
76.8 44.6
11.7 44.8
59.0 55.2
9.9 31.4
61.5 66.1
14.6 45.9
51.9 48.6
6.4 51.8
85.7 43.5
80.0 82.5
53
46
88.3 97.6
Total
26.8
57.0
30.6
47.1
32.0
62.0
26.9
57.2
19.8
63.6
29.1
50.3
27.3
66.3
81.1
99
92.6
93

11.8 Page 108

▲back to top


A Concurrent Evaluation of Phase II of the NRHM BCC Campaign
Particulars
(S= Spontaneous response P= Prompt response)
Clarity of the message
Storyline
Presentation style
Characters
Music
Overall
Total N
% encountered difficulties in understanding
Language
Wordings
Message too fast
Too many messages
Total N
High
focus
70.2
79.7
99.3
74.6
72.5
95.2
16
0.0
0
Other
states
91.3
93.8
95.3
88.9
88.2
95.1
83
7.9
Rural
84.7
91.7
93.2
83.4
82.2
91.2
53
11.8
Urban
91.6
91.2
99.3
90.1
89.5
99.9
46
.5
Total
87.8
91.4
96.0
86.5
85.6
95.2
99
6.6
7
7
0
7
Table: 17.3: Percentage distribution of women and men by intended action after watching
TV spot: Ek Savera Ek Akash - NRHM/Health Services
Particulars
Women
% who intend to take action after watching
TV spot
Total N
Acquire more knowledge about health services
Visit Government hospitals
Discuss with spouse/family members
Discuss with friends/relatives
Encourage others for using Government
health services
Total N
Men
% who intend to take action after watching
TV spot
Total N
Acquire more knowledge about health services
Visit Government hospitals
Discuss with spouse/family members
Discuss with friends/relatives
Encourage others for using Government
health services
Total N
High Other Rural Urban Total
focus states
37.4 46.3 46.7 36.9 43.1
44
78
77
45 122
92.8 39.7 52.9 64.0 56.4
51.2 12.3 26.9 19.4 24.5
34.1 50.1 24.5 89.2 45.1
3.4 66.8 50.9 38.1 46.8
.5 22.0
.9 46.0 15.2
44
78
77
45 122
58.0 67.9 54.7 79.8 66.2
16
83
53
46
99
60.8 18.3 90.4 58.3
44.4 58.7 23.0 38.9
91.5 83.7 83.7 83.7
52.0 24.3 74.7 52.3
55.3 13.5 80.2 50.5
10
56
29
37
66
94

11.9 Page 109

▲back to top


Annexure 18
Juhi Chawla (Immunization)
TV Spot
Annexure18
Juhi Chawla (Immunization 1a)
Immunization 1b
Immunization 1c
Table 18.1: Messages recalled, aspects liked and difficulties encountered by women in TV spot:
Juhi Chawla - Immunization
Particulars
High
(S= Spontaneous response P= Prompt response) focus
Messages
Come out of your home and immunize your
S 46.4
child
P 49.3
In the first year, vaccination/immunization for S 31.4
4 times not 2 or 3
P 64.1
After immunization some children might get S 8.9
fever but it is important, as it protects the child P 86.6
from dangerous diseases
Immunization is the only protection against
S 20.3
measles
P 77.0
At the age of 9 month it is necessary to
S 13.1
administer measles vaccine and if it is not
administered due to some reason then go
P 78.3
immediately for administering it
Measles make your child weak and susceptible S 8.8
to diarrhea and pneumonia
P 83.2
Immunization at the right time will protect
S 16.6
from measles
P 75.5
Other
states
35.3
56.4
29.9
49.5
10.5
79.9
13.8
71.2
15.0
62.5
5.7
70.0
12.4
70.2
Rural
40.9
52.9
25.8
58.8
8.8
84.9
15.8
73.2
10.9
70.3
7.1
75.1
13.9
72.1
Urban Total
39.9 40.6
53.3 53.0
39.6 30.6
51.9 56.4
11.6 9.8
79.6 83.1
19.0 16.9
75.3 74.0
20.2 14.1
69.4 70.0
7.1 7.1
78.4 76.3
15.4 14.4
73.8 72.7
95

11.10 Page 110

▲back to top


A Concurrent Evaluation of Phase II of the NRHM BCC Campaign
Particulars
High
(S= Spontaneous response P= Prompt response) focus
For immunization, contact ANM, ASHA or AWW S 10.9
P 78.3
May god save such mothers from bad eyes
S 14.9
P 70.6
% learnt new things from the TV spot
70.1
Total N
382
Aspects liked in the TV spot
The message conveyed
91.4
Clarity of the message
83.3
Celebrity
86.4
Storyline
81.8
Presentation style
79.3
Characters
79.9
Music
68.3
Overall
83.5
Total N
382
% encountered difficulties in understanding
8.7
Language
25.5
Wordings
32.6
Message too fast
45.1
Too many messages
5.0
Other
.2
Total N
33
Other
states
10.7
66.1
7.7
64.0
57.4
423
93.5
84.3
87.3
83.0
84.4
84.0
79.2
84.7
423
13.5
87.9
5.9
8.4
5.6
6.8
57
Rural
10.7
71.9
11.3
66.4
61.3
524
93.9
84.1
88.9
84.4
82.1
83.4
75.2
85.9
524
12.6
67.4
15.1
16.6
3.7
5.9
66
Urban Total
10.9 10.8
71.9 71.9
10.7 11.1
68.6 67.1
67.3 63.4
281 805
89.9 92.5
83.2 83.8
83.1 86.9
78.7 82.4
81.6 82.0
79.7 82.1
71.8 74.0
80.8 84.1
281 805
8.7 11.2
58.8 65.0
17.3 15.7
35.8 21.8
9.9 5.4
.2 4.4
24
90
Table 18.2: Messages recalled, aspects liked and difficulties encountered by men in TV spot:
Juhi Chawla - Immunization
Particulars
(S= Spontaneous response P= Prompt response)
Messages
Come out of home and immunize your child
S
P
In the first year, vaccination/immunization for S
4 times not 2 or 3
P
After immunization some children might get
S
fever but it protects the entire life of the child P
from dangerous diseases
High
focus
51.6
46.6
42.7
52.0
19.8
63.5
Other
states
30.3
43.3
30.0
45.2
18.1
57.1
Rural
39.4
43.4
36.7
45.1
20.8
57.6
Urban
41.3
49.5
32.2
59.1
12.0
67.9
Total
39.8
44.7
35.7
48.2
18.8
59.9
96

12 Pages 111-120

▲back to top


12.1 Page 111

▲back to top


Annexure18
Particulars
(S= Spontaneous response P= Prompt response)
There is only protection against measles and
S
that is immunization
P
At the age of 9 month it is necessary to
S
administer measles vaccine and if it is not
P
administered due to some reason then go
immediately for administering it
Measles make your child weak and susceptible S
to diarrhea and Pneumonia
P
Immunization at right time will protect from
S
measles
P
For immunization contact ANM or ASHA or
S
AWW
P
May god save such mothers from bad eyes
S
P
% learnt new things from the TV spot
Total N
Aspects liked in the TV spot
The message conveyed
Clarity of the message
Celebrity
Storyline
Presentation style
Characters
Music
Overall
Total N
% encountered difficulties in understanding
Language
Wordings
Message too fast
Too many messages
Total N
High
focus
42.6
47.0
26.6
68.4
24.8
67.5
43.0
50.8
27.2
64.5
20.2
64.5
69.4
114
95.0
83.1
83.4
81.8
80.1
82.3
76.2
90.1
114
5.2
6.7
21.9
15.4
77.9
6
Other
states
20.8
54.5
14.4
57.2
10.0
60.3
16.5
57.9
10.9
58.5
9.0
57.2
57.3
141
96.6
87.9
91.1
90.0
85.2
89.1
85.7
95.1
141
14.1
60.2
42.9
19.8
18.2
20
Rural
32.4
48.3
20.3
59.5
17.6
62.0
31.2
51.9
19.9
57.9
14.5
57.1
66.0
198
98.5
88.1
90.2
89.8
86.8
89.5
86.6
96.1
198
9.8
49.8
46.0
20.6
25.2
19
Urban
23.8
61.3
18.1
71.3
13.1
68.8
18.4
64.6
12.0
72.6
12.5
71.9
51.4
57
86.9
77.9
79.0
74.3
69.6
74.3
63.5
81.8
57
11.3
43.0
15.0
13.5
51.2
7
Total
30.5
51.2
19.8
62.2
16.6
63.5
28.3
54.8
18.2
61.2
14.0
60.5
62.7
255
95.9
85.8
87.7
86.3
83.0
86.1
81.4
92.9
255
10.1
48.0
38.2
18.8
31.7
26
97

12.2 Page 112

▲back to top


A Concurrent Evaluation of Phase II of the NRHM BCC Campaign
Table 18.3: Percentage distribution of women and men by intended action after watching
TV spot: Juhi Chawla - Immunization
Intended actions
Women
% who intend to take action after watching TV spot
Total N
Administer 4 vaccines to the child in the first 1 year of
child
Get child immunized against measles
Consult ASHA/ANM/AWW
Acquire more information
Discuss with spouse/family members
Discuss with friends/relatives
Encourage others for availing services
Total N
Men
% who intend to take action after watching TV spot
Total N
Administer 4 vaccines to the child in the first 1 year
Get child immunized against measles
Consult ASHA/ANM/AWW
Acquire more information
Discuss with spouse/family members
Discuss with friends/relatives
Encourage others for availing services
Total N
High
focus
48.2
382
49.2
31.6
26.2
32.0
27.7
22.2
11.3
184
58.8
114
55.0
40.2
23.1
24.0
19.1
33.5
20.3
67
Other
states
51.1
423
50.3
14.6
23.4
30.6
47.1
35.4
7.2
217
62.7
141
31.3
36.5
18.7
13.2
59.9
58.4
7.3
89
Rural Urban
51.8 45.8
524 281
46.2 57.4
22.2 23.1
19.6 35.4
33.0 27.7
40.8 32.6
25.3 37.9
5.3 17.2
272 129
60.0 64.4
198
57
40.4 44.9
36.8 42.1
16.0 35.3
18.1 17.1
47.6 25.6
48.0 46.8
11.1 18.7
119
37
Total
49.7
805
49.8
22.5
24.7
31.3
38.2
29.3
9.1
401
61.0
255
41.5
38.1
20.6
17.8
42.4
47.7
12.9
156
98

12.3 Page 113

▲back to top


Annexure 19
Mona Singh (Immunization)
TV Spot
Annexure19
Mona Singh
talks of the
TT injection
Encouraging the
mother-in-law
for taking the
daughter-in -law
to the health care
centre for her
vaccination
Table 19.1: Messages recalled, aspects liked and difficulties encountered by women in TV spot:
Mona Singh - Immunization
Particulars
(S= Spontaneous response P= Prompt response)
High Other Rural Urban Total
focus states
Messages
Now you get free AD injection for each
immunization – now there is no fear of infection
S 47.9
P 45.0
34.3 42.4
56.8 49.9
30.9 38.0
59.5 53.6
It is your right to ask for free AD injection for your child S 33.9 10.9 13.3 23.4 17.2
P 54.3 76.4 74.6 63.4 70.4
Free AD injection is totally safe
S 20.1 17.1 16.2 20.7 17.9
P 70.8 67.7 72.3 62.5 68.6
Just one injection one time so what to fear of
S 20.7 30.5 27.0 29.1 27.8
P 65.0 57.8 60.3 59.0 59.8
On confirmation of pregnancy it is extremely
necessary to take 2 TT injection so that at time of
birth both mother and child are safe
S 18.9
P 77.4
14.8 9.9
76.2 84.5
25.7 15.9
63.7 76.6
This way in next month remember to take second
dose of TT injection
S 17.2
P 76.9
9.8 8.5
79.9 81.6
17.3 11.9
75.1 79.1
For TT injection contact ANM, ASHA or AWW
S 15.9 5.8 3.4 16.9 8.5
P 73.0 70.1 76.5 61.8 70.9
99

12.4 Page 114

▲back to top


A Concurrent Evaluation of Phase II of the NRHM BCC Campaign
Particulars
(S= Spontaneous response P= Prompt response)
May god save such mothers from bad eyes
% learnt new things from the TV spot
Total N
Aspects liked in the TV spot
The message conveyed
Clarity of the message
Celebrity
Storyline
Presentation style
Characters
Music
Overall
Total N
% encountered difficulties in understanding
Language
Wordings
Message too fast
Too many messages
Other
Total N
High Other Rural Urban Total
focus states
S 12.0 10.1 12.1 8.3 10.7
P 69.4 64.5 63.7 69.3 65.8
73.8 67.1 69.4 68.3 69.0
64 170 145 89 234
91.5 95.7 98.3 88.3 94.5
81.7 91.5 91.9 83.9 88.8
89.2 91.8 95.7 83.5 91.1
81.6 82.8 90.1 69.9 82.4
82.1 90.0 95.6 75.3 87.9
83.2 90.6 96.2 76.2 88.6
76.2 88.7 95.8 68.1 85.3
85.4 92.4 97.5 79.0 90.5
64 170 145 89 234
6.5 7.8 6.3 9.5 7.5
4 13
9
8 17
100

12.5 Page 115

▲back to top


Annexure19
Table 19.2: Messages recalled, aspects liked and difficulties encountered by men in TV spot:
Mona Singh - Immunization
Particulars
(S= Spontaneous response P= Prompt response)
Messages
Now you get free AD injection for each
immunization – now there is no fear of infection
It is your right to ask for free AD injection for your
child
Free AD injection is totally safe
Just one injection one time so what to fear of
On confirmation of pregnancy it is extremely
necessary to take 2 TT injection so that at time of
birth both mother and child are safe
This way in next month remember to take second
dose of TT injection
For TT injection contact ANM, ASHA or AWW
May god save such mothers from bad eyes
% learnt new things from the TV spot
Total N
Aspects liked in the TV spot
The message conveyed
Clarity of the message
Celebrity
Storyline
Presentation style
Characters
Music
Overall
Total N
% encountered difficulties in understanding
Language
Wordings
Message too fast
Too many messages
Total N
High Other Rural Urban Total
focus states
S 36.5
P 56.9
S 35.9
P 57.5
S 26.6
P 52.6
S 35.2
P 53.3
S 43.7
P 43.1
37.5 37.4
53.1 56.4
4.8 9.7
84.8 83.0
23.5 26.5
68.9 63.4
15.8 12.7
75.3 79.5
16.9 24.1
71.8 63.4
36.8 37.3
48.3 54.0
17.6 12.0
67.5 78.5
18.7 24.2
69.2 65.1
38.6 20.3
47.8 70.2
20.8 23.2
69.2 65.1
S 23.1
P 61.2
S 22.5
P 68.7
S 6.1
P 65.7
88.7
14
16.8 17.3
62.9 65.5
7.2 9.9
74.1 79.0
7.3 2.7
60.7 71.2
75.9 88.1
46 42
20.8 18.3
55.3 62.5
12.7 10.8
58.1 72.9
17.3 7.0
39.3 61.8
57.0 78.9
18 60
89.0 89.7 95.6 74.8 89.5
80.2 87.0 95.4 61.7 85.5
82.9 82.4 87.5 70.5 82.5
80.2 83.3 84.2 78.5 82.6
84.4 79.5 83.9 72.8 80.7
83.0 73.8 80.6 64.9 76.0
48.3 77.0 76.6 55.5 70.3
75.9 88.0 96.2 58.8 85.2
14
46 42
18 60
5.5 9.3 5.7 14.8 8.4
1
4
2
3
5
101

12.6 Page 116

▲back to top


A Concurrent Evaluation of Phase II of the NRHM BCC Campaign
Table 19.3: Percentage distribution of women and men by intended action after watching
TV spot: Mona Singh - Immunization
Intended actions
Women
% who intend to take action after watching TV spot
Total N
Use one injection only one time
Use AD injections
Immunize the child
Take 2 doses of TT during pregnancy
Consult ASHA/ANM/AWW
Acquire more information
Discuss with spouse/family members
Discuss with friends/relatives
Encourage others for availing services
Total N
Men
% who intend to take action after watching TV spot
Total N
Use one injection only one time
Use AD injections
Immunize the child
Take 2 doses of TT during pregnancy
Consult ASHA/ANM/AWW
Acquire more information
Discuss with spouse/family members
Discuss with friends/relatives
Encourage others for availing services
Total N
High Other Rural Urban Total
focus states
68.2 56.1 60.9 57.1 59.5
64 170 145
89 234
26.9 30.8 23.5 40.2 29.6
27.7 39.4 31.1 43.8 35.7
18.9 18.4 20.4 15.4 18.6
15.6 21.8 10.6 35.8 19.8
4.4 18.3 7.8 24.6 13.9
12.7 6.9 6.3 12.9 8.7
21.1 21.5 17.7 27.7 21.3
31.6 61.0 50.1 54.5 51.7
37.2 2.9 11.4 17.6 13.7
44
95
88
51 139
76.6 49.5 59.2 47.7 55.8
14
46
42
18
60
42.8 37.9
43.4
24.0 17.4
31.1
3.1 23.2
25.2
26.0 25.4
24.1
36.5 50.4
41.3
8.9 2.1
6.2
74.1 57.2
51.4
45.8 36.8
37.9
.4 4.2
3.4
11
23
26
8
34
102

12.7 Page 117

▲back to top


Annexure 20
Annexure 20
Badhte Shishu ki Badhti Zaroorat
(Nutrition and Breastfeeding)
TV Spot
Colostrum
feeding
immediately
after birth
Exclusive
breastfeeding for
first six months
Table 20.1: Messages recalled, aspects liked and difficulties encountered by women in TV spot:
Badhte Shishu ki Badhti Zaroorat - Nutrition and Breastfeeding
Particulars
(S= Spontaneous response P= Prompt response)
High Other Rural Urban Total
focus states
Messages
For better growth of the child, feed the child only
S 56.9
mother’s milk for first 6 months; after that, along with P 42.9
breast milk, give the child other supplementary food
50.0 50.8 56.8 52.9
49.9 49.2 42.7 46.9
At the age of 6 months start feeding the child daliya S 36.8
made of rice and flour
P 60.8
12.5 19.8 28.3 22.9
80.4 73.5 69.6 72.1
Feed the child homemade paste/semi-solid food
without spice
S 9.7
P 84.8
7.2 5.5 13.3 8.3
76.6 80.2 80.0 80.1
Give the child fruits and vegetables
S 8.3 10.6 2.4 22.6 9.6
P 78.4 79.6 85.4 68.0 79.1
Give supplementary food 5-6 times in a day
S 8.9 7.2 4.2 14.5 7.9
P 76.5 78.6 80.0 73.5 77.7
Continue breastfeeding for 2 years
S 5.8 24.5 17.3 15.2 16.5
P 77.1 66.4 73.5 66.3 71.0
Fulfill the growing needs of the child through
adequate supplementary food
S 5.9
P 79.7
4.8 3.9 7.8 5.3
75.1 77.4 76.4 77.1
103

12.8 Page 118

▲back to top


A Concurrent Evaluation of Phase II of the NRHM BCC Campaign
Particulars
(S= Spontaneous response P= Prompt response)
High Other Rural Urban Total
focus states
Initiate breastfeeding within one hour of birth
S 16.3 14.8 14.5 17.0 15.4
P 74.4 79.5 79.3 73.7 77.3
Feeding the child mother’s first thick yellowish milk S 11.6
i.e colostrum keeps the child away from diseases
P 74.1
11.6 9.3 15.8 11.6
70.1 72.1 71.4 71.8
Mother’s first milk also provides adequate quantities S 7.6
of vitamins and proteins
P 76.6
4.4 4.0 9.0 5.8
83.8 79.7 82.7 80.8
For the first 6 months feed the child mother’s milk
only. Do not feed anything else.
S 19.4
P 65.8
13.0 14.6 17.8 15.8
77.5 72.5 72.6 72.5
Remember, for the first 6 months mother’s milk is
the best and complete nutrition for the child
S 9.8
P 79.7
8.5 8.3 10.4 9.1
71.8 73.1 78.8 75.1
% learnt new things from the TV spot
68.1 76.6 76.5 66.7 73.0
Total N
136 182 204 114 318
Aspects liked in the TV spot
The message conveyed
91.2 97.0 97.1 89.9 94.5
Clarity of the message
85.4 89.5 90.4 83.1 87.7
Storyline
80.0 89.4 92.4 72.7 85.4
Presentation style
82.5 85.3 89.7 74.1 84.1
Characters
80.1 87.3 91.2 71.9 84.3
Music
74.7 86.6 88.4 69.3 81.5
Overall
83.1 91.9 93.6 78.3 88.1
Total N
136 182 204 114 318
% encountered difficulties in understanding
6.1 10.0 8.5 8.0 8.3
Language
.9 81.7 49.6 69.3 56.3
Wordings
34.9 1.2 16.2 3.3 11.7
Message too fast
75.4 18.3 41.3 26.6 36.2
Other
.9 0.0 0.0
.8
.3
Total N
8
18 17
9 26
Table 20.2: Messages recalled, aspects liked and difficulties encountered by men in TV spot:
Badhte Shishu ki Badhti Zaroorat - Nutrition and Breastfeeding
Particulars
(S= Spontaneous response P= Prompt response)
Messages
For better growth of the child, feed the child only
mother’s milk for first 6 months; after that, along with
breast milk, give child other supplementary food
At the age of 6 months start feeding the child daliya
made of rice and flour
High
focus
S 67.2
P 29.2
S 10.5
P 86.7
Other Rural Urban Total
states
68.1 72.5 53.3 67.8
28.5 22.9 46.7 28.7
19.8 15.5 20.2 16.6
77.3 82.1 75.6 80.5
104

12.9 Page 119

▲back to top


Annexure 20
Particulars
(S= Spontaneous response P= Prompt response)
Feed the child homemade paste/semi-solid food
without spice
Give the child fruits and vegetables
Give supplementary food 5-6 times in a day
Continue breastfeeding for 2 years
Fulfill the growing needs of the child through
adequate supplementary food
Initiate breastfeeding within one hour of birth
Feeding the child mother’s first thick yellowish milk
i.e colostrum keeps the child away from diseases
Mother’s first milk also provides adequate quantities
of vitamins and proteins
For the first six months feed the child mother’s milk
only. Do not feed anything else other than this
Remember, for the first 6 months mother’s milk is the
best and complete nutrition for the child
% learnt new things from the TV spot
Total N
Aspects liked in the TV spot
The message conveyed
Clarity of the message
Storyline
Presentation style
Characters
Music
Overall
Total N
% encountered difficulties in understanding
Language
Wordings
Message too fast
Too many messages
Total N
High Other Rural Urban Total
focus states
S 18.0 10.4 14.3 9.1 13.0
P 65.8 61.8 55.7 86.4 63.2
S 9.9 7.8 8.0 10.0 8.5
P 77.6 85.4 81.3 86.9 82.7
S 21.6 14.3 17.6 14.3 16.8
P 65.0 70.0 64.6 79.6 68.3
S 6.5 18.3 11.8 21.6 14.2
P 86.4 62.1 69.3 74.2 70.5
S .7 13.4 9.6 7.3 9.0
P 80.7 74.0 72.4 88.3 76.3
S 18.3 12.2 9.6 28.8 14.3
P 78.1 82.0 84.6 68.5 80.7
S 8.9 14.8 12.6 13.2 12.7
P 78.5 67.9 70.6 74.5 71.5
S 21.4 7.7 13.3 9.6 12.4
P 65.1 63.5 61.1 73.2 64.1
S 6.4 7.4 5.7 11.0 7.0
P 89.8 69.8 75.0 81.7 76.6
S 14.9 20.8 17.8 21.5 18.7
P 80.2 69.0 72.7 73.3 72.8
91.2 64.1 67.7 91.1 73.4
22 43 49 16 65
90.2 92.8 92.5 90.3 91.9
73.4 93.5 89.2 78.4 86.6
75.5 95.6 90.0 84.8 88.7
75.0 88.1 84.0 82.3 83.6
80.3 87.0 84.1 86.7 84.7
81.6 86.8 83.7 89.0 85.0
80.9 93.7 90.4 85.8 89.3
22 43 49 16 65
5.1 8.0 6.2 9.3 7.0
1
3
3
14
105

12.10 Page 120

▲back to top


A Concurrent Evaluation of Phase II of the NRHM BCC Campaign
Table 20.3: Percentage distribution of women and men by intended action after watching
TV spot: Badhte Shishu ki Badhti Zaroorat - Nutrition and Breastfeeding
Intended actions
Women
% who intend to take action after watching TV spot
Total N
Ensure exclusive breastfeeding for 1st 6 months
Initiate supplementary feeding after 6 months
Initiate breastfeeding within one hour of birth
Feed colostrum to the child
Acquire more information
Discuss with spouse/family members
Discuss with friends/relatives
Encourage others on child feeding practices
Total N
Men
% who intend to take action after watching TV spot
Total N
Encourage exclusive breastfeeding for 1st 6 months
Encourage Initiation of supplementary feeding after
6 months
Encourage initiation of breastfeeding within one
hour of birth
Encourage feeding colostrum to the child
Acquire more information
Discuss with spouse/family members
Discuss with friends/relatives
Encourage others on child feeding practices
Total N
High Other Rural Urban Total
focus states
37.6 42.1 36.3 47.2 40.2
136 182 204 114 318
47.4 50.7 51.7 46.2 49.4
36.8 30.9 26.0 43.1 33.2
9.2 9.4 1.5 20.1 9.3
21.4 18.6 10.6 32.3 19.7
7.6 14.3 5.5 20.2 11.6
21.5 32.5 27.4 29.0 28.1
31.5 44.2 46.5 29.0 39.1
20.1 10.8
.9 33.2 14.5
51
77
74
54 128
48.2 22.9 22.9 58.2 31.5
22
43
49
16
65
67.2
30.1
37.4
11
10
12
29.2
36.8
21.5
26.8
1.5
9
21
106

13 Pages 121-130

▲back to top


13.1 Page 121

▲back to top


Annexure 21
Age at Marriage
TV Spot
Annexure 21
…………Let her play Delay the age at marriage- Let her go to school and study Black and White TV spot
Table 21.1: Messages recalled, aspects liked and difficulties encountered by women in TV spot:
Age at Marriage
Particulars
(S= Spontaneous response P= Prompt response)
Messages
Keep the dreams and health of your
S
daughters intact
P
Get them married only after the age of 18
S
years
P
National Rural Health Mission…...... Healthy S
Nation/Bharat begins with healthy family
P
…from you
% learnt new things from the TV spot
Total N
Aspects liked in the TV spot
The message conveyed
Clarity of the message
Storyline
Presentation style
Characters
Music
Overall
Total N
High
focus
23.9
74.1
83.6
14.7
10.1
80.3
66.3
329
95.9
88.6
87.6
88.3
88.2
85.4
93.5
329
Other
states
21.6
69.3
79.9
16.8
6.2
71.4
64.5
390
90.3
83.7
77.2
79.8
78.2
75.3
82.4
390
Rural
22.8
70.6
80.6
16.1
7.7
74.4
64.7
528
91.7
83.5
80.3
84.0
84.1
81.3
87.6
528
Urban
22.2
73.8
84.2
14.9
8.9
78.3
67.0
191
96.2
92.6
86.4
82.8
79.2
76.1
87.2
191
Total
22.6
71.5
81.6
15.8
8.0
75.5
65.3
719
92.9
85.9
81.9
83.7
82.8
79.9
87.5
719
107

13.2 Page 122

▲back to top


A Concurrent Evaluation of Phase II of the NRHM BCC Campaign
Particulars
(S= Spontaneous response P= Prompt response)
% encountered difficulties in understanding
Language
Wordings
Message too fast
Too many messages
Other
Total N
High
focus
6.5
34.3
27.3
65.1
11.2
.3
21
Other
states
9.1
58.8
35.0
18.0
3.2
.2
36
Rural
8.2
49.9
38.4
33.8
3.6
0.0
43
Urban
7.1
48.7
12.1
41.8
14.6
1.1
14
Total
7.9
49.6
32.1
35.7
6.2
.3
57
Table 21.2: Messages recalled, aspects liked and difficulties encountered by men in TV spot:
Age at Marriage
Particulars
(S= Spontaneous response P= Prompt response)
Messages
Keep the dreams and health of your
S
daughters intact
P
Get them married only after the age of 18
S
years
P
National Rural Health Mission…...... Healthy S
Nation/Bharat begins with healthy family P
…from you
% learnt new things from the TV spot
Total N
Aspects liked in the TV spot
The message conveyed
Clarity of the message
Storyline
Presentation style
Characters
Music
Overall
Total N
% encountered difficulties in understanding
Language
Wordings
Message too fast
Too many messages
Total N
High
focus
25.2
72.9
93.2
5.8
14.6
78.9
62.1
206
88.8
81.2
82.2
86.0
83.2
83.0
86.9
206
5.3
12.0
45.7
31.0
45.6
11
Other
states
34.7
58.0
72.9
26.5
15.9
65.9
61.1
189
94.6
85.7
87.4
86.3
86.7
85.6
92.3
189
12.1
48.7
46.3
27.3
0.0
23
Rural
29.5
66.6
82.2
16.8
15.2
74.0
62.9
295
93.4
84.1
85.7
88.1
86.7
91.6
92.8
295
7.5
37.2
45.9
30.6
10.8
22
Urban
30.4
63.4
87.3
12.4
15.3
68.9
57.6
100
86.4
80.9
81.6
80.2
79.5
62.5
79.9
100
11.8
35.9
46.6
24.4
22.3
12
Total
29.7
65.8
83.5
15.7
15.2
72.7
61.6
395
91.6
83.3
84.7
86.1
84.9
84.2
89.5
395
8.6
36.8
46.1
28.5
14.8
34
108

13.3 Page 123

▲back to top


Annexure 21
Table 21.3: Percentage distribution of women and men by intended action after watching
TV spot: Age at Marriage
Intended actions
Women
% who intend to take action after watching
TV spot
Total N
Acquire more information
Discuss with spouse/family members
Discuss with friends/relatives
Encourage others for ensuring that girls marry
after the age of 18 years
Total N
Men
% who intend to take action after watching TV
spot
Total N
Acquire more information
Discuss with spouse/family members
Discuss with friends/relatives
Encourage others for ensuring that girls marry
after the age of 18 years
Total N
High Other Rural Urban Total
focus states
47.7 49.6 46.7 54.5 48.7
329 390 528 191 719
32.3 19.4 22.5 31.6 25.2
20.2 28.6 23.1 29.2 24.9
33.7 57.9 45.7 50.4 47.1
50.4 35.5 39.1 49.5 42.2
157 194 247 104 351
64.9 54.5 59.4 61.4 59.9
206 189 295 100 394
30.4 13.3 21.6 26.9 23.0
20.4 32.8 24.3 30.2 25.8
30.8 61.1 45.3 40.0 44.0
86.5 59.9 74.6 76.0 75.0
133 103 175
61 236
……Love her……
109

13.4 Page 124

▲back to top


Annexure 22
Pragati Talking to Papa
(Antenatal Care)
Radio Spot
Table 22.1: Messages recalled, aspects liked and difficulties encountered by women in radio
spot: Pragati talking to papa - ANC
Particulars
High Other Rural Urban Total
focus states
Messages
Checkups of pregnant women are done on VHND S 29.9 13.4 21.1 27.9 22.2
P 64.3 63.8 63.4 67.7 64.0
Tetanus injections are given
S 48.6 47.6 45.4 63.5 48.2
P 45.0 43.1 46.9 28.3 44.1
Iron pills are given
S 32.5 12.2 22.0 28.6 23.0
P 60.6 70.8 67.9 51.2 65.4
Nutrition related advice is given
S 15.7 2.6 9.3 11.3 9.6
P 68.8 58.5 67.1 46.2 64.0
Children are immunized
S 12.1 22.2 13.7 34.4 16.8
P 78.2 64.4 74.7 55.4 71.8
Their (children’s) weight is taken
S 6.0 3.3 3.9 9.4 4.7
P 71.9 65.5 68.9 69.2 68.9
Better health services have reached the door step S 21.5 2.8 13.3 10.1 12.8
of people in the villages. Many more people than
before are taking benefits of these services.
P 58.9 64.8 59.1 76.0 61.7
National Rural Health Mission – Because, healthy
15.7
.4 9.9
.9 8.6
nation/Bharat begins with healthy family …from you
63.2 70.1 63.4 83.5 66.4
% learnt new things from the Radio spot
79.2 69.0 73.9 77.0 74.4
Aspects liked in the Radio spot
The message conveyed
88.1 78.7 81.8 94.2 83.7
Clarity of the message
78.1 66.5 70.0 87.9 72.7
Jingle tune/music
77.4 84.7 80.6 81.9 80.8
Presentation style
77.9 71.6 74.9 75.2 75.0
Overall
80.3 65.1 72.1 79.7 73.2
% encountered difficulties in understanding
4.7 42.3 22.4 21.6 22.2
Total N
115 101 183 33 216
110

13.5 Page 125

▲back to top


Annexure 22
Table 22.2: Messages recalled, aspects liked and difficulties encountered by men in radio spot:
Pragati talking to papa - ANC
Particulars
High Other Rural Urban Total
focus states
Messages
Checkups of pregnant women are done on
S 4.9 12.8 7.1 17.3 9.3
VHND
P 88.6 76.3 82.5 79.2 81.7
Tetnus injections are given
S 46.0 41.3 31.3 85.7 43.4
P 49.6 45.1 56.7 13.1 47.1
Iron pills are given
S 25.8 19.8 21.8 24.6 22.4
P 69.5 69.1 67.6 75.3 69.3
Nutrition related advice is given
S 1.0
4.9
.6 12.3 3.2
P 83.5 63.0 76.6 56.1 72.0
Children are immunized
S 24.8 28.6 20.2 50.5 26.9
P 75.2 58.7 75.2 33.6 66.0
Their (children’s) weight is taken
S 3.2 14.2 5.3 23.7 9.4
P 75.5 66.2 75.3 52.5 70.3
Better health services have reached the door
S 8.4 8.2 10.5
.5 8.3
step of people in the villages. Many more people P 78.2 61.8 70.1 65.3 69.0
than before are taking benefits of these services
National Rural Health Mission – Because,
S 11.7
.4 6.7
.8 5.4
healthy nation/Bharat begins with healthy
family …from you
P 78.6 70.4 79.8 53.4 74.0
% learnt new things from the Radio spot
89.7 77.3 81.9 85.9 82.8
Aspects liked in the Radio spot
The message conveyed
86.3 85.2 83.3 94.0 85.7
Clarity of the Message
88.7 85.3 84.4 95.1 86.8
Jingle tune/music
83.6 87.9 83.9 93.5 86.0
Presentation style
83.3 88.6 83.0 97.8 86.3
Overall
86.6 91.0 86.7 97.3 89.1
% encountered difficulties in understanding
4.2 35.7 17.1 38.6 21.8
Total N
47
61 84
24 108
111

13.6 Page 126

▲back to top


A Concurrent Evaluation of Phase II of the NRHM BCC Campaign
Table: 22.3: Percentage distribution of women and men by intended action after Listening
radio spot: Pragati talking to papa - ANC
Intended actions
Women
% who intend to take action after listening the
radio spot
Total N
Participate in VHNDs
Avail services on VHNDs
Acquire more information
Discuss with spouse/family members
Discuss with friends/relatives
Encourage others for availing services
Total N
Men
% who intend to take action after listening to
radio spot
Total N
Encourage spouse for participating in VHNDs
Encourage spouse for availing services on
VHNDs
Acquire more information
Discuss with spouse/family members
Discuss with friends/relatives
Encourage others for availing services
Total N
High Other Rural Urban Total
focus states
45.7 62.0 55.5 40.9 53.3
115 101 183
7.6
7.9
6.0
16.2 17.1 17.9
38.4 17.2 25.9
29.0 57.8 41.0
26.6 52.3 37.7
10.2 10.5 10.4
53
62 102
33 216
7.7
16.7
26.9
44.6
40.5
10.3
13 115
39.9 45.8 41.5 49.0 43.2
47
61
84
29.0 29.7
22.8 29.9
24 108
37.1
29.7
46.7 19.2
24.2 29.2
54.1 44.9
10.8
9.6
19
28
35
36.1
24.9
42.4
13.7
12
47
112

13.7 Page 127

▲back to top


Annexure 23
Annexure 23
Conversation with ASHA
(Antenatal Care)
Radio Spot
Table 23.1: Messages recalled, aspects liked and difficulties encountered by women in
radio spot: Conversation with ASHA - ANC
Particulars
(S= Spontaneous P= Prompted)
High Other Rural Urban Total
focus states
Messages
What should be done on confirmation of
S 25.1
pregnancy? After checkup at health center, jaccha P 71.2
baccha (mother-child) card should be prepared
28.0 24.7
69.1 71.5
32.6 25.4
65.6 71.0
Definitely take iron tablets for 100 days
S 41.4 23.4 38.4 49.6 39.4
P 57.5 76.4 60.5 49.9 59.6
If the women are pregnant, take care now, then
will remain healthy themselves and the child will
also be born healthy
S 8.1
P 79.3
15.1 8.2
72.7 79.7
16.3 8.9
67.1 78.5
During pregnancy along with additional food and S 12.0
work, rest is also important
P 79.2
18.9 12.6
71.2 79.3
14.9 12.8
68.3 78.3
Definitely administer 2 Tetanus injections at the
interval of one month
S 41.3
P 56.2
51.3 41.1
44.5 56.7
54.9 42.4
36.9 54.9
Get registered each under JSY and get both safe
delivery and financial assistance
S 24.1
P 66.1
14.6 24.2
58.3 64.4
11.7 23.1
73.4 65.2
National Rural Health Mission – Because, healthy S 1.6
nation/Bharat begins with healthy family …from P 69.0
you
4.0 1.5
74.7 69.1
5.4 1.9
75.2 69.7
% learnt new things from the radio spot
80.9 72.9 82.4 55.7 80.0
Aspects liked in the radio spot
The message conveyed
91.0 92.4 91.7 86.3 91.2
Clarity of the message
86.3 91.0 87.5 79.9 86.8
Jingle tune/music
72.6 95.7 75.8 68.8 75.1
Presentation style
70.1 85.8 70.5 85.2 71.9
Overall
84.8 88.7 85.8 79.2 85.2
% encountered difficulties in understanding
4.4 17.6 5.7
8.0 5.9
Total N
386
48 395
39 434
113

13.8 Page 128

▲back to top


A Concurrent Evaluation of Phase II of the NRHM BCC Campaign
Table 23.2: Messages recalled, aspects liked and difficulties encountered by men in radio spot:
Conversation with ASHA - ANC
Particulars
(S= Spontaneous P= Prompted)
Messages
What should be done on confirmation of
S
pregnancy? After checkup at health center, ‘jaccha P
baccha’ (mother-child) card should be prepared
Definitely take iron tablets for 100 days
S
P
If the women are pregnant, take care now, then S
will remain healthy themselves and the child will P
also be born healthy
During pregnancy along with additional food and S
work, rest is also important
P
Definitely administer 2 Tetanus injections at the S
interval of one month
P
Get registered each under JSY and get both safe S
delivery and financial assistance
P
National Rural Health Mission – Because, healthy S
nation/Bharat begins with healthy family …from P
you
% learnt new things from the radio spot
Aspects liked in the radio spot
The message conveyed
Clarity of the message
Jingle tune/music
Presentation style
Overall
% encountered difficulties in understanding
Total N
High
focus
31.9
65.6
47.4
52.6
5.7
85.1
18.2
77.1
37.9
57.9
18.9
75.6
.4
77.2
83.2
94.5
77.0
85.7
86.1
87.3
4.9
134
Other
states
37.4
49.3
16.9
80.7
26.3
51.2
8.7
88.1
16.7
67.1
.6
79.0
6.6
78.3
90.9
100.0
89.0
91.2
88.6
93.8
25.4
33
Rural Urban
30.3 47.7
64.3 51.5
43.0 32.0
56.9 65.6
6.0 31.2
83.3 50.5
17.5
9.7
77.9 87.0
35.3 24.8
58.8 64.9
16.1 10.6
76.2 76.9
1.4
2.9
75.9 85.9
84.7 84.6
96.3 91.7
79.3 79.8
87.5 83.1
87.6 80.7
87.3 95.8
10.0
3.5
142
25
Total
33.0
62.4
41.3
58.2
9.8
78.3
16.3
79.3
33.7
59.8
15.3
76.3
1.6
77.5
84.7
95.6
79.4
86.8
86.6
88.6
9.0
167
114

13.9 Page 129

▲back to top


Annexure 23
Table 23.3: Percentage distribution of women and men by intended action after listening to
the radio spot: Conversation with ASHA - ANC
Intended actions
Women
% who intend to take action after listening the radio spot
Total N
Administer 2 TT shots during pregnancy
Consume 100 iron tablets during pregnancy
Receive ANC check-up at health centers
Prepare ‘jaccha baccha’ card at health centers
Ensure good food during pregnancy
Ensure rest during pregnancy
Take care advantages of JSY
Acquire more information
Discuss with spouse/family members
Discuss with relatives/friends
Encourage others for availing services
Total N
Men
% who intend to take action after listening to radio spot
Total N
Encourage spouse for administering 2 TT shots during
pregnancy
Encourage spouse for consuming IFA during pregnancy
Encourage spouse for receiving ANC check-up at health
centers
Prepare ‘jaccha baccha’ card at health centers
Ensure good food during pregnancy
Ensure rest during pregnancy
Take advantages of JSY
Acquire more information
Discuss with spouse/family members
Discuss with friends/relatives
Encourage others for availing services
Total N
High Other Rural Urban Total
focus states
59.9 38.9 59.2 41.5 57.6
386 48 395 39 434
63.4
62.5
61.6
53.1
52.9
52.6
19.4
18.4
19.3
4.8
6.6
6.6
3.0
3.2
4.8
1.7
2.6
2.5
18.5
17.4
17.3
6.6
7.0
7.0
29.9
32.3
31.2
29.1
30.0
29.9
6.9
5.5
6.7
231 19 234 16 250
69.0 62.5 72.6 40.0 67.7
134 33 142 25 167
42.1 36.1 39.2
41.0
34.2 11.6 30.7
30.0
33.2 15.8 29.3
30.0
8.7 11.1 8.9
5.0 10.1 4.4
5.8 6.8 6.4
14.0 5.9 13.4
.1 34.9 4.1
29.3 52.7 34.0
39.8 68.3 45.0
.5 3.4 .4
92 21 103
9.2
6.0
6.0
12.5
6.5
33.6
45.0
1.0
10 113
115

13.10 Page 130

▲back to top


Annexure 24
Journalist Khushi
(Institutional Delivery & JSY)
Radio Spot
Table 24.1: Messages recalled, aspects liked and difficulties encountered by women in
radio spot: Journalist Khushi - Institutional Delivery & JSY
Particulars
(S= Spontaneous P= Prompted)
Messages
The birth of every child should take place at
S
hospital
P
Proper care of both mother and the child is taken S
in the hospital
P
In case of any complications during delivery, there S
are good doctors and nurses to take care of it at P
the hospital. All medicines are also immediately
available there.
More than one crore women have benefited from S
the services and financial assistance from JSY
P
NRHM
Deliver the child only at the hospital
S
P
Because, healthy nation/Bharat begins with
S
healthy family …from you
P
% learnt new things from the radio spot
Aspects liked in the radio spot
The message conveyed
Clarity of the message
Jingle tune/music
Presentation style
Overall
% encountered difficulties in understanding
Total N
High
focus
68.3
25.9
18.8
64.7
12.0
73.1
6.5
63.4
27.9
66.7
3.8
77.8
72.0
93.9
79.3
82.2
89.0
82.7
7.5
80
Other Rural Urban Total
states
49.6 58.2
43.7 35.1
15.3 13.7
76.3 70.5
13.9 10.4
69.1 71.3
74.7 61.3
21.7 32.6
33.8 17.5
62.6 69.0
22.5 12.7
72.9 71.6
18.6 6.1
48.7 57.9
31.9 11.0
58.0 57.9
49.1 32.8
44.9 61.0
7.4 3.6
57.2 68.0
58.0 69.1
48.6 35.8
47.7 58.5
11.6 5.1
79.2 70.1
57.1 66.8
88.1 89.8
53.2 72.0
80.8 80.7
73.0 81.3
70.3 76.4
44.5 24.2
48 104
99.9 91.7
58.7 69.5
85.9 81.7
90.4 83.0
85.2 78.1
9.3 21.4
24 128
116

14 Pages 131-140

▲back to top


14.1 Page 131

▲back to top


Annexure 24
Table 24.2: Messages recalled, aspects liked and difficulties encountered by men in radio spot:
Journalist Khushi - Institutional Delivery & JSY
Particulars
(S= Spontaneous P= Prompted)
Messages
The birth of every child should take place at
S
hospital
P
Proper care of both mother and the child is taken S
in the hospital
P
In case of any complications during delivery, there S
are good doctors and nurses to take care of it at P
the hospital. All medicines are also immediately
available there.
More than 1 crore women have benefited from the S
services and financial assistance from JSY NRHM P
Deliver the child only at the hospital
S
P
Because, healthy nation/Bharat begins with
S
healthy family …from you
P
% learnt new things from the radio spot
Aspects liked in the radio spot
The message conveyed
Clarity of the message
Jingle tune/music
Presentation style
Overall
% encountered difficulties in understanding
Total N
High Other Rural Urban Total
focus states
71.1 27.1 48.4 61.7 50.1
28.9 72.9 51.6 38.3 49.9
11.5 15.0 12.0 21.6 13.2
88.1 76.5 83.5 76.0 82.6
1.3 3.1 2.4
.5 2.2
95.5 80.3 86.6 99.4 88.2
1.9 3.1 2.8
.5 2.5
85.1 62.9 79.2 42.2 74.5
65.3 46.6 53.6 75.8 56.4
32.8 53.4 45.3 24.2 42.6
3.0 3.0 3.4
3.0
87.3 78.7 82.2 90.2 83.2
83.5 47.0 64.7 75.6 66.1
87.8 85.3 86.1 90.6 86.6
86.4 66.8 83.3 34.0 77.1
77.9 85.3 80.6 87.6 81.5
80.8 82.4 80.3 90.3 81.6
87.4 85.3 84.7 98.2 86.4
3.2 10.4 7.4 1.6 6.7
56
51 94
13 107
117

14.2 Page 132

▲back to top


A Concurrent Evaluation of Phase II of the NRHM BCC Campaign
Table 24.3: Percentage distribution of women and men by intended action after listening to
the radio spot: Journalist Khushi - Institutional Delivery & JSY
Intended actions
Women
% who intend to take action after listening the
radio spot
Total N
Deliver the child in health institutions
Take benefits of JSY
Acquire more information
Discuss with spouse/family members
Discuss with friends/relatives
Encourage others for availing services
Total N
Men
% who intend to take action after listening to
radio spot
Total N
Encourage spouse for delivering in hospital
Take benefits of JSY
Acquire more information
Discuss with spouse/family members
Discuss with friends/relatives
Encourage others for availing services
Total N
High Other Rural Urban Total
focus states
36.9 65.6 48.7 43.1 47.6
80
48 104
42.5 23.8 33.3
42.9 8.7 29.6
1.3 11.4 6.1
20.1 40.5 23.6
27.2 87.8 57.4
15.5 9.4 5.3
29
32
51
24 128
32.9
25.3
6.5
30.6
58.4
12.4
10
61
68.8 74.9 69.6 86.5 71.7
56
51
94
89.9 30.6 67.2
68.7 26.0 51.8
29.4 19.0 25.8
4.3 45.2 16.4
8.2 79.7 34.7
.1 39.2 22.9
39
38
65
13 107
60.4
47.5
24.2
24.6
43.8
19.5
12
77
118

14.3 Page 133

▲back to top


Annexure 25
Annexure 25
Jingle Jagmag
(Institutional Delivery)
Radio Spot
Table 25.1: Messages recalled, aspects liked and difficulties encountered by women in
radio spot: Jingle Jagmag - Institutional Delivery
Particulars
(S= Spontaneous P= Prompted)
Messages
Getting delivery done in hospital is a wise
S
decision
P
Find out which hospital is near to your house S
P
Arrangement to reach there (hospital) from S
your house should be available day and night P
Get registered under JSY of NRHM and get S
both safe delivery and financial assistance
P
Because, healthy nation/Bharat begins with S
healthy family …from you
P
% learnt new things from the radio spot
Aspects liked in the radio spot
The message conveyed
Clarity of the message
Jingle tune/music
Presentation style
Overall
% encountered difficulties in understanding
Total N
High
focus
60.7
36.5
17.2
77.8
14.6
77.6
15.8
76.9
5.2
80.0
76.9
87.2
80.9
79.0
78.8
84.0
3.9
189
Other
states
50.3
40.4
20.1
53.3
8.1
48.3
7.2
41.0
5.1
55.7
63.1
68.1
43.1
98.7
62.8
61.8
57.2
36
Rural Urban
58.5 66.1
37.5 32.2
16.9 26.8
75.0 60.1
13.6 13.1
73.2 69.1
14.6 12.9
71.5 66.5
4.7 10.7
76.6 70.3
75.1 69.4
83.2 96.3
74.5 78.7
82.3 79.6
77.2 65.1
80.8 76.6
12.1 16.9
208
17
Total
59.0
37.1
17.6
73.9
13.6
72.9
14.4
71.2
5.2
76.1
74.7
84.2
74.8
82.1
76.3
80.5
12.5
225
119

14.4 Page 134

▲back to top


A Concurrent Evaluation of Phase II of the NRHM BCC Campaign
Table 25.2: Messages recalled, aspects liked and difficulties encountered by men in
radio spot: Jingle Jagmag - Institutional Delivery
Particulars
(S= Spontaneous P= Prompted)
Messages
Getting delivery done in hospital is a wise
decision
Find out which hospital is near to your house
Arrangement to reach there (hospital) from
your house should be available day and night
Get registered under JSY of NRHM and get
both safe delivery and financial assistance
Because, healthy nation/Bharat begins with
healthy family …from you
% learnt new things from the radio spot
Aspects liked in the radio spot
The message conveyed
Clarity of the message
Jingle tune/music
Presentation style
Overall
% encountered difficulties in understanding
Total N
High Other Rural Urban
focus states
S 53.5 33.0 52.7 34.2
P 44.9 52.0 43.8 63.3
S 15.1 22.8 13.8 36.7
P 81.7 55.4 80.6 58.0
S 1.9 10.0 1.6 14.8
P 94.0 50.9 90.2 72.7
S 2.3 20.4 1.6 31.6
P 88.8 44.9 85.3 64.2
S 1.8 10.5 1.5 15.5
P 89.9 45.2 86.4 64.2
82.9 57.5 81.9 59.4
90.9 74.2 88.5 90.9
74.8 79.7 73.5 91.9
74.7 70.9 72.5 90.1
84.2 87.3 83.3 95.7
90.1 87.3 89.1 95.7
.3 27.3 2.6 14.3
85
13
88
10
Total
50.8
45.8
16.1
78.3
2.9
88.4
4.6
83.2
2.9
84.1
79.6
88.7
75.4
74.2
84.6
89.8
3.8
98
120

14.5 Page 135

▲back to top


Annexure 25
Table 25.3: Percentage distribution of women and men by intended action after listening to
the radio spot: Jingle Jagmag - Institutional Delivery
Intended actions
Women
% who intend to take action after listening
the radio spot
Total N
Deliver the child at hospital
Enquire about nearest health facility for
delivery
Arrange transport in advance for delivery
Take benefit of JSY
Acquire more information
Discuss with spouse/family members
Discuss with friends/relatives
Encourage others for availing services
Other
Total N
Men
% who intend to take action after listening
to radio spot
Total N
Encourage spouse for delivering at hospital
Enquire about nearest health facility for
delivery
Arrange transport in advance for delivery
Take benefit of JSY
Acquire more information
Discuss with spouse/family members
Discuss with friends/relatives
Encourage others for availing services
Total N
High
focus
54.8
189
50.9
15.0
5.5
35.5
4.0
26.0
37.7
13.7
.9
104
33.2
86
64.0
36.7
24.8
48.7
.7
25.7
22.2
0.0
57
Other
states
62.6
36
18.9
5.0
7.5
14.3
23.9
44.1
68.3
38.2
22
5
Rural Urban
56.9 45.2
208
17
45.7
13.1
4.8
31.1
4.6
24.9
38.9
23.6
7.2
118
8
35.6
88
64.0
35.3
25.5
47.8
0.0
27.3
22.2
0.0
57
5
Total
56.0
225
45.2
13.2
4.5
30.5
5.8
25.6
38.8
23.4
7.6
126
37.1
98
61.8
36.7
28.2
48.0
1.3
27.8
22.4
.4
62
121

14.6 Page 136

▲back to top


Annexure 26
Holi Song (Family Planning)
Radio Spot
Table 26.1: Messages recalled, aspects liked and difficulties encountered by women in
radio spot: Holi Song - FP
Particulars
(S= Spontaneous P= Prompted)
High Other Rural Urban Total
focus states
Messages
There is no tension in the sweet moments of life S 18.0 20.9 16.7
because new Copper-T’s safety is always with
P 69.4 71.6 71.9
me
39.2 18.6
47.7 69.8
In case you want to become a mother for
second time it can be easily removed also
S 18.5 9.8 15.8
P 79.9 80.4 82.6
26.6 16.7
51.0 80.0
With this new Copper-T there is no tension
S 6.6 12.4 6.2 24.4 7.8
P 71.6 81.7 75.1 57.5 73.6
Get more information from ANM at nearby
health centre
S 16.6
.2 14.4
P 76.3 84.8 78.2
2.3 13.3
75.6 78.0
Accept Copper-T from local trained health
worker at the right time
S 8.6
.0 7.4
P 83.5 87.2 85.0
1.4 6.9
76.2 84.3
This is the time of new and safe Copper-T
S 25.1 29.8 24.1 47.5 26.1
P 67.5 63.6 68.7 45.4 66.7
Because, healthy nation/Bharat begins with
healthy family …from you
S 7.7 1.3 6.5
P 82.9 80.4 83.5
5.2 6.4
70.8 82.4
% learnt new things from the radio spot
83.5 75.7 81.5 86.6 82.0
Aspects liked in the radio spot
The message conveyed
88.5 94.6 89.3 94.1 89.7
Clarity of the message
78.5 86.6 80.7 73.6 80.1
Jingle tune/music
73.8 90.3 76.3 85.6 77.1
Presentation style
81.3 85.1 81.5 88.2 82.1
Overall
80.8 83.9 80.8 88.2 81.4
% encountered difficulties in understanding
3.6 11.8 5.0
7.8 5.2
Total N
129 32 147
14 161
122

14.7 Page 137

▲back to top


Annexure 26
Table 26.2: Messages recalled, aspects liked and difficulties encountered by men in radio spot:
Holi Song - FP
Particulars
(S= Spontaneous P= Prompted)
Messages
There is no tension in the sweet moments of
life because new Copper-T’s safety is always
with me
In case you want to become a mother for
second time it can be easily removed also
With this new Copper-T there is no tension
Get more information from ANM of nearby
health centre
Accept Copper-T from local trained health
worker at the right time
This is the time of new and safe Cu.T
Because, healthy nation/Bharat begins with
healthy family …from you
% learnt new things from the radio spot
Aspects liked in the radio spot
The message conveyed
Clarity of the message
Jingle tune/music
Presentation style
Overall
% encountered difficulties in understanding
High Other Rural Urban Total
focus states
S 10.8 15.1 9.5 31.5 12.6
P 82.4 63.0 75.7 67.0 74.4
S 35.3 10.1 23.1 36.4 25.0
P 61.5 77.1 71.6 45.1 67.9
S 10.3
.5 6.8 2.8 6.3
P 72.8 62.5 71.1 53.3 68.6
S
.2 6.0
18.4 2.6
P 76.7 72.7 81.0 38.2 75.1
S
.7 4.7
16.9 2.4
P 94.3 73.3 86.3 81.8 85.7
S 19.7 68.3 33.2 79.3 39.6
P 53.2 9.9 38.0 19.9 35.4
S 1.6 20.7 1.1 61.0 9.5
P 81.0 56.9 76.7 36.8 71.1
86.7 80.1 87.1 65.0 84.0
99.8 77.8 89.4 99.3 90.8
59.4 73.2 59.6 98.6 65.0
82.9 67.0 77.8 67.8 76.4
79.8 73.0 73.6 98.1 77.0
80.0 67.3 73.7 81.4 74.8
8.6 5.9 6.3 15.2 7.5
123

14.8 Page 138

▲back to top


A Concurrent Evaluation of Phase II of the NRHM BCC Campaign
Table: 26.3: Percentage distribution of women and men by intended action after Listening
radio spot: Holi song - FP
Intended actions
Women
% who intend to take action after listening the
radio spot
Total N
Shall accept Copper-T
Visit nearest health center for Cu.T
Consult ANM
Acquire more information
Discuss with spouse/family members
Discuss with friends/relatives
Encourage others for availing services
Total N
Men
% who intend to take action after listening to
radio spot
Total N
Encourage spouse for accepting Cu.T
Take spouse to nearest health center for Cu.T
Consult ANM
Acquire more information
Discuss with spouse/family members
Discuss with friends/relatives
Encourage others for accepting Cu.T
Total N
High Other Rural Urban Total
focus states
18.3 42.5 19.5 62.0 23.1
129
32 147
14 161
43.3
32.9
29.3
7.3
6.6
10.6
2.9
2.2
5.7
21.0
17.2
13.4
21.0
38.1
38.2
24.9
27.2
37.4
26.0
25.3
21.0
23
14
29
8
37
74.1 74.3 81.8 27.2 74.2
41
28
59
44.6 14.1 30.5
32.7
6.3 19.7
21.6 20.3 22.0
9.7 90.4 45.2
32.4 87.5 56.3
47.2 66.7 57.0
.9
1.7
0.0
30
21
48
10
69
32.1
21.9
21.0
42.9
55.0
55.2
1.3
3
51
124

14.9 Page 139

▲back to top


Annexure 27
Annexure 27
Mehendi Song (Family Planning)
Radio Spot
Table 27.1: Messages recalled, aspects liked and difficulties encountered by women in
radio spot: Mehendi Song - FP
Particulars
High Other Rural Urban
(S= Spontaneous P= Prompted)
focus states
Messages
We are happy as life’s every decision is taken S 34.3 15.7 31.8 22.2
jointly (by husband and wife); like when to P 59.5 61.1 59.9 59.2
have child, spacing between children
Both of you meet ASHA in your village ,
S 12.9
1.0 10.5 11.8
she will arrange to provide you complete
information on family planning methods
P 76.5 90.7 78.4 85.6
from nearby health center
Birth at right time and right interval give
S 24.0 28.4 24.3 29.4
mother and the child good/complete health P 60.7 66.2 60.7 69.8
Because, healthy nation/Bharat begins with S 3.1 12.0
1.3 33.3
healthy family …from you
P 80.4 69.6 82.1 47.6
% learnt new things from the radio spot
74.8 63.9 73.1 69.3
Aspects liked in the radio spot
The message conveyed
87.8 59.2 81.6 88.5
Clarity of the message
82.5 64.5 78.2 86.8
Jingle tune/music
83.3 83.8 84.2 76.6
Presentation style
87.7 64.5 84.1 77.0
Overall
86.3 64.5 82.8 77.6
% encountered difficulties in understanding
4.3 42.6 12.8
1.3
Total N
113
26 124
15
Total
30.8
59.8
10.6
79.2
24.8
61.7
4.8
78.4
72.7
82.4
79.1
83.4
83.3
82.2
11.5
139
Table 27.2: Messages recalled, aspects liked and difficulties encountered by men in
radio spot: Mehendi Song - FP
Particulars
(S= Spontaneous P= Prompted)
Messages
We are happy as life’s every decision is taken S
jointly (by husband and wife); like when to P
have child, spacing between children
High
focus
36.5
60.3
Other Rural
states
31.8 37.1
65.9 60.5
Urban Total
15.8 35.4
74.0 61.5
125

14.10 Page 140

▲back to top


A Concurrent Evaluation of Phase II of the NRHM BCC Campaign
Particulars
(S= Spontaneous P= Prompted)
Both of you meet ASHA in your village,
S
she will arrange to provide you complete
P
information on family planning methods
from nearby health center
Birth at right time and right interval give
S
mother and the child good/complete health P
Because, healthy nation/Bharat begins with S
healthy family …from you
P
% learnt new things from the radio spot
Aspects liked in the radio spot
The message conveyed
Clarity of the message
Jingle tune/music
Presentation style
Overall
% encountered difficulties in understanding
Total N
High
focus
11.3
74.8
Other
states
84.1
Rural
9.0
76.9
29.4 11.9 26.2
57.7 85.8 64.2
12.3
9.8
62.6 99.9 69.9
72.6 69.6 72.6
92.1 100.0 93.4
72.4 84.6 74.6
70.9 83.6 72.6
79.2 79.5 78.3
71.2 100.0 76.5
12.0 31.8 17.8
43
13
52
Urban Total
6.8
8.8
76.1 76.9
16.2 25.4
61.7 64.0
6.8
9.6
83.3 70.9
63.2 71.9
98.9 93.9
81.5 75.1
88.0 73.8
90.1 79.2
90.9 77.6
.2 16.4
4
56
Table 27.3: Percentage distribution of women and men by intended action after listening
radio spot: Mehendi Song - FP
Intended actions
High Other Rural Urban Total
focus states
Women
% who intend to take action after listening the
radio spot
51.4 83.0 58.9 45.3 57.4
Total N
113
26 124
15 139
Interact with ASHA for family planning
66.2 29.8 56.8
56.3
Acquire more information
20.4 15.4 20.5
19.0
Discuss with spouse/family members
26.7 53.0 36.5
33.9
Discuss with friends/relatives
17.4 58.1 27.2
28.5
Encourage others for availing services
5.0
7.1
3.4
5.6
Total N
58
22
73
7
80
Men
% who intend to take action after listening to
56.7
55.9
55.5
radio spot
Total N
44
13
52
5
57
Interact with ASHA for family planning
61.0
56.8
57.6
Acquire more information
18.1
12.7
14.3
Discuss with spouse/family members
26.0
30.4
31.1
Discuss with friends/relatives
16.9
33.4
33.4
Encourage others for availing services
1.1
2.1
2.9
Total N
126
25
6
29
2
31

15 Pages 141-150

▲back to top


15.1 Page 141

▲back to top


Annexure 28
Annexure 28
Pragati Talking to Friends
(Health Services)
Radio Spot
Table 28.1: Messages recalled, aspects liked and difficulties encountered by women in
radio spot: Pragati talking to friends - Health Services
Particulars
(S= Spontaneous P= Prompted)
High Other Rural
focus states
Messages
There has been so much improvement in the
health services in small villages
S 44.7 49.8 41.5
P 47.1 50.2 51.5
People are getting together to think of solutions S 8.5 46.7 13.2
for health problems of the villages- such a good P 84.0 51.2 80.3
change!
Like RKSs in hospitals are getting together with S 7.7 12.4 9.5
local people for development of health services P 80.3 74.4 77.3
Funds have increased, new health centers
S 15.1 14.8 16.0
are coming up, better facilities, instruments,
P 82.3 72.6 79.1
doctors, nurses, increase in use of hospitals for
delivery, care of new born babies- Looking at all
this today I feel proud to be an Indian!
National Rural Health Mission – because a
S
.9 1.7
.6
healthy nation starts with a healthy family- with P 93.7 87.3 92.4
you!
% learnt new things from the radio spot
56.5 32.4 49.6
Aspects liked in the radio spot
The message conveyed
94.7 78.0 90.7
Clarity of the message
73.4 57.6 72.2
Jingle tune/music
86.9 78.0 83.9
Presentation style
89.6 47.1 83.7
Overall
89.9 78.0 86.5
% encountered difficulties in understanding
16.3 31.8 21.9
Total N
47
13
53
Urban
80.3
18.7
46.3
48.5
2.7
92.2
7.4
88.7
4.6
91.9
64.1
93.3
51.6
93.1
52.6
93.4
2.0
7
Total
45.9
47.8
16.9
76.8
8.7
79.0
15.0
80.2
1.1
92.3
51.2
91.0
69.9
85.0
80.3
87.3
19.7
60
127

15.2 Page 142

▲back to top


A Concurrent Evaluation of Phase II of the NRHM BCC Campaign
Table 28.2: Messages recalled, aspects liked and difficulties encountered by men in
radio spot: Pragati talking to friends - Health Services
Particulars
(S= Spontaneous P= Prompted)
Messages
There has been so much improvement in the
health services in small village
People are getting together to think of solutions
for health problems of the villages- such a good
change!
Like RKSs in hospitals are getting together with
local people for development of health services
Funds have increased, new health centers are
coming up, better facilities, instruments, doctors,
nurses, increase in use of hospitals for delivery,
care of new born babies- Looking at all this today,
I feel proud to be an Indian!
National Rural Health Mission –because a healthy
nation starts with a healthy family- with you!
% learnt new things from the radio spot
Aspects liked in the radio spot
The message conveyed
Clarity of the message
Jingle tune/music
Presentation style
Overall
% encountered difficulties in understanding
Total N
High
focus
S 31.9
P 68.1
S 0.0
P 97.3
S 0.0
P 95.6
S 33.6
P 65.2
S 0.0
P 100.0
61.2
89.9
87.9
89.9
87.8
88.0
0.0
24
Other Rural Urban
states
68.6 33.7 82.0
19.9 60.1 18.0
34.4 8.5 28.1
29.1 84.6 30.1
21.3 0.0 32.0
28.3 84.4 25.6
5.0 27.5 7.6
44.6 57.8 54.7
18.7 0.0 28.1
30.9 85.3 37.0
26.2 54.2 28.1
74.6 91.9 61.5
62.5 85.4 56.8
69.2 89.0 61.3
74.6 91.9 56.7
74.6 91.9 57.2
14.2 6.6 3.2
16 29
11
Total
46.5
48.9
13.7
70.1
8.5
68.8
22.2
57.0
7.4
72.5
47.3
83.8
77.8
81.6
82.6
82.7
5.7
40
Table 28.3: Percentage distribution of women and men by intended action after listening to
the radio spot: Pragati talking to friends - Health Services
Intended actions
Women
% who intend to take action after listening the
radio spot
Total N
Men
% who intend to take action after listening to
radio spot
Total N
High Other Rural Urban Total
focus states
62.4
3.9 50.6 40.3 49.5
47
13
53
7
60
60.0
3.4 47.6
9.6 37.5
24
16
29
11
40
128

15.3 Page 143

▲back to top


15.4 Page 144

▲back to top


This report is made possible by the support of the American People through the
United States Agency for International Development (USAID). The contents of
this document are the sole responsibility of Emerging Markets Group Ltd. and do
not necessarily reflect the views of USAID or the United States Government.